
Abstract
In this work, the influences of stereolithography parameters (laser scanning speed, sliced layer thickness, laser spot compensation, etc.) and sintering schemes, consisting of sintering temperature, heating rate and holding time on the performance of green and final ceramic parts, have been investigated experimentally with the Taguchi method. In the stereolithography process, laser spot compensation was found to be the principal factor influencing the shrinkage of green samples. Optimum stereolithography parameters were obtained: hatch spacing 0.15 mm; laser scanning speed 1400 mm/s; sliced layer thickness 0.15 mm; and laser spot compensation 0.35 mm. A freeze-drying method was applied to minimize the drying shrinkage and avoid damages during the dehydration process of green samples. The optimum sintering scheme was also determined: heating rate 150 °C/h, sintering temperature 1200 °C and holding time 2 h. A bending strength of at least 10 MPa and open porosity of 35% were reached, making the ceramics adequate to produce investment casting molds.
Introduction
Possessing outstanding mechanical, thermal and electronic properties, ceramic components are of great importance to the applications in numerous industrial domains, including electronic field,1–3 biomedical area, 4 as well as manufacturing industry using casting molds.5,6 In most cases, conventional ceramic processing techniques are based on molds and tooling, which makes them costly and time-consuming to fabricate.
Over the last few decades, progress in several rapid prototyping (RP) techniques has been promoted to build advanced ceramic parts. Among them, stereolithography (SL) represents one of the most promising RP techniques for its high accuracy and significant flexibility for the production of small, complex-shaped components. However, the SL technique for fabricating ceramic parts is still at laboratory scale despite its significant success in conventional usage on resin materials.
The investigation of developing ceramic materials for SL use has been the focus of interest of many previous studies.7–10 These ceramic materials, which are mainly in a form of suspension containing ultraviolet (UV)-curable solution loaded with fine ceramic powders, are dealt with as traditional photo-curable resins. In the SL process, data of a three-dimensional (3D) part is input into a SL machine and sliced into many cross-sectional layers, and then is built in a bottom-up sequence by a laser beam. The only difference in the ceramic SL process compared with the resin SL process is the enwrapping of ceramic particles by the polymerized UV-curable content (which acts as binder) in the suspension upon the laser spot. Therefore, a net shape ceramic green part can be produced without using a specific mold, whereas by a resin SL process a pure polymer component is fabricated.
A volume of work has been conducted on the feasibility of the ceramic SL technique,11–12 on suspension processing and characterizations,13–15 and on the mechanism of interaction between laser and suspensions/ceramic powders.16–18 To the authors’ knowledge, no data is available for the parameters optimization during the whole SL-based fabrication process of ceramic parts including building, drying and sintering phases, despite the practical significance in improving mechanical and physical properties (density, strength and porosity, which are all crucial for the ceramic mold used in investment casting) as well as dimensional accuracy (shrinkage for electro-magnetic/biomedical applications) of final parts for their applications.
The current article presents research on the effect of the building process and after-treatments including drying and sintering on physical and mechanical properties, as well as dimensional accuracy of ceramic components fabricated by SL. SL operating parameters, including laser scanning speed, layer thickness setup, hatch spacing and laser spot compensation, were optimized by using the Taguchi method in order to achieve high dimensional accuracy. A freeze-drying method was employed to minimize the drying shrinkage and avoid sample damage. Parameters of the sintering process were also investigated and optimized with the same experimental and analytical method to achieve good mechanical and physical properties of the final ceramic parts. The present study provides researchers with useful information on the choice of SL operating parameters, as well as the method of drying and sintering to improve part properties when the SL technique is used to fabricate ceramic components.
Materials and methods
Ceramic suspension properties
In a previous study, 19 an aqueous-based silica suspension loaded with 50 vol% silica powders was produced. The measured viscosity of the suspension was less than 1000 MPa at a shear rate of 100 s−1 at room temperature. The raw silica powders (Hailong, China) were found to have a refractive index of 1.50, density of 2.65 g/cm3, mean particle size of 8 µm. The suspension mainly consisted of: a mixture of silicasol and glycerol (Kermal, China) as solvents; photocure-1173 (Hongtai, China) as photoinitiator; acrylamide (AM) and methylenebisacrylamide (MBAM) (Kermal, China) as monomers; and sodium polyacrylate (Jiangyan, China) as dispersant.
Fabrication of ceramic samples
Standard rectangular ceramic samples with the dimension of 60 × 10 × 6 mm were produced. The whole fabrication process, including SL, drying and sintering phases, is illustrated in Figure 1.
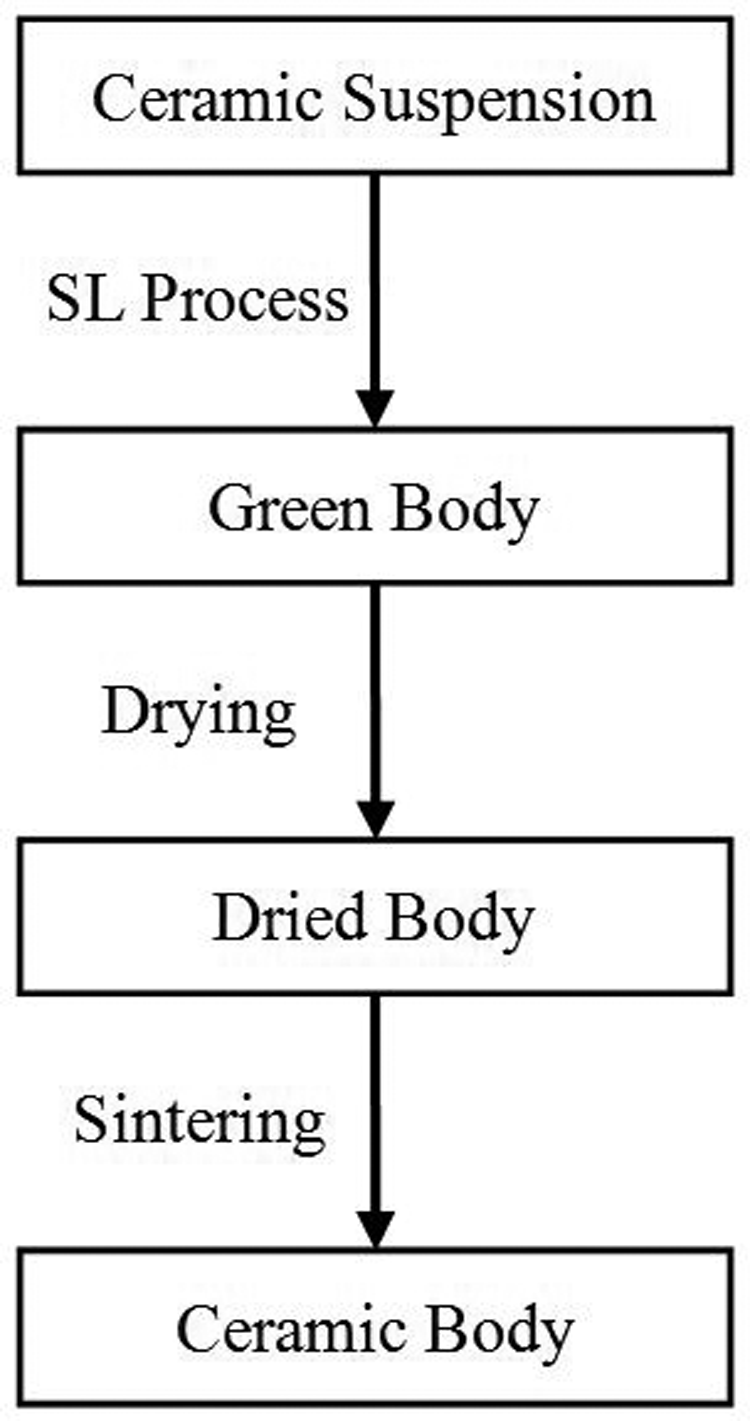
Flow-chart of the fabrication process for ceramic samples based on SL technique.
A SL machine, SPS450B, developed by the Institute of Advanced Manufacturing Technology of Xi’an Jiaotong University, was used to fabricate the ceramic green parts. The laser spot energy exposed on the suspension surface level was set to be a constant value of 270 mW, with a spot diameter of 140 µm. Owing to the inconvenience caused by the massive dimensions (60 l of volume) of the original vat in the machine, a much smaller interchangeable vat (about 9 l of volume) was designed and used to carry out the small sample experiments (Figure 2). Figure 3 demonstrates a set of three green ceramic samples fabricated in SPS450B.
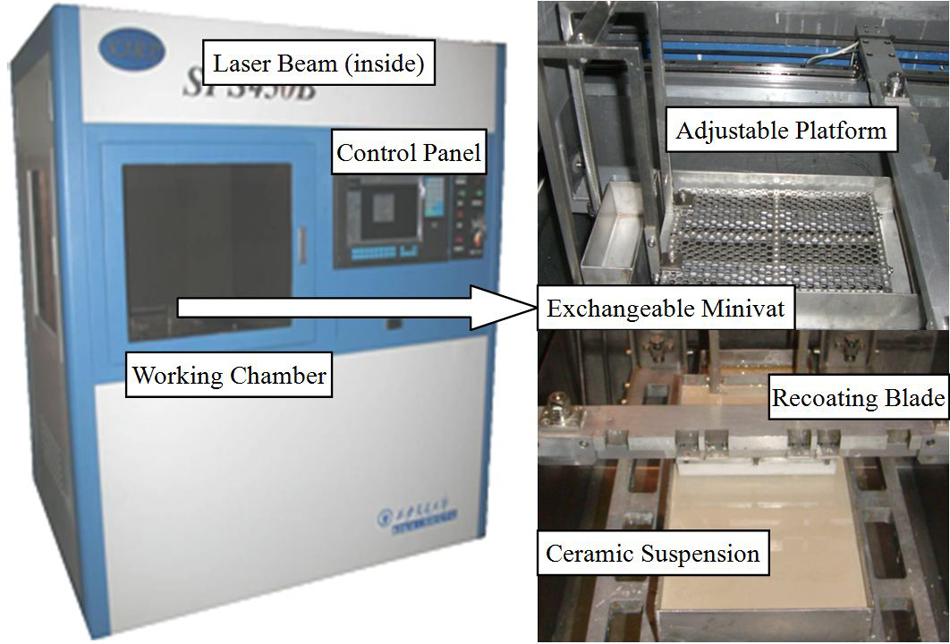
SPS450B SL machine with the smaller interchangeable vat.
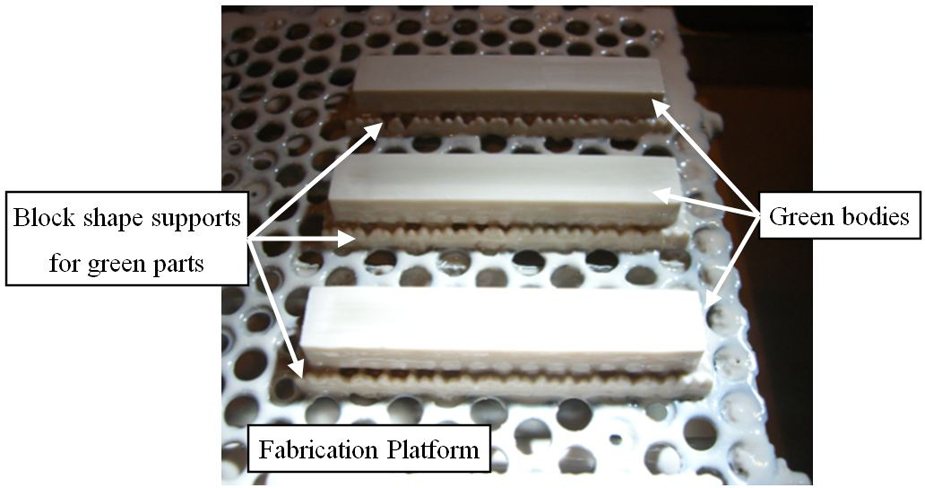
Demonstration of standard ceramic samples fabricated in SL apparatus SPS450B.
After the green bodies were fabricated, they were removed from the platform and rinsed with deionized water. The supports were also removed prior to the drying process. In order to minimize the shrinkage and prevent the deformation and cracks, a freeze-drying method was employed. The wet green bodies were put into the vacuum freeze dryer (DTY-1SL, Detianyou, China) to undergo a thorough dehydration. A high-temperature sintering furnace GLZ400/480 (Hefei Risine Heatek Co. Ltd, China), which could provide a high temperature of 1600 °C with good temperature homogeneity, was employed to fire the green ceramic bodies in the binder removal and sintering phase.
Sample characterization
The thermal gravimetric analysis (TGA) of the green bodies was performed in a thermogravimetric analyzer (NETZSCH STA 449C, Germany). The bending strength was measured in a computerized universal testing machine (Instron 1195, 5500R, USA) for green and sintered specimens with a three-point bending method. The porosity and density of the sintered samples were measured by Archimedes’ theorem. The microstructures of the fracture section, after the bending strength test, were observed under a scanning electron microscope (S3000N, Hitachi, Japan).
Experimental design with the Taguchi method
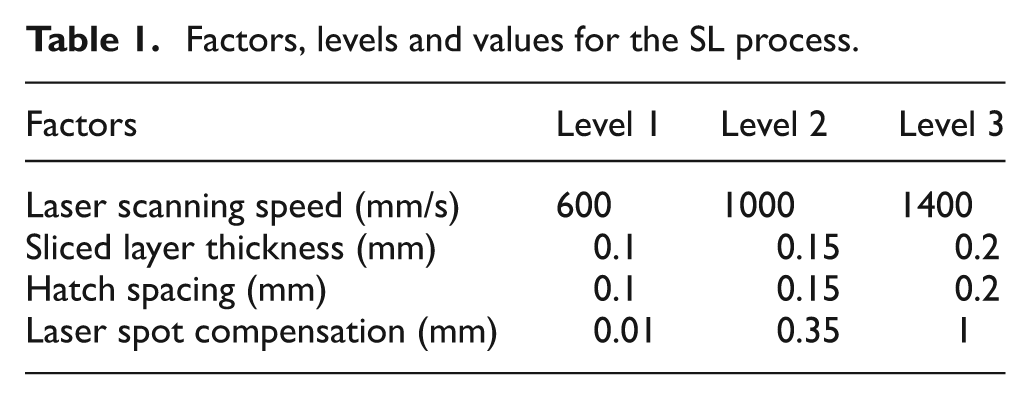
The main processes investigated in this work are SL and sintering that significantly influenced the mechanical and physical properties of ceramic parts. In the SL process, four operating parameters, including laser scanning speed, sliced layer thickness, hatch spacing and laser spot compensation, should be studied and optimized to obtain minimum shrinkage (dimensional change) compared with the original computer-aided design (CAD) models. These parameters are required to be predefined in the SL machine before executing the SL process. It is important to note that the need of the last parameter, laser spot compensation, is to compensate for the cured line exceeding the object’s desired border that is parallel to the fabrication platform, as shown in Figure 4. An adequate compensation may improve the fabrication accuracy. The three levels that were applied for each parameter are shown in Table 1. Their respective values have been derived from previous tests. 19
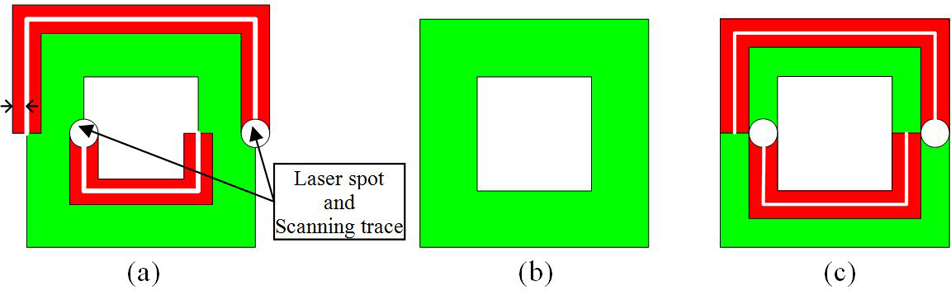
Demonstration of dimensional difference resulting from the set of laser spot compensation in the SL fabrication process (top view for one layer): (a) without laser spot compensation, (b) original CAD form, and (c) with laser spot compensation.
Factors, levels and values for the SL process.
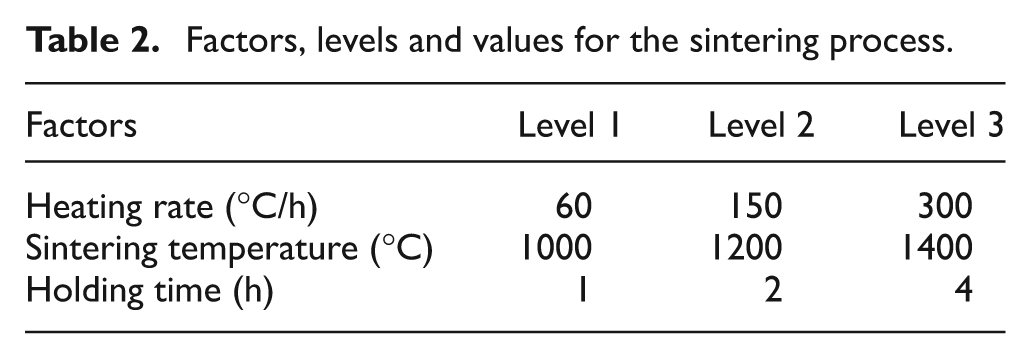
As for the sintering process, the three key factors are heating rate, sintering temperature and holding time, which would be crucial to the mechanical and physical behaviors (density, bending strength, porosity) as well as the dimensional accuracy (shrinkage) for the final ceramic parts. There are also three levels applied for each factor (Table 2) within the ranges, which are commonly used in the ceramic industry. These values need to be selected based on the analysis of the experiments. The sintering temperature of ceramics usually lies in the range between 0.7 and 0.9 of the ceramic melting point, according to the literature on ceramic sintering. Because the melting point of silica is 1713 °C, the sintering temperature might possibly lie in the range 1199–1541 °C. Considering the sintering process of silica core in investment casting, the levels of sintering temperature were set as 1000 °C, 1200 °C and 1400 °C. The holding time and heating rate were determined according to experimental practice of ceramic sintering. The levels of the holding time were supposed to be 1 h, 2 h and 4 h, and the levels of heating rate: 60 °C/h, 150 °C/h and 300 °C/h.
Factors, levels and values for the sintering process.
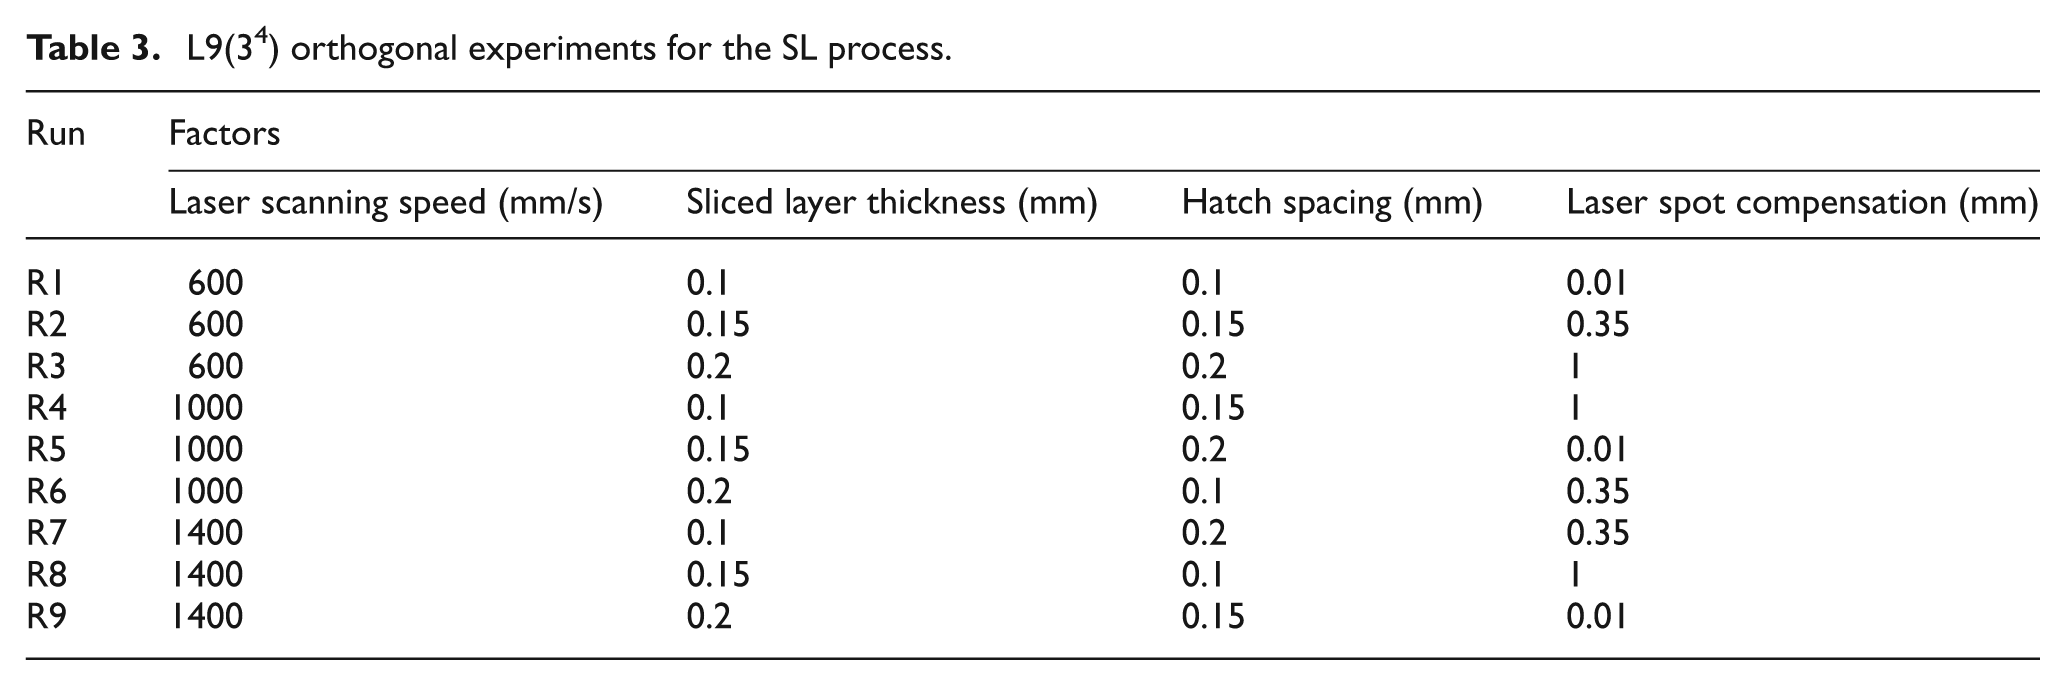
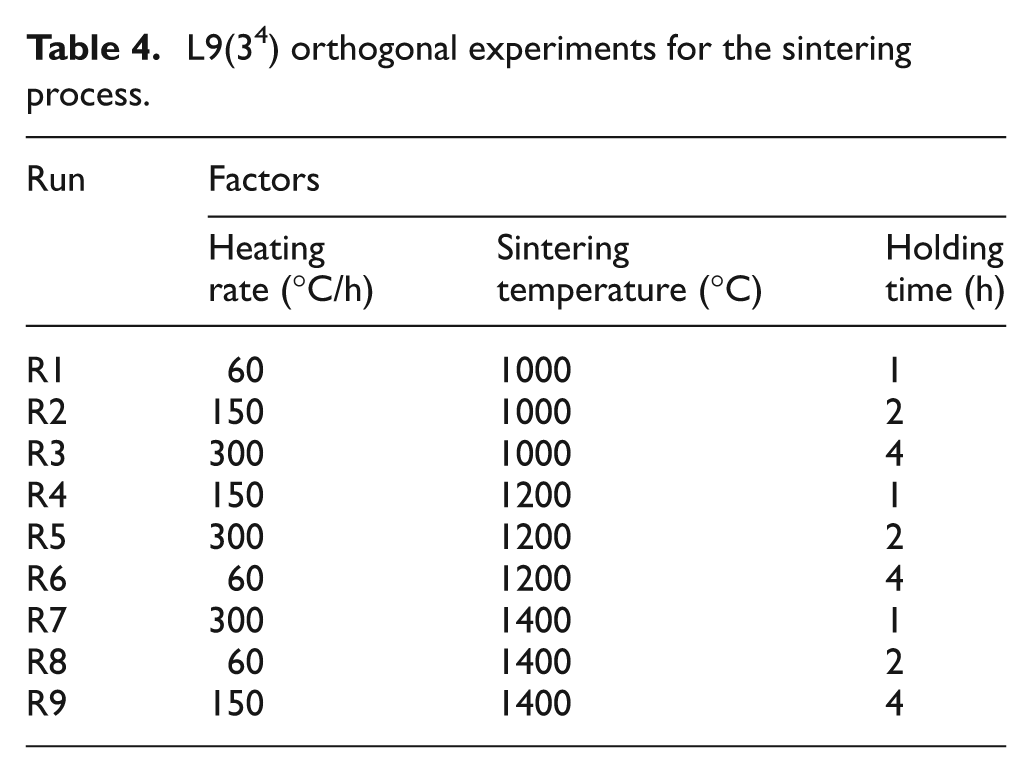
The widely used Taguchi fractional factorial design method was applied in the process optimization to verify the critical factors influencing the quality of samples fabricated by the SL building and sintering process. In this method, a 4 × 9 experimental array was adopted in the study by looking up the orthogonal table. As shown in Tables 3 and 4, there was one blank column being deleted in the L9(34) orthogonal array, because only three sintering factors were chosen for process optimization.
L9(34) orthogonal experiments for the SL process.
L9(34) orthogonal experiments for the sintering process.
Statistical analysis
The range analysis method was used to analyze and interpret the data. The significant and insignificant factors were found via the significance tests for each experiment and after comprehensive analysis, optimum levels of each factor were finally chosen as the working parameters for the SL and sintering process.
Results and discussion
The SL process
The extents of each factor involved in the experiment with the Taguchi method should be first predefined in SPS450B prior to the investigation of SL process. Then the influence of these factors on dimensional accuracy (i.e. shrinkage rate) of the green ceramic samples, compared with the original CAD models, was analyzed. It should be noticed here that, for the wet green ceramic bodies fabricated by SL, there was no need to test the mechanical properties. Only the measurement after the removal of water (drying) and organic binders (sintering) will make sense for the applications of final ceramic components.
Predefining of SL process parameters
The density of laser energy (E0) applied on the top surface of the suspension is a function of the laser power P (= 270 mW in this study), of the scanning speed v and the radius of laser spot w0 (= 70 µm in this study) on the surface of suspension7,20

The laser scanning speed v can be manually controlled in the SL process. The density of the laser energy is inversely proportional to the scanning speed, as can be found in equation (1). In the light of the previous findings obtained by Chen et al.19 concerning the relationship between the cured depth of a single layer Ld and the laser energy density E0, the result was that higher E0 (namely lower v) led to thicker Ld. It was also found that the inadequate scanning speed region was v > 1500 mm/s, which could hardly produce a cured depth of more than 200 µm. This value is indispensable for building a sound 3D ceramic part where delamination can be eliminated in the SL process. On the other hand, lower scanning speeds result in a time-consuming fabrication process. Therefore, it was necessary to balance the trade-off between high cured depth (low scanning speed) and short building time (high scanning speed). Accordingly, the appropriate levels of laser scanning speed were chosen as listed in Table 1. For the hatch spacing, which refers to the distance between two neighboring scanning lines, it was also found that the value should not exceed 0.2 mm, otherwise it can hardly ensure that the adjacent lines on the surface of the suspension could stick together to form a layer after scanning. Besides, 0.1 mm is the minimum value that could be defined in SPS450B. The sliced layer thickness is the depth of each descent of the platform into the suspension after the previous layer is finished. The adequate values of the levels for each factor are listed in Table 3.
Dimensional accuracy of green samples
The linear shrinkage between designed 3D models and SL green bodies, namely
Results of shrinkage in three directions of green ceramic samples compared with designed size of CAD models.
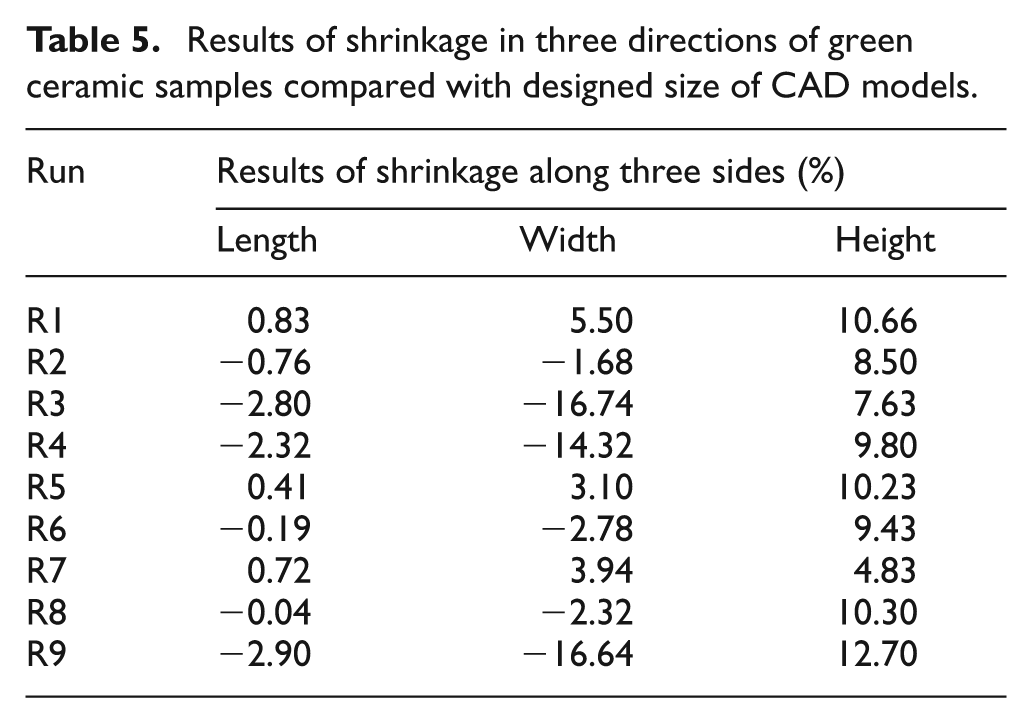
It can be seen in Figure 5 that the shrinkage percentage in height remains positive in all cases, which means all the green ceramic bodies shrank significantly in the z-direction towards the fabrication platform, compared with those in other directions. This phenomenon is probably owing to the feature of the SL process, which means the z-direction is the building direction that induces micro interspaces between adjacent layers and leads to accumulative shrinkage along the z-direction under the deadweight of green ceramic bodies. The negative value in the table means an increase in size compared with CAD model. This may be caused by the scattering of the laser light in the ceramic suspension, which has been discussed in the authors’ previous article. 19
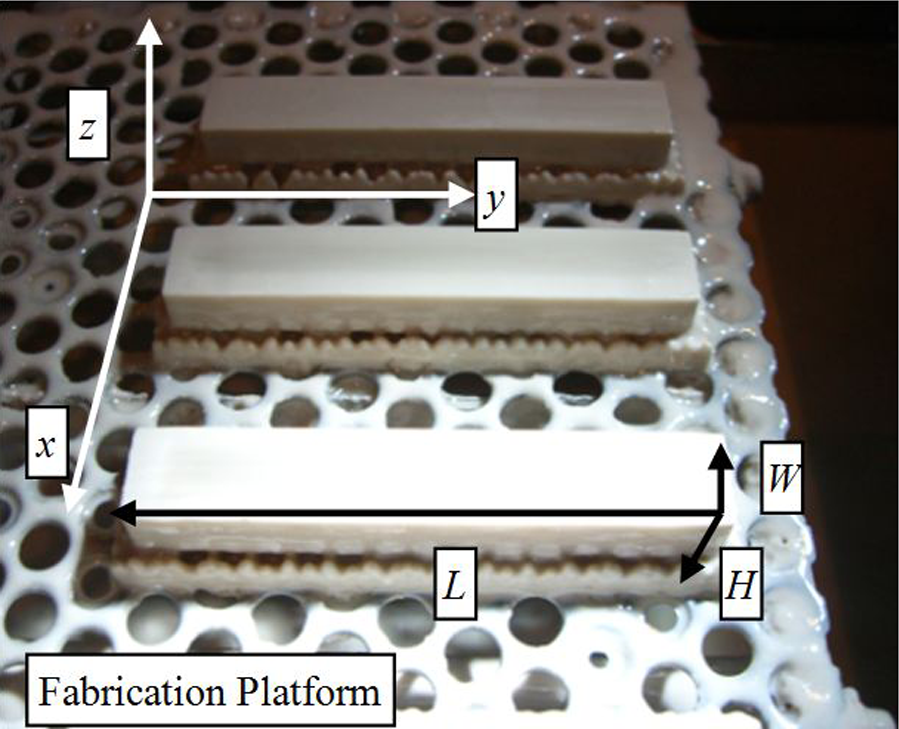
Schematic demonstration of relationships between directions of the platform and samples.
Significance evaluation and range analysis of each parameter in the SL process
The linear shrinkage results of SL experiments designed in Table 3 were analyzed using the direct analysis Taguchi’s Range Analysis method to find the optimum SL parameters combination. The average degree of influence on shrinkage for each factor is present in Figure 6. Then the ranges of their effects are shown in Figure 7.
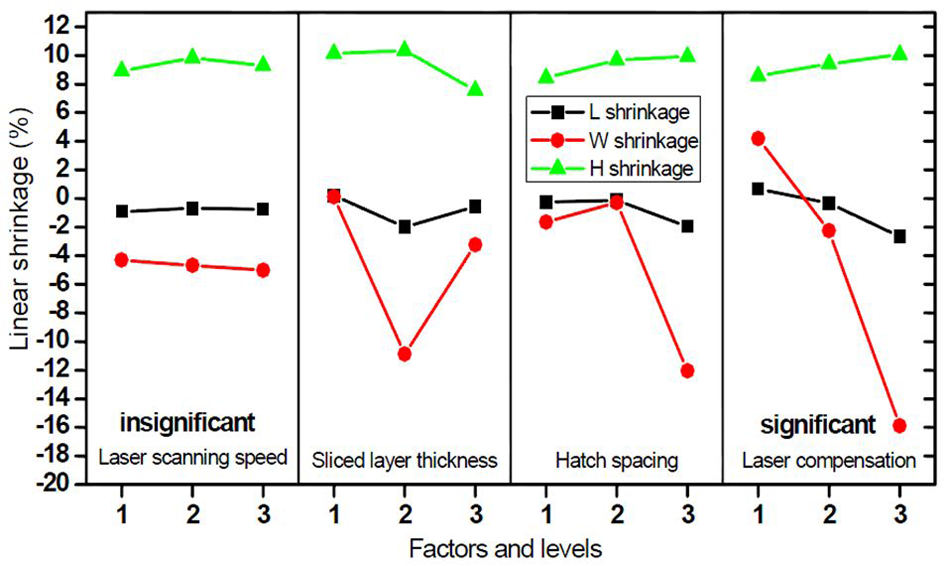
Average degree of influence on linear shrinkage (%) for each SL factor along each direction of the ceramic samples.
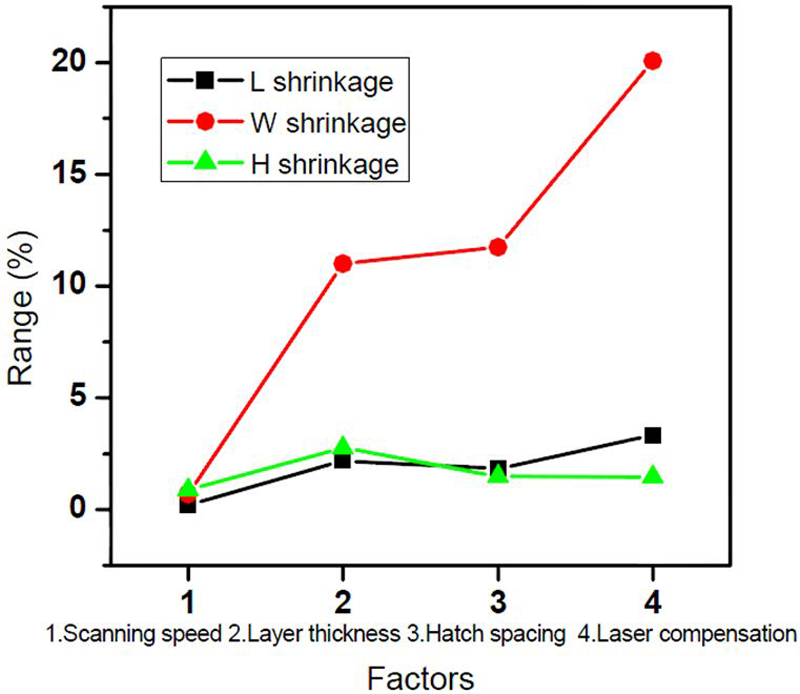
Range analysis of the degree of influence for SL factors on linear shrinkage (%) of green ceramic samples.
From Figure 6, it can be seen that the factor that has the least predominant influence upon the shrinkage along each side is the laser scanning speed, since the range resulted by this factor is much smaller than others (Figure 7). On the other hand, the laser spot compensation could remarkably impact the sample’s length and width. It is also reasonable that the sliced layer thickness greatly influences the sample’s height. According to the results, in order to obtain the minimum shrinkage in three dimensions, the appropriate combination of SL parameters could be selected as follows: sliced layer thickness 0.1 mm; hatch spacing 0.15 mm; and laser spot compensation 0.35 mm. As the laser scanning speed could hardly influence the dimensional accuracy, under this circumstance, the speed could be chosen as high as possible to increase the SL building efficiency. Therefore, it would be preferable to set the laser scanning speed to 1400 mm/s.
The freeze-drying process
The samples used for the sintering process were fabricated with the optimum SL process parameters combination determined above: laser scanning speed: 1400 mm/s (under the constant laser power of 270 mW); hatch spacing 0.15 mm; sliced layer thickness 0.15 mm; and laser spot compensation 0.35 mm.
After fabrication, the wet green ceramic bodies were put into the DTY-1SL vacuum freeze dryer for dehydration. In a conventional drying process, such as air-drying, oven-drying and liquid desiccant-drying, the loss of water would cause large shrinkage and structural damages like warping and cracks. However, shrinkage and damages were significantly reduced in the current study thanks to the application of the freeze-drying method.
The samples were put into the vacuum freeze drying machine and pre-frozen to −30 °C. Hence, the free-state form water inside the wet ceramic bodies would turn into ice and its temperature could stay under the eutectic point of the gel inside the ceramic green bodies. Then the chamber was pumped to reach high vacuum state (= 1 Pa). Then cycles of controlled heat were applied. This process caused frozen water to sublimate to a vapor without passing through a liquid stage. Therefore, this left voids inside the samples retaining original form and the structures were hardly altered. Table 6 shows the comparison of quality of four drying methods investigated in this study to dry the green ceramic samples.
Comparison of the drying quality of four drying methods applied in the study.
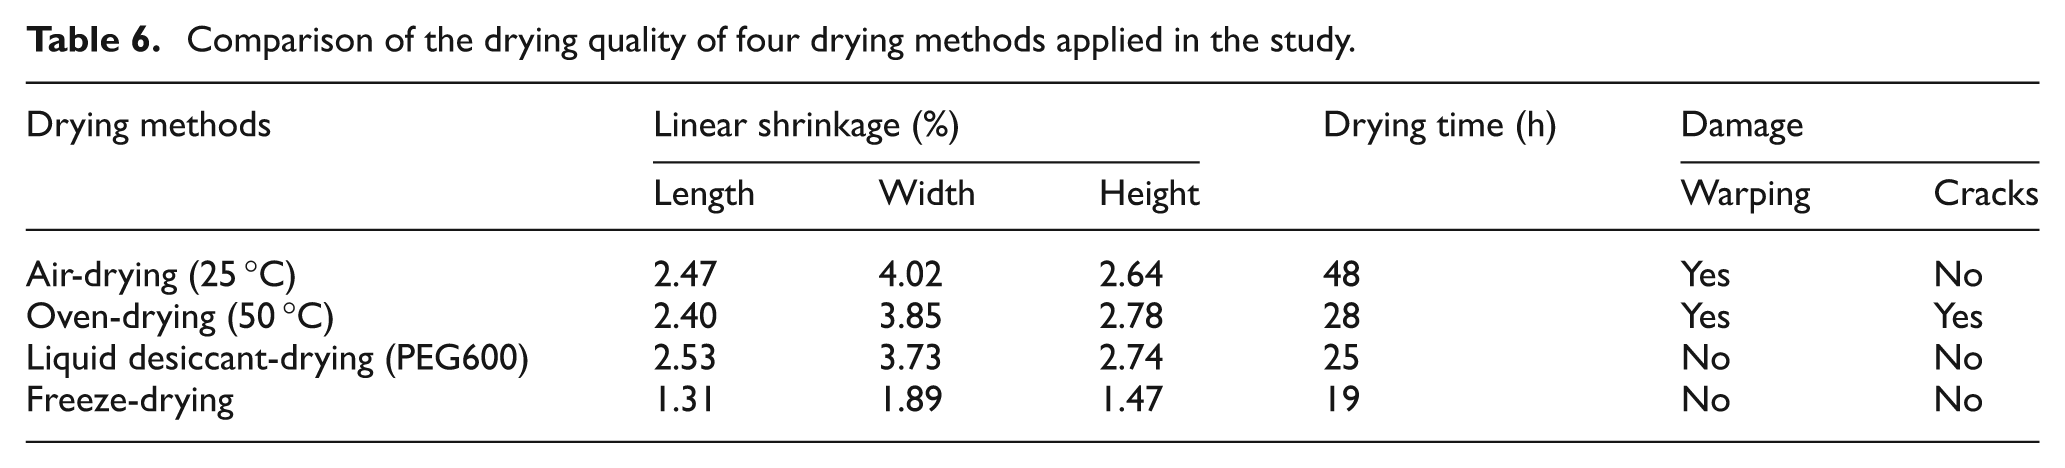
It can be clearly concluded from the Table that the freeze drying method is the most effective among the four drying methods. It allows the wet ceramic samples to dehydrate without defect and results in minimal shrinkage (significantly reduced by at least 50% compared with other methods).
The sintering process
After the freeze drying process was complete and the samples were thoroughly dehydrated, they were fired in the GLZ400/480 high-temperature sintering furnace according to the following TG/DSC results, as well as the previous experimental design using the Taguchi method previously mentioned.
TG/DSC results and sintering scheme
Figure 8 illustrates the thermogravimetric curve of the green ceramic sample. It shows that the mass of the ceramic sample decreased sharply from 200 °C to 600 °C. The total mass loss was about 17.64%, which mainly inferred that the organic binder inside the green ceramic bodies was almost completely pyrolyzed.
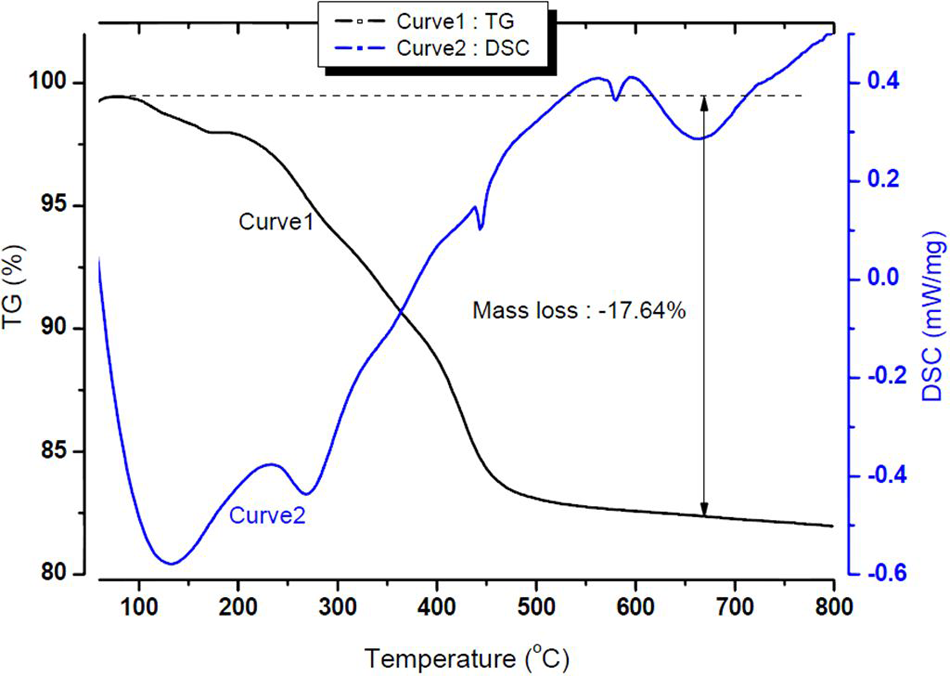
Thermogravimetric and differential scanning calorimeter analysis curve.
Figure 9 is the sintering process scheme made for referring to the sintering process of the ceramic samples. The sintering process consists of five phases.
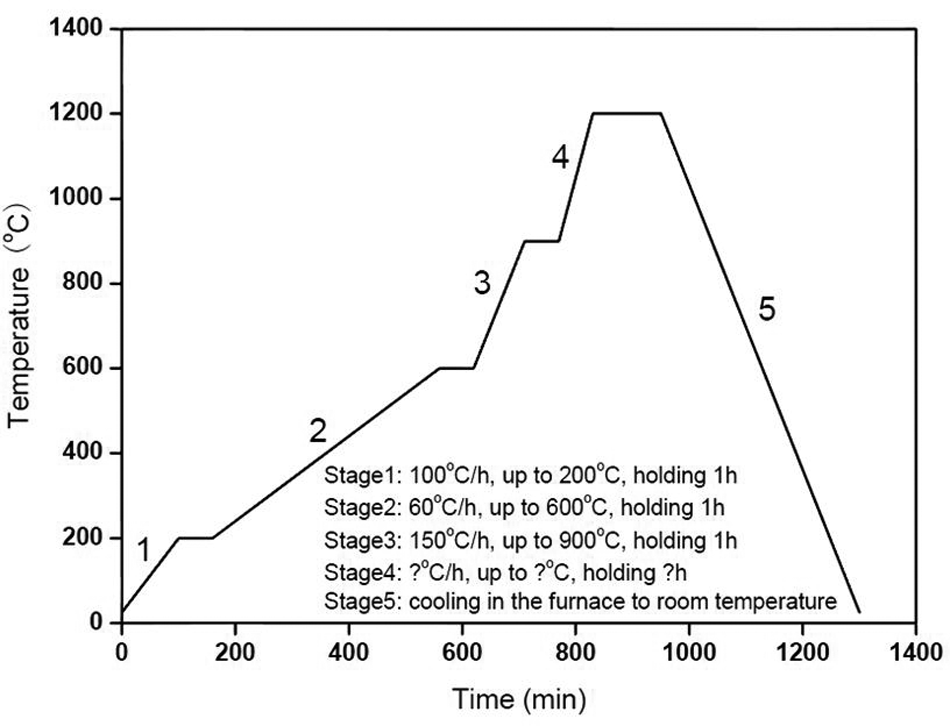
The proposed sintering process scheme.
Stage 1: preheating (room temperature–200 °C).
Stage 2: binder removal (200–600 °C).
Stage 3: presintering (600–900 °C).
Stage 4: post sintering (900–? °C).
Stage 5: cooling in the furnace to room temperature.
It was stage 4 that should be optimized with three factors, namely heating rate (°C/h), sintering temperature (°C) and holding time (h), as previously described.
Experiment results
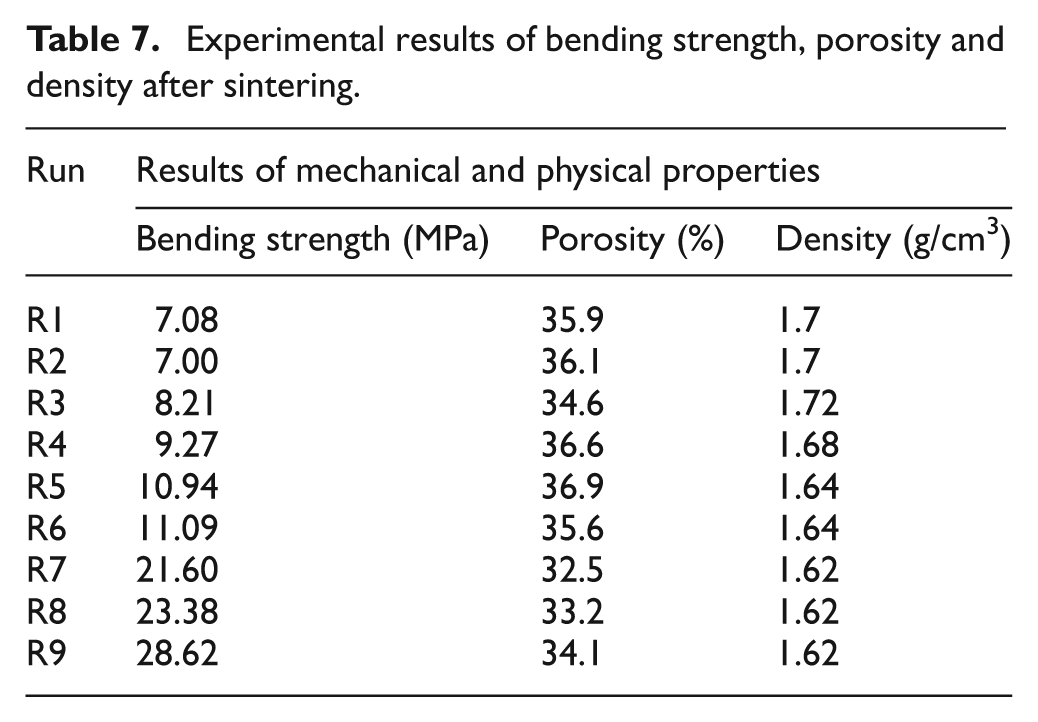
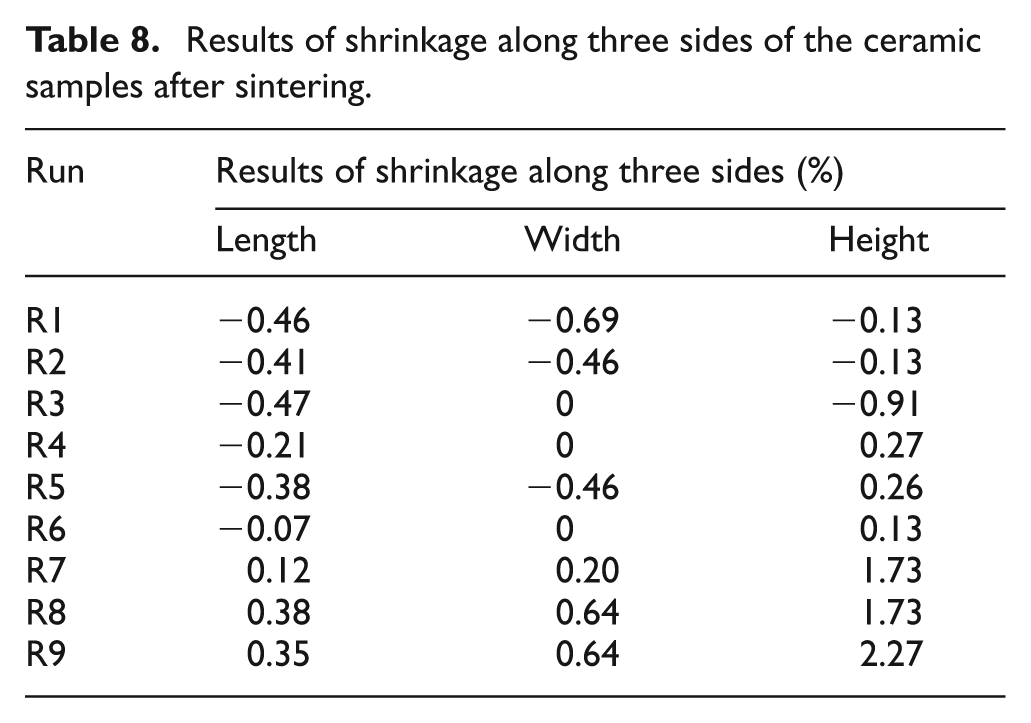
The results of the sintering experiments designed in Tables 3 and 4 were analyzed by direct analysis (range analysis). The results of nine experiments on bending strength, porosity, density and linear shrinkage along three sides are recorded in Tables 7 and 8, respectively.
Experimental results of bending strength, porosity and density after sintering.
Results of shrinkage along three sides of the ceramic samples after sintering.
Significance evaluation and range analysis of each parameter
The results (bending strength, open porosity, bulk density and linear shrinkage) of the experiments designed in Table 4 were analyzed with the Taguchi’s range analysis method to find the optimum parameters combination. Bending strength, open porosity, bulk density and linear shrinkage are considered as the key physical and mechanical properties of ceramic parts. The average degrees of influence on the above properties for each factor are present and the ranges of the effect of the three factors are given here.
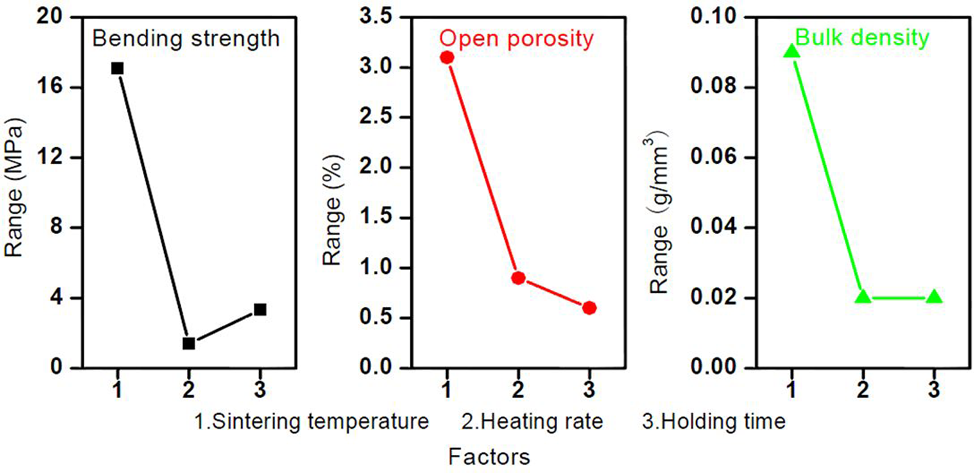
Figures 10 and 11 show that the range resulted from the sintering temperature is larger than that from the heating rate and holding time. It means the sintering temperature has much more significant influence on the bending strength of the ceramic samples than holding time and heating rate. It also can be seen that the bending strength increases with sintering temperature and holding time, respectively. The reason might be that, within a certain range, higher sintering temperature and longer holding time could lead to a sufficient amalgamation of ceramic particles in the bodies. For getting the largest value, level 3 should be chosen for the first factor, namely 1400 °C. With the same method, the optimum value for the heating rate is 150 °C/h and the holding time 4 h. The experimental results in Table 7 show that the largest value of bending strength could be obtained when sintering temperatures reach up to 1400 °C, holding time 4 h and heating rate 150 °C/h. The results show that the ninth experiment in Table 4 could obtain the largest bending strength, and Table 7 confirms the analysis.
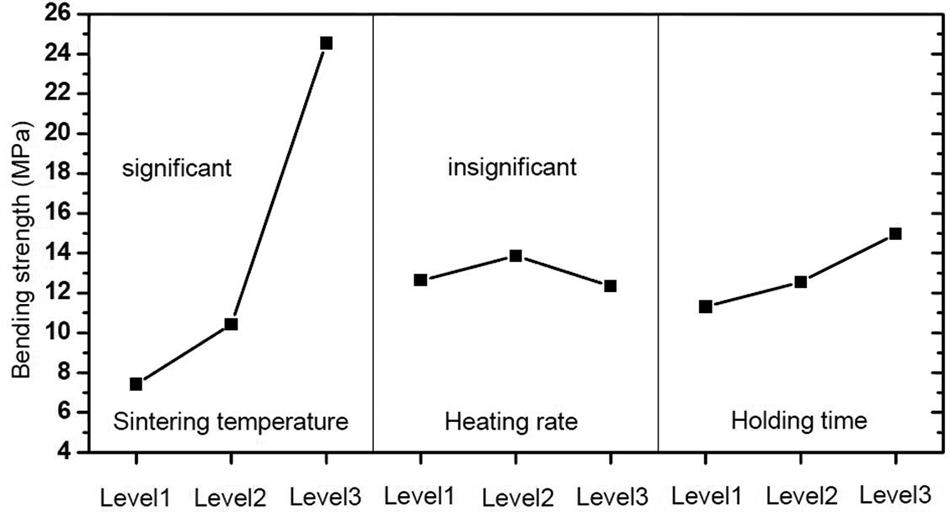
Average degree of influence on bending strength (MPa) of the ceramic samples for each factor.
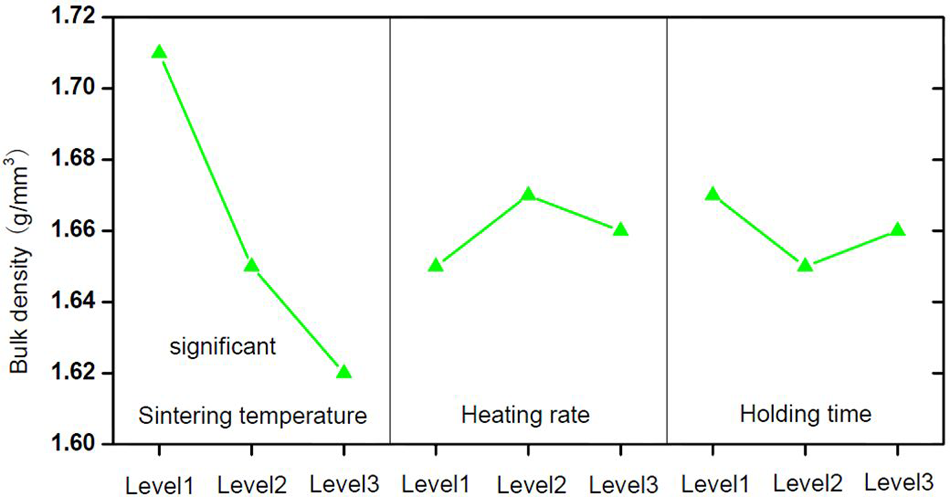
Average degree of influence on the bulk density(g/mm3) of the ceramic samples for each factor.
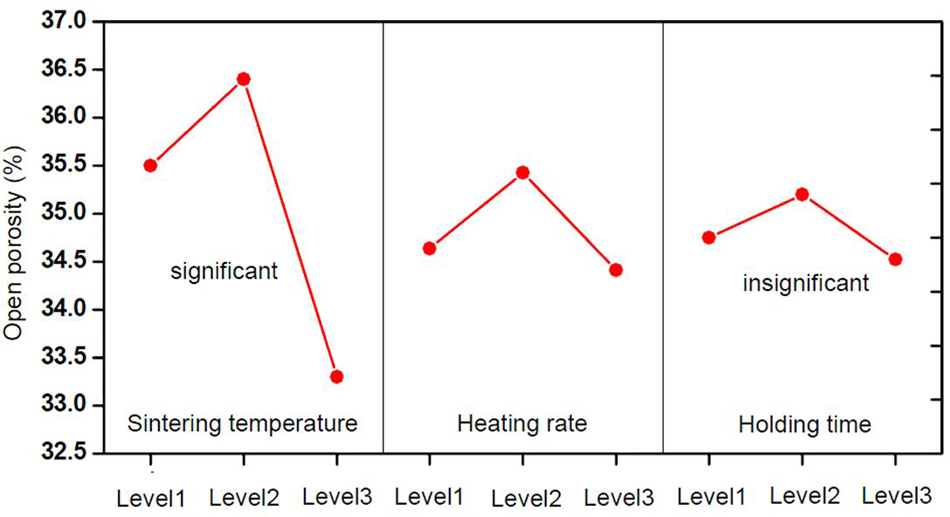
Figure 12 displays the experimental results of open porosity, which shows the same general features as those described for bending strength: sintering temperature has more influence on open porosity than the heating rate and holding time and the heating rate has the lowest impact. From Figure 10 it could be obviously noticed that levels 2 of each factor could result in the largest open porosity. Therefore, the optimum parameter combination could be 1200 °C, 150 °C/h, 2 h, on condition of considering the largest porosity.
Range analysis of sintering factors’ effect on the bending strength, open porosity and bulk density of the ceramic samples.
Figure 13 reveals that sintering temperature is also a more influencing factor on the bulk density of the ceramic samples than heating rate and holding time. Using the same way, the optimum parameter combination is 1000 °C, 150 °C/h, 1 h, when the largest bulk density could be obtained.
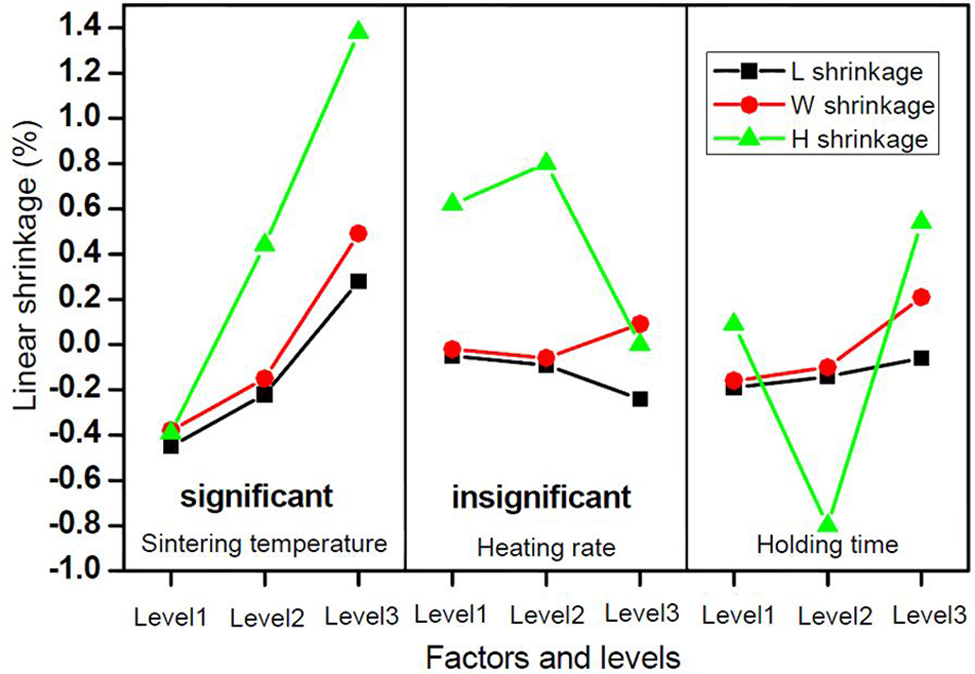
Average degree of influence for each factor on the shrinkage (%) of the sintered ceramic parts.
The average degree of influence for the three factors on the shrinkage in three directions of sintered ceramic parts is plotted in Figure 14. It can be concluded from the figure that the sintering temperature has a predominant influence on shrinkage. In contrast, the heating rate and holding time have less impact on shrinkage. This result stays the same with that of the other properties outlined above. Accordingly the sintering temperature could significantly influence the physical and mechanical properties of sintered samples. The shrinkage has a rapid increase from negative to positive with the raise of the sintering temperature from 1000 °C to 1400 °C. Moreover, the shrinkage in height is always larger than the other two directions. It also can be seen from Figure 14 that the fluctuation in shrinkage variation of height is greater than that of length and width. This is because the height direction is the additive layer-by-layer fabrication direction, which could result in greater accumulating measure errors compared with other directions.
Range analysis of sintering factors’ effect on the bending strength, open porosity and bulk density of the ceramic samples.
Figure 15 describes the factorial ranges on shrinkage. It clearly demonstrates the degree of significance for each factor. As explained previously, the first factor, namely the sintering temperature, has larger ranges of effect on shrinkage along all the three sides. It is shown in Figure 15 that all the three factors have more significant influence on the shrinkage in height than other sides.
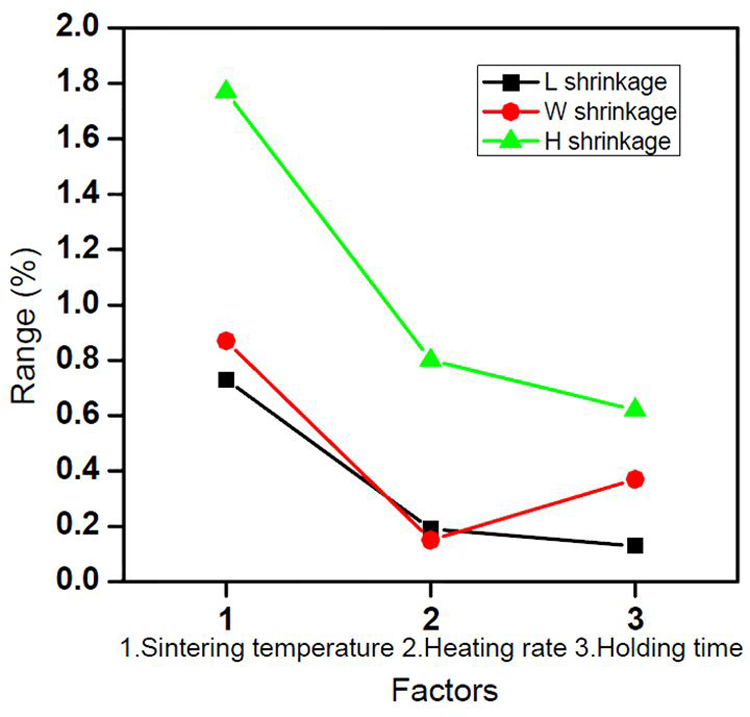
Range analysis of the degree of influence of the three factors on the shrinkage (%) of the sintered ceramic parts.
Selection of optimum sintering parameters
In order to determine an optimum combination of levels for three sintering factors with which the smallest shrinkage could be reached, the analysis was carried out as follows.
Combination for getting the smallest shrinkage in length: sintering temperature, level 2; heating rate, level 1; holding time, level 3;
Combination for getting a smaller shrinkage in width: sintering temperature, level 2; heating rate, level 1; holding time, level 3;
Combination for getting a smaller shrinkage in height: sintering temperature, level 1; heating rate, level 3; holding time, level 1.
On the other hand, the holding time is the most insignificant factor among the three factors. Therefore, its influence could be neglected and level 2 of the factor (2 h) could be chosen for the sintering scheme. From Figure 14, it can be seen that there is not much difference in the effect on shrinkage for the level 1 and level 2 heating rate. So 60 °C/h and 150 °C/h could both be preferable for the heating rate. For sintering temperature, 1200 °C could result in a smaller shrinkage (close to 0%) for all the three sides.
According to all the experimental results with the Taguchi method, with comprehensive consideration of the above analytical results, and reference to the performance of the ceramic samples, the optimum sintering process, namely Stage 4, could be depicted as this: heating rate of 150 °C/h, sintering temperature at 1200 °C, holding time for 2 h.
The microstructure of the fracture surface of a dried ceramic sample after bending test is illustrated in Figure 16. No obvious delamination and cracking can be detected, which means a homogeneous distribution of the structural properties for the sample can be obtained. Some complex ceramic green parts have been built (Figure 17) with success by using the parameters determined in the above experiments and analyses.
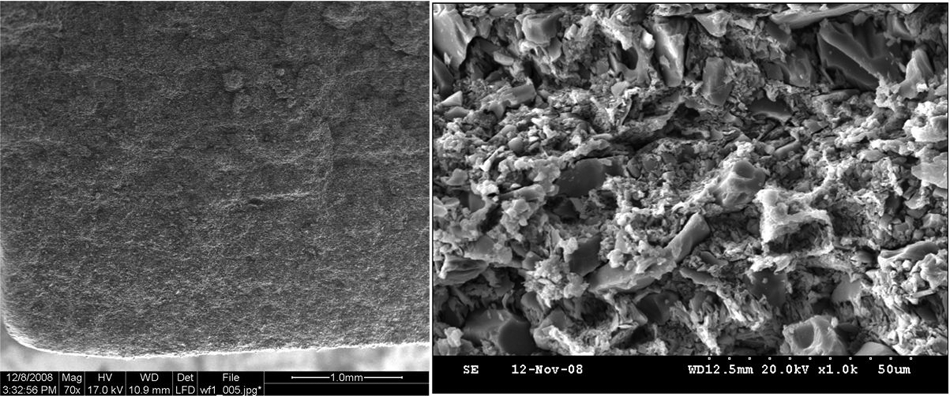
Scanning electronic microscope pictures of the fracture of a dried ceramic part after bending test.
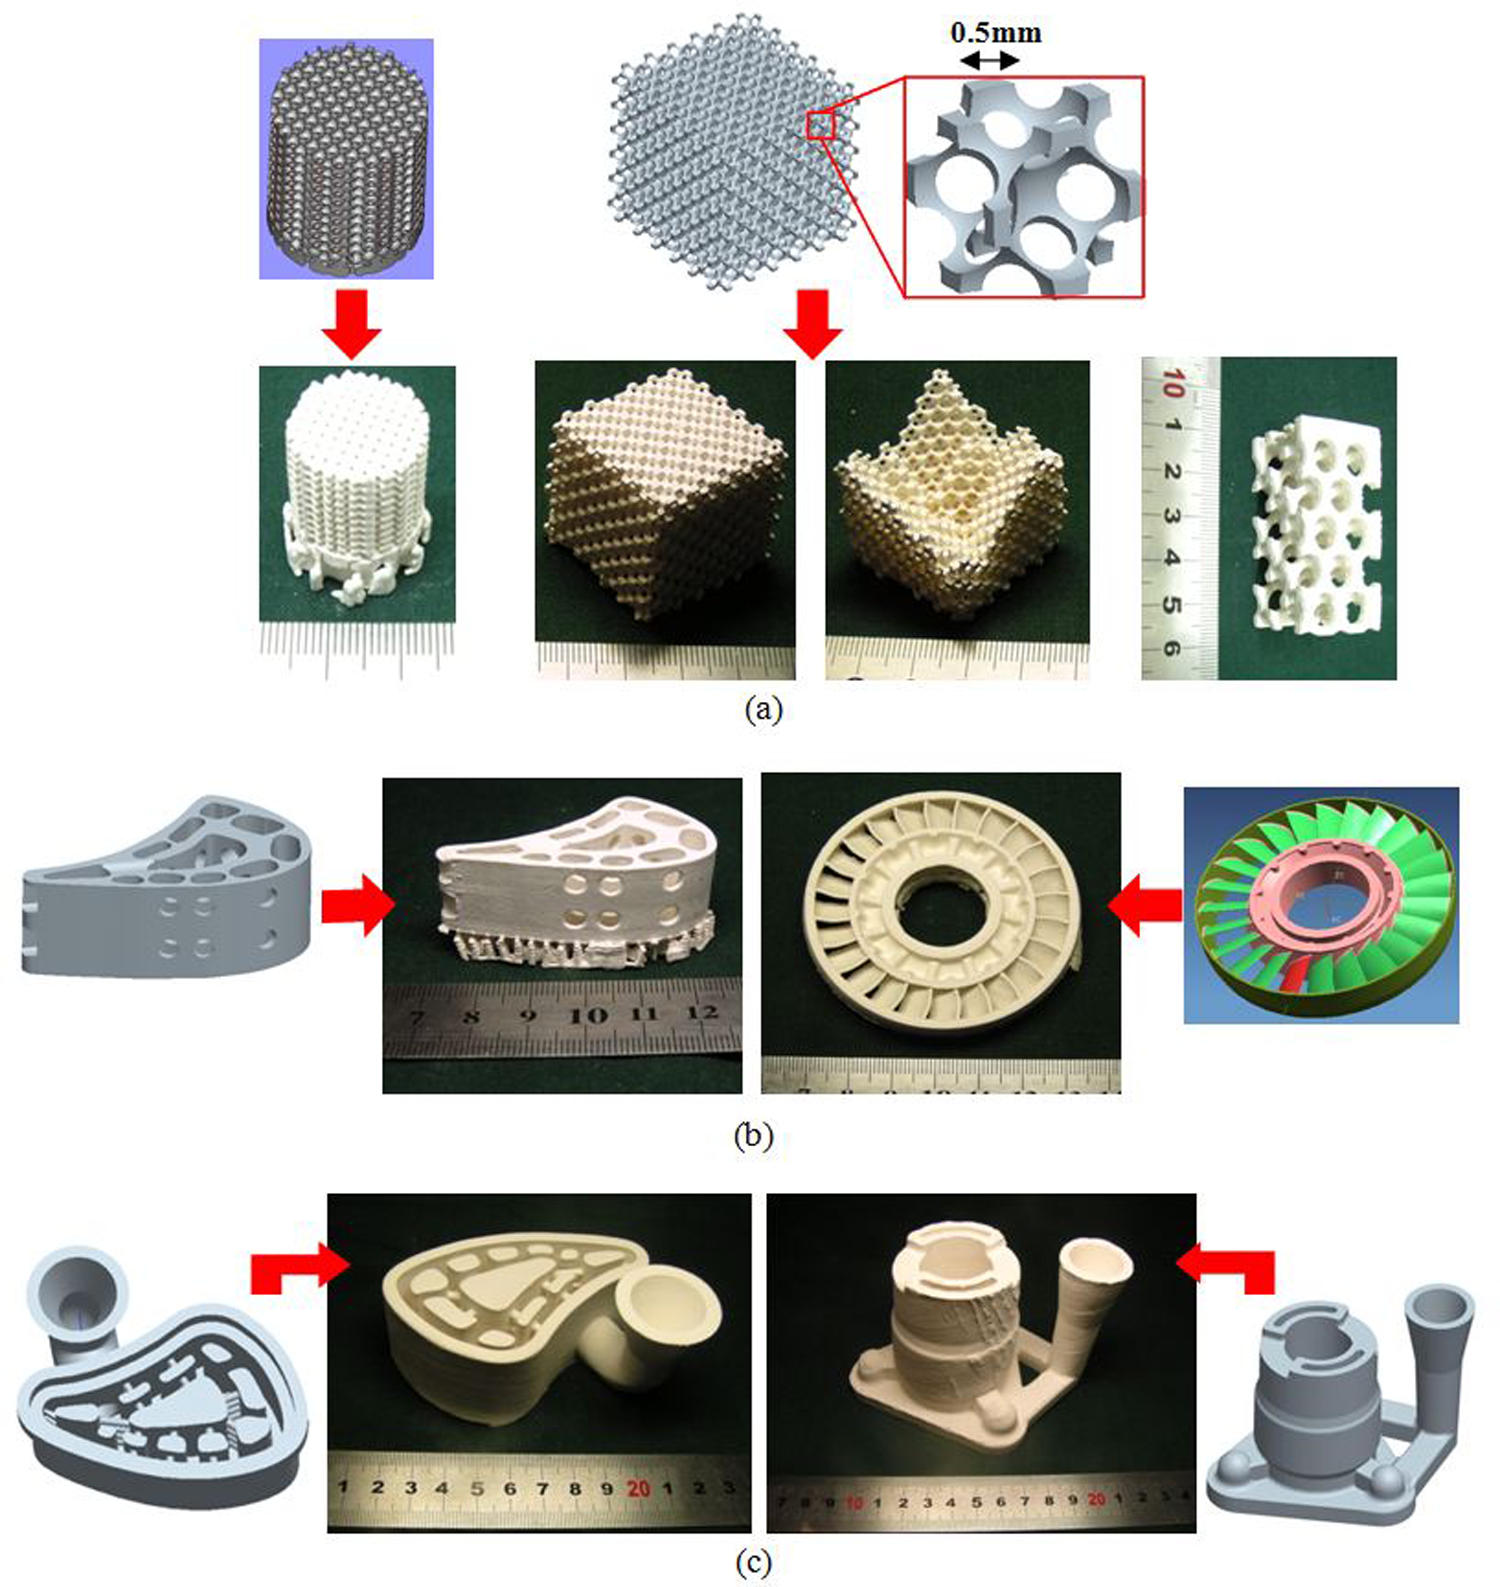
Green ceramic samples fabricated using SL: (a) porous functional devices; (b) structural parts; and (c) casting molds.
Conclusions
Standard ceramic testing samples were fabricated based on the SL technique to investigate the influence of the SL process operating parameters (laser scanning speed, hatch spacing, sliced layer thickness and laser spot compensation) and the sintering scheme consisting of sintering temperature, heating rate, and holding time on the dimensional accuracy (linear shrinkage) and mechanical and physical properties, respectively. It is found in the study that laser scanning speed and hatch spacing have quite different influences on the shrinkage behaviors of green ceramic bodies after the SL building process. The larger hatch spacing leads to a higher shrinkage percentage. It is interesting that the shrinkage of ceramic bodies along the z-direction (namely the building direction) is significant. And there is no such crucial influence for the laser scanning speed upon shrinkage. The optimum SL process parameters have been found, hatch spacing 0.15 mm; laser scanning speed 1400 mm/s (under the constant laser power of 270 mW); sliced layer thickness 0.15 mm and laser spot compensation 0.35 mm. The freeze drying method was used in the study to ensure minimal shrinkage and to avoid damage during the dehydration process. The appropriate sintering scheme was determined according to the experiment results, among which the most influencing factor considered is sintering temperature. The mechanical and physical properties of the ceramic bodies have little dependence on heating rate and holding time. The optimum sintering parameters have been chosen to be: 1200 °C for sintering temperature, 150 °C/h for heating rate and 2 h for holding time. The bending strength obtained in this study could exceed 10 MPa, which is adequate for the application as an investment casting mold. Furthermore, the open porosity could be maintained at around 35%, which also well meets the requirements in investment casting. Finally, several ceramic components have been fabricated with the optimum parameters chosen in this work to validate the state of art.
Footnotes
Funding
The work is supported by the grant of the National Natural Science Foundation China (No. 50835007) and Program for Changjiang Scholars and Innovative Research Team in University (IRT0646).