
Abstract
The submerged arc weldment cross section shape profiles indicate the macrostructure zones’ boundaries of both the base metal and weld that are affected by the weld thermal cycle. These macrostructure zones are broadly designated as the weld reinforcement, penetration and heat affected zones. The present investigation is aimed at predicting the shape profiles and characteristics of the submerged arc weldment zones based on statistical analysis. A full factorial design matrix was used for the submerged arc weldment butt-bead-on plate welds to study the effects of welding input variables. The outputs from the welding, such as the weld macrostructure characteristics, were mathematically modelled with respect to the input process variables. The interaction effects of the welding input process variables on the responses were also investigated. Based on the weldment characteristics, including that of the bead contact angle, a mapping technique was developed for the graphical representation of the macrostructure zones’ shape profiles. The modelling approach adopted in the present investigation can be used to predict the fusion and heat affected zone shape profiles of submerged arc-based repair welds and claddings.
Keywords
Introduction
The submerged arc welding (SAW) process is widely used in industry for joining thick plates and pipes owing to the better weld quality and high weld metal deposition rate. The SAW process is also used for heavy section repair welding and cladding. The SAW cross-section profile is dependent on the welding process parameters. Appropriate selection of SAW process parameter results in a sound and good quality weld.1–2 In the SAW process, the arc length and spread is difficult to observe as it is covered with flux granules during the welding. Hence, the numerical modelling of SAW arc and its effects on weldment is difficult. The weldment characteristics of SAW, such as the weld reinforcement shape, penetration depth and heat affected zone (HAZ) boundaries, are also important for validating the results of various numerical thermal models. 3 The numerical prediction of SAW shape profiles is computationally demanding and might not be suitable for a widely varying range of process variables. Hence, researchers have tried to predict the SAW, and other fusion weldment characteristics, using statistical and soft computing methods. Using statistical modelling, such as regression analysis and response surface design methodology, investigators have resorted to prediction of weldment characteristics based on the experimental data.
Tsai et al. 4 had used artificial neural networks (ANN) for the prediction of SAW performance, such as deposition rate, hardness and dilution rate. Dupont and Marder 5 had investigated the dilution of single pass arc welds using plasma arc welding (PAW), gas tungsten arc welding (GTAW), gas metal arc welding (GMAW), and SAW processes. They had used the arc melting efficiency of the processes and energy balance equations to develop the expressions for calculating the weld dilution as a function of welding variables, thermophysical properties of the filler and the base material. The graphical representation of the weldment shape profiles and interaction effects of the process variables for a broad range was not considered in their work. 5 Gunaraj and Murugan 6 had used response surface methodology for a detailed study on weld bead quality in SAW pipe welds. Soft computing methods like ANN have also been used by prominent investigators for analysing the weld bead geometry and characteristics prediction. Lee and Um 7 had predicted the back bead of gas metal arc welds using multiple regression analysis and ANN. Nagesh and Datta 8 had used ANN for predicting the weld bead height and penetration depth in shielded metal arc welding. The complete graphical representation of the weldment was not attempted in their work. Kim et al. 9 had used artificial intelligence techniques to model the bead geometry of arc welds. However, the angle of contact and the shape of the HAZ profile were not discussed in their work. Dhas and Kumanan 10 had determined the bead width of SAW using an adaptive neural fuzzy inference systems. Lee et al. 11 modelled the SAW process variables to predict the size of the HAZ. It was suggested in their work that the size of the SAW HAZ could be related to the plate melting efficiency. Accordingly, mathematical equations were developed to model the process.
In recent investigations, uses of statistical methods, like multiple regression techniques for weld bead characteristics modelling, have also been noted. Nouri et al. 12 used full factorial design experiments to understand the effect of pulsed GMAW variables on dilution and weld bead geometrical features of cladding. The interaction effects of the process variables were also reported in their work. However, the shape of the HAZ and complete graphical presentation of the weldment shape profile was not considered. Global and cluster regression analyses were compared to model the metal inert gas welding responses by few researchers. 13 Karaoglu and Secgin 14 did a sensitivity analysis of SAW process variables using multiple curvilinear regression modelling. The bead height, width and penetration depths were predicted in their work. The bead contact angle, dilution rate and shape of the HAZ was not considered in the study. Siva et al. 15 used multiple regression techniques to model the weld bead variables of nickel-based overlay plasma transferred arc surface deposits. Kannan and Yoganandh 16 also investigated the effect of process variables on steel cladding based on multiple regression analysis. Biswas and Mandal 17 predicted residual deformation and temperature profiles of C–Mn steel plates joined by the SAW process using three-dimensional (3D) finite element modelling. To accurately predict the effect of weld thermal cycles on residual deformations, the SAW bead geometry shape profiles were incorporated in their finite element models. The weld is affected by the thermal and structural effect of welding and the constraints. The role of fixture in constraining the welded joint was investigated and modelled using finite element methods by Sikström et al. 18 A combined heat source model for laser and pulsed gas metal arc hybrid welding was developed by Xu et al. 19 and utilized in the numerical modelling for predicting the weld temperature fields and cross-sectional zones. The SAW process parameters and type of flux also affects the micro-hardness and microstructure of HAZs. In an investigation, Kumar et al. 20 investigated the effects of SAW parameters and flux on the microstructures of the HAZ by using Taguchi’s experimental methods.
Most of the research work related to arc weldment characteristics involves prediction of maximum reinforcement height, width and penetration. Rarely a complete prediction of weldment shape profile, including that of the HAZ, is observed in the contemporary open literature. Instigated by the review of literature, the suitability of regression analysis and design of experiments for modelling the complete SAW bead geometric characteristics was realized. Moreover, an appropriate mapping technique for the graphical representation of the SAW weldment shape profile was also desired for the online presentation.
The present investigation deals with the prediction of a SAW shape profile using a processing window of input process parameters within which an acceptable weld could be produced. Mathematical models were developed for predicting the effects of process parameters on the weldment characteristics, like bead width, bead height, depth of penetration, depth of HAZ and width of HAZ. The weld dilution rate and bead contact angles were also predicted from the model. The weldment shape profiles were graphically modelled considering the mentioned characteristics and bead contact angle. The mathematical relations of SAW process variables with responses were derived by using multiple regression analysis. The interaction effects of process variables were also investigated. Test cases were studied for checking the adequacy of the model for predicting the weldment characteristics and shape profiles.
Experimental details
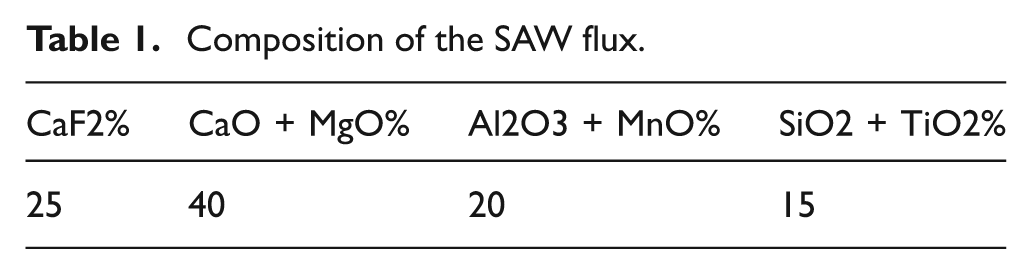
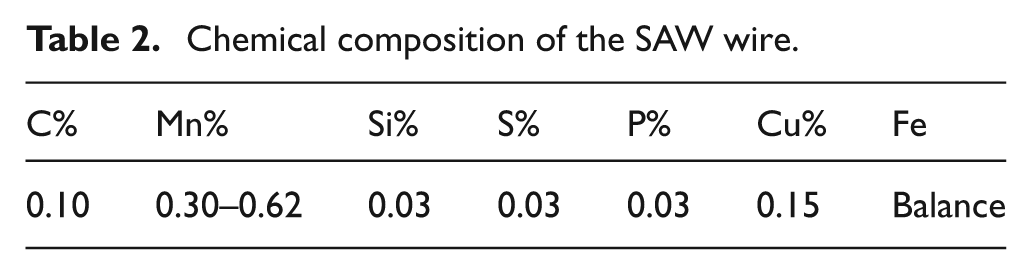
A constant current submerged arc welding power source (Tornado SAW M-800/1000/1250) and FD 1X-200TZ Welding Tractor of Ador Frontech was used in the experiment. 21 The SAW setup for the experiment is shown in Figure 1 and the experiments were conducted in a flat position. For the experiments a copper-coated electrode (AWS: EH-14, Grade C) of 4 mm diameter and basic-fluoride-type granular flux was used. The composition of the SAW flux and the electrode are given in Tables 1 and 2, respectively (Table 1 shows composition of flux, Table 2 of electrode). The input parameters of welding were selected based on the trial experiment runs and levels of the process parameters were set. The trial experiment runs were conducted to select the range of input variables that resulted in acceptable welds, without observable defects, like slag inclusion, undercutting and porosity.
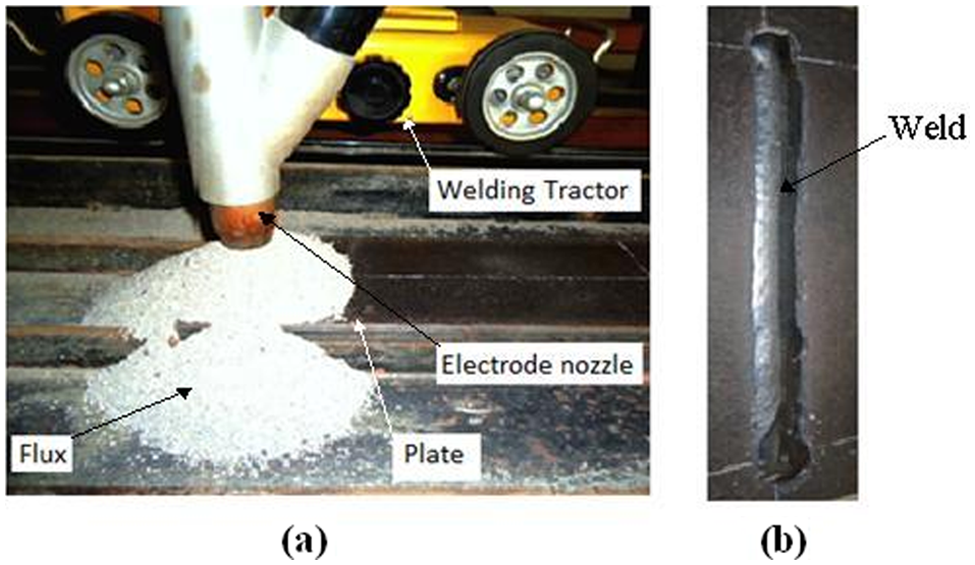
(a) The SAW setup for the experiment; (b) the butt-bead-on plate.
Composition of the SAW flux.
Chemical composition of the SAW wire.
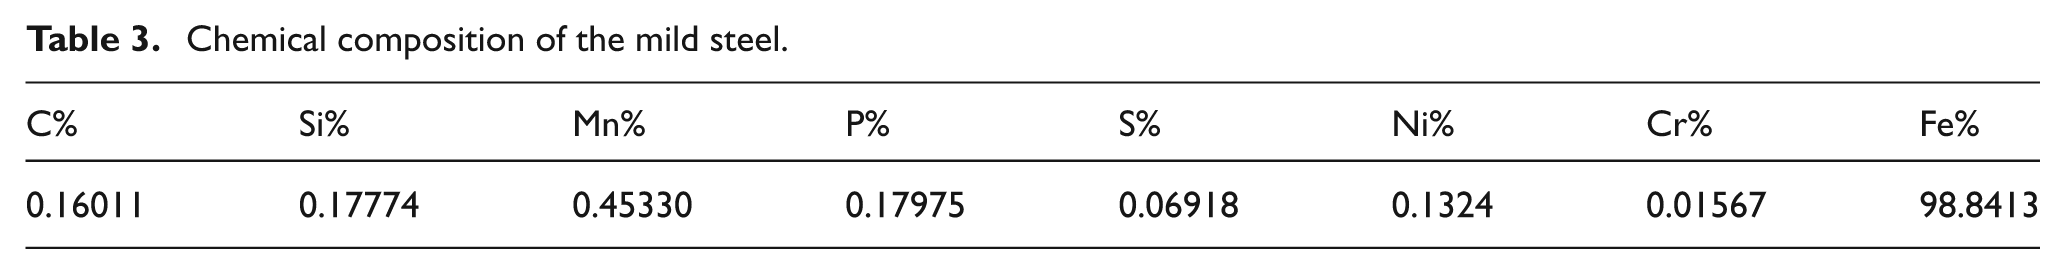
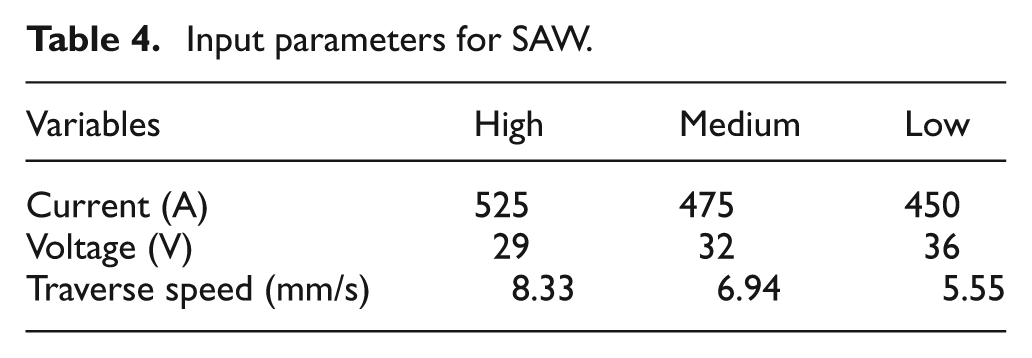
Proper selection of welding voltage, current, wire feed rate, welding speed and electrode stick-out length plays an important part in controlling the weld quality.22–23 The 27 test experiments of butt-bead-on plates were conducted to obtain test data for mathematical modelling. The length, width and thickness of mild steel plates used in the experiments were 300, 100, and 12 mm, respectively. The composition of the steel plate is given in Table 3. The welding process variables chosen for the experiment are given in Table 4. Three input process variables, such as welding current, voltage and traverse speed were used at three levels, as shown in the Table 4. The electrode was set perpendicular to the plate. The stick-out length of the electrode was maintained at 25 mm for all 27 experiments. The SAW weld-bead-on plate is shown in Figure 1. The weld samples were prepared for the observation by polishing and etching by nital solution (5–10%, nitric acid with water). The bead geometries were then measured as indicated in Figures 2 and 3.
Chemical composition of the mild steel.
Input parameters for SAW.
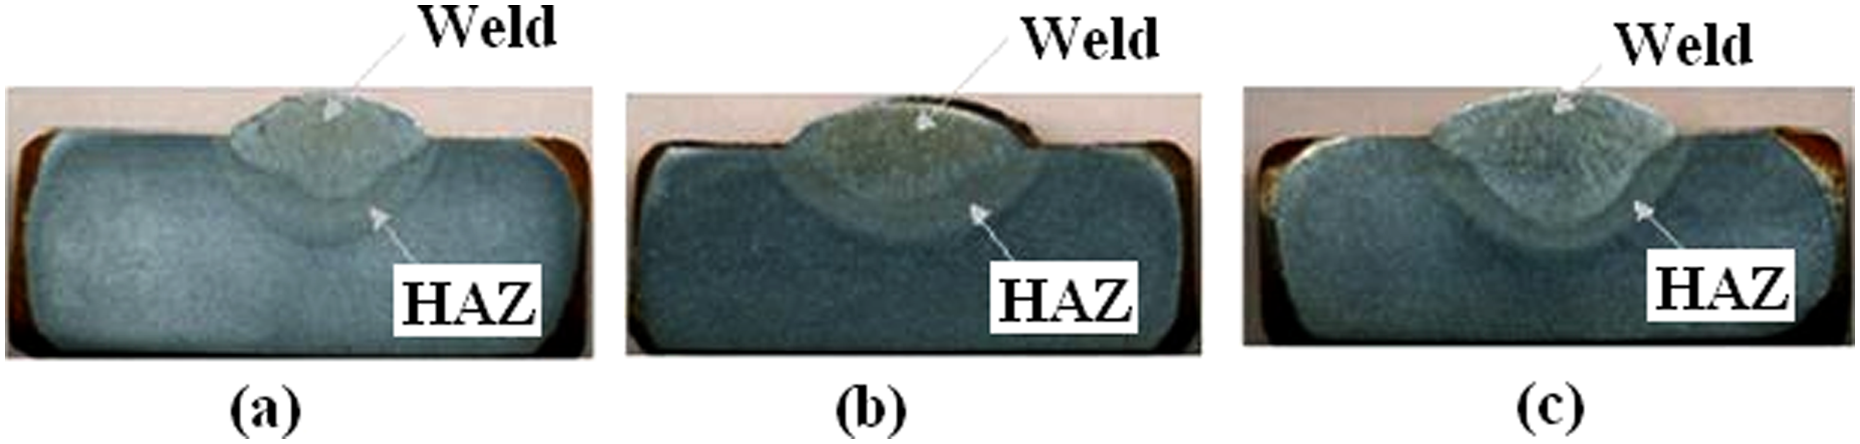
SAW polished and etched beads showing weld and HAZ.
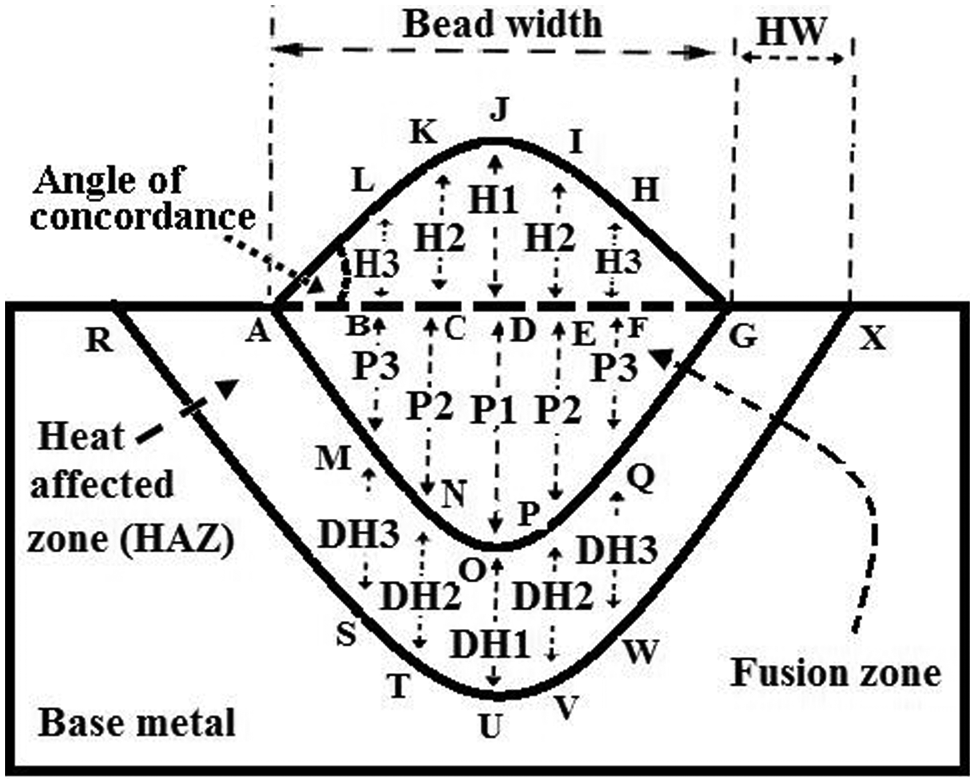
Schematic of SAW weldment shape profile.
Weldment characteristics and shape profile modelling
The SAW process is highly reliable and weld beads have a smoother appearance with minimum ripple effect as compared with open arc welding processes. The experience on SAW indicates the repeatability of the process, which helps in the modelling of bead characteristics. The mapping of the SAW beads can be done by measuring the various zones as indicated schematically in Figure 3. It is observed in Figure 3 that the HAZ width (HW) is the distance AR. Similarly, for each weld bead, the AG, DJ, DO and OU as indicated in Figure 3 can be measured to represent the bead width (BW), bead reinforcement height (H1), depth of penetration (P1) and depth of HAZ (DH1). It is to be mentioned that if the geometrical angle of concordance between weld bead and base material is considered, then further division of the bead width is required to graphically represent the shape profile. This is illustrated in Figure 3. At points B, C, E and F the bead heights H2 and H3 (Figure 3) take into account the geometrical angle of concordance during the curve fitting of the shape profile. Similarly the penetration depths P2 and P3 (Figure 3) take into account the finer details of penetration profile during the curve fitting. It was observed during investigation that, without these divisions of the bead width, the curve fitting procedure could not take into account the finer details of the weldment shape profile geometry. The area bounded by the points A-B-C-D-E-F-G-H-I-J-K-L-A in Figure 3 is the cross-section area of bead reinforcement. The area bounded by the points A-B-C-D-E-F-G-Q-P-O-N-M-A in Figure 3 is the melted cross-section area of base material. Similarly, the area bounded by the points A-M-N-O-P-Q-G-X-W-V-U-T-S-R-A in Figure 3 is the cross section area of the HAZ. The graphical representation of the weld bead cross section can be done by curve fitting of the selected points. The percentage dilution of the weld can be represented by the following equation

where
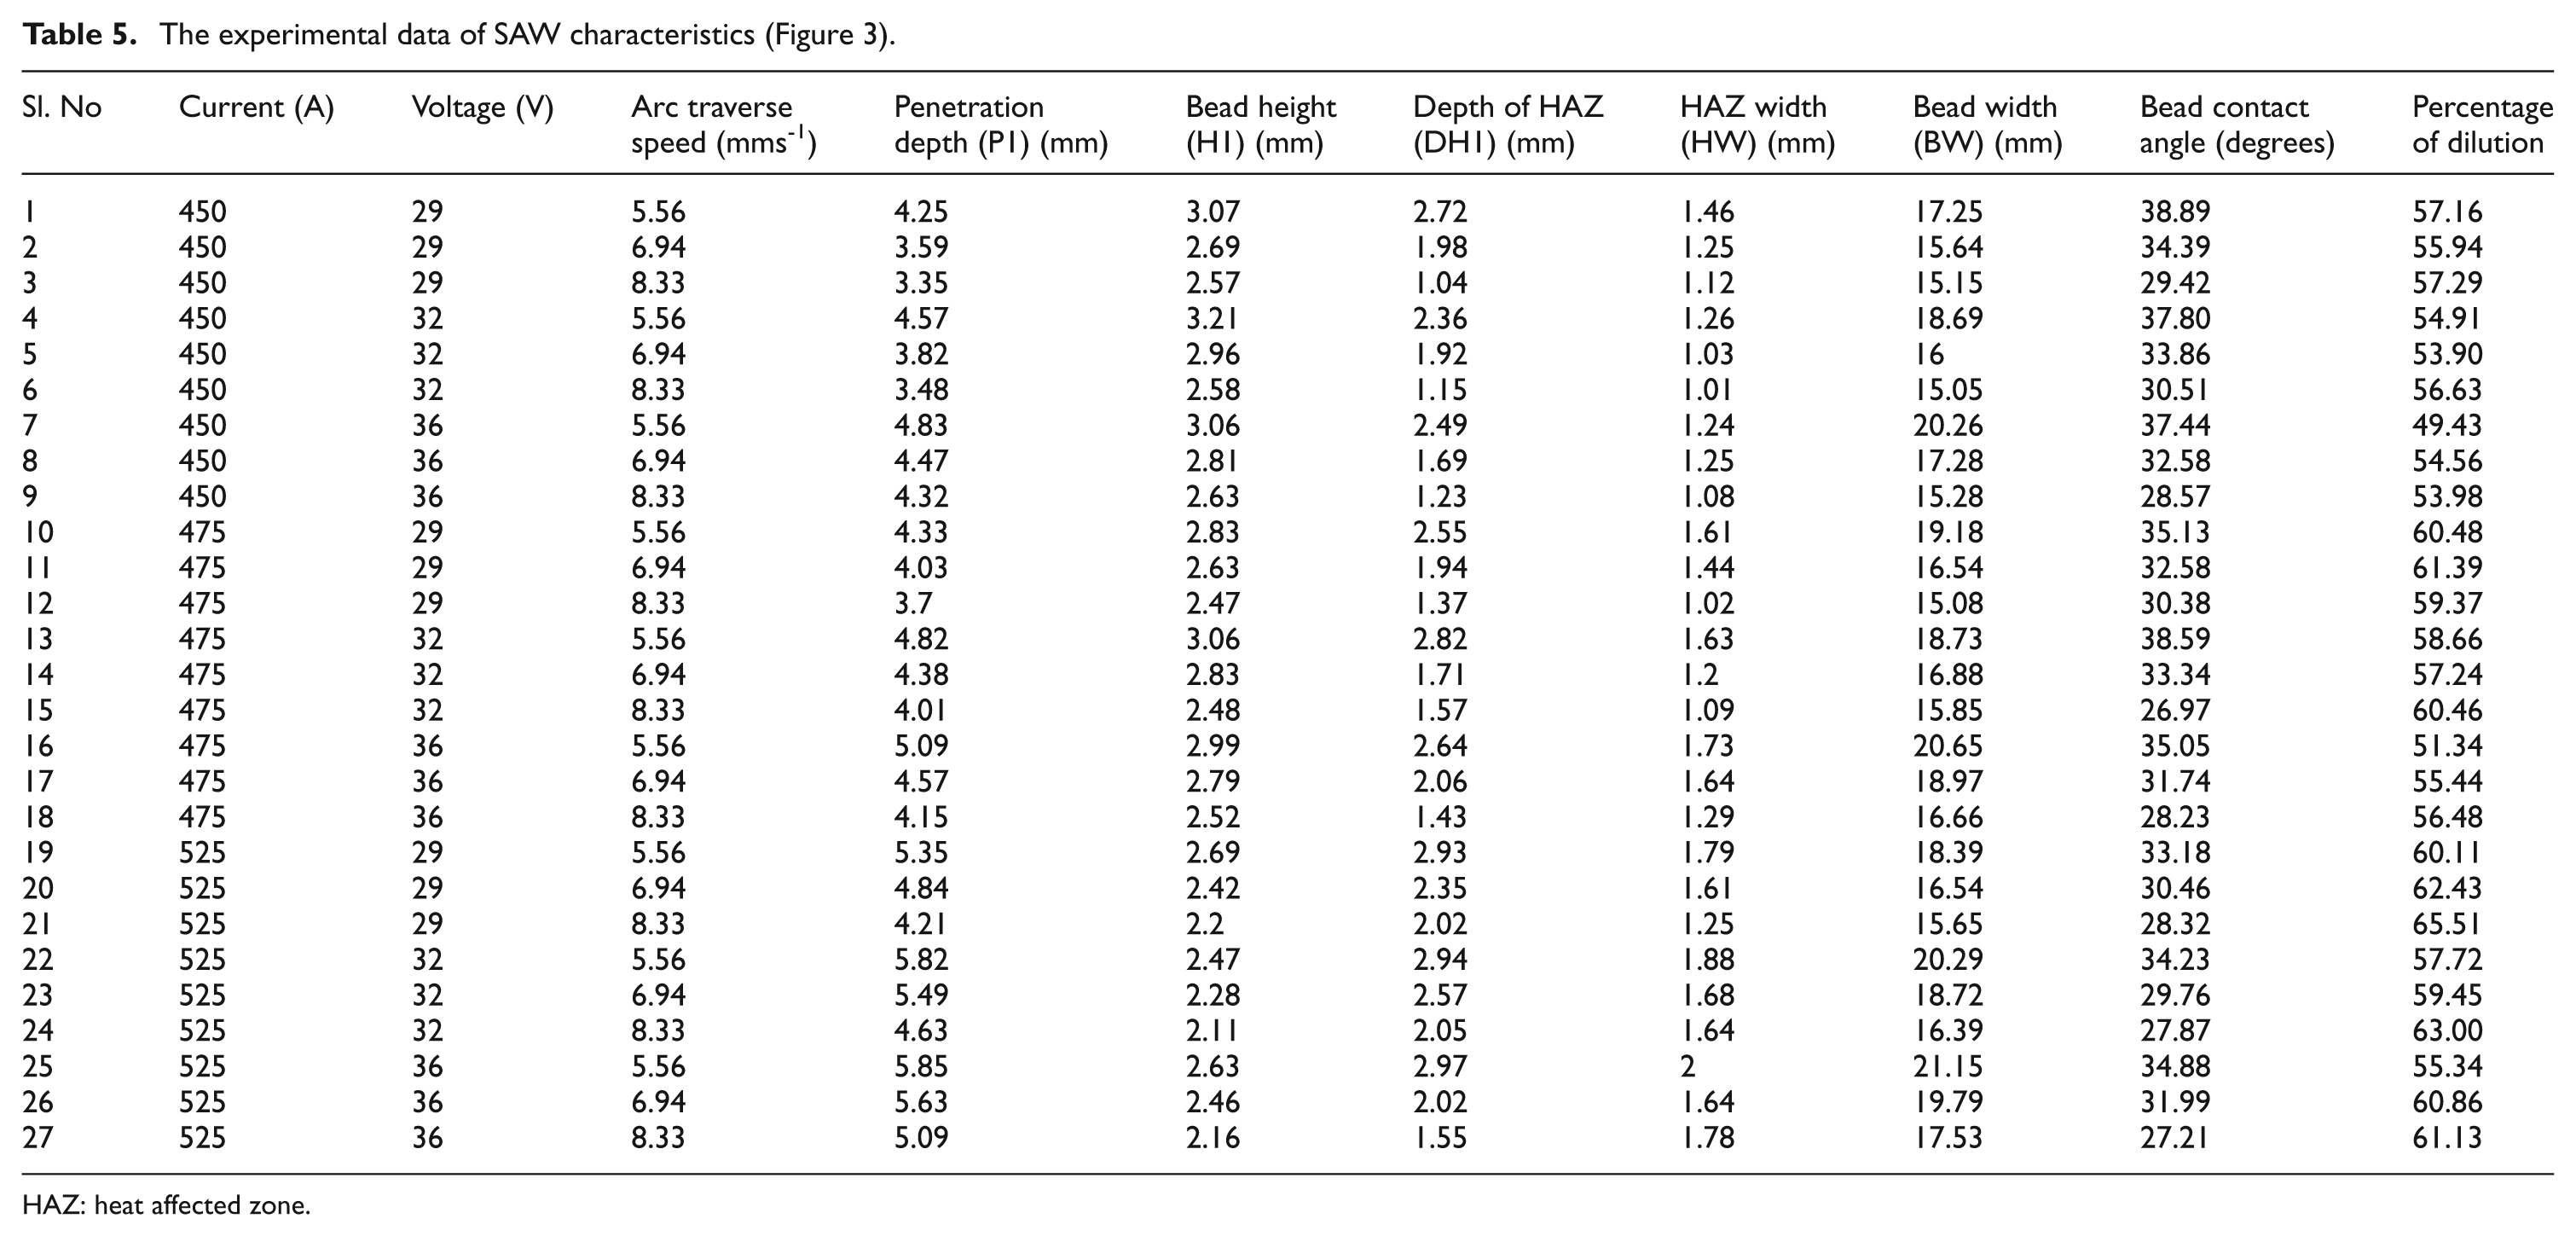
In the present investigation, the above-mentioned dimensions of various zones were utilized in graphical software for representing the complete weldment shape profile. The bead cross sections were measured as shown in the Figure 3. A database of beads characteristics was made and the interaction effects of process variables were also investigated. The regression equations were derived to study the suitability of the relations for predicting the bead characteristics for test cases. The mathematical relationship between SAW response variables and three input variables were constructed by using regression analysis. The regression coefficients were calculated based on least square estimation. The experimental data of SAW characteristics are presented in Table 5.
The experimental data of SAW characteristics (Figure 3).
HAZ: heat affected zone.
Results and discussion
The results from analysis of variance (ANOVA) indicated that welding current and welding speed are significant welding process parameters. The output results of the predicted values from the regression analysis are plotted in normalized form in Figures 4 and 5. Figures 4 and 5 show the observed and predicted bead height and HAZ width, respectively. The expected values of weldment characteristics from the regression equations and experimental values show considerable linearly. In some cases the predicted values and experimental values are slightly discrepant; this might be owing to some experimental error. Even though the SAW process is automated and highly repeatable, uncertainties such as the homogeneity of the work material, uniformity of SAW flux, electrical supply to the SAW power source, uniformity of the SAW electrode wire federate, etc., are imbibed into the system. These uncertainties are often difficult to control and induce experimental errors. The maximum deviation is observed in the case of the HAZ since it is very difficult to measure the exact HAZ boundary of weldment.
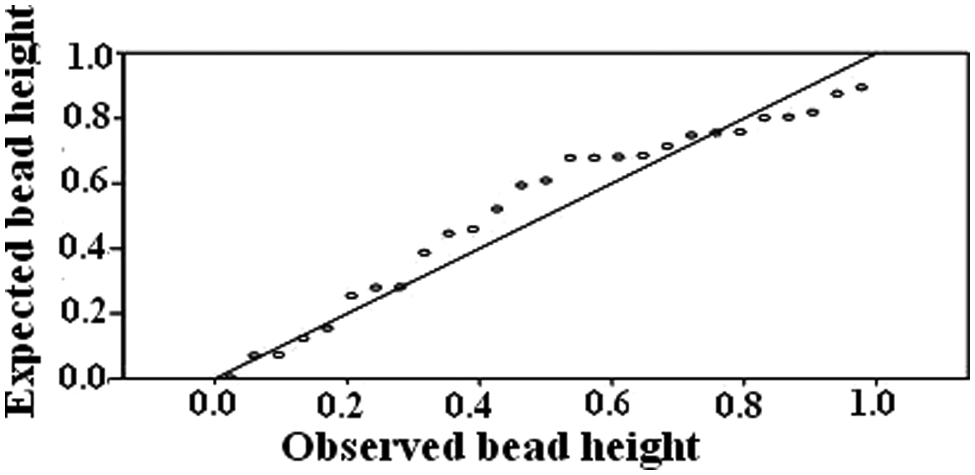
Observed and expected bead height.
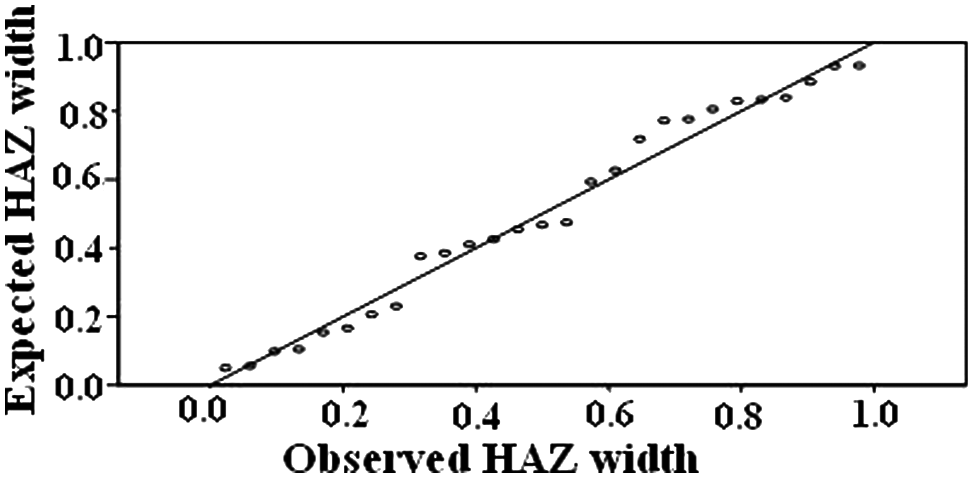
Observed and expected HAZ width.
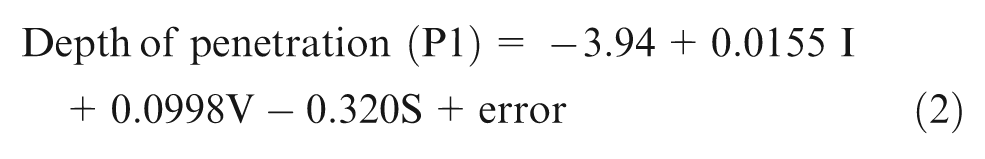
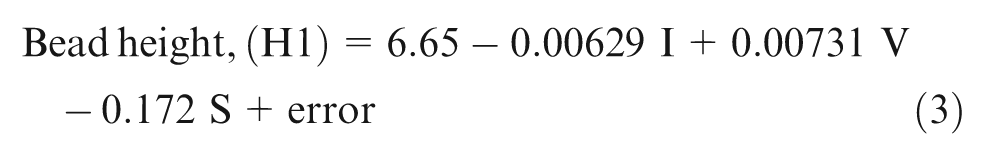
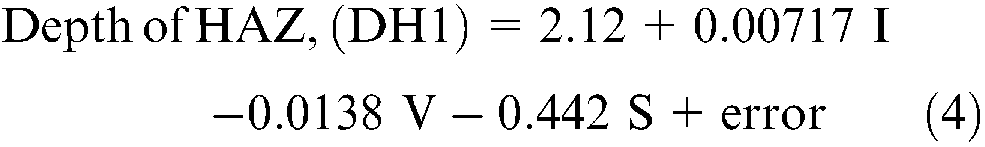
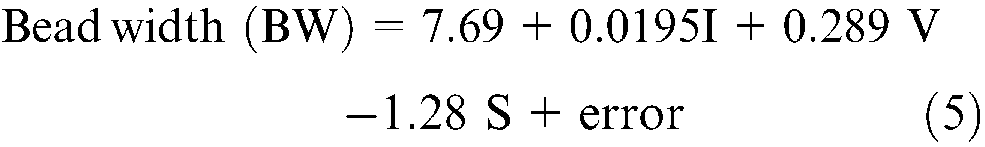
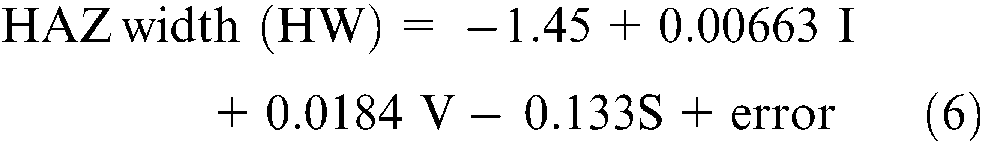
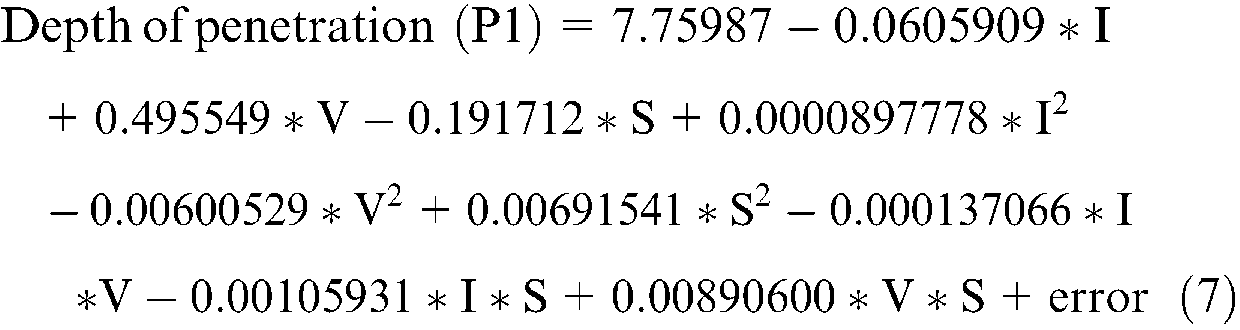
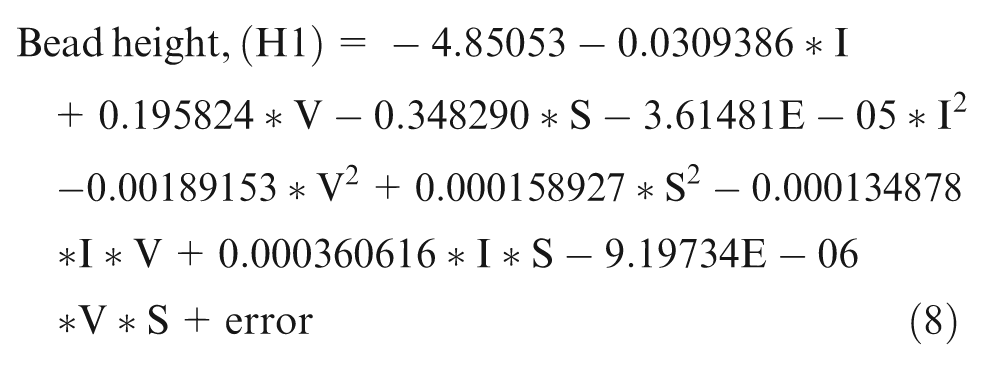
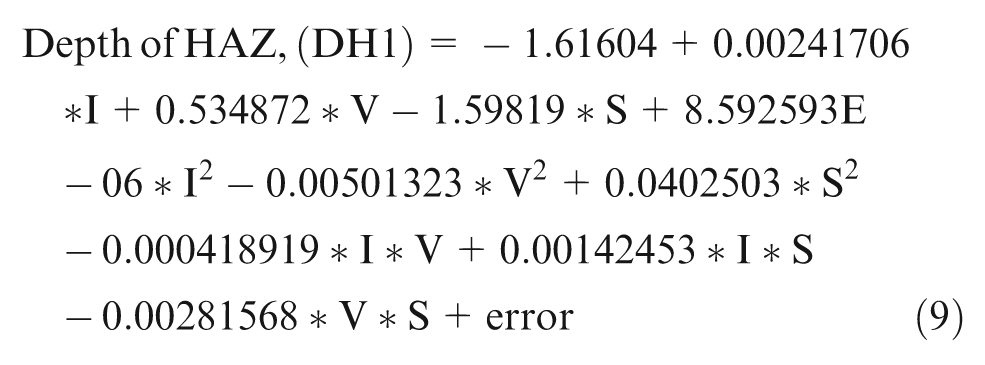
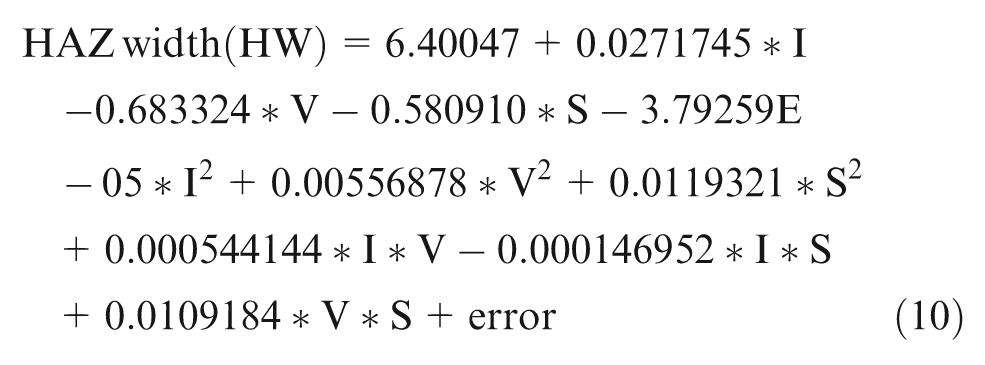
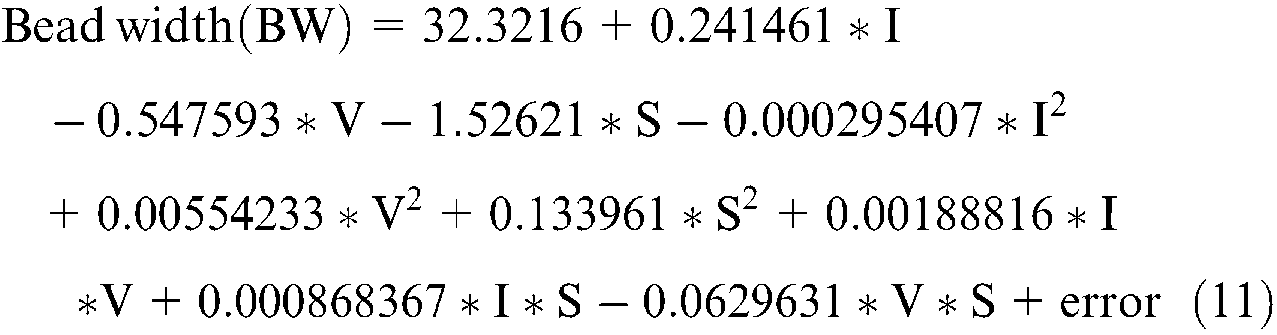
The linear regression equations of bead characteristics (shown schematically in Figure 3), such as the depth of penetration (P1), bead height (H1), depth of HAZ (DH1), bead width (BW) and HAZ width (HW) is provided in equations (2)–(6). ANOVA data of weld bead characteristics of SAW is provided in Table 6. As the overall interaction effect seems to be insignificant, the coefficients are near to zero and are reflected in the quadratic form of equations (equations (7)–(11). The adjusted R–sq values strongly suggest and recommend a linear model for the output characteristics. A P-value of less than 0.05, suggests and supports linearity assumption. The statistical software MINITAB 24 was used in this work for the response surface regression analysis.
ANOVA of weldment characteristics.
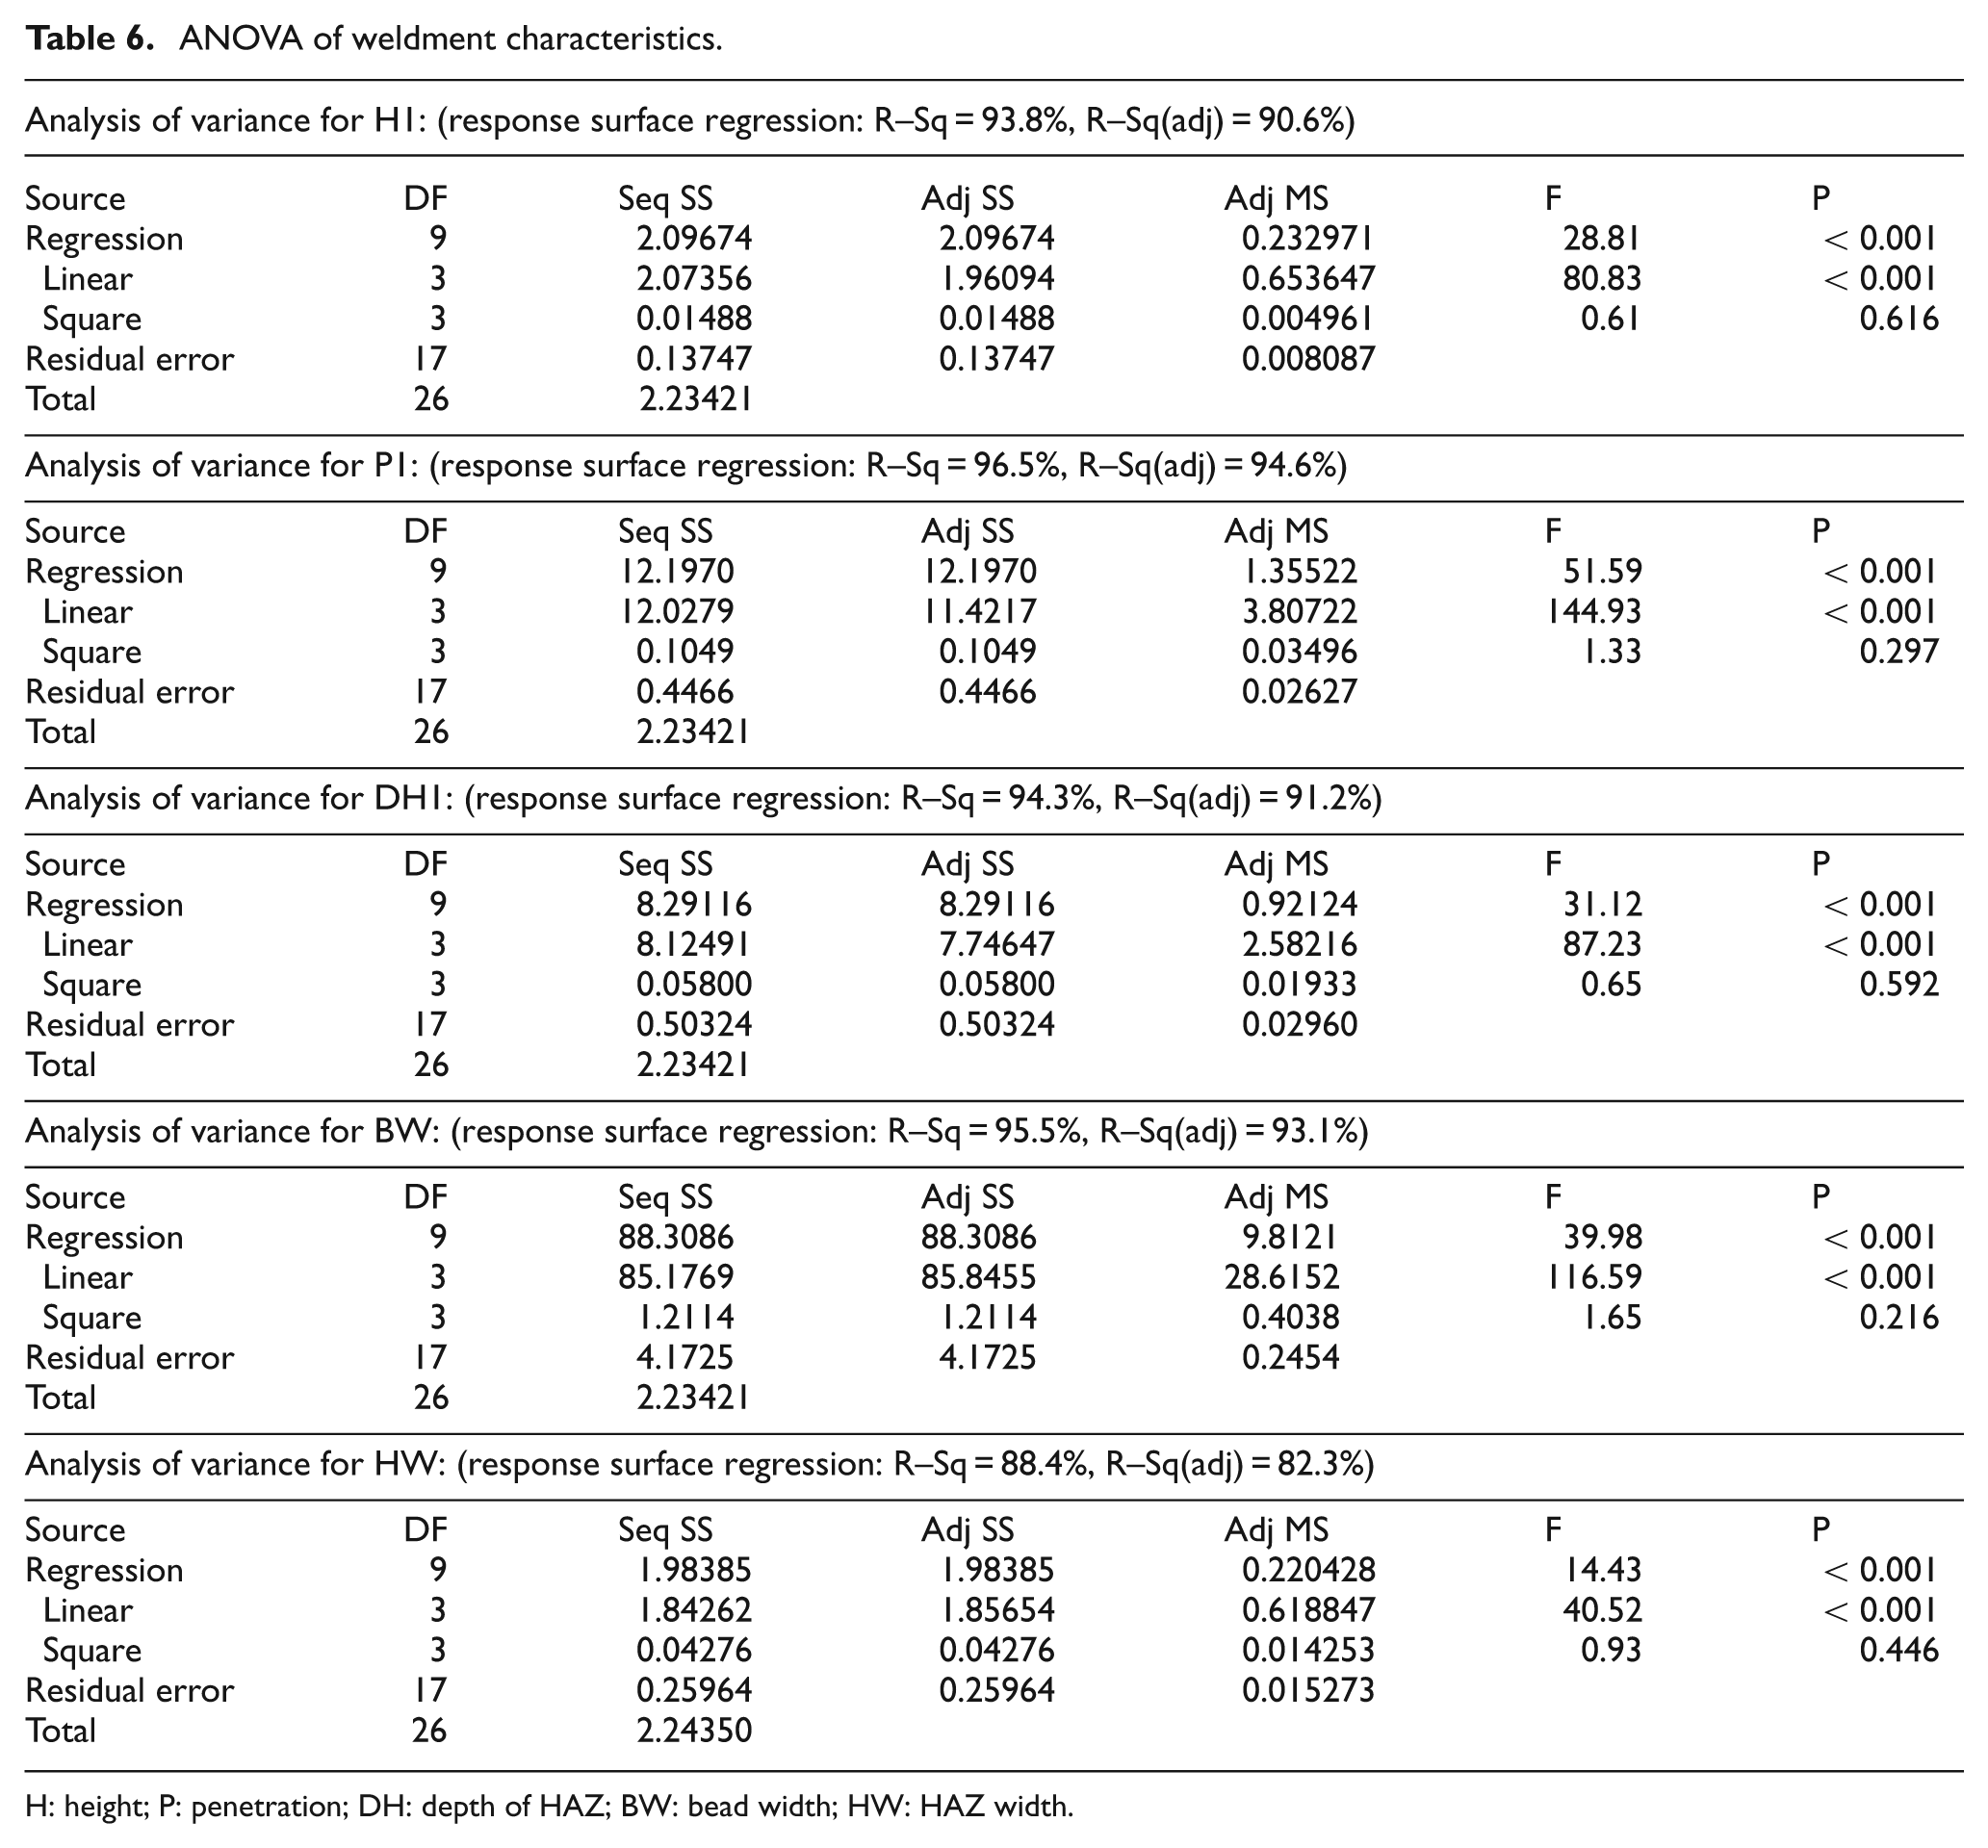
H: height; P: penetration; DH: depth of HAZ; BW: bead width; HW: HAZ width.
Interaction and main effects of process variables
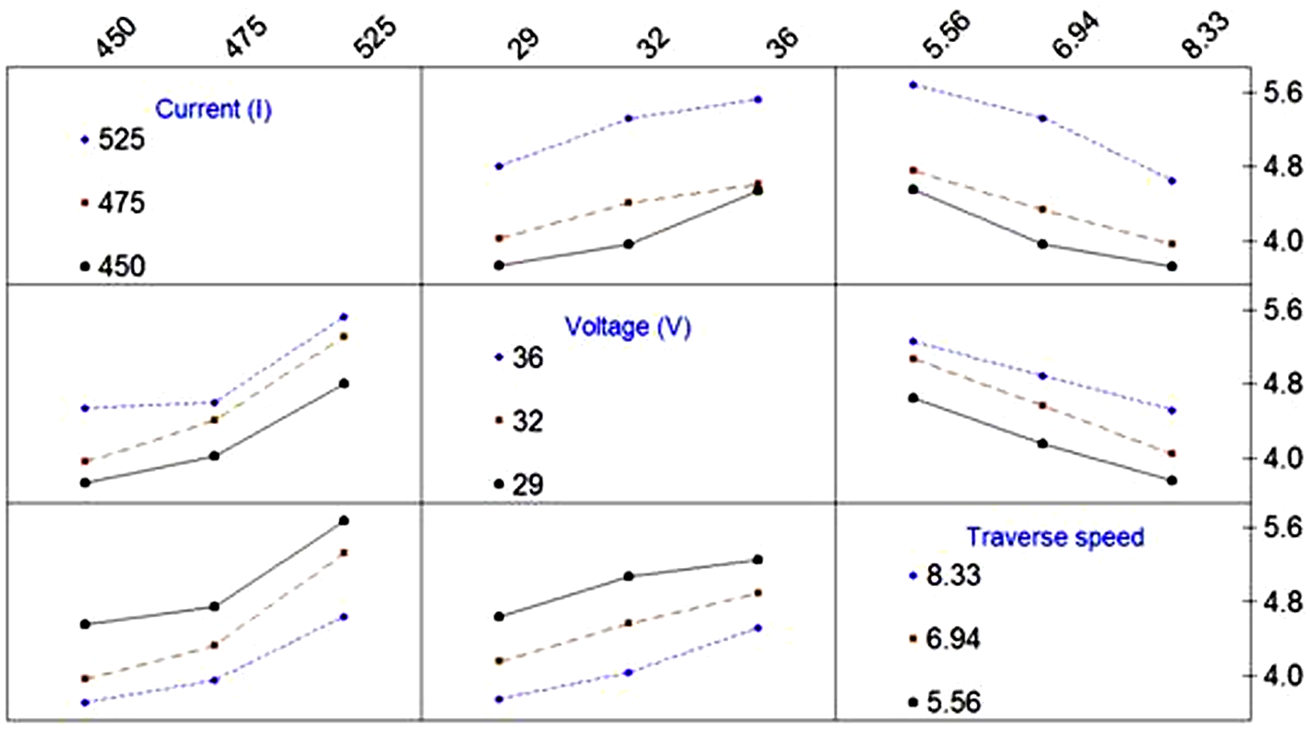
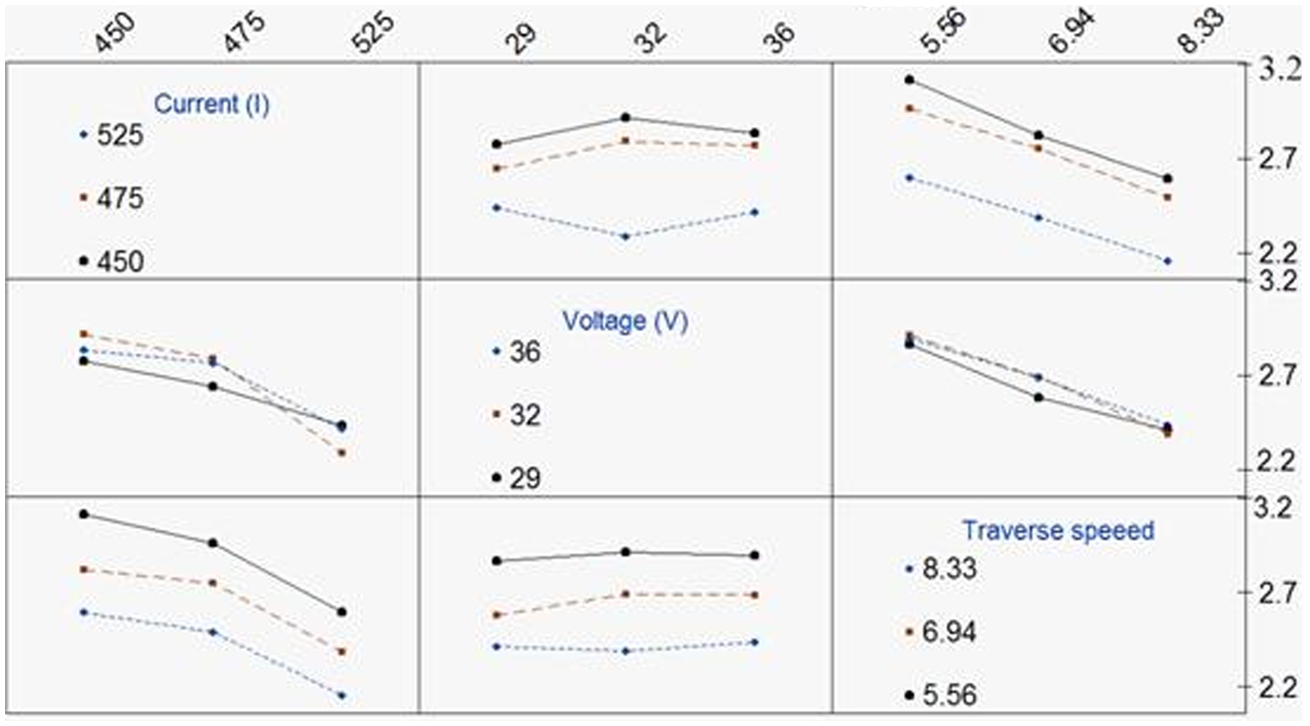
Since the SAW input process parameters have a combined effect on the weldment characteristics, it is desirable to study their interaction effects. The design matrix input and output data (Table 5) were used for plotting the interaction effects for the process input variables and shown are in Figures 6–9.
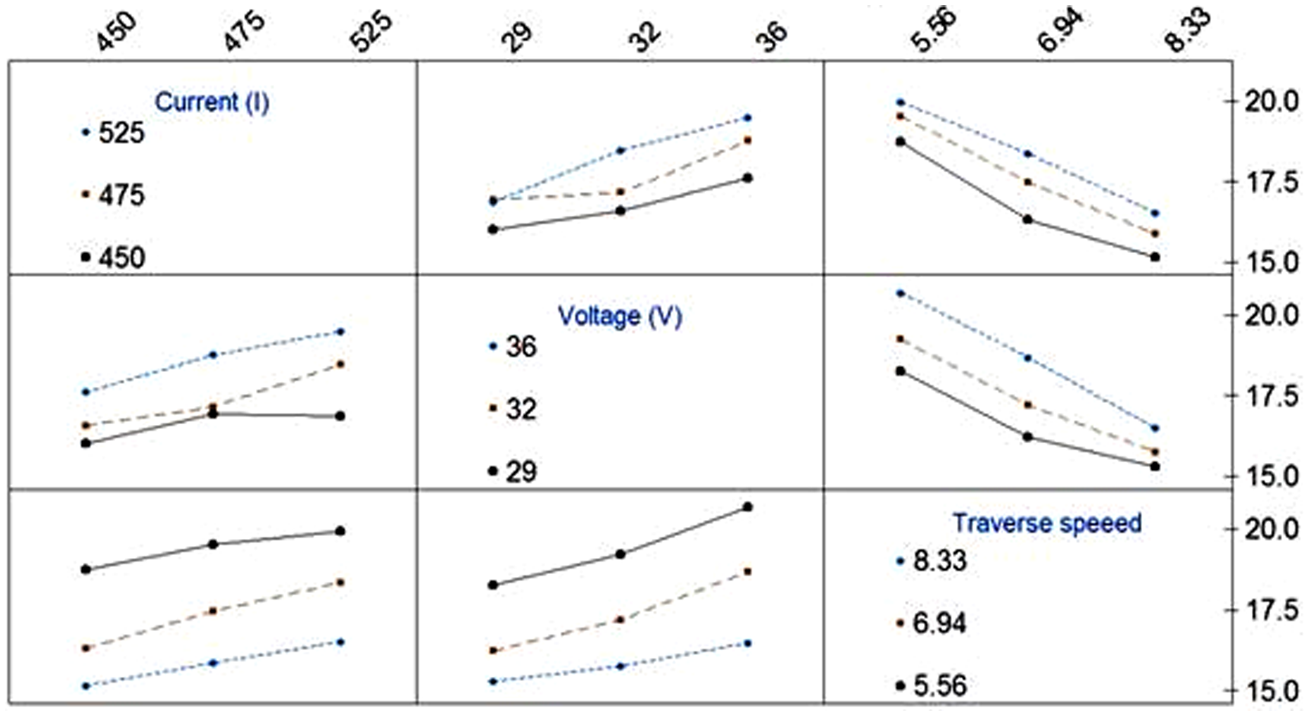
Interaction plot data means for bead width.
Interaction plot-data means for depth of penetration.
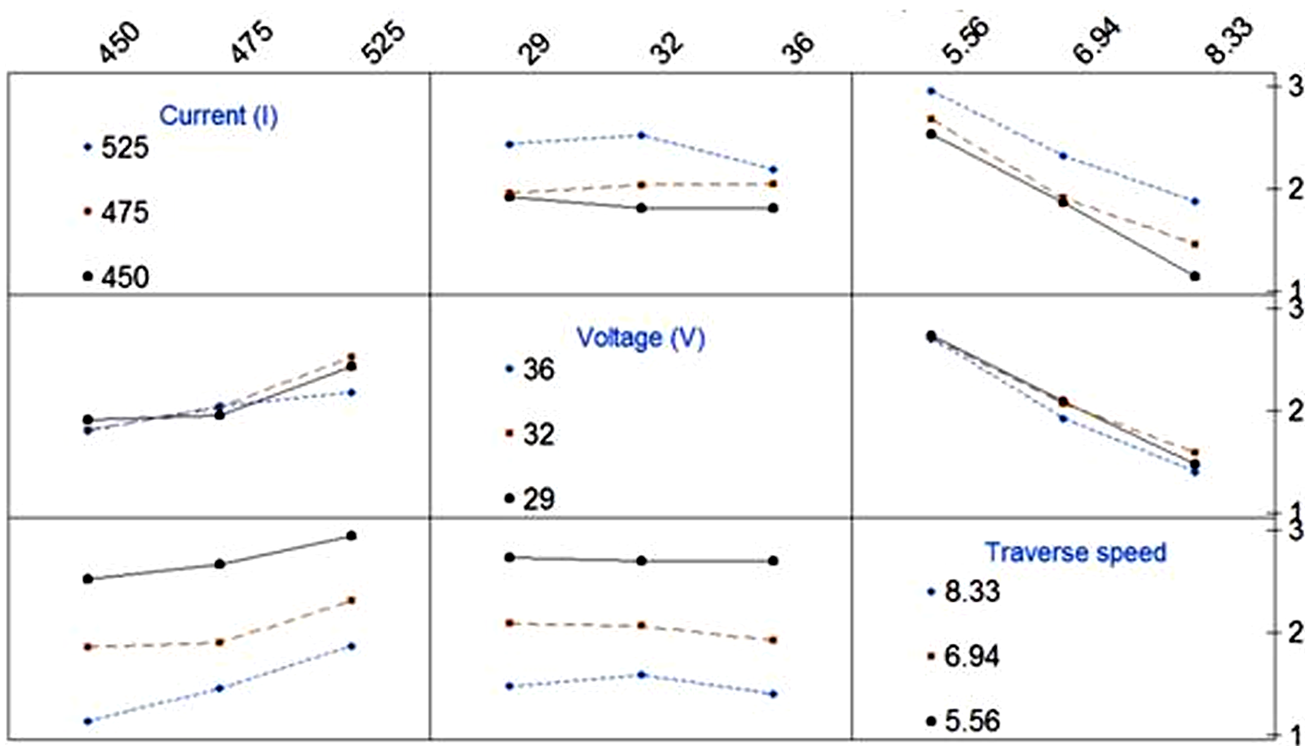
Interaction plot-data means of HAZ.
Interaction plot-data means for bead height.
Interaction and main effect of process variables on bead width
Figure 6 indicates that the bead width (shown in Figure 3) increases with an increase in the welding voltage and current but the rate of increase in bead width with respect to the welding current seems lower than the voltage. The increase of welding speed indicates its negative effect on bead width as at high welding speed bead width is of lower value. The maximum weld bead width has been observed in the case of high welding voltage. This is because of the higher heat input for high welding voltage and current. On the other hand, the slow welding speed has provided sufficient fusion time to achieve more bead width.
Interaction effects of process variables on depth of penetration
The interaction effects of process input variables on depth of penetration (P1, as shown in Figure 3) are illustrated in Figure 7. It is observable that welding speed and current are more critical process variables than voltage for achieving the depth of penetration. The weld depth of penetration has not shown remarkable changes up to current of 475 A.
Interaction effect of process variables on HAZ
Effects of process variables on depth of the HAZ (DH1, Figure 3) are shown in Figure 8. Many researchers have observed that welding speed is a critical process variable after welding current, which affects the HAZ of weldment.6,8Figure 8 shows the drastic effects of welding speed on depth of the HAZ of weldment. It is clearly seen that the depth of the HAZ decreases as the welding speed increases. As welding speed increases the heat input decreases. The faster travel speeds allow a greater portion of arc energy per unit length to be utilized in affecting the base metal. Welding current is also a significant factor for depth of the HAZ. However, voltage has no such influence on the characteristics, as observed in Figure 8.
Interaction effect of process variables on bead height
The interaction effect plots for bead height (H1, Figure 3) are presented in Figure 9. It is observed that welding current and traverse speeds are the more dominating factors for achieving the bead height. The bead height shows more value for the higher current range. Welding voltage has little or no influence on the bead height as indicated from ANOVA.
Response surface plots of weldment characteristics
The process parameters of arc welding processes like SAW are so inter-dependent that it may not be adequate to represent one output with respect to another input in a 2D graph. The quadratic response surface is provided in equations (7)–(11). In Figure 10(a) the response surface plot of the bead width is shown with respect to current and voltage. Since speed is a factor in the design matrix (Table 5) and has three levels, it is divided by current and voltage, and the bead width (Figure 3) is shown in Figure 10(a). The combined effect of current and voltage on bead width can be observed with a quadratic relationship in Figure 10(a). Similarly the effect of current and voltage on the bead height (H1, Figure 3), penetration depth (P1, Figure 3) and depth of the HAZ (DH1, Figure 3) are shown in Figure 10(b), (c) and (d), respectively. Penetration and depth of the HAZ seems to have some form of nonlinear surface as compared with bead width and height.
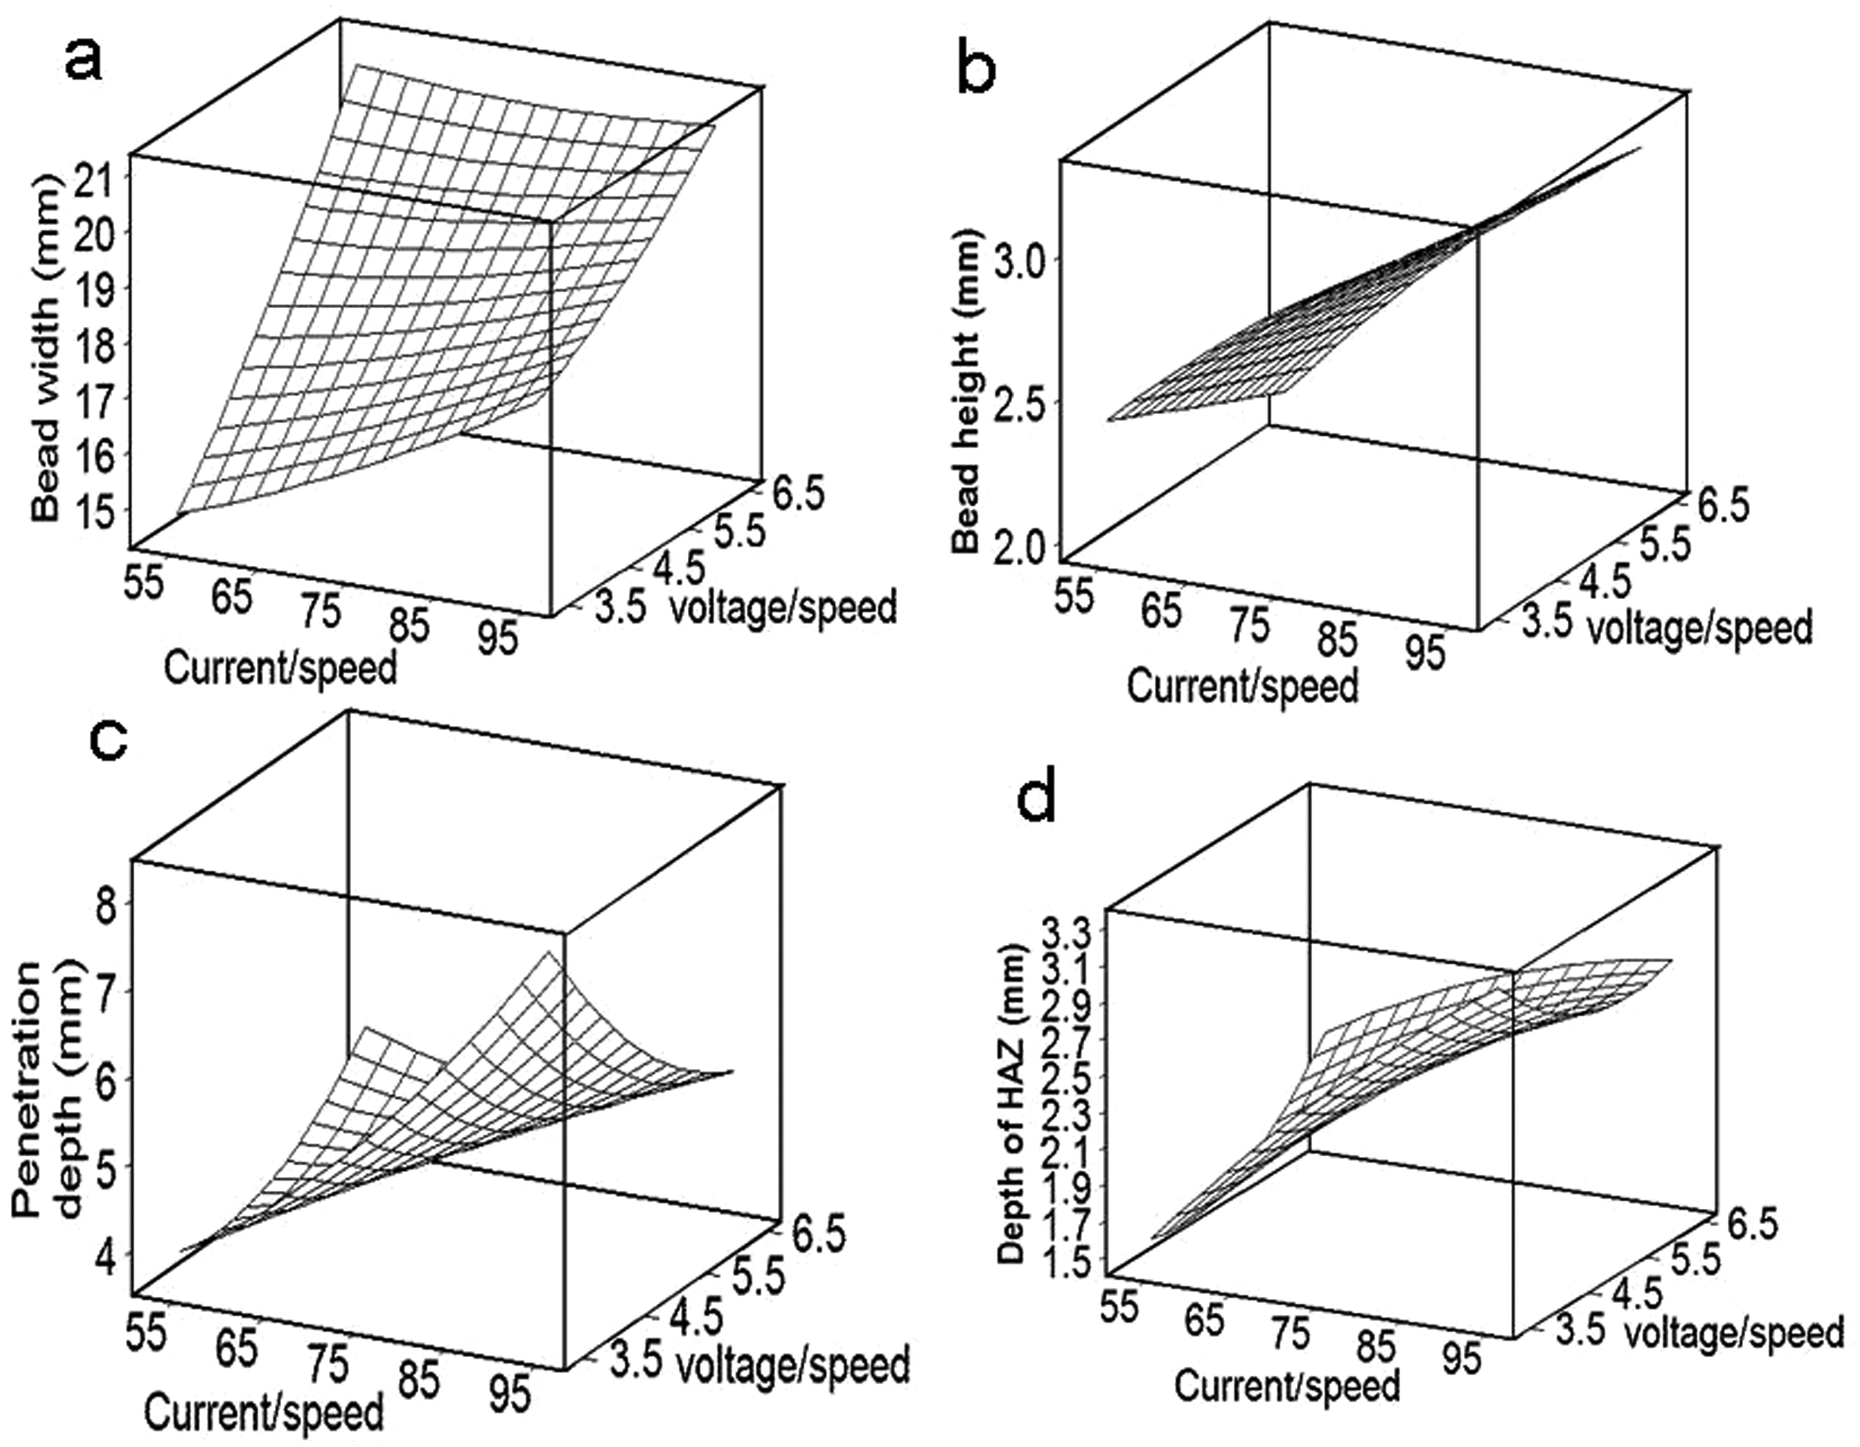
Surface plots of (a) bead width; (b) bead height; (c) penetration depth; (d) depth of the HAZ.
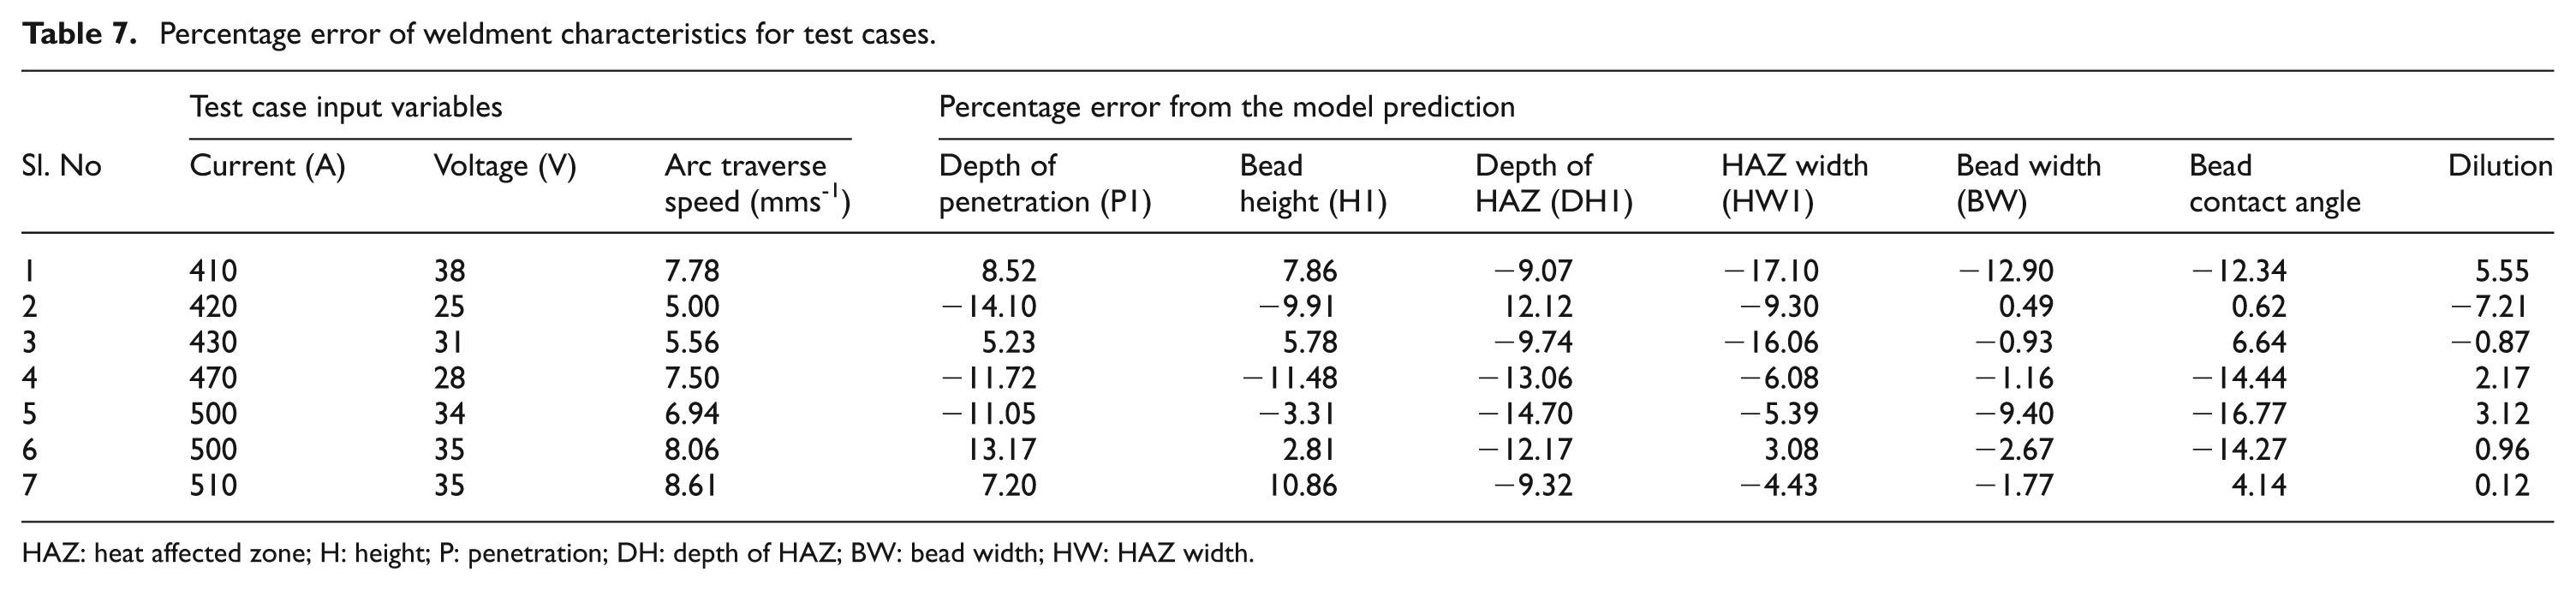
The equations of regression show considerable accuracy for predicting the test run outputs. The percentage error of regression analysis is shown in Table 7 for the test cases. The maximum percentage of error for prediction (for HAZ, DH1) is found out to be 17.10 in test cases. The experimentally observed and predicted values of output weldment shape profiles have been compared graphically and presented for two test cases (nos. 3 and 7, Table 7) in Figures 11 and 12. It can be observed that there is good agreement between the experimental and predicted values of shape profile characteristics. The effects of the SAW process parameters on the welds exhibited in the present investigation is with respect to the thickness (12 mm) of the mild steel plates used in the experiments. The effects of the SAW process parameters are expected to be similar for other weldable plain carbon steels of the same thickness. The exact nature of the depth of penetration, bead reinforcement and depth of the HAZ would change based on the change of plate thickness.
Percentage error of weldment characteristics for test cases.
HAZ: heat affected zone; H: height; P: penetration; DH: depth of HAZ; BW: bead width; HW: HAZ width.
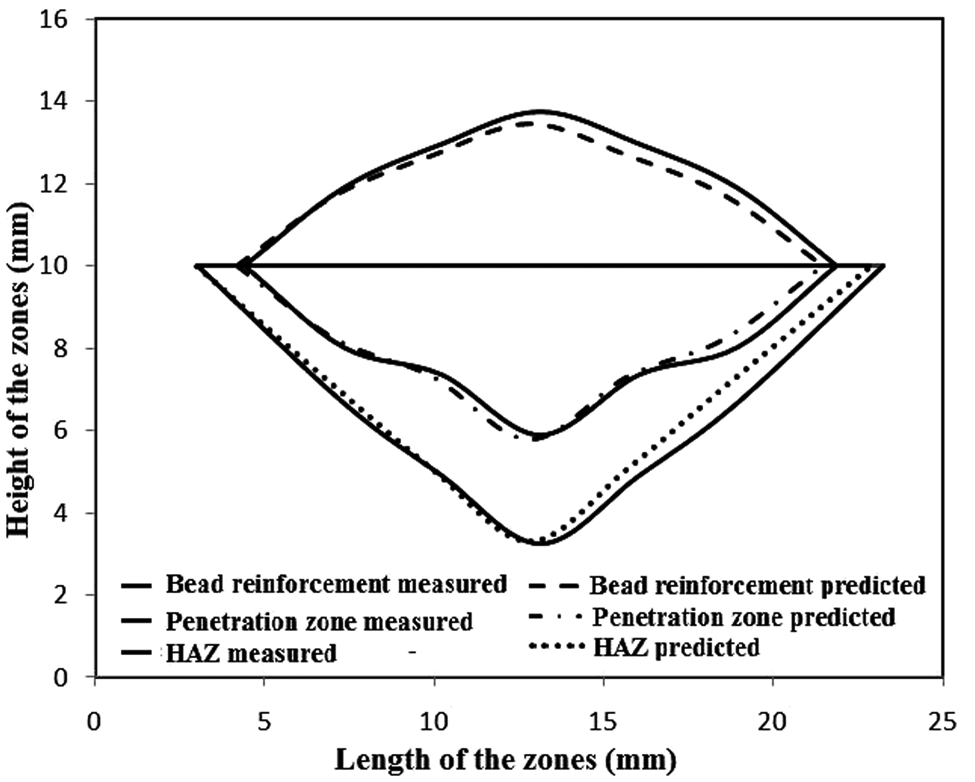
SAW shape profile of test case no. 3 (Table 7).
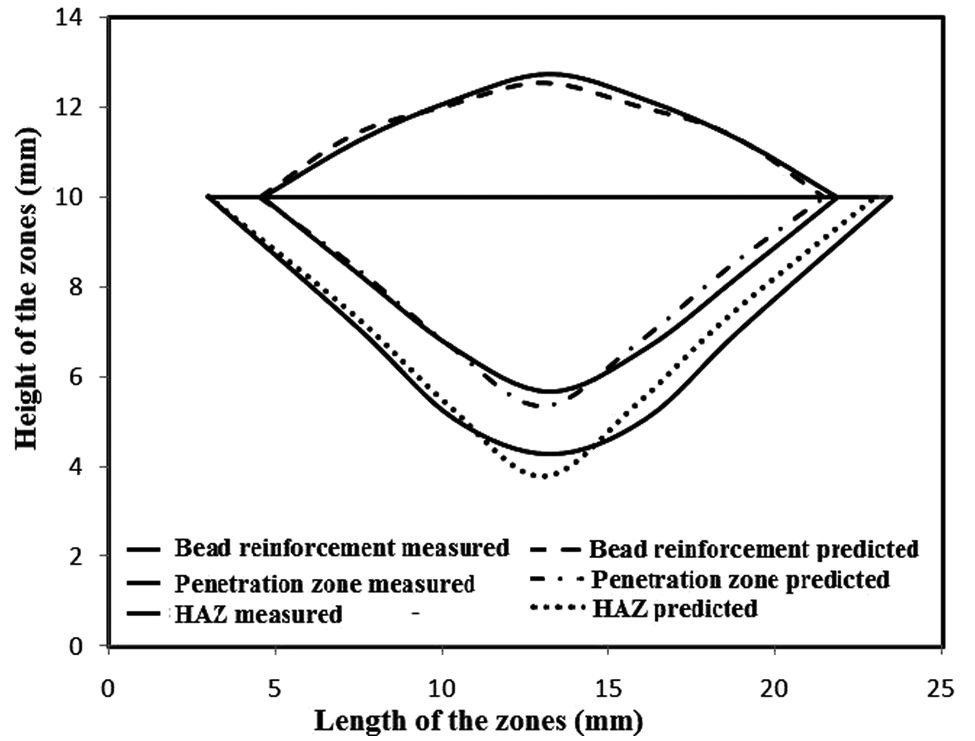
SAW shape profile of test case no. 7 (Table 7).
Conclusions
In this study, regression models were developed from experimental data of a SAW. The interaction and main effects of process variables on weldment characteristics were also investigated. The response surface plots were also illustrated. A few highlighted points from the investigation on the effects of process variables on the weldment characteristics of the SAW are mentioned below.
It is concluded that, within the process window, the multiple regression analysis is adequate for prediction of SAW characteristics within an accuracy limit of 18%, for a full-factorial three level and three factor-based design of experiment.
Depth of penetration is more influenced with welding current and welding speed.
Bead width is dependent more on the values of voltage and travelling speed as compared with other weldment characteristics.
Depth of the HAZ is more sensitive to welding speed and slightly affected by current variation than that of bead width and penetration.
Current is the most important parameter in determining the penetration and welding speed is the most important for depth of the HAZ.
The SAW deposit width can be divided into a number of equal segments. The corresponding weld deposit heights, penetration depths and depths of the HAZ at these segments can be used, together with the HAZ width, for effective graphical representation of the weldment shape profile.
The mapping technique for the SAW welds developed in the present investigation can be used for online quality control of weldment shape profiles. An estimation of fusion zone and HAZ boundaries of the weldment can also be made.
Footnotes
Funding
This research received no specific grant from any funding agency in the public, commercial, or not-for-profit sectors.