
Abstract
A selection of reliable measurement systems that are able to measure the toe radius along the weld bead in a T-joint has been studied. The results show that the currently used methods and gauges do not provide the required accuracy when measuring the toe radius. The gauges are handled differently by different operators – even when using a vision system – which makes the current evaluation methods subjective and unreliable.
Therefore, an algorithm has been developed that assesses weld bead surface data and automatically identifies and calculates the toe radius and the toe angle along the weld. The results obtained by the algorithm are consistent with reference measurements and it is possible for the algorithm to be used in improving the process and quality control during welding.
Introduction
Welded structures within the vehicle and transportation industry application are primarily subjected to load time histories that give cause to fatigue failure. Since welds are notch sensitive owing to their variable local geometry, sharp transitions and flaws, these quantities will determine the fatigue strength of the welded structure. Hence, to be able to assure the durability of a welded structure using a weld quality system, these different quantities need to be considered in the quality assessment.1–3
Recently a new weld quality system has been developed and implemented in production for quality control of weld imperfections in welded structures. 2 The quality system has a link between the quality of the welded structure and the structural performance, e.g. fatigue strength. The weld quality system, which is nowadays implemented as corporate standard within Volvo Construction Equipment (Braås, Sweden), has been validated in extensive investigations.4–5 However, it is important to measure these imperfections with good accuracy in order to secure the weld quality in production. The quality control is today carried out by the use of different gauges that are able to provide a rough estimation of the weld profile, e.g. weld toe radius. The measurements are inaccurate and are associated with a large scatter. Furthermore, the results obtained with these gauges are subjective, since different operators measure the imperfections differently. Hence, a procedure for weld surface quality evaluation is required in order to obtain consistent and accurate results with reduced scatter.
In this article an automated algorithm and procedure that evaluates the measured surface data of a weld bead is presented. This algorithm will make it possible to standardize the measuring of the surface imperfections of a weld bead, such as toe radius and the toe angle.
Test samples
The test samples used in this study are non-load carrying cruciform joints. These are made by welding three plates into a panel and then cutting the panel into smaller pieces by using a cold saw. The material used is steel S355 MC with a plate thickness of 10 mm. The weld filler material is Elga 100 MXA and the weld quality is VD according to the Volvo weld class standard STD 181-0004. 2 The material compositions for the steel plate and filler material are given in Table 1.
Chemical composition (in wt.%) for filler material (Elga 100 MXA) and base material (S355 MC).
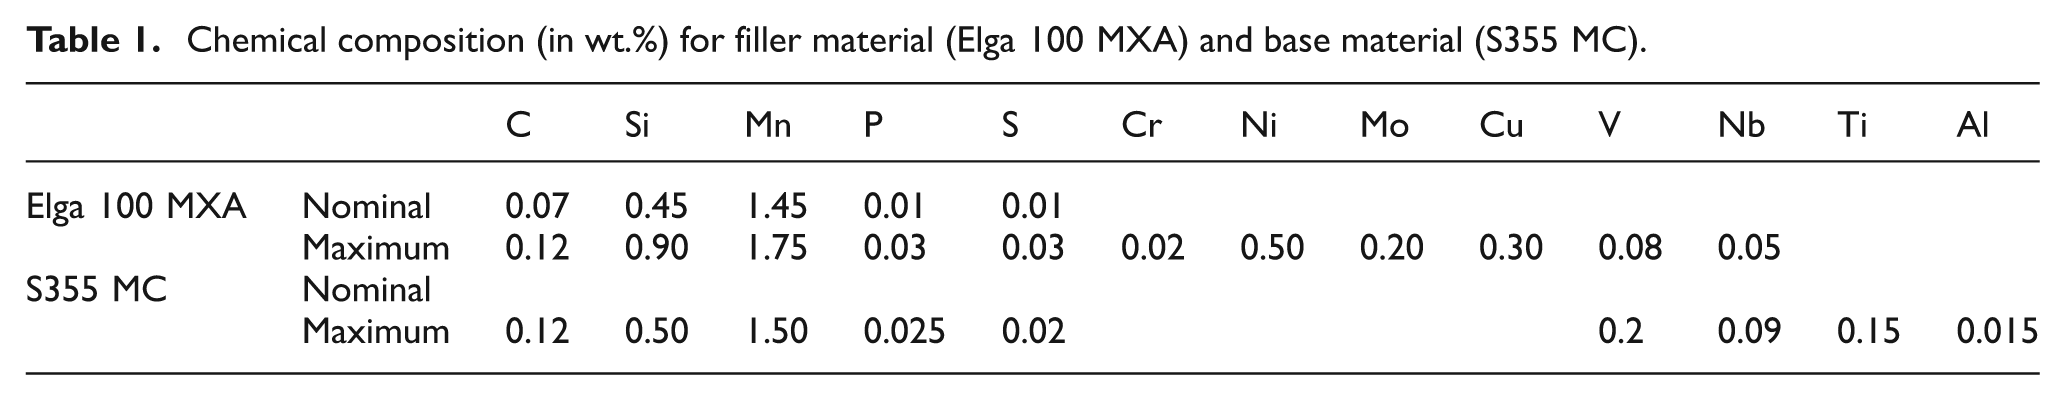
Five panels were produced where each panel provided 20 test pieces; 2 panels were shot peened after welding, one panel was Tungsten inert gas (TIG)-dressed in the critical weld toes and two panels remained ‘as welded’.
Overview of weld surface evaluation
Several gauges are currently used for weld surface measurement and evaluation and a short description of these is outlined below.
The reference block
The reference block is manufactured from a solid block by using wire electrodischarge machining (EDM) to gain high precision surface geometry; ±0.03 mm. The block resembles a welded cruciform joint, see Figure 1(a). The difference between the four sides (welds) is the different sizes of the weld toe radius; which are 4 mm, 1 mm, 0.25 mm and almost 0 mm, which is intended to be as sharp as possible. The different weld toe radii are in accordance with the criteria for the different weld classes within the Volvo quality standard. 2
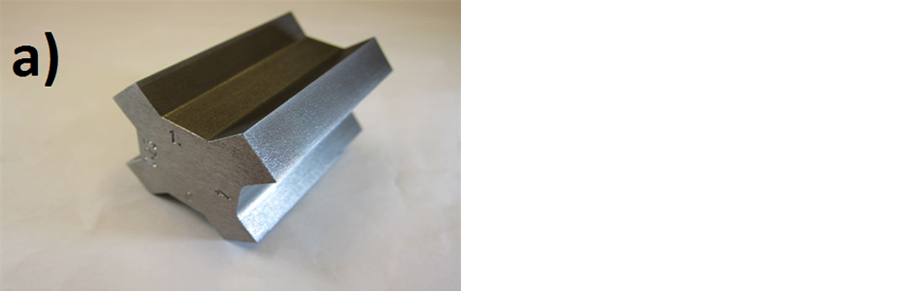
Gauges for weld surface measurement; (a) reference block, (b) feeler gauge.
The measuring is performed by visual inspection of the weld toe in the test sample. By using the reference block as a reference, the operator estimates the weld toe radius based on the visual difference between the test sample and the reference block.
The feeler gauge
The feeler gauge contains a set of blades where the end of every blade has a predefined radius, see Figure 1(b). The measuring operation is performed manually, were the operator compares different blades with the test sample. The weld toe radius is determined as the radius of the blade that has the best fit.
Vision systems
An alternative method is to scan the weld surface and perform the evaluation in a computerized environment. The vision-system used for this purpose is MikroCAD. 6 MikroCAD uses the stripe light projection (SLP) method to describe the surface geometry. The functionality is similar to a laser interferometer, but instead of using a laser beam it shines a projection of light on the measuring object, see Figure 2. The array of light consists of equidistant stripes that form a specific pattern on an ideal flat surface. On a real measuring object, the surface topology will cause the stripes to form a different pattern. By measuring the angular deviation of the stripes, the deviation from the ideal pattern, and the gray scale, the surface profile can be calculated by using triangulation. This method also makes it unnecessary to apply any oxides on the measuring objects surface in order to get a properly reflecting surface.
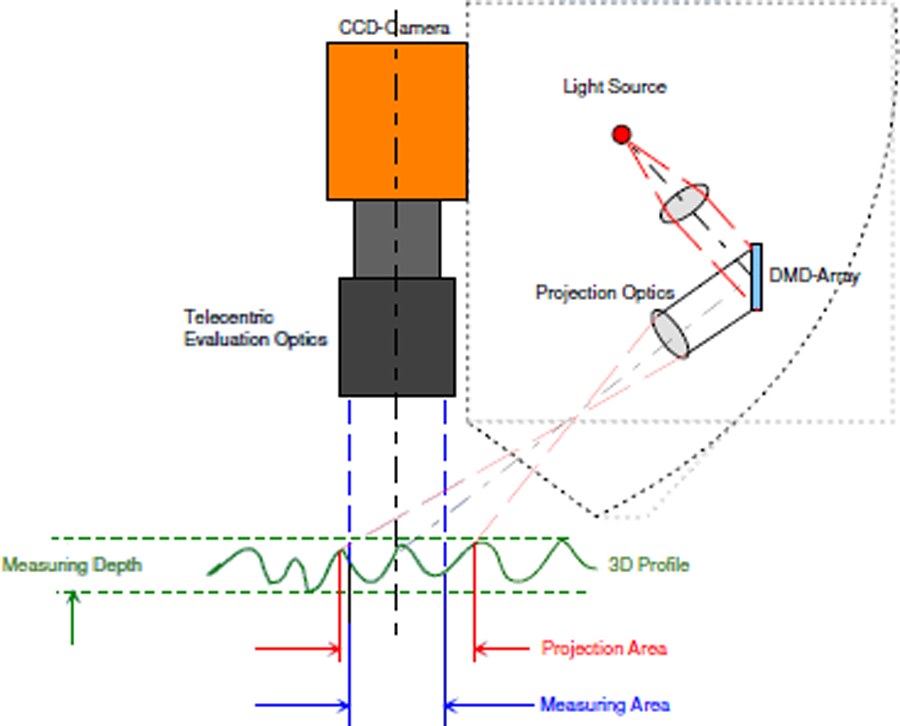
A principal draft of the SLP technique used for MikroCAD. CCD: charge-coupled device; DMD: digital micromirror device.
The controlling and evaluation software is ODSCAD. 7 In this software it is possible to define measurement points from which a distance, angle or radius can be calculated. It is also possible to export the measured surface as a large set of data points with x-, y-, and z-coordinates into a text file for further data processing, e.g. in MATLAB. 8
Benchmark between evaluation approaches
The feeler gauge and the reference block can be used in two different ways; either estimate the radius to get an actual value of the radius, or give a ‘go’ or ‘no go’ depending on the assigned weld class to the current weld. In the latter case, it is only required to consider if the radius is larger or smaller than the acceptance limits for the specified weld class. Since the radial value is estimated, different operators may estimate the size of the weld toe radius differently for the same test sample. This is an undesirable effect, since there is a potential risk that a poor quality weld is approved to leave the factory, risking failure at the customer site.
It may also be of interest to inspect the variation of different critical dimensions, e.g. weld toe radius, toe angle, etc., along the weld bead. Areas where these dimensions reach critical sizes are high risk areas for fatigue cracking. 5 The feeler gauge and the reference block are able to measure the toe radius at only one single point at a time. Thus, performing such an inspection by using either the feeler gauge or the reference block is time consuming and, therefore, are not suited in a lean, tact-timed production environment and when fast feedback of a changing toe radius is required.
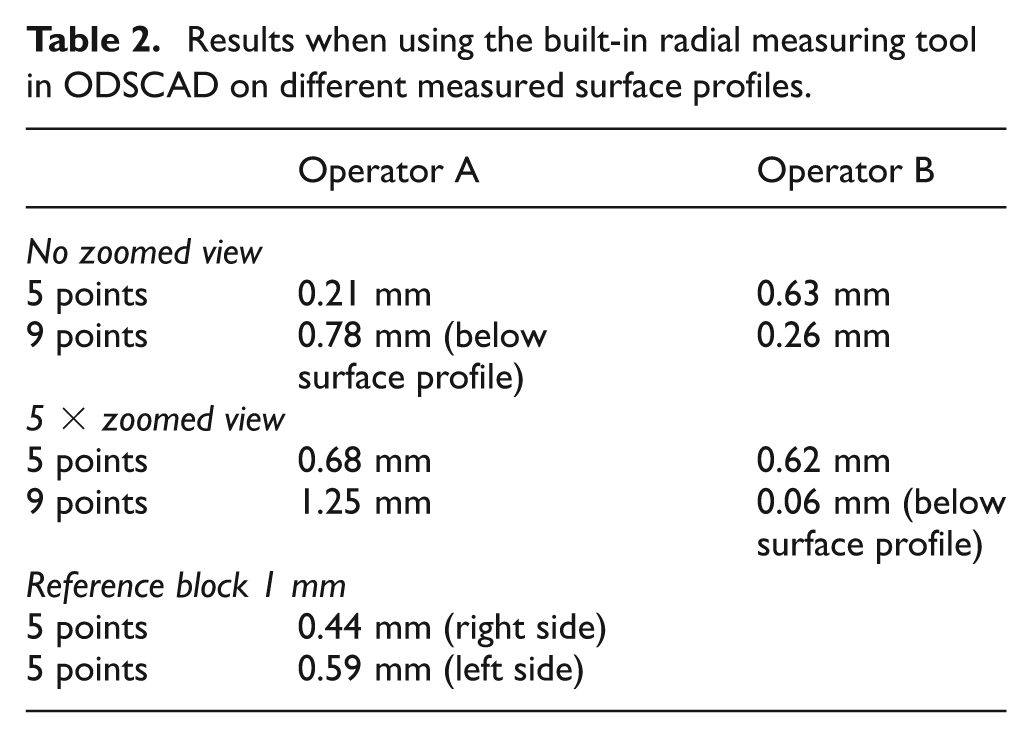
ODSCAD only allows measuring of the toe radius in the two-dimensional (2D) mode. A set of points, minimum 3 points, is placed manually with the mouse pointer on the profile where the operator wants the program to calculate the radius. Thus, it is the operator who decides where the weld toe radius is located on the surface profile. Table 2 shows the results for two different operators measuring on a welded surface profile and the reference block. The results for the same weld profile vary from 0.21 mm to 1.25 mm. None of the estimated radii during the test measurements are consistent with the weld profile or the 1 mm toe radius of the reference block. The results using the gauge block and the feeler gauge become subjective, since it is strongly influenced by the judgment of the operator. Similar subjective results are obtained when using the built-in radial measuring tool in ODSCAD.
Results when using the built-in radial measuring tool in ODSCAD on different measured surface profiles.
To minimize the influence of the operator, an objective and consistent method for evaluating the weld toe radius is required, e.g. an automated algorithm.
Development of a mathematical algorithm
The algorithm starts by importing the data points from ODSCAD into MATLAB. The total numbers of points describes multiple cross sections of the weld surface in the global coordinate system, see Figure 3. The algorithm treats one cross section at a time, stores the data of any identified radii and then moves on to the next cross section.
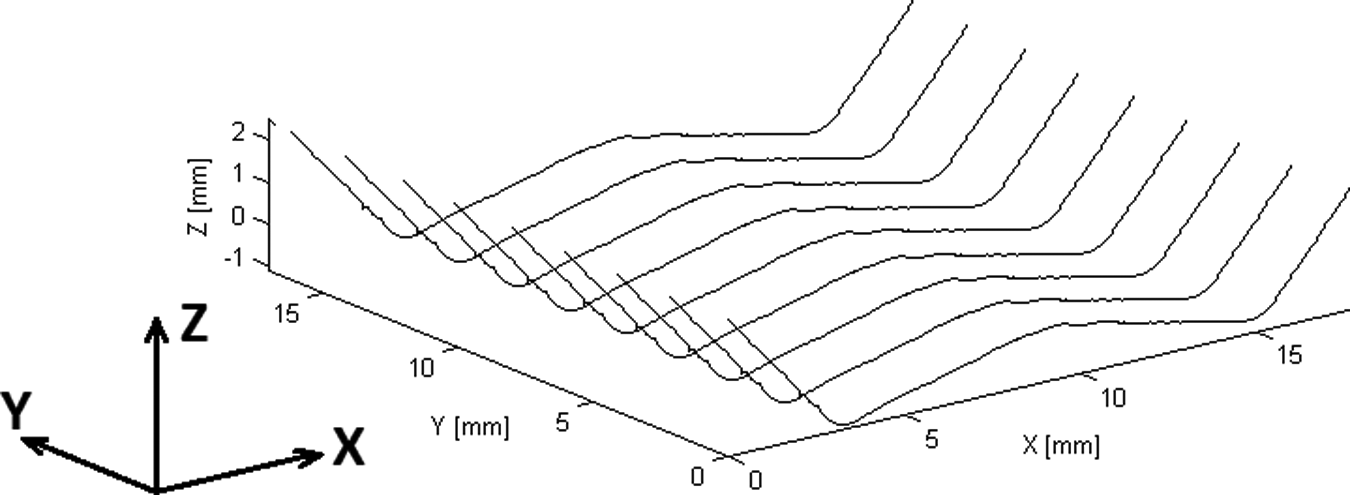
The weld geometry divided into cross sections.
Based on a set of data points arranged as a circle, the radius can be calculated by using equation (1), see Råde et al. 9

Since equation (1) has three unknown constants
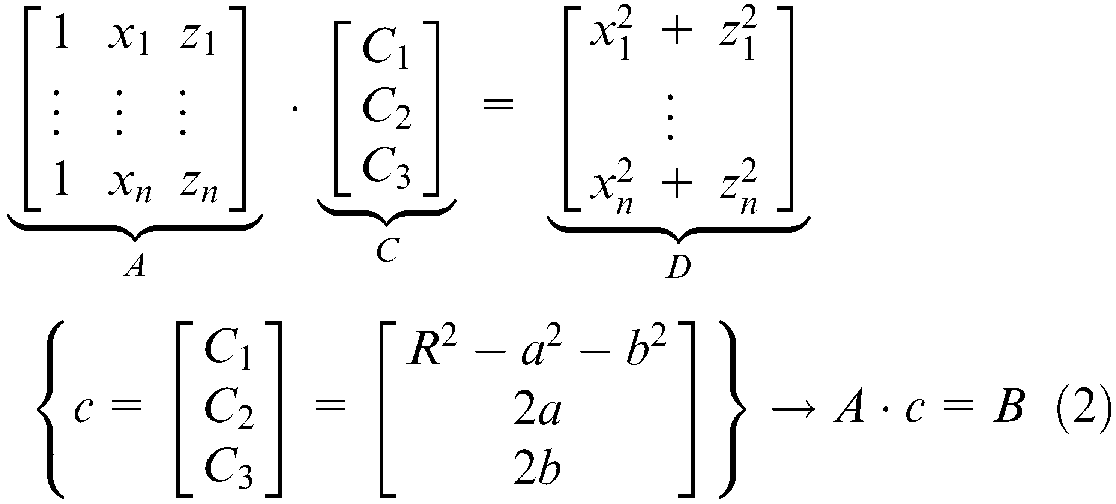
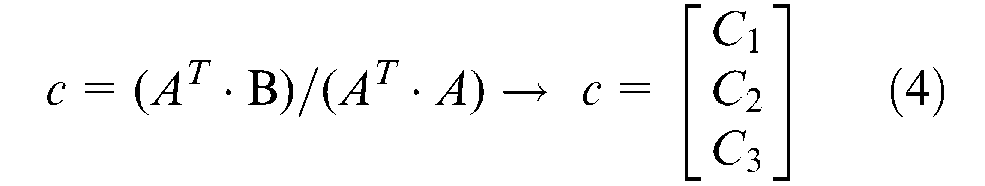
The solution that provides the best fit, i.e. the minimal mean square error, will be provided by the following operation according to the Gauss theorem.

Solving the equation by using Gauss elimination to calculate the value of c by using equation (4) and finally R by using equation (2)
Once all the data points are assembled the points that describe the weld toe must be selected, which will serve as input when solving equation (2). The procedure is to identify the locations according to Figure 4; the weld toe (zone 2 and 4), the weld bead (zone 3) and the base plate (zone 1 and 5). Thus, the curvature of each cross section needs to be determined.
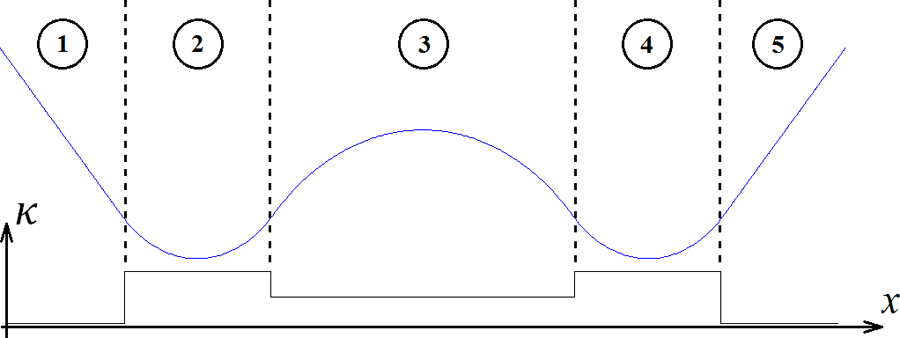
The different areas in the weld cross section.
This can be solved by calculating the cross product of the cross section unit tangent vectors
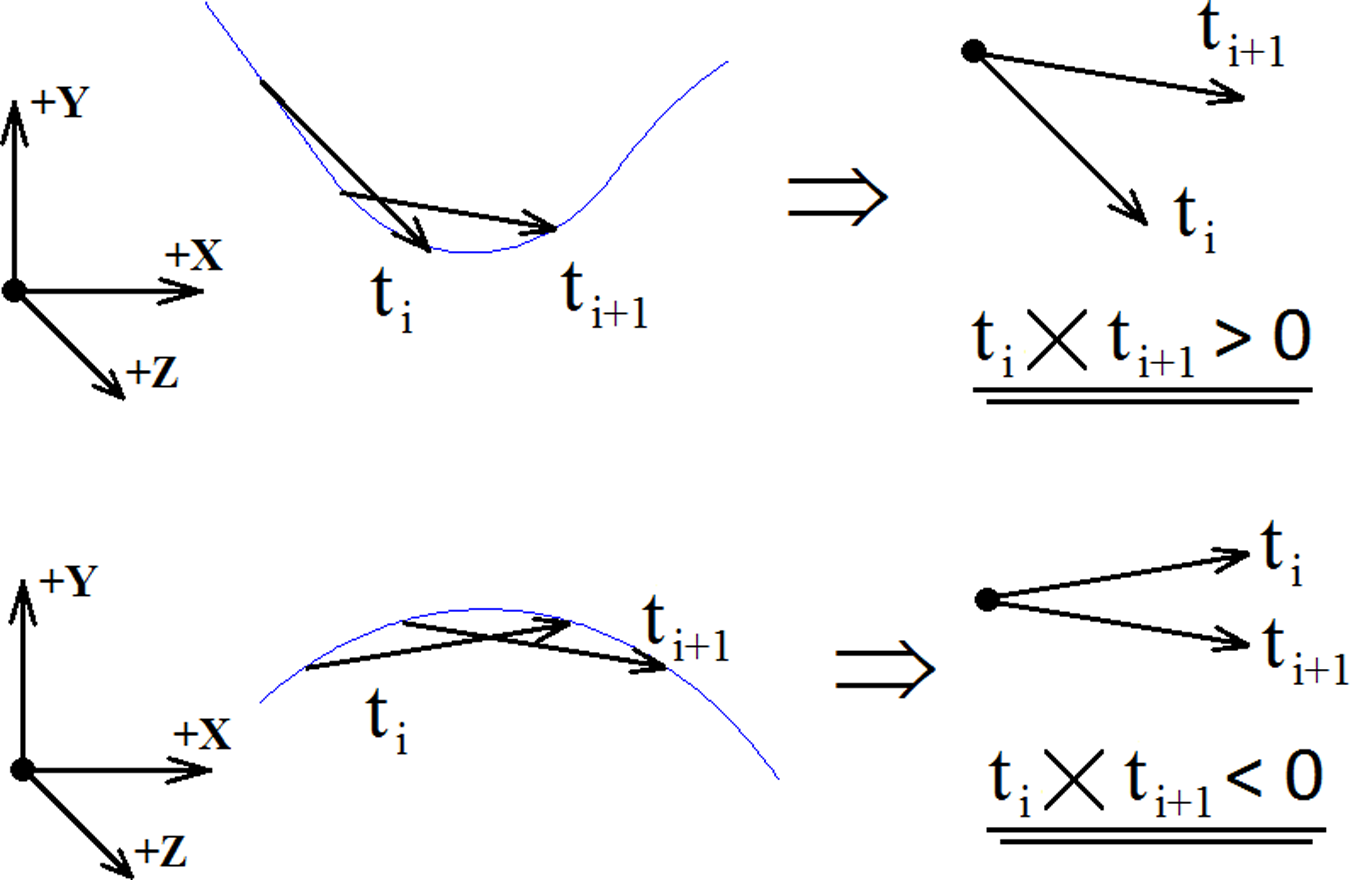
The unit tangent vectors of the cross section curve.
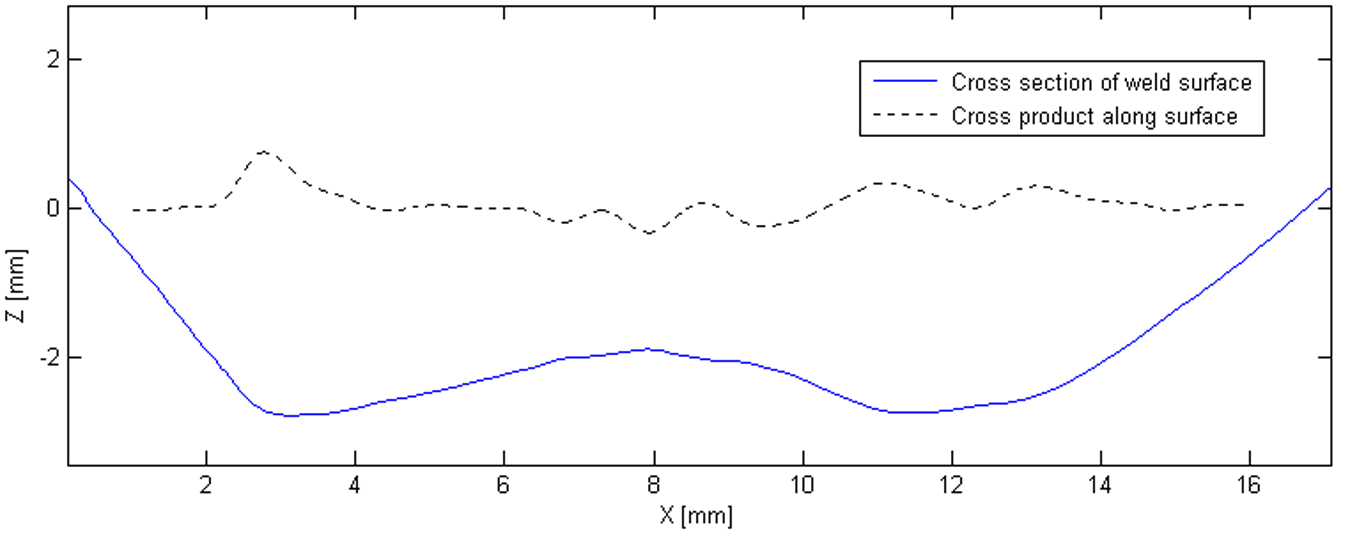
The cross section (lower solid line) and the filtered cross product of the unit tangent vectors.
In Figure 7 the left weld toe radius is located in the zone between 2 to 4 mm on the x-axis owing to the zone of a positive cross product. Since it is numerical, the cross product is rarely zero, rather somewhere between −0.001 and 0.001.
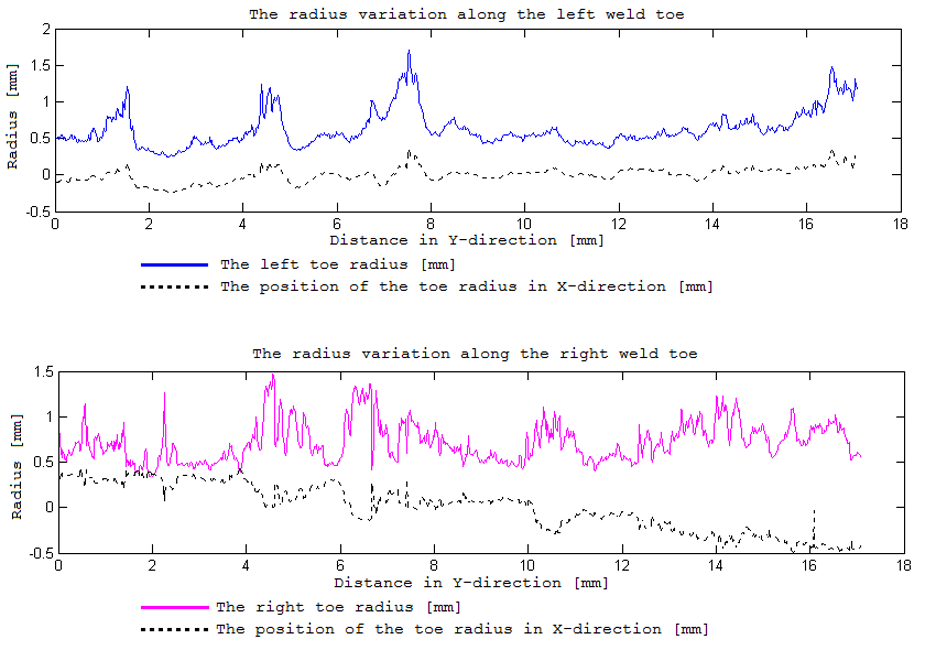
The toe radius variation along the left and the right weld toe.
The algorithm starts by identifying the zones where the cross product is positive (>0.001) and stores the indices that delimit those zones in a matrix. These boundaries provide the input of which data points should be used when fitting a circle and calculating the weld toe radius by using equation (2). A plot processor retrieves the left-most and the right-most radius that the algorithm has identified on the current cut. These radii are set as the weld toe radius on the left and the right side of the weld.
When running a single cross section, 2D-mode, the results are plotted and the corresponding data of toe radius and toe angle are listed. In three-dimensional (3D)-mode, a whole surface is treated and the algorithm run, cross section by cross section of the measured surface, and then stores radial data for every cross section in a database.
Currently there are two different ways of reviewing the results from the database. First, the location and the values of the smallest radii on the left and the right toe radius are plotted, see Figure 8. Second, the value of the toe radius variation along the weld is plotted, see Figure 7. This information enables, for instance, a welding robot rapid feedback of how the weld toe radius is influenced by different setups of the welding parameters, such as current, voltage, wire feed rate, etc.
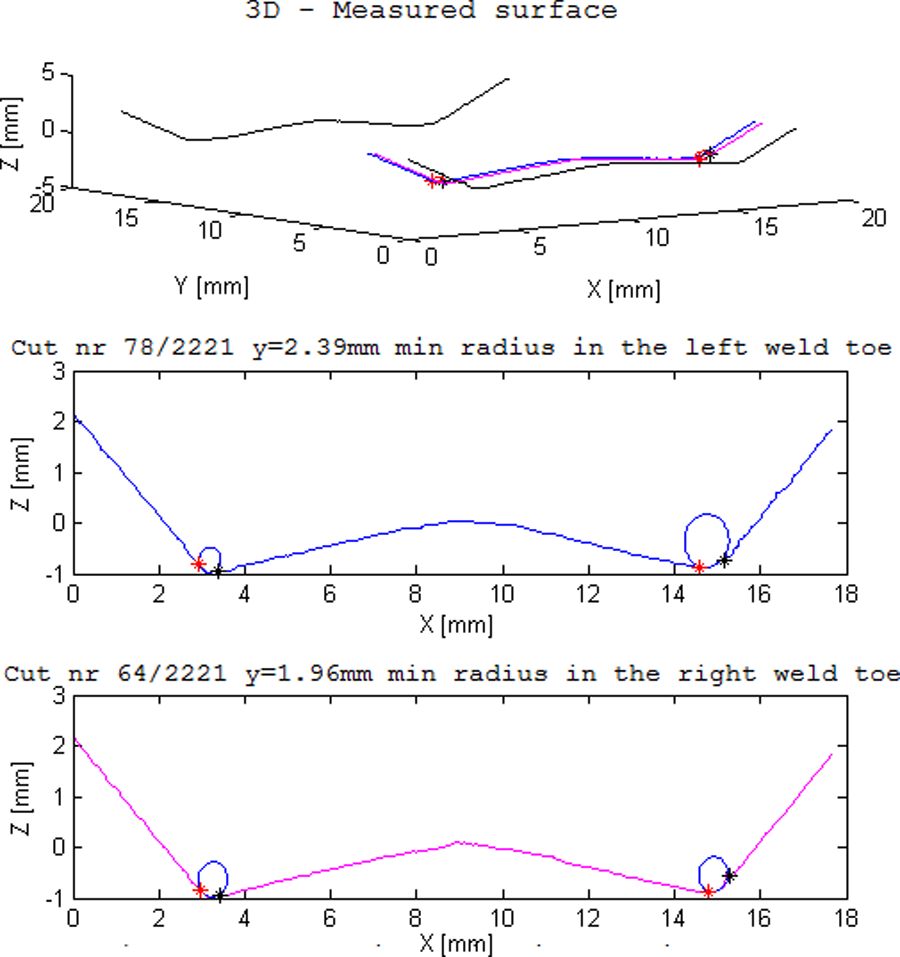
The location of the cross section with the smallest calculated toe radius in the left and the right weld toe.
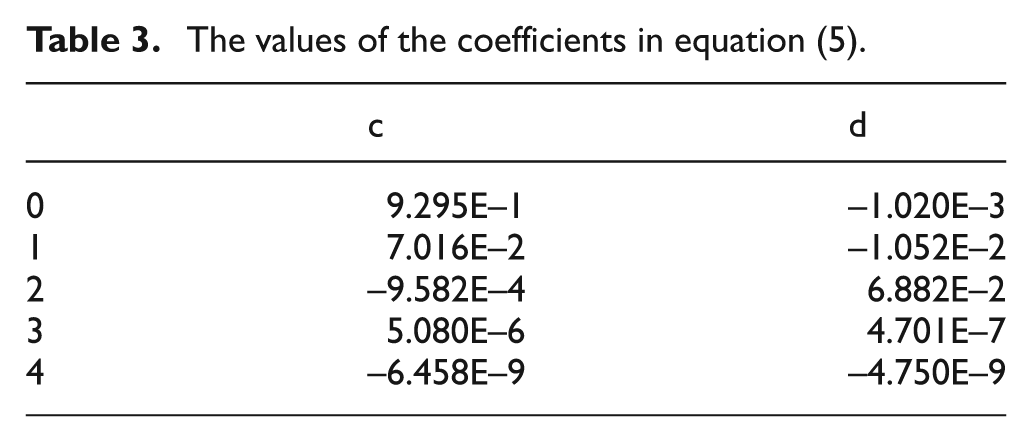
The stress concentration factor in the weld toe of a non-load carrying cruciform joint can be calculated with an empirical formula equation (5) with the corresponding coefficients shown in Table 3 according to Lawrence et al. 10
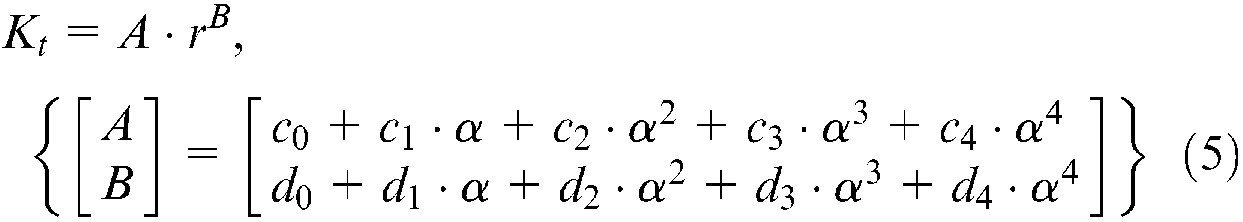
Where α is the toe angle [°] and r is the toe radius [mm]. These parameters are visualized in Figure 9. If the interval of data points and the corresponding toe radius is known, the toe angle α can be estimated by using the arc length of the toe radius circle. The arc length lr is calculated by summarizing the distance between the included data points using equation (6)
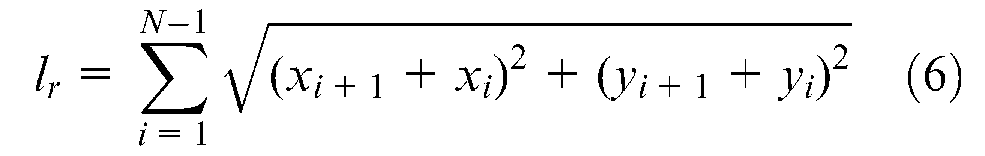
where N is the number of points included in the zone of the radius and (xi, yi) is the coordinates of the included data points. Then the toe angle α can be calculated by using equation (7)
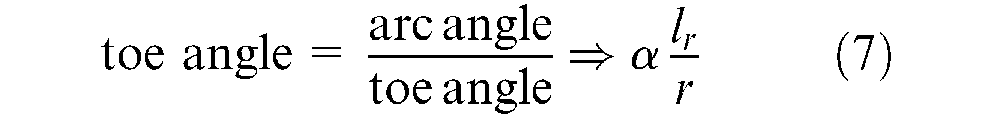
With the toe angle α and the toe radius r known, the stress concentration factor Kt can be calculated by using equation (5). The outcome of the toe angle α is highly dependent on the accuracy of r and lr. Thus, this method to calculate α might be unstable. Integration with another algorithm
11
for calculating the toe angle α should provide more stable values of α. It should be noted that, in the international standard for weld quality levels for weld imperfections SS-EN ISO 5817:2007,
12
the term transition angle
The values of the coefficients in equation (5).
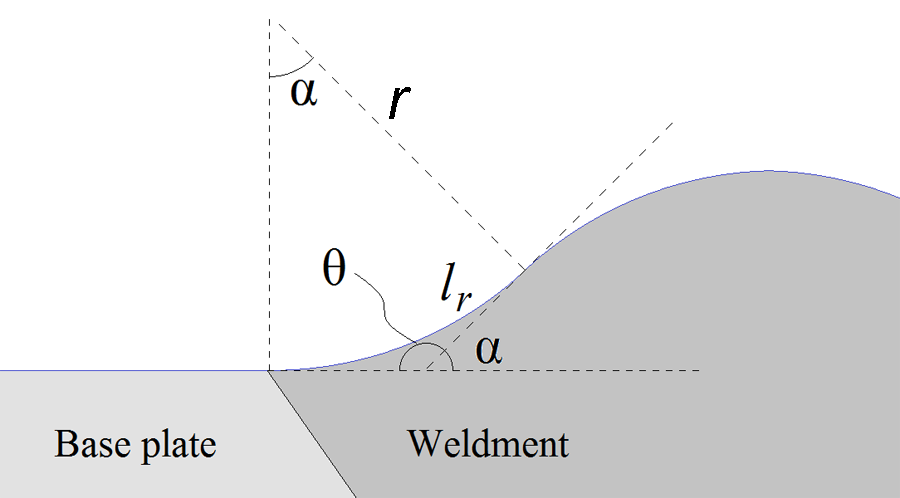
The arc length and the definitions of the toe angle and the toe radius.
Results
Ideal weld cross section
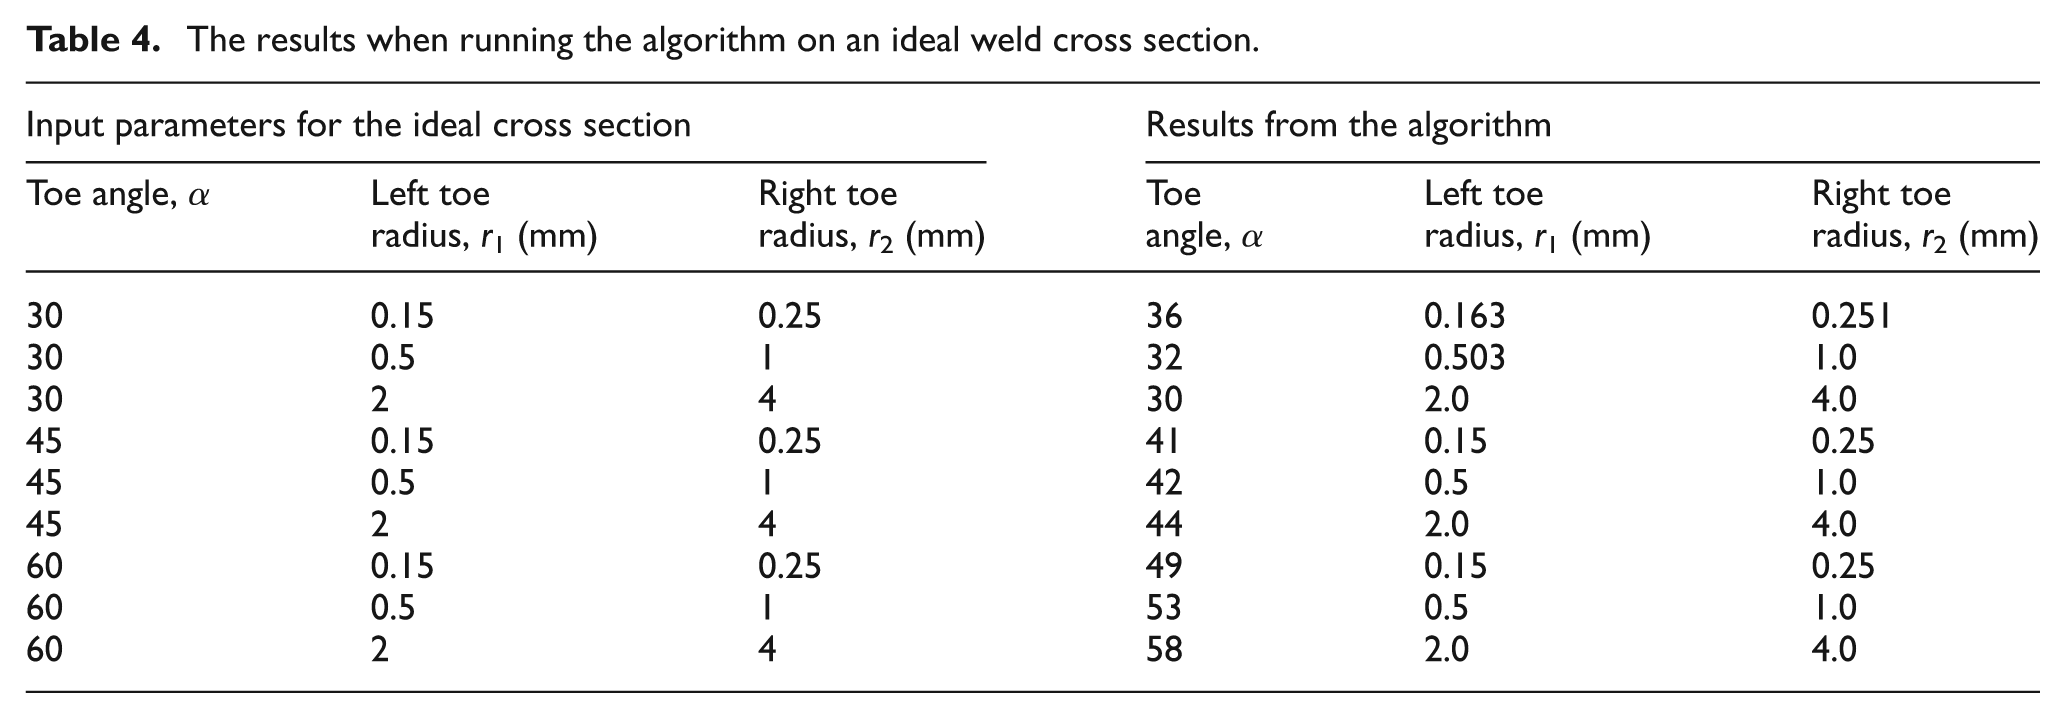
To test the algorithm on a reference surface, a welded surface is generated with the input parameters; r1, the left toe radius [mm], r2, the right toe radius [mm] and α the toe angle [°]. The results for different geometrical input parameters are shown in Table 4. As seen, the results match with the input parameters.
The results when running the algorithm on an ideal weld cross section.
Welded joints
The result from running the algorithm on the cross section on a weld is shown in Figure 10. The measured data from the reference block in 3D mode and also the surface profiles from different test samples are presented in Table 5.
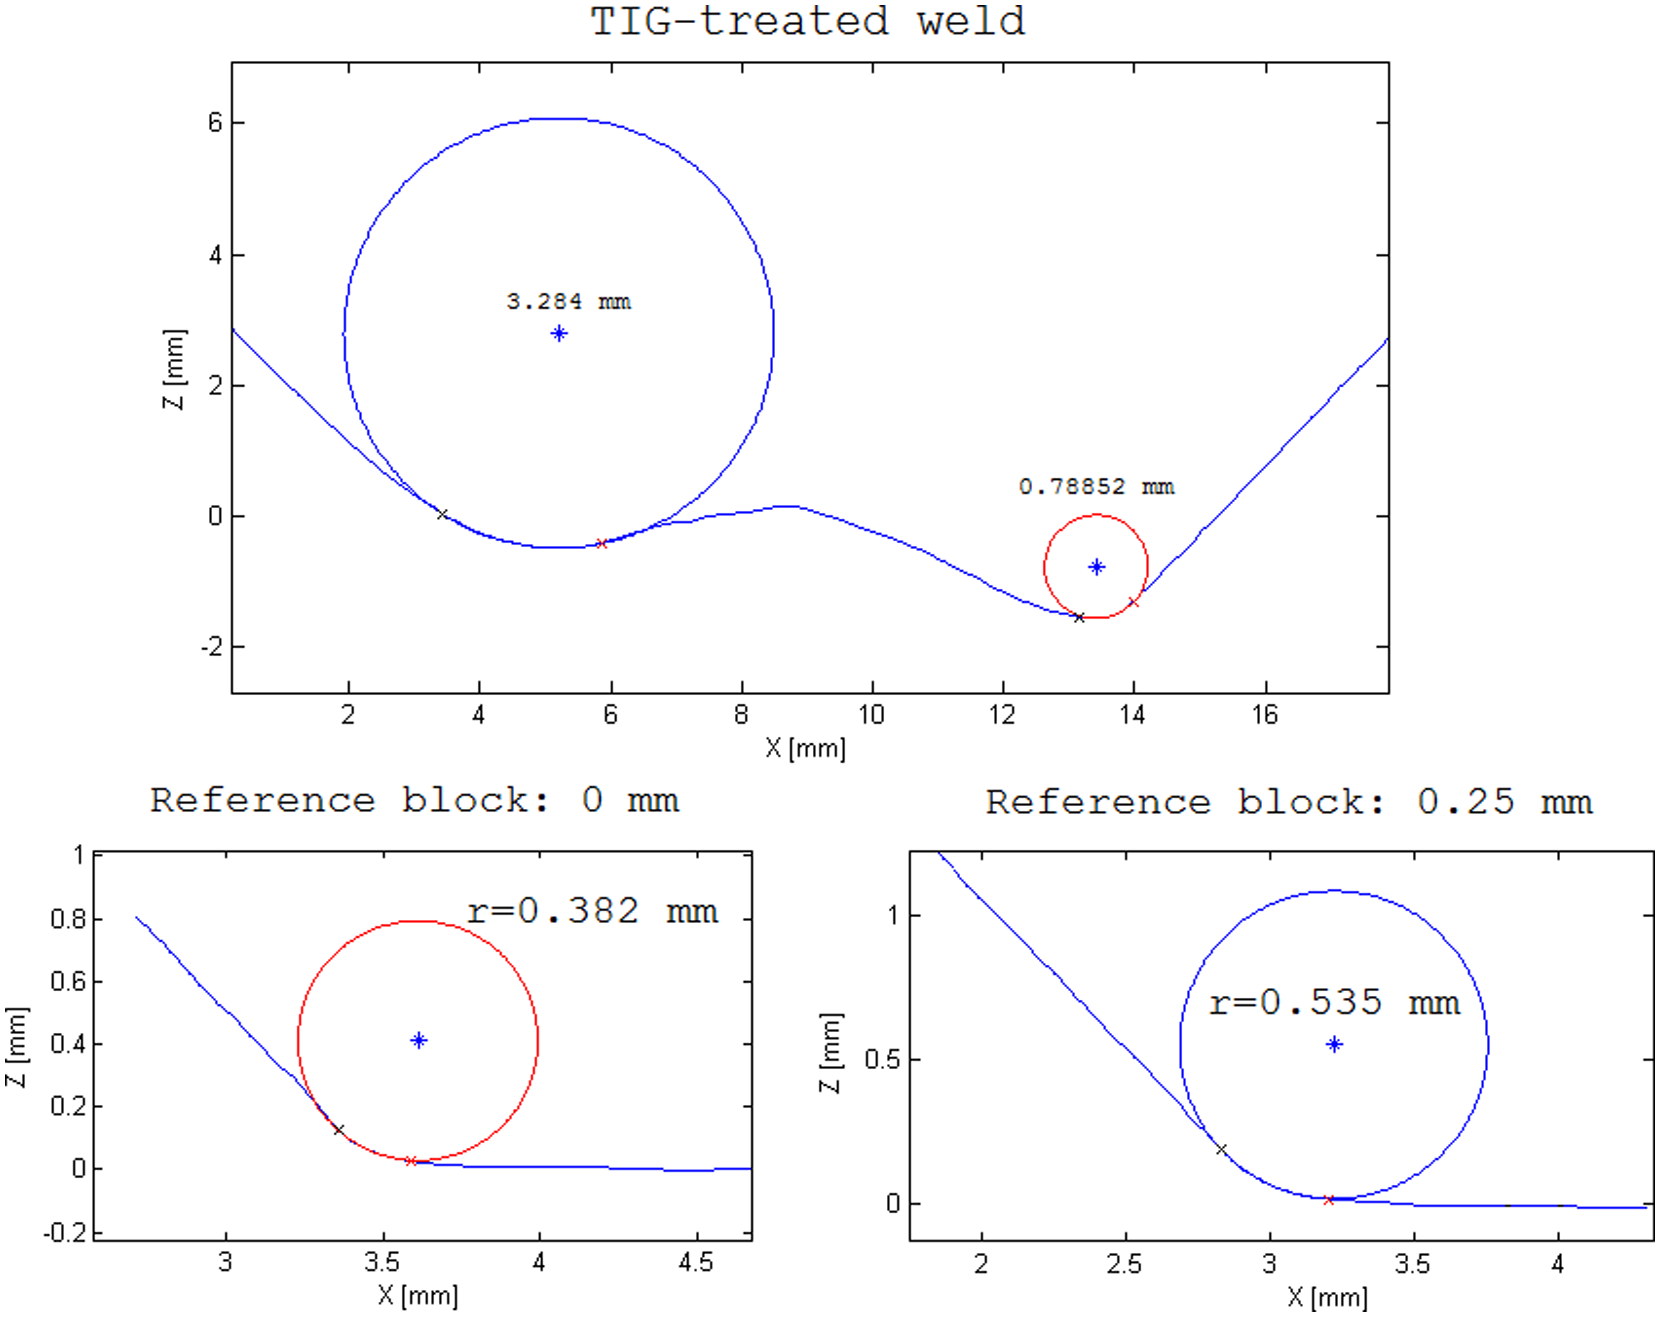
The toe radius on a TIG-treated weld and approximated toe radius in the 0 mm and 0.25 mm side of the reference block.
The results when running the algorithm on the reference block and the measured test specimens.
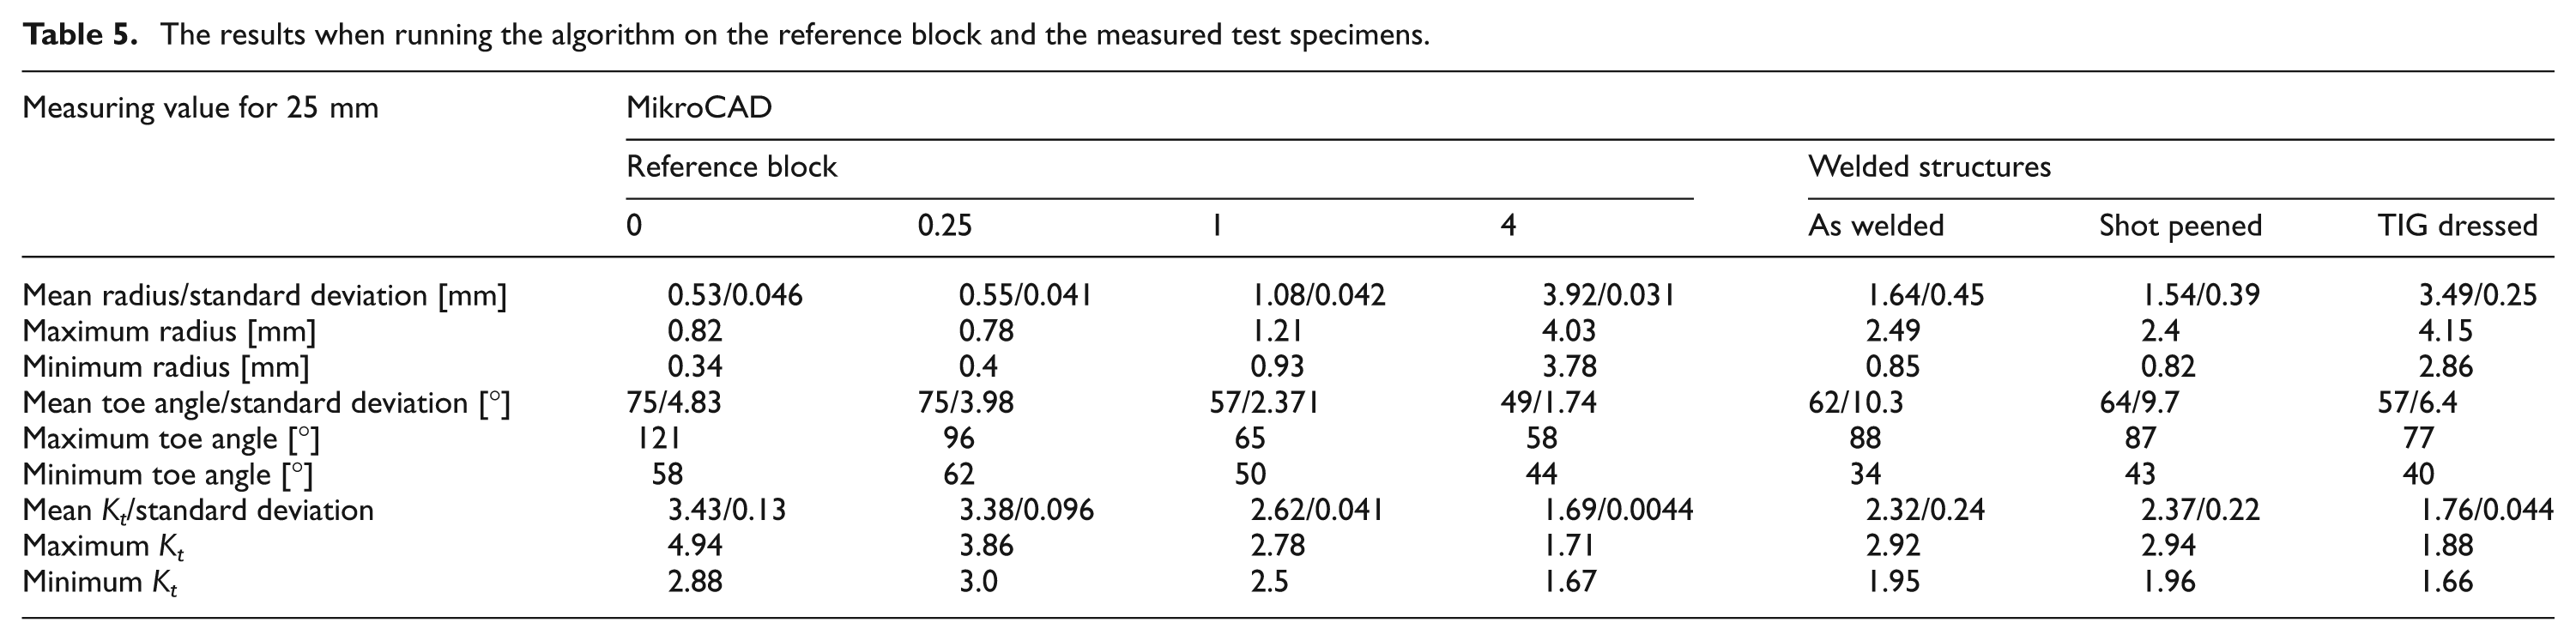
All the results for the weld toe radii have a low standard deviation, although the radial value for the 0 mm and the 0.25 mm side is not consistent with the manufactured radius. A randomly picked cross section from the 0 mm side and the 0.25 mm side of the reference block is shown in Figure 10.
The approximated radius fits the profile accurately. The possible causes of this phenomenon are (a) the precision and accuracy of the wire-EDM machine, and (b) the large diameter (0.17 mm) of the wire.
Using a surface profile with higher resolution
To verify the surface profiles acquired with the MikroCAD system, a confocal microscope, Olympus LEXT OLS3000, was used. A test sample was randomly selected and an area of 4 × 6 mm in the lower weld toe (left side in a cross section) was scanned with the confocal microscope. The results for the confocal microscope and the surface profile acquired by the MikroCAD are shown in Table 6.
A comparison between the MikroCAD and the Olympus LEXT OLS3000.
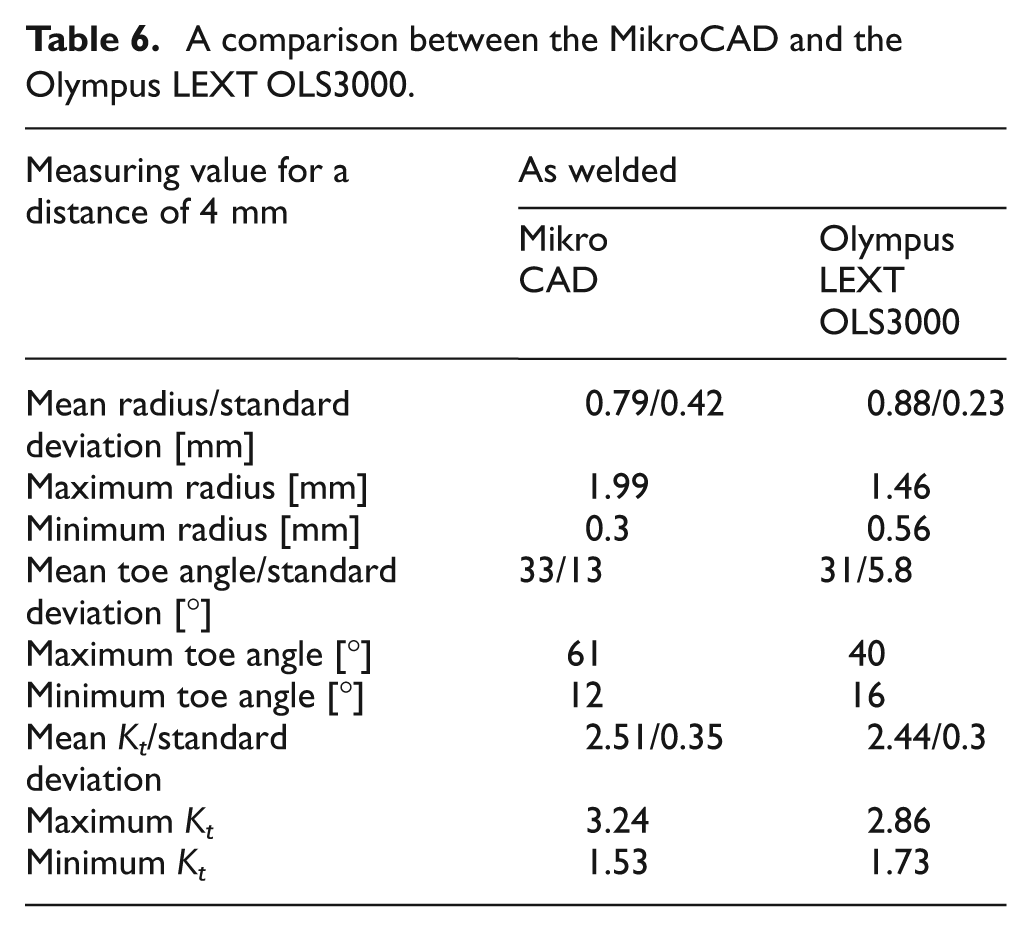
Similar results are obtained except for the standard deviation for the toe radius and the toe angle. A probable explanation is that the technique used in the confocal microscope has a higher measuring accuracy and precision, which provides more stable measuring points. Thus, the fitting of the circle will be more accurate on a confocal profile than using the MikroCAD profile.
Discussion
The MikroCAD system has a measuring accuracy of 15 µm in a laboratory environment. A rule-of-thumb according to Barsoum and Samuelsson 13 states that the system is then able to measure 150 µm in a production environment. The repeated measurement of the welded test samples has shown that a common geometric case is radius in radius (a small radius at 0.15–0.3 mm inside a global radius of 1–2 mm). According to Radaj and Sonsino 14 regarding the relationship between the notches and the material properties, these types of cases are not supported by the fatigue assessment methods for welded structures used today.
In order to expand the accuracy of fatigue-life assessment of welded structures it is important to incorporate the effect of local material inhomogeneities on the stress concentration in notches. The presented algorithm has the ability to find these types of inhomogeneities in the zone of the radius.
The need to develope an algorithm to evaluate the measured profile has been mentioned. The main point is that an algorithm processes a surface profile objectively, whereas operators would treat it more subjectively. This is important when many different operators are involved with the weld inspection process. Also, a fully developed algorithm gives the benefit of having a better process control during welding. This methodology could be used for quality control of welds, not only in construction machineries, but also in other fields of industry, e.g. shipbuilding, windmill and offshore, where the welding process is the major part of the production process.
Besides using vision systems with a structural light, other approaches using laser-based quality inspection have been investigated by Huang and Kovacevic15–16 that show accurate results and could be an alternative to a vision system. Laser-based vision systems would have a better accuracy measuring small size radii in the weld. Other possible approaches worth investigating could be electromagnetic transducer 17 or infrared and ultraviolet photodiodes. 18 The overall goal is to be able to implement an inspection procedure for the serial production of the weld surface in robotic arc welding, similar to the inspection of seam weld defects and incomplete weld penetration. 19
One of the greatest obstacles when measuring and calculating the radius on very small objects, as in a weld toe, is to verify the results. When processing the reference block, the difference between the expected toe radii increased when processing the sides with the radius of 0.25 mm and ‘0 mm’. Even when studying the results with the approximated radius on the profile, Figure 10, the fit is acceptable.
Conclusions
An algorithm that is able to measure the toe radius on a welded surface has been developed. The following conclusions can be made.
The vision system MikroCAD was found able to gather data for evaluating the toe radius on a test sample in a laboratory environment. In a production environment though, the usage of the MikroCAD is inappropriate owing to bulkiness and process time.
The performance of the developed algorithm is comparable with a commercial program when processing the reference block.
The local surface inhomogeneity in the zone of the radius probably influences the fatigue strength. This requires further investigation in order to quantify the degree it affects the fatigue life of the structure.
Footnotes
Acknowledgements
The authors would like to thank Vinnova and Volvo Construction Equipment AB for financial support. The staff at Swerea KIMAB AB is also acknowledged for their technical support.
This research received a grant from Vinnova funding agency in the public sectors within the research project WIQ; Weight reduction by Improved weld Quality.