
Abstract
The aim of this article is to predict the failure load in resistance spot welded aluminum 6061-T6 sheets with 2 mm thickness under quasi-static tensile test. Various welding parameters, e.g. welding current, welding time and electrode force are selected to produce welded joints with different quality. The results show that for all the samples in this study only interfacial failure mode was observed in tensile-shear test and no pull-out mode was observed. According to the failure mode, an empirical equation was used for the prediction of failure load based on nugget size and hardness of failure line. Microstructure study has been carried out to investigate microstructural changes in the welded joints. For determination of the minimum hardness, microhardness tests have been carried out to find hardness profiles. The minimum hardness value was observed for a thin layer around the nugget with large and coarse grains. The results show that by using the presented empirical equation, the failure can be predicted with a good agreement only by measuring nugget size.
Introduction
Resistance spot welding (RSW) is the primary technology in joining sheet metals in mass production and has been used for decades to join structures within automotive and aeronautical industry. The process is ideal to join low carbon steel, stainless steel, nickel and aluminum or titanium alloy components with various thicknesses. Although spot welding of aluminum alloys is more difficult than steels because of their narrow plastic range, low bulk resistance and greater thermal conductivity, aluminum alloys are used for the bodies and chassis of many components owing to their lightweight and relatively high strength, which results in the reduction of the vehicles structural weight, the fuel consumption and the exhaust emissions.1–3
Typically, a modern automotive vehicle contains 2000–5000 spot welds and joint quality and performance can dramatically alter the structural operation of vehicles. It has a critical role in durability and safety design of vehicles, 4 so control of welding parameters is necessary to obtain high weld quality and to increase the vehicle’s life. Generally, two main static failure modes for weld strength tests exist and are determined by using a quasi-static tensile test (lap shear test) and cross tension test. These failure modes are namely interfacial (IF) and pull-out (PL) failure mode. 1 Previous studies show that welds that failed in PL mode have statistically higher strength and energy absorption than those that failed in IF mode. 4 Thus industries typically prefer PL failure mode and try to set welding parameters to achieve PL failure mode.
Many researchers, however, have worked to find critical welding parameters and an optimum nugget size that could predict a PL failure mode in spot welding of steels and many equations have been developed and recommended,4–7 but studies on failure mode in aluminum alloys are scarce. Sun et al. 8 studied the failure load and the failure mode of spot welds of aluminum alloys 5182-O and 6114-T4 in cross-tension tests. Cho et al. 9 studied the effect of abnormal process conditions on the RSW of steel and aluminum and show that the RSW of aluminum is more sensitive than steel. Pereira et al. 1 carried out studies on the effect of process parameters on the strength of RSWs in 6082-T6 aluminum alloys with 1 mm sheet thickness under quasi-static tensile test and recommended a model for calculation of a critical nugget size to achieve PL failure mode. Recently, Han et al. 10 studied failure load in lap shear, cross tension and coach peel of resistance spot welded aluminum AA5754. These studies show that existing models for spot welds in steel sheets are not valid for aluminum alloys.
Previous studies have been done on failure mode and mechanical strength of resistance spot welded aluminum alloys with 1 mm thickness, but it seems that more studies on failure mode and mechanical strength of spot welded aluminum alloys with more than 1 mm thickness are required; owing to aluminum’s thermal conductivity and dynamic electrical resistance, spot weld of aluminum is more complicated and sensitive than steel. In addition, increase of the sheet thickness makes it more challengeable. The objective of the present study is to predict the failure load in quasi-static tensile test of resistance spot welded heat-treatable aluminum 6061-T6 sheets with 2 mm thickness. This work tries to prepare further fundamental understanding in the relation between microstructural and microhardness with mechanical strength of the spot welded joint. The rest of the article explains the experimental procedures, the results are discussed and then conclusions are given.
Experimental procedure
Heat-treatable aluminum alloy 6061-T6 sheets of 2 mm thickness were welded as a lap joint with 100 mm × 25 mm × 2 mm size (Figure 1). The nominal chemical composition and mechanical properties of the base material are given in Table 1. The RSW is performed with a NIMAK type PMP11 DGS, a.c. machine with nominal welding power at 200 kVA. Welding was done with copper electrodes.
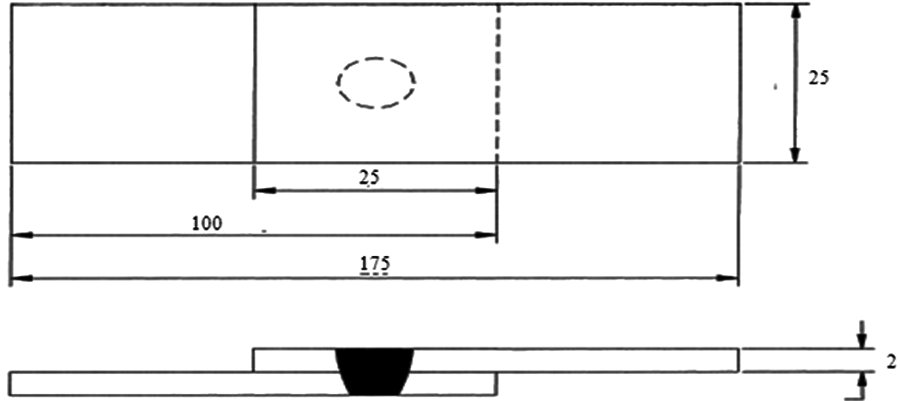
Dimensions of samples (dimensions in mm, not to scale).
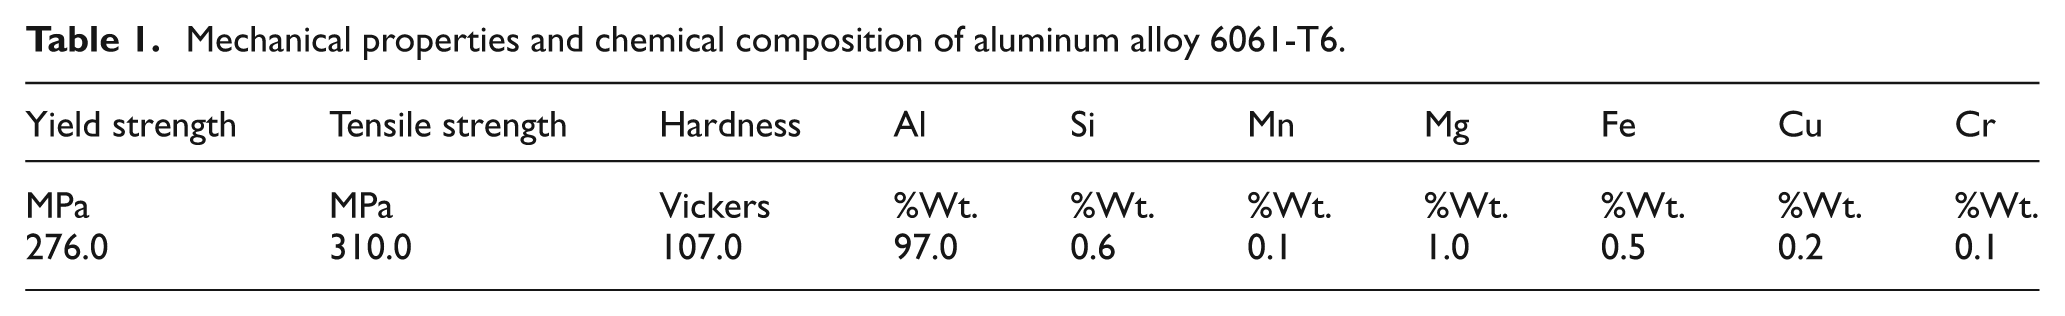
Mechanical properties and chemical composition of aluminum alloy 6061-T6.
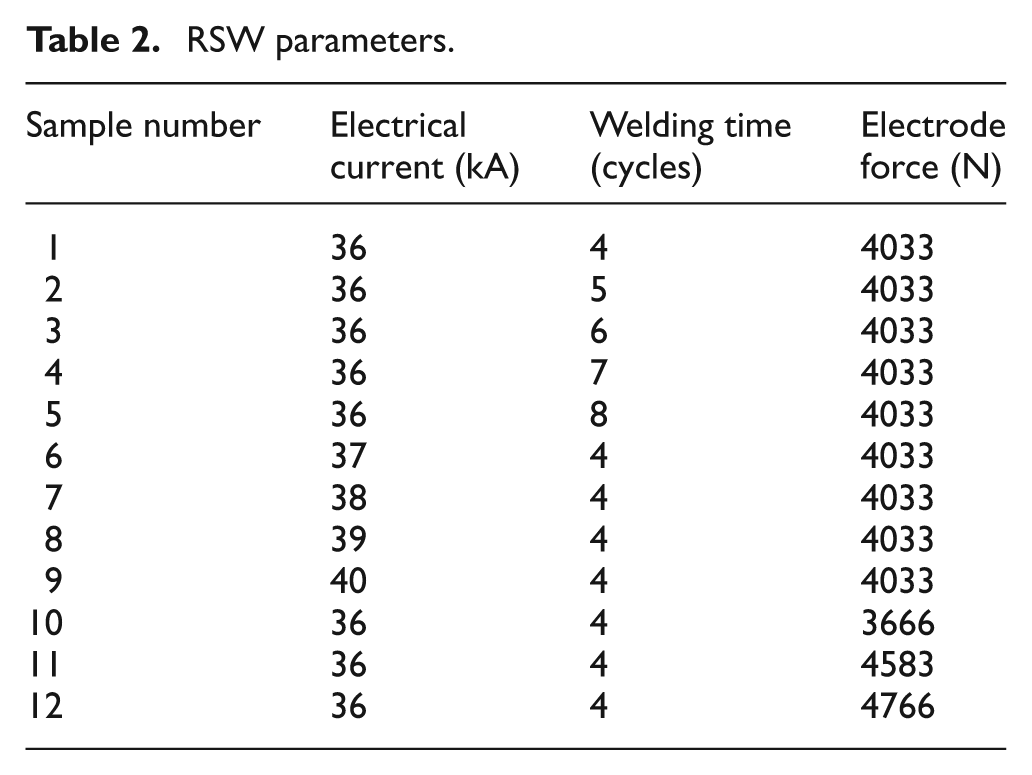
To study the failure load, 12 different sets of spot weld conditions, including welding current, welding time and electrode force, are selected to produce spot welded joints with different qualities. The first sets of spot welding conditions were based on recommendations by the American Welding Society (AWS). 11 Each parameter increases in the next sets in order to avoid expulsion in the welding zone. Table 2 summarizes the 12 different sets with the corresponding welding parameters. To evaluate the mechanical strength of spot welded joints, a quasi-static tensile test was carried out at a constant cross-head speed of 1 mm/min with a universal testing machine. To investigate the effect of the microstructure of the weld zone on mechanical strength, one sample in each series was cut along the center of the nugget and prepared in order to study the microstructure and measure the nugget size. Also, microhardness measurements were done under a load of 100 g in two directions (along the radius of nugget and through the sheet thickness) to evaluate the strength of the microstructure’s weld zone.
RSW parameters.
Results and discussions
Microstructures of weld zone
Since the weld quality and strength are completely related to nugget size, the metallographic analysis and microstructure studies are employed for better understanding of the microstructure’s weld zone and to measure the nugget diameter correctly. Figure 2(a) shows a typical macrostructure of the spot welded samples. Three distinct zones are clearly observed; base metal (BM), heat affected zone (HAZ) and fusion zone (FZ) or nugget. The microstructure investigation shows two different zones in the nugget area; grains with columnar structure oriented in the direction of heat flow around the nugget and new nucleation zone in the center, Figure 2(b). The reason for two different microstructures in the nugget zone could be the variation in the cooling rate within the nugget zone. 1

(a) Typical macrostructure of the welded sample (sample 1), (b) Microstructure of nugget (sample 5).
The microstructure in the HAZ is different from that of the nugget. In the area between nugget and HAZ, there is a thin zone with large and coarse grain; it could be attributed to abnormal grain growth owing to extremely high temperature. However, beyond this zone, the HAZ consists of very small and fine grains, Figure 3.

(a) Microstructure of the nugget and its vicinity with column grains and large coarse grains in the HAZ, (b) microstructure of the nugget and the HAZ.
Microhardness testing
Based on microstructure study, several measured points are defined in each microstructure weld zone for the microhardness test to determine the weakest area. Figure 4 shows a typical hardness profile for the spot weld joints. A significant decrease of hardness was observed in the nugget zone. The reduction of the hardness in the nugget is attributed to the dissolution of strengthening precipitates in 6000-series aluminum alloy welds, mainly in the T6 state.12,13 However, for spot welds in high-strength steels, an increase of the hardness in the nugget zone is reported elsewhere.4,8
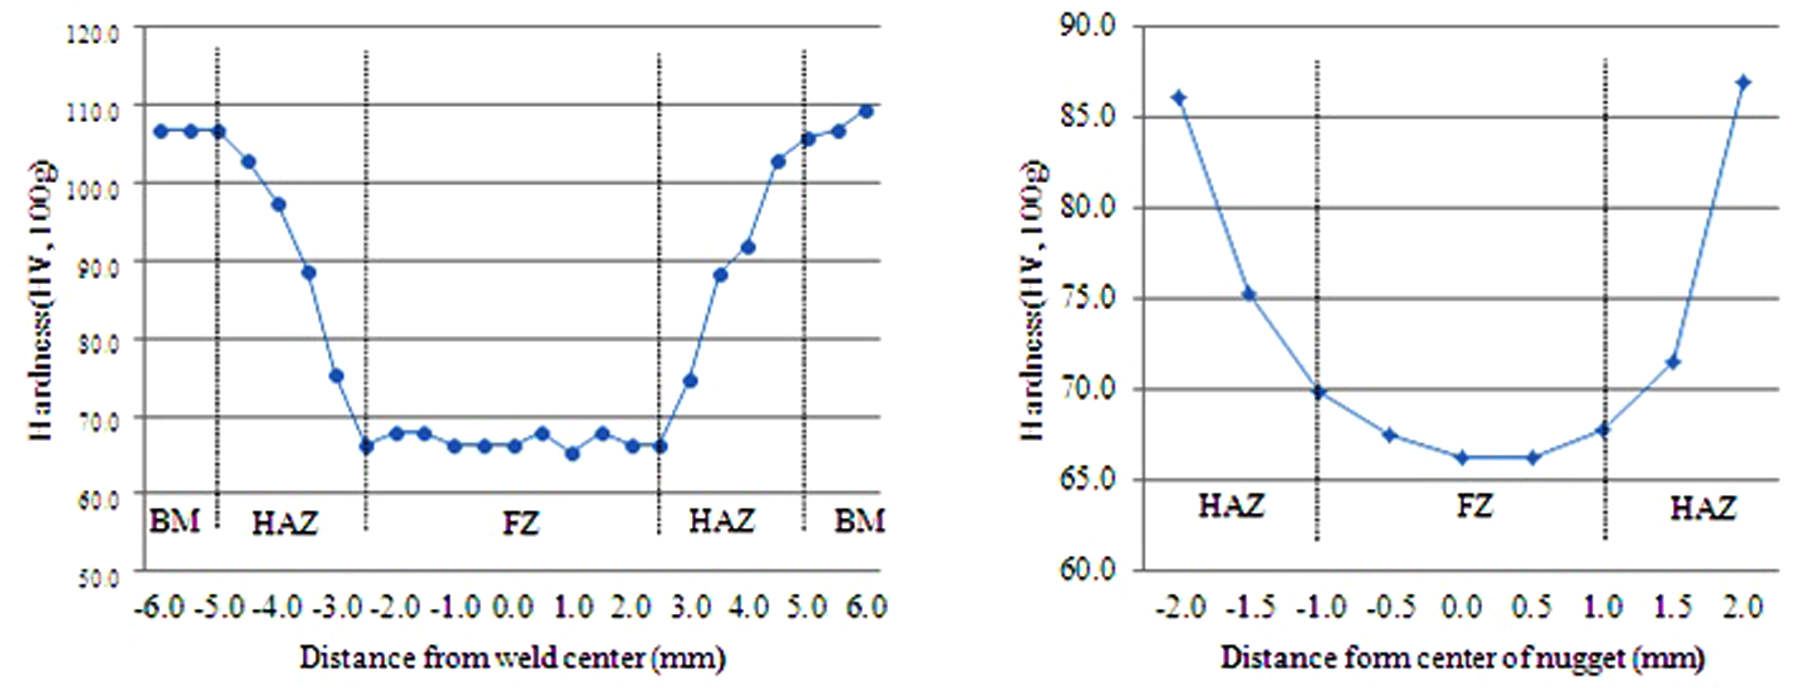
Hardness profile in the spot welds, sample 1: (a) along the radius of the nugget, (b) through thickness line.
The hardness of the nugget is similar for all the samples and no significant effect is observed when the electrical current, the welding time or the electrode force changes. However, the increase of electrical current and welding time decreases the hardness of the nugget and increases the width of the nugget and HAZ. The hardness in the HAZ exhibits a gradient between the nugget and base material (Figure 4). For all hardness profiles in this study, a significant fall was observed in the area between nugget and HAZ. Actually, the hardness of this zone is less than that of the nugget and all the zones in the welded joint. It seems that this decrease in hardness is related to the thick zone around the nugget, including large and coarse grains, and the failure or fracture can start from this area. In fact, the area between the nugget and the HAZ is the critical area in failure conditions and the failure line is created in this zone.
Failure load
All the samples within this study showed an IF failure mode during quasi-static tensile test, Figure 5. The results show that increasing the spot weld parameters has no effect on changing the failure mode. Figure 6 shows the electrical current effect on the failure load and nugget size, while the welding time and electrode force are kept constant. By increasing the welding current, from 36 kA to 40 kA, heat input increases, which leads to increasing nugget size from 5.8 mm to 8.5 mm, Figure 6(a). Similar results were observed in failure load, which raised from 3265 N to 4798 N, Figure 6(b).
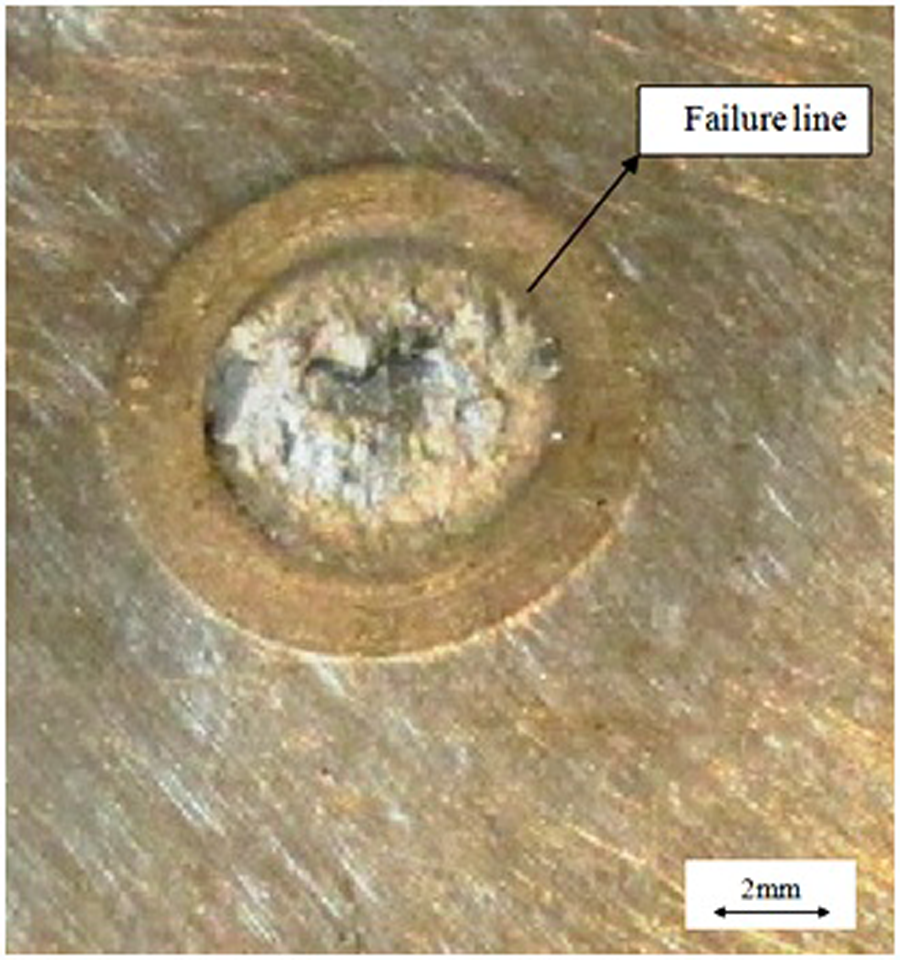
Interfacial failure mode.
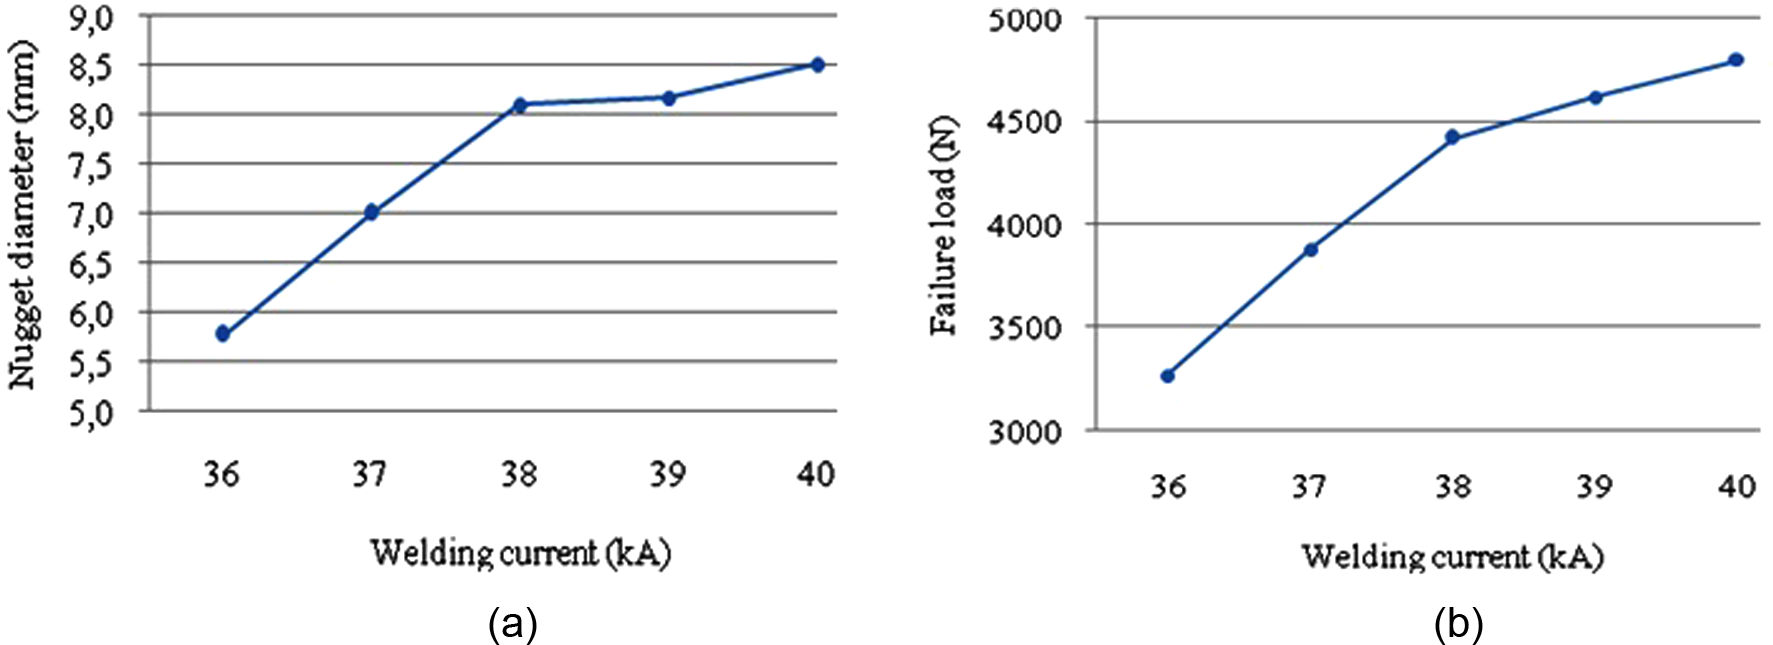
Effect of welding current on (a) nugget diameter, (b) failure load (welding time: 4 cycles; electrode force: 4033 N).
The effect of welding time on failure load and nugget size is similar to the effect of welding current. A longer welding time means a higher heat input to the FZ and thus causes an increase in nugget size and an improved failure load, Figure 7. The microstructure and microhardness studies also confirm the growth of nugget size based on the increase of the heat input. By increasing the welding time from 4 cycles to 8 cycles, the nugget diameter and failure load increases from 5.8 mm to 8.0 mm and from 3265 N to 4256 N, respectively. However, while the effect of welding time on the nugget size and failure load is similar to the effect of the welding current, the welding current has a more significant effect on the failure load and the nugget diameter than the welding time.
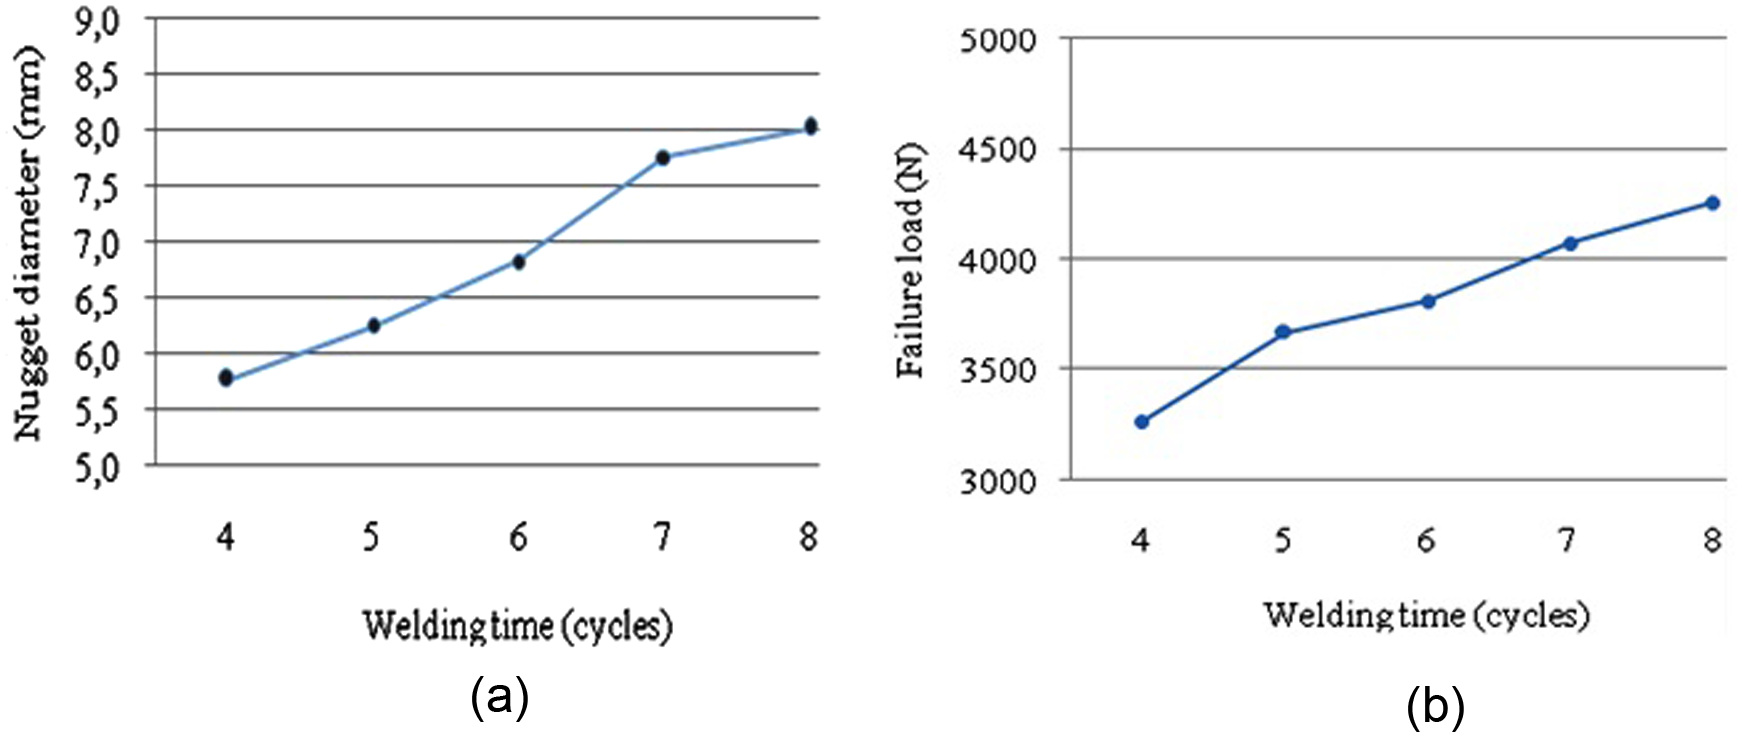
Effect of welding time on (a) nugget diameter, (b) failure load (welding time: 4 cycles; electrode force: 4033 N).
The effect of electrode force on failure load and nugget size is more complicated. As Figure 8 reveals, increasing the electrode force from 3666 N to 4583 N leads to an increase of the nugget diameter from 5.5 mm to 8.1 mm and failure load from 3088 N to 4414 N. However, when the electrode force is further increased to 4766 N, the nugget size and failure load decreases to 7.7 mm and 3973 N, respectively.

Effect of electrode force on (a) nugget diameter, (b) failure load (welding current: 36 kA; welding time: 4 cycles).
Totally, the electrical resistance of sheet metal is divided in two separate factors; static and dynamic electrical resistance. The resistance of unwelded sheet metal is defined as static resistance, which is constant for given welding parameters. However, the resistance of sheet metal varies over time during the weld stage, which is called dynamic resistance. The dynamic resistance is affected by welding parameters, such as current, time and electrode force. 14
An increase of the electrode force improves the contact between the sheets and electrodes and leads ease of current in the weld zone and growth of the heat input. On the other hand, an increase of the heat input and electrode force improves the contact between the sheets and causes a decrease in the dynamic electrical resistance and makes the heat input fall. Thus, effect of the electrode force on the nugget size depends strongly on the IF contact of the metal sheets and dynamic electrical resistance.1,7,14
Although the increase of welding current and welding time leads to nugget size increase and failure load improvement, only IF failure mode occurs for all the samples. The maximum nugget diameter in the current study is 8.5 mm, which also resulted in an IF failure mode. Any increase of the current and time more than 40 kA and 8 cycles causes an explosion and decrease of nugget size and a poor quality weld. It seems that for spot welded aluminum 6061-T6 with 2 mm thickness under quasi-static tensile test, only an IF failure mode can happen and the attempt to find and present a critical nugget size that guarantees PL failure mode is futile. Similar results were reported for spot welds in dual phase steel; only IF failure mode can occur in spot welded high-strength steel sheets with more than 1.7 mm thickness. 15
Failure load prediction
Assuming the shear stress is the principle stress that causes the IF failure mode in quasi-static tensile test and that it is distributed uniformly in the section zone, the failure load can be calculated with as

where d is the nugget diameter and

where HV is Vickers hardness and K is approximately constant in each family of material, so the failure load in equation (1) can calculate with
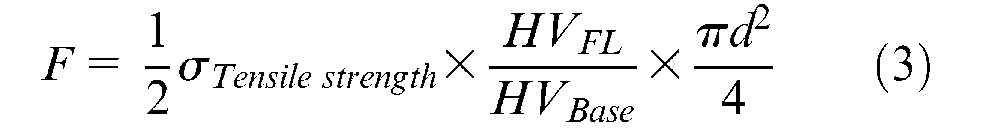
Where
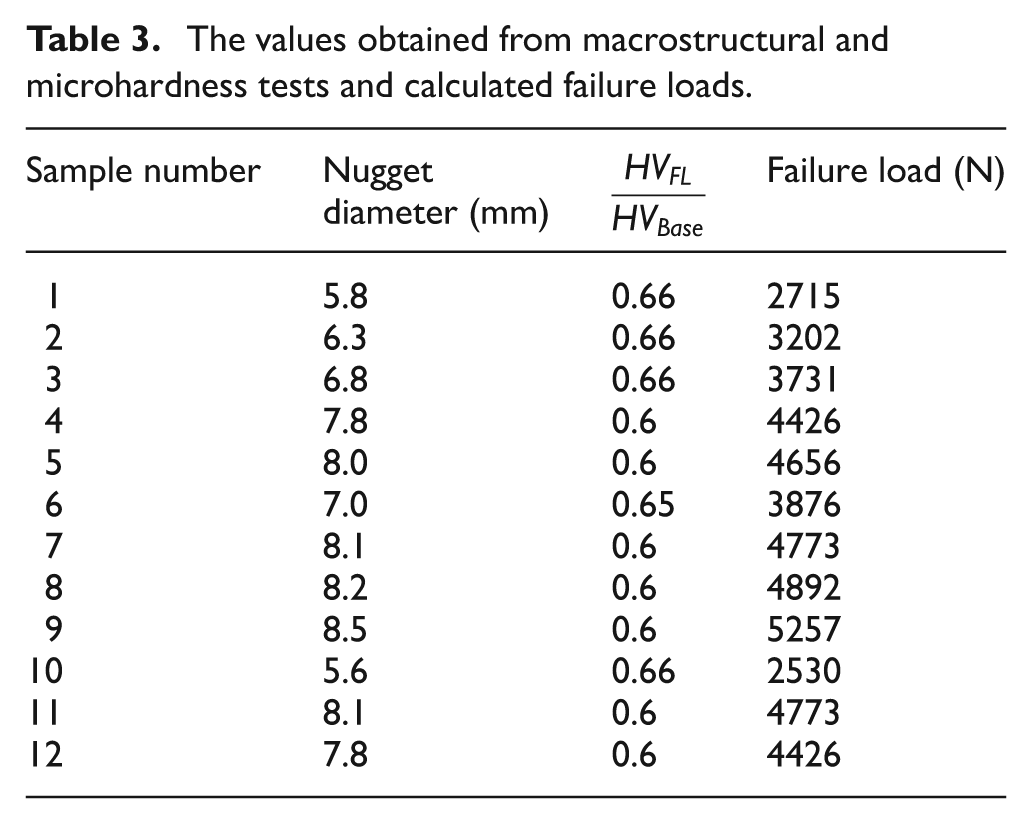
Regarding the hardness profile of spot welded joints presented in Figure 8, the area between the nugget and HAZ is assumed as the failure line. Actually, evaluation of shear strength in this area is very difficult because the area is very narrow, so based on equation (3), to calculate failure load in quasi-static tensile test, HVFL/HVBase is needed. The results show that, for all samples in this study, HVFL/HVBase is approximately constant and it is between 0.6 and 0.66. Indeed, by increasing input heat to the weld zone and increasing the nugget size, HVFL/HVBase decreases from 0.66 to 0.6. Perhaps it could be owing to an increase in the size of grains because of the increasing input heat. Further studies need to clear the effect of grains size in this area on the strength of the welded joints. Table 3 presents the values obtained from microstructural and microhardness studies for the calculation of the failure load and Figure 9 illustrates the compression between the results obtained from the quasi-static tensile test and the data calculated from equation (3). The results show a good agreement between calculated and experimental data.
The values obtained from macrostructural and microhardness tests and calculated failure loads.
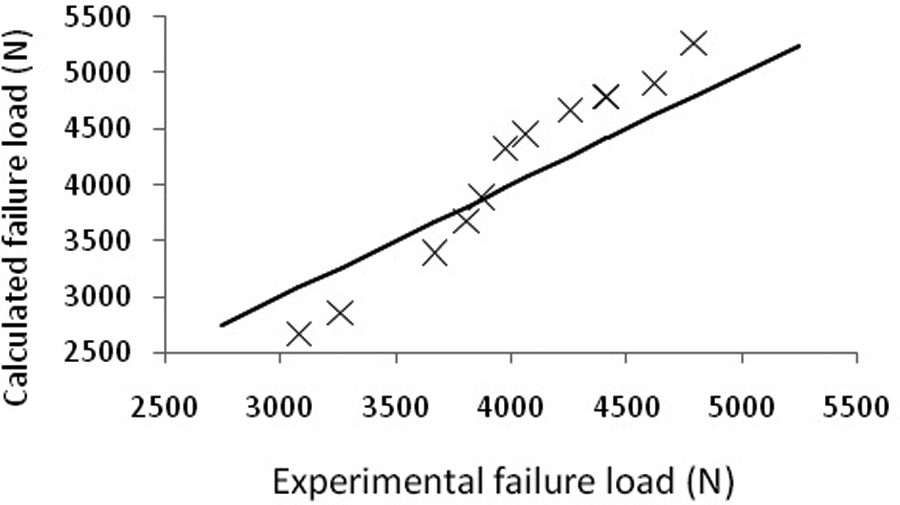
Compression between calculated failure loads and experimental failure loads.
Conclusions
In this study, the mechanical strength of the resistance spot welded heat-treatable aluminum 6061-T6 sheets with 2 mm thickness is examined under quasi-static tensile test. Various spot weld parameters are selected to produce joints with different weld quality. The results show that, by increasing welding current and welding time, the failure load is improved; but for all samples in this study only an IF failure was observed and no PL failure mode was observed. The maximum nugget diameter in the current study is 8.5 mm, which also resulted in an IF failure mode. It seems that, for spot welded aluminum 6061-T6 with a 2 mm thickness under quasi-static tensile test, any attempt to find and present critical nugget size that guarantees PL failure mode is futile. According to failure mode, an empirical equation is utilized to predict the failure load based on nugget size and the hardness of the failure line. Microstructure studies show that between the nugget and the HAZ, there is a thin layer with large and coarse grains. The hardness of this area is the lowest hardness of all zones. It seems that the area between the nugget and the HAZ is the critical area in failure conditions and the failure line is created in this area. The results of this study show that the failure load in a quasi-static tensile test can be calculated acceptably with the presented empirical equation and nugget size measuring.
Footnotes
Acknowledgements
Calibra AB Sweden is acknowledged for carrying out the spot welding and the Department of Solid Mechanics at KTH is acknowledged for assisting in hardness testing. A Billenius at Linköping Technical University is also acknowledged for samples preparation.
This research received no specific grant from any funding agency in the public, commercial, or not-for-profit sectors.