
Abstract
Factors like cutting force, cutting temperature, acoustic emission signals and vibration signals can be effectively used to predict tool wear. Even though each of these factors can be used individually to predict tool wear, a more accurate prediction will be possible if these factors are considered collectively since each of these factors predicts tool wear in its own characteristic fashion. For example, high cutting temperature is an index of flank wear and crater wear, whereas variation in cutting force indicates the fracture type of tool failure more effectively. Hence a better prediction of tool wear is possible by considering the indices of tool wear collectively rather than individually. In the present work, an attempt was made to fuse cutting force, cutting temperature and displacement of tool vibration, along with cutting velocity, feed and depth of cut, to predict tool wear during turning of AISI 4340 steel having a hardness of 46 HRC using a multicoated hard metal insert with a sculptured rake face. A regression model and an artificial neural network model were developed to fuse the cutting force, cutting temperature and displacement of tool vibration signals to predict tool flank wear. The fusion model based on the artificial neural network was found to be superior to the regression model in its ability to predict tool wear.
Introduction
Recently, the concept of hard turning has gained considerable attention in metal cutting as it can apparently replace the traditional process cycle of turning, heat treating and finish grinding for assembly of hard wear-resistant steel parts. 1 Hard turning can possibly facilitate low process cost, low process time, better surface quality and lower waste. 2 In hard turning, tool wear becomes an important parameter affecting the surface quality of finished parts. Tool wear is a highly complex phenomenon which can lead to machine downtime, product rejects and can also cause problems to personnel. High cutting force, excessive cutting temperature and increase in tool vibration are indications of progressing tool wear. In other words, cutting force, cutting temperature and vibration signals can be considered as symptoms of tool wear (Figure 1) and these symptoms can be analysed individually and collectively to predict tool wear. It is possible to predict tool wear by considering the symptoms individually. However a more accurate prediction is possible by considering cutting force, cutting temperature and displacement of tool vibration signals along with input parameters like cutting velocity, feed rate and depth of cut collectively. Dureja et al. 3 analysed the influence of cutting speed, feed rate, depth of cut and workpiece hardness on progressive tool flank wear in the steady wear region.
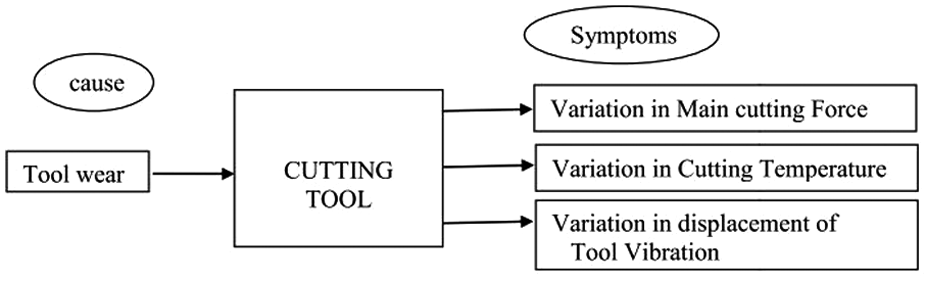
Symptoms of tool wear.
According to Leo Dev Wins et al., 4 a model can predict tool wear better when symptoms are considered collectively rather than when they are considered individually. Just as a doctor predicts the root cause/severity of disease accurately by considering a greater number of symptoms, accurate prediction of tool wear and timing of tool change can be achieved more precisely by developing a model that considers a greater number of symptoms of tool wear.
Machining operations such as turning involve models that are highly nonlinear in nature. Although analytical models can provide better insight into the underlying physical wear progression mechanism, they are sometimes less accurate as they are often subjected to simplifications and assumptions. Among the artificial intelligence-based modelling approaches that are suitable for real-time applications, the artificial neural network (ANN) is considered a viable, reliable and attractive approach for tool wear prediction5,6 due to the following reasons:
ANNs are highly apposite in modelling nonlinear processes;
the data-driven feature of ANN models makes them specially suitable for problems that involve a large amount of data handling;
ANNs are good at fault tolerance and adaptability and hence suitable for predicting tool wear during metal cutting processes that are always subjected to noisy environments.
Among the ANN approaches, the perceptron-type neural network has been used to predict tool state during turning operations. 7 Back-propagation is another popular approach in neural networks which can be used to predict tool wear. Alajmi and Alfares 8 used this method to predict cutting force by considering parameters like speed, feed rate, depth of cut, nose wear, flank wear, notch wear, feed force, vertical force and radial force. The predictions of the model matched the experimental results well. The neural network-based approach can also be used for online fault diagnosis schemes to monitor the level of tool wear, chatter vibration and chip breaking in a turning operation, as reported by Rahman et al. 9 Özel and Karpat 10 utilized neural network modelling to predict surface roughness and tool flank wear during finish hard turning. Tool wear prediction can also be done using an adaptive neuro-fuzzy inference system. Sharma et al. 11 used this method to predict tool wear using cutting forces, vibrations and acoustic emissions. Zain et al. 12 investigated the suitability of an ANN model in predicting surface finish during milling.
Regression analysis can also be used to predict tool wear. Feng and Wang 13 developed an empirical model using nonlinear regression analysis with logarithmic data transformation during turning of 8620 steel of hardness 86HRB with carbide inserts having multiphase coatings. They studied the influence of workpiece hardness, feed, tool point angle, depth of cut, spindle speed and cutting time on the surface roughness.
In the present study, tool wear symptoms are considered collectively, leading to a more accurate prediction of tool wear than is possible when these symptoms are considered individually, as is the case with most of the models. An attempt is made to fuse the operating parameters along with cutting force, cutting temperature and displacement of tool vibration using regression models as well as an ANN model to predict tool wear during turning of hardened AISI 4340 steel.
Selection of work material
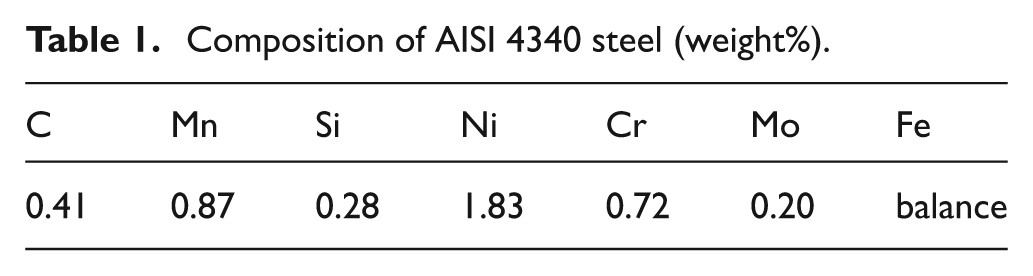
The workpiece material was AISI 4340 steel which was hardened to 46 HRC by heat treatment. Çayda 14 studied the performance of cubic boron nitride, ceramic and carbide cutting tools and the effect of workpiece hardness between 360 and 460 HV on machinability responses. From the literature it was observed that AISI 4340 steel is a general-purpose material that has a wide range of applications in the automobile and allied industries by virtue of its good hardenability, enabling it to be used in fairly large sections. Bars of 75 mm diameter and 320 mm length were used in the present investigation. The chemical composition is presented in Table 1.
Composition of AISI 4340 steel (weight%).
Selection of tool
The tool holder used had the specification PSBNR 2525 M12. Multicoated hard metal inserts with sculptured rake face geometry, having the specification SNMG 120408 MT TT5100 from M/S TaeguTec India (P) Ltd, were used as cutting tools in this investigation.
Experimental setup
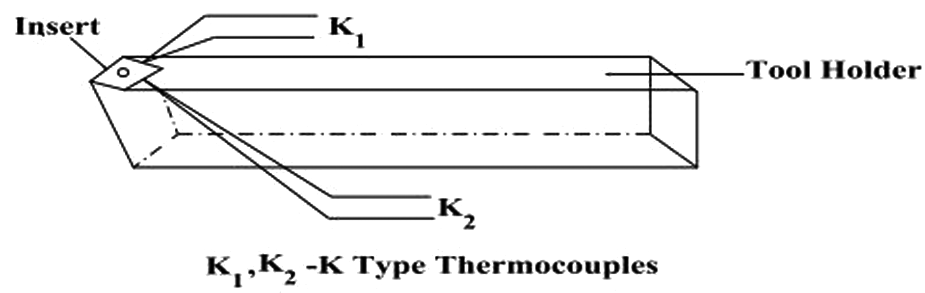
Experiments were carried out on a KirloskarTurn master-35 lathe. A photograph of the setup used for the present investigation is shown in Figure 2. The main cutting force, flank wear, displacement of tool vibration and average cutting temperature were measured during each experiment. The main cutting force was measured using a Kistler tool force dynamometer. The flank wear was measured using a scanning electron microscope by moving the cross wires to appropriate locations and noting the readings. A photograph showing tool wear is presented in Figure 3. Displacement of tool vibration was measured using a piezoelectric-type vibrometer; the pickup of the vibrometer was mounted at the bottom of the tool holder as shown in Figure 4. The average cutting temperature was measured using an extrapolative measuring technique reported by Varadarajan et al. 15 based on finite element analysis. The tool–workpiece thermocouple technique is widely used for measuring cutting temperature but requires a reliable method of calibration, which is difficult to accomplish especially when the tool is in the form of an insert. Frequent short-circuiting by the chip complicates the measurement of thermoelectromotive force. Two standard K-type thermocouples were implanted at the interface between the cutting tool insert and the holder symmetrically. The bottom of the insert and the two sides were insulated for thermal isolation of the insert from the tool holder as shown in Figure 5. The temperature as indicated by the two thermocouples was measured simultaneously 60 s after the commencement of cutting to achieve a steady-state condition in the insert. A correlation was developed between the nodal temperature and the average temperature of the tool tip using a finite element model which was validated using the tool–workpiece thermocouple technique. This method can provide a more accurate method of predicting cutting temperature since the nodal temperatures are measured using standard thermocouples.
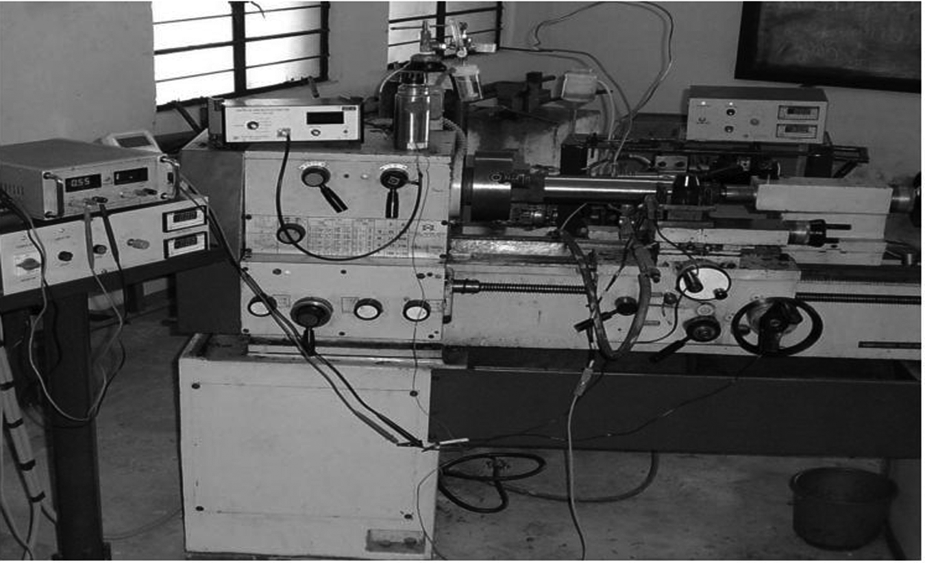
Photograph of the experimental setup.
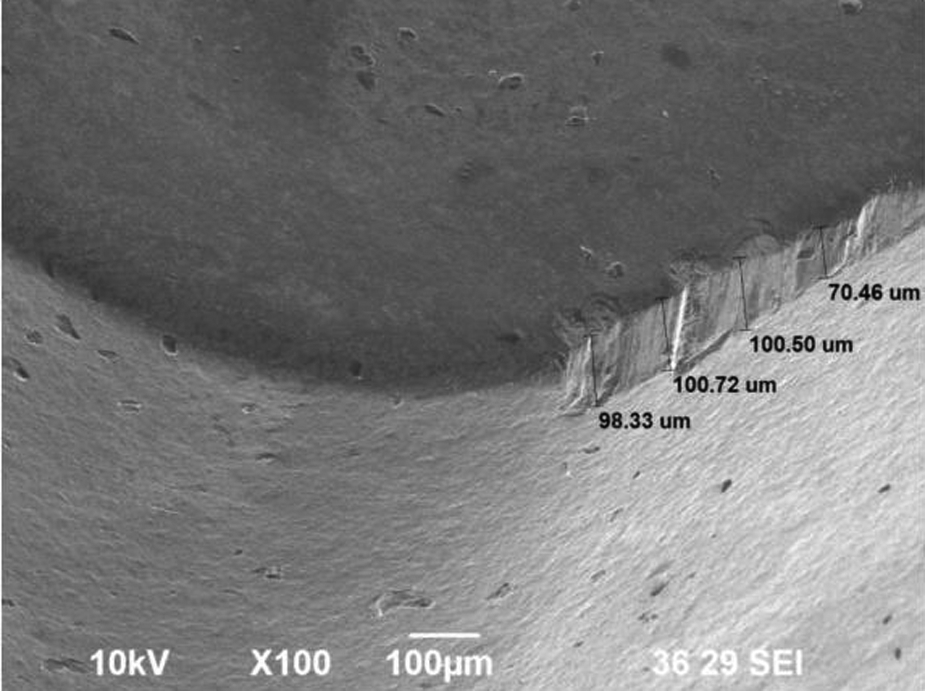
Photograph showing flank wear during dry turning.
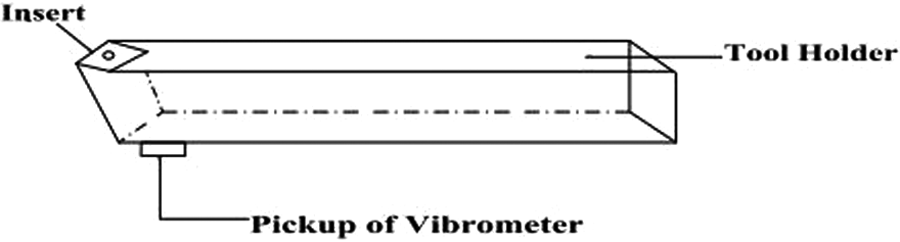
Location of the vibrometer pickup.
Extrapolative prediction of cutting temperature during turning. 15
Design of experiments
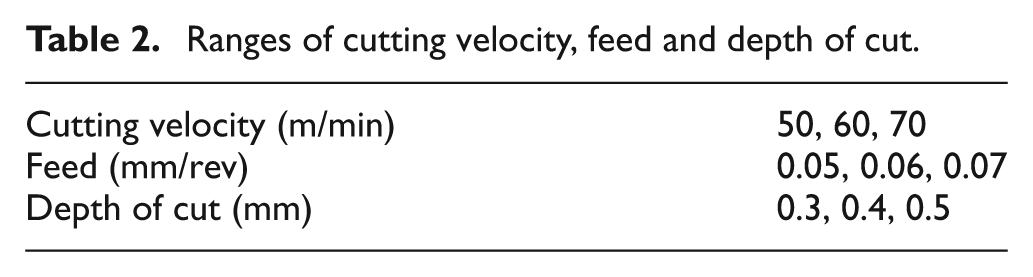
A 27-run experiment was designed based on the Taguchi technique in which the input variables, namely the cutting velocity, feed and the depth of cut, were varied at three levels. Experiments were conducted with two replications. In this study, experimental work was carried out in dry turning. Cutting velocity, feed rate and depth of cut were varied at three levels (low, medium and high) as shown in Table 2. The main cutting force, the average cutting temperature and the displacement of tool vibration were measured during each experiment and are presented in Table 3. Seven inserts were used in these experiments and each experiment lasted for 2 min.
Ranges of cutting velocity, feed and depth of cut.
Data collected during the 27-run experiment.
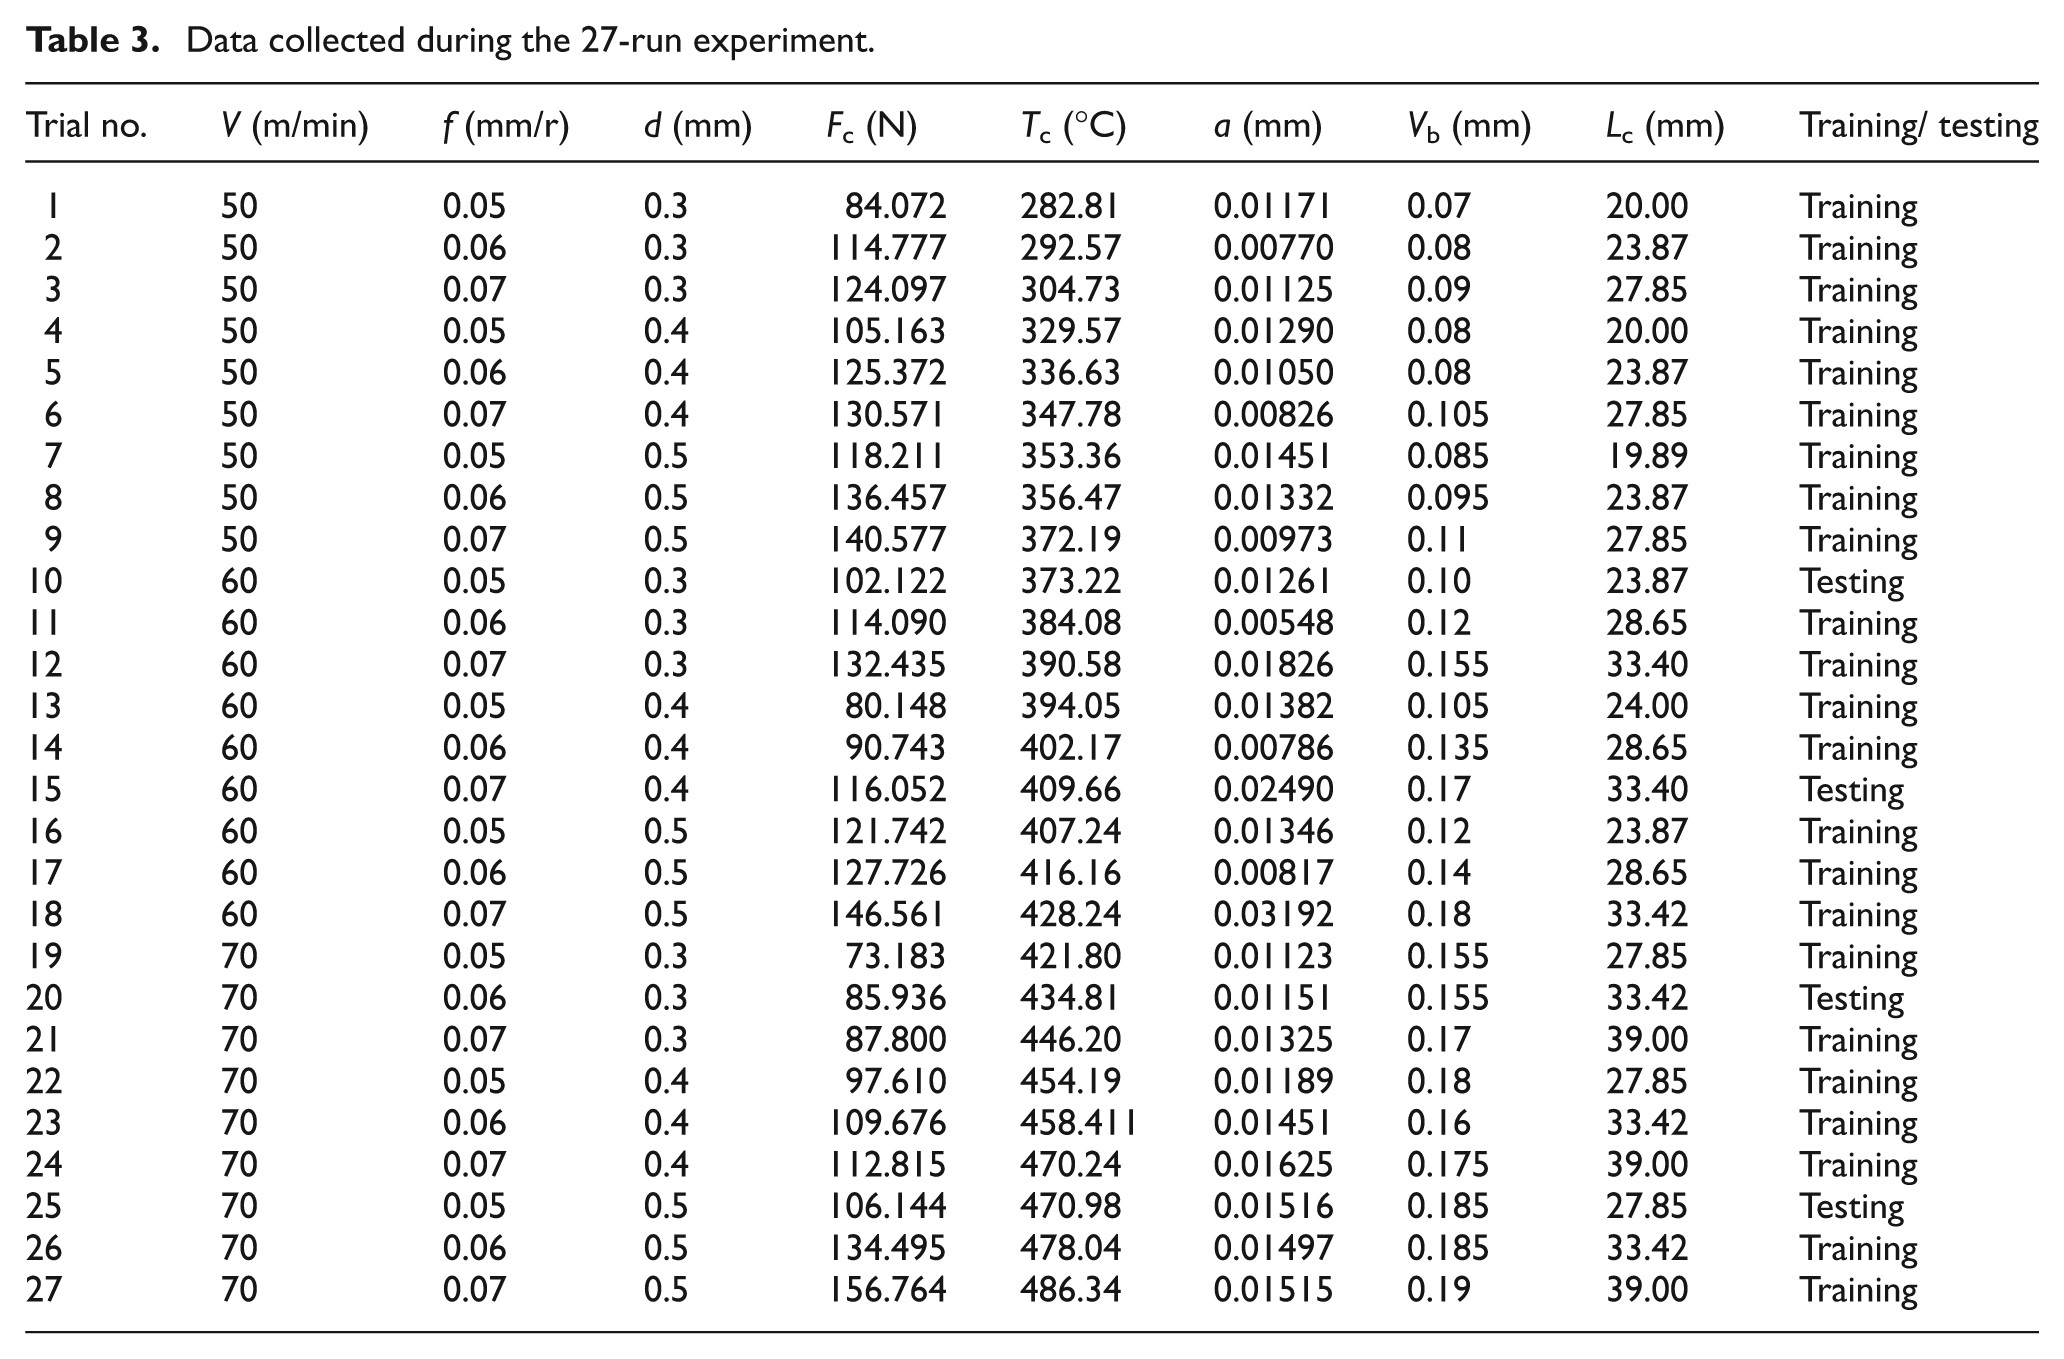
The cutting velocity, feed rate and depth of cut combinations were arrived at based on the results of preliminary experiments and the recommendations of the cutting tool manufacturer, M/S TaeguTec India (P) Ltd. These ranges are prescribed for turning in the semi-finish range for the tool–workpiece combination. The cutting length for each run is given in Table 3 and the experimental readings were taken based on the change in cutting velocity, feed rate and depth of cut conditions.
Sensor fusion using regression analysis
An attempt was made to fuse signals of main cutting force, cutting temperature and displacement of tool vibration along with cutting velocity, feed and depth of cut using linear and nonlinear regression models. This attempt is analogous to prediction of a cause by analysing the symptoms generated by the cause. The greater the number of symptoms available for analysis, the better will be the accuracy of the prediction of the root cause. In the present analysis, tool wear is the root cause. The main cutting force, cutting temperature and displacement of tool vibration form the symptoms. Equation (1) presents a linear regression model when tool vibration was not taken into consideration; equation (2) presents a linear regression model when tool vibration was also included; equation (3) presents a nonlinear regression model when tool vibration was not considered; and equation (4) presents a nonlinear regression model when tool vibration was included.
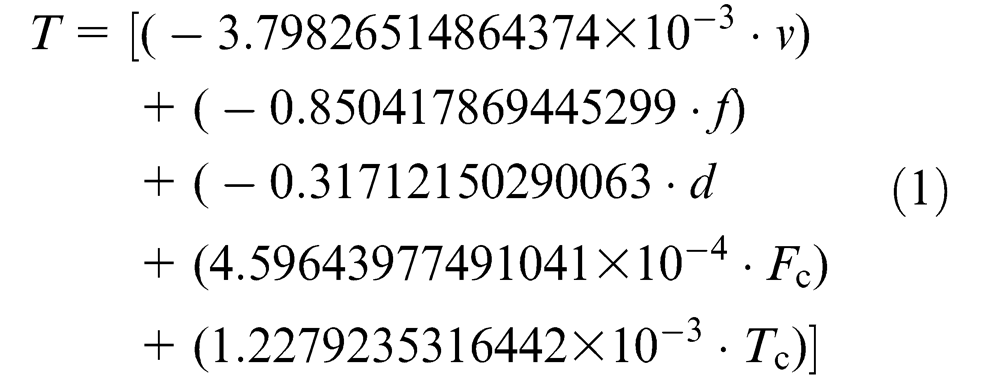
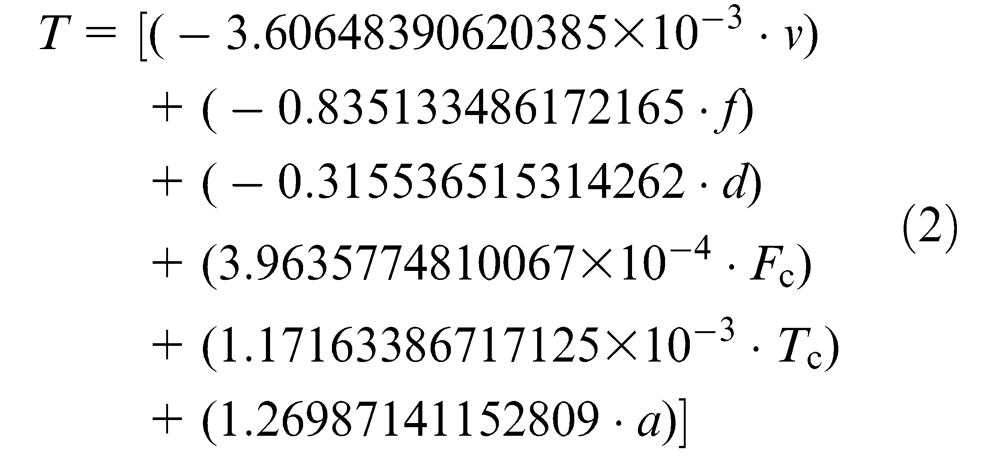
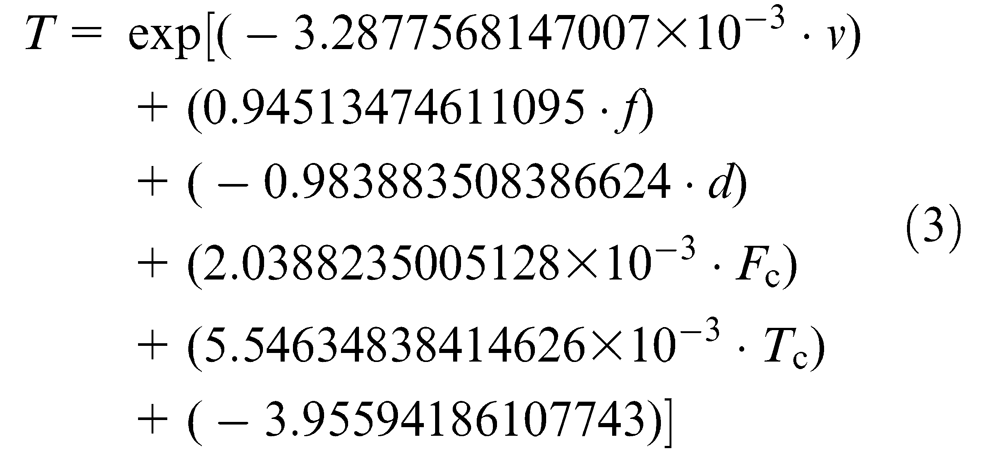
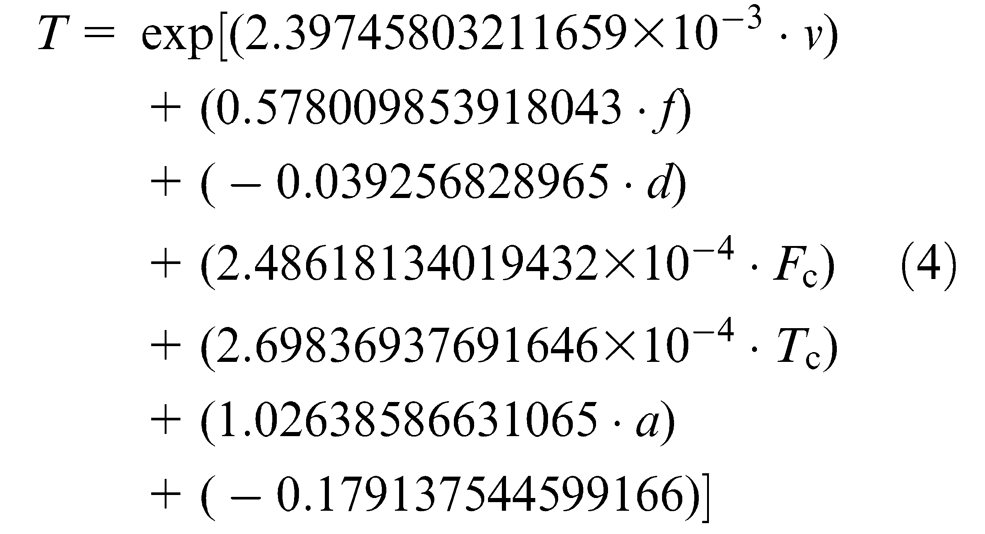
In equations (1) to (4), T represents tool wear, v is the cutting velocity, f is the feed rate, d is the depth of cut, Fc is the cutting force, Tc is the cutting temperature and a is the displacement of tool vibration.
The coefficient of determination is a statistical measure of how well the regression model approximates the real data points. A coefficient of determination of 1.0 indicates that the regression model perfectly fits the data. Values of coefficient of determination outside the range 0 to 1 can occur where it is used to measure the agreement between observed and modelled values. Values of both the coefficient of determination and the unknown coefficients found in equations (1) to (4) were determined by Data Fit 9.0 software using the least squares approach.
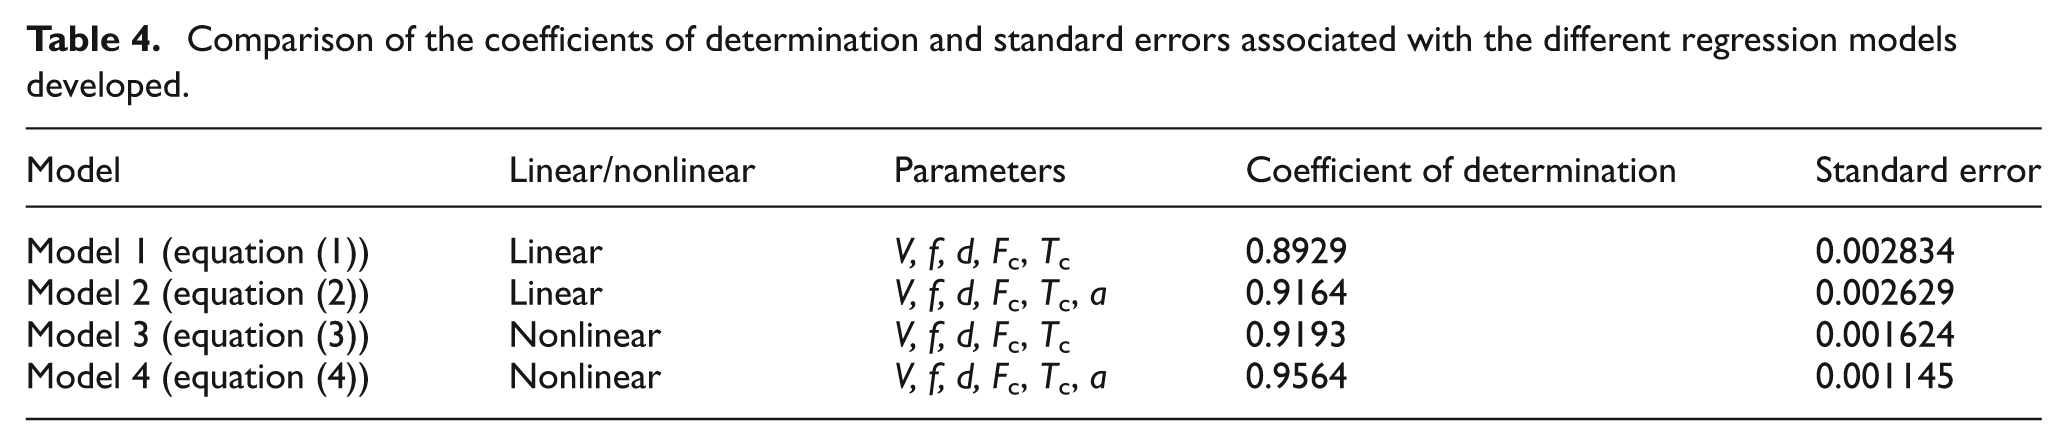
Comparison of fusion models based on regression analysis
Table 4 presents a comparison of the coefficients of determination and standard errors for the four regression models developed. It can be observed from Table 4 that a nonlinear regression model can predict tool wear better than a linear regression model, and the accuracy of prediction can be further improved when the tool vibration signal is included in the regression model. It is also observed that a nonlinear regression model in which tool vibration was taken into consideration offers the highest coefficient of determination when compared to other models, further supporting the hypothesis that the tool wear can be predicted better by considering a greater number of appropriate symptoms. Moreover, the standard error is the least for the nonlinear regression model in which displacement of tool vibration was also taken into consideration along with the other parameters.
Comparison of the coefficients of determination and standard errors associated with the different regression models developed.
Sensor fusion using an ANN model
An ANN, usually called a neural network, is a mathematical or computational model that is inspired by the structure and/or functional aspects of biological neural networks. A neural network consists of an interconnected group of artificial neurons, and it processes information using a connectionist approach to computation. In most cases an ANN is an adaptive system that changes its structure based on external or internal information that flows through the network during the learning phase. Modern neural networks are nonlinear statistical data modelling tools. They are usually used to model complex relationships between inputs and outputs or to find patterns in data. ANNs, which are simplified models of the biological neuron systems, are massively parallel distributing processing systems made up of highly interconnected neural computing elements or processing units which are called neurons. A neural network consists of at least three layers: input, hidden and output layers. Learning is achieved when the associations between a specified set of input–output pairs are established. The neurons of one layer are interconnected to the neurons of the previous and successive layers through weighted links. Each neuron of the hidden and output layers is offset by a threshold value. A back-propagation training algorithm was used in this investigation which iteratively minimizes the cost function with respect to the interconnection weights and neuron thresholds. The training process is terminated either when the mean square error (MSE) between the measured data points and the predicted ANN values for all elements in the training set have reached a pre-specified threshold or after the completion of a pre-selected number of learning iterative processes. The first approach was adopted in the present investigation.
Also an ANN model is a nonparametric regression model of which the prediction capabilities can be improved by refining the architecture. This is not possible for a model based on multiple regression analysis. The data fusion was achieved through pattern recognition. The ANN model was trained using a set of patterns consisting of data on cutting velocity, feed, depth of cut, response from the cutting force sensor, response from the cutting temperature sensor, displacement of tool vibration from the vibration sensor and the corresponding tool wear. It is reported that a sensor fusion model based on an ANN can predict tool wear better than models based on regression analysis. 10 Accordingly an attempt was made to develop an ANN model to fuse cutting force, cutting temperature and displacement of tool vibration signals along with cutting velocity, feed and depth of cut.
Normalization of data
An ANN model cannot learn if the input variables are in their original form. In order to make them feasible for an ANN model, all input data were normalized by transforming to the range of {0, 1}. Normalization of input data was carried out using the equation
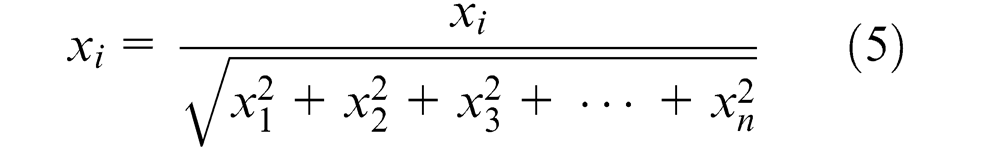
where xi is the ith input data and the output data were normalized using the relationship

where xmax is the maximum value among the output data. 16 A sigmoid function as in equation (7) was used as transfer function in this model

Selection of training and testing data
Out of the 27 sets of data available in Table 3, 23 were reserved for training the ANN model and the rest used for testing the model. All of these 27 experimental datasets were taken at different cutting conditions. Twenty-three training patterns covering the entire range of the experiment were used in this research work. The data used for testing were collected at cutting conditions different from those used for training. The test data available in Table 3 were used to compare the predictions of the ANN fusion model with the fusion model based on regression analysis.
Optimization of network architecture
A back-propagation algorithm, which adjusts weights according to the gradient descent method, was used to minimize the difference between the desired and actual output of the network. A routine available in Rao and Rao 17 which utilizes a feed-forward back-propagation algorithm was used in developing this model. Networks with varying architecture were trained for varying numbers of cycles. The number of neurons in the hidden layer was fixed on the basis of limiting the MSE as the number of neurons in the hidden layer was increased progressively. The root mean square error (RMSE) is a quadratic scoring rule which measures the average magnitude of the error. Expressing the formula in words, the differences between forecast and corresponding observed values are each squared and then averaged over the sample. Finally, the square root of the average is taken. Since the errors are squared before they are averaged, the RMSE gives a relatively high weight to large errors. This means that RMSE is more useful when large errors are particularly undesirable. To get a graded output, learning factor and momentum have to be decreased in order to prevent oscillations. The momentum value has a range between 0 and 1. A learning rate of 0.01 and a momentum factor of 0.1 were assigned while training the network.
In this study, the RMSE was calculated for 77 configurations and some of the lower MSEs are shown as a function of network configuration in Figure 6. Out of the 77 architectures that were selected and trained, an architecture consisting of six neurons in the input layer, three hidden layers and one neuron in the output layer (6-4-6-4-1), which had a lower RMSE value with an accuracy of 0.004 at 595,049 cycles, was selected; this architecture is shown in Figure 7. An ANN model with 6-4-6-4-1 architecture was selected to fuse the cutting force, cutting temperature and vibration signals. Also, the coefficient of determination for this configuration was found to be 0.998211. This model can be trained to predict tool wear online.
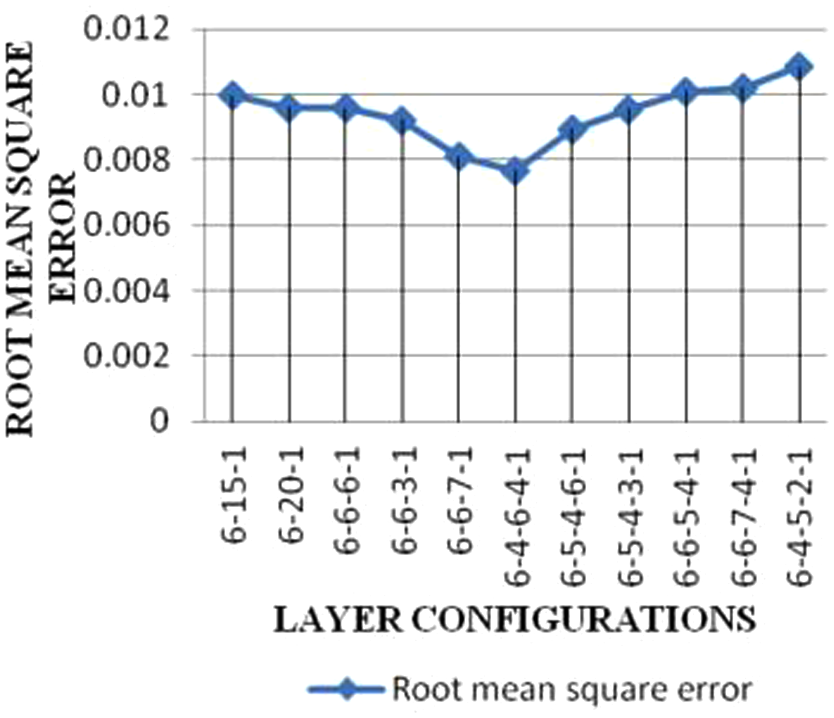
Variation of limiting MSE with layer configuration.
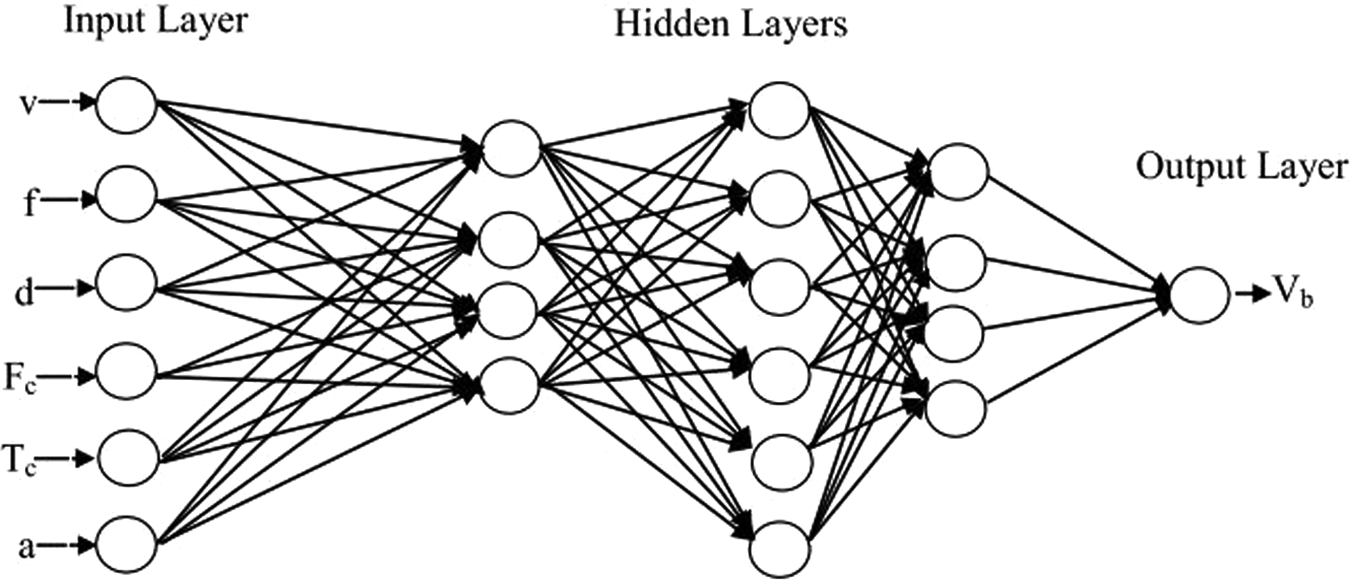
The 6-4-6-4-1 architecture of the ANN model.
Comparison of ANN-based fusion model with model based on nonlinear regression analysis
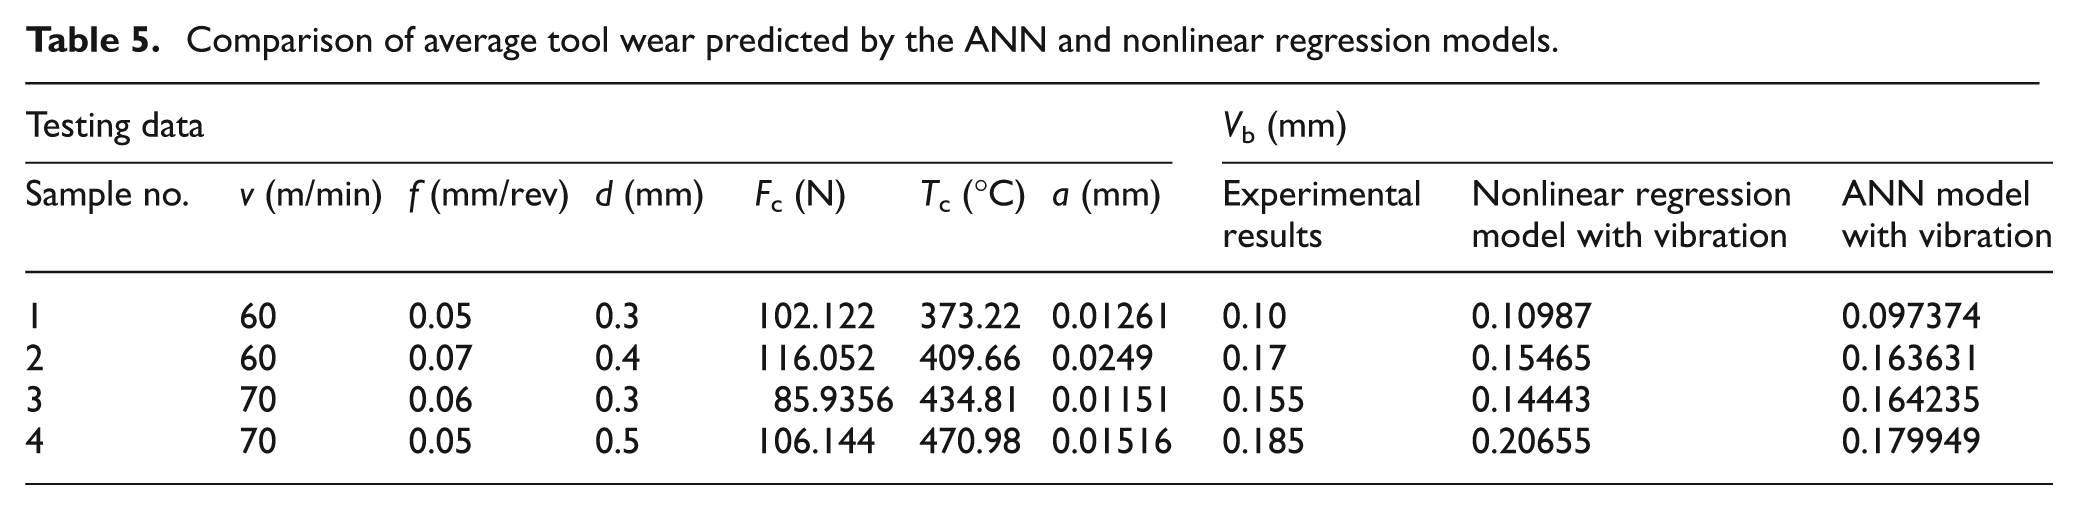
The ANN model with the architecture shown in Figure 7 was fed with input signals as available in Table 3 (testing data); the predictions of tool wear during each trial are presented in Table 5 along with the predictions by the nonlinear regression model.
Comparison of average tool wear predicted by the ANN and nonlinear regression models.
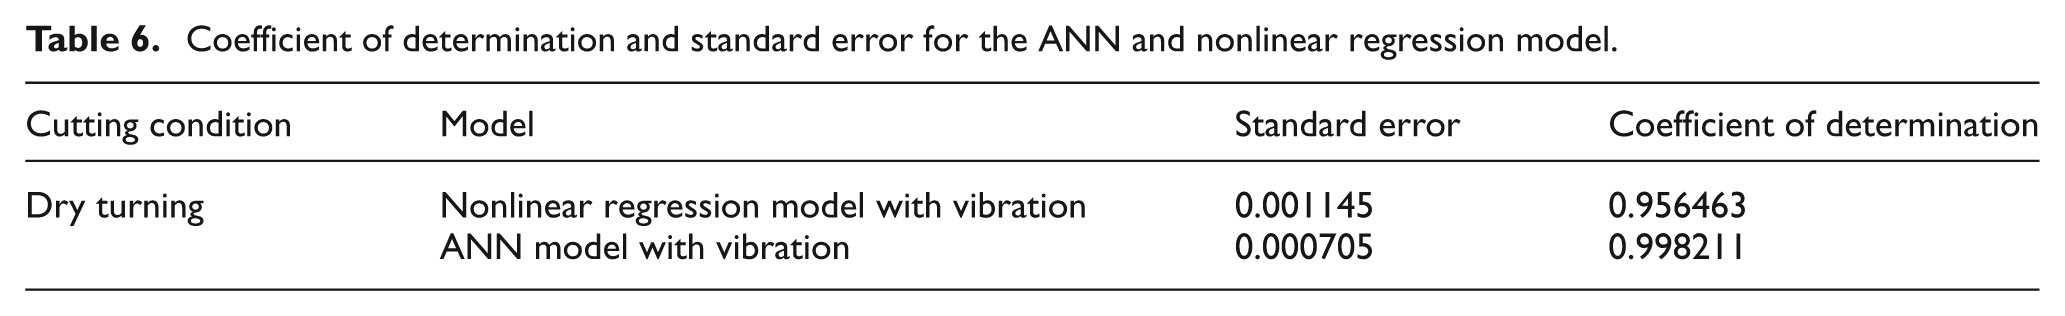
The standard error and the coefficient of determination were considered as the indices of performance for evaluating the ability of the models to predict tool wear. The coefficient of determination and the standard error for the ANN and nonlinear regression models are presented in Table 6. It can be seen that the ANN fusion model is far superior to the fusion model based on regression analysis with respect to the standard error and coefficient of determination. There is a 38.3% reduction in the standard error and the coefficient of determination is improved by 4.2%, when the fusion model based on ANN was used to synthesize the signals that form symptoms of tool wear during dry turning of AISI 4340 steel with a multicoated hard metal insert with a sculptured rake face.
Coefficient of determination and standard error for the ANN and nonlinear regression model.
The technique of fusing cutting force, cutting temperature and tool vibration signals appears to be a more efficient method of predicting average flank wear and a sensor fusion model based on an ANN predicts tool wear better than models based on regression analysis.
Results and discussion
In the present investigation, cutting force, cutting temperature and displacement of tool vibration were considered along with operating parameters such as cutting velocity, feed and depth of cut to predict tool wear. It was observed that better prediction of tool wear is possible when symptoms of tool wear such as cutting force, cutting temperature and displacement of tool vibration are considered collectively along with the operating parameters. It was seen that a nonlinear regression model could fuse the symptoms of tool wear better than a linear regression model. When cutting force and cutting temperature alone were considered, the coefficient of determination was 0.91637 for the nonlinear regression model whereas it was 0.956463 when displacement of tool vibration was also considered along with cutting force and cutting temperature. Considering the superiority of the ANN, an attempt was made to fuse the symptoms of tool wear using such a network. An ANN model was developed for this purpose and the predictions of the ANN model were compared with the predictions by the nonlinear regression model and the experimental results. It was observed that the ANN model can predict tool wear better than the nonlinear regression model. In the case of the nonlinear regression model, the standard error was 0.00145 and the coefficient of determination was 0.956463, whereas the standard error was 0.000705, and the coefficient of determination was 0.998211 when an ANN model with the architecture shown in Figure 7 was used to synthesize the symptoms of tool wear. The standard error was reduced by 38.3% and the improvement in the coefficient of determination was 4.2%. The findings during this investigation can be a basis for developing a model that can predict tool wear by fusing the symptoms of tool wear. The greater the number of symptoms considered for fusion, the higher will be the accuracy of prediction and models based on ANN can predict tool wear better than those based on regression analysis. ANN models are nonparametric regression models and their ability to predict can be improved by choosing proper architecture and training procedures. This research work can form a basis for developing intelligent cutting tools that can predict tool wear online by fusing signals such as cutting force, cutting temperature and displacement of tool vibration using sensors embedded on them. Such tools hold very good promise in computer-integrated manufacturing systems. The versatility of such a system will become many-fold if the tool can transmit cutting force, cutting temperature and tool vibration signals in wireless remote transmission mode, so that cutting tools in a number of machine tools on the shop floor or a number of cutting tools on the same machine tool can be monitored using a centralized tool wear monitoring system.
Conclusions
In the present study, regression and ANN approaches were used to predict tool wear during hard turning of AISI 4340 steel. Parameters such as cutting velocity, feed rate, depth of cut, cutting force, cutting temperature and displacement due to tool vibration were measured by means of a 27-run experimental design. The data obtained were used to develop tool wear models. From the present study, the following conclusions were drawn:
Tool wear can be predicted better by considering a number of appropriate symptoms collectively rather than when they are considered individually. The greater the number of signals that form symptoms of tool wear, the higher will be the accuracy of prediction of tool wear.
A fusion model based on ANN can predict tool wear better than a model based on regression analysis.
This method can form an economical and viable technique for predicting tool wear and timing the replacement of worn tools, so that the surface finish can be maintained within the tolerance limits. This is possible by developing a tool with built-in sensors for measuring cutting force, cutting temperature and displacement due to tool vibration.
Footnotes
Appendix
Acknowledgements
The authors are grateful to the Centre for Research in Design and Manufacturing Engineering (CRDM) of the School of Mechanical Sciences, Karunya University, for facilitating this research work. The authors would like to thank Mr Jones Robin and Mr Sivasankaran of the machine tools lab for their help in conducting experiments. They also thank M/S TageuTec India (P) Ltd for supplying cutting tools needed for this investigation.
This research received no specific grant from any funding agency in the public, commercial, or not-for-profit sectors.