
Abstract
The development of novel nanomaterials with superior reflection loss (RL), thin thickness, wide bandwidth, and low density has recently received significant attention in an effort to increase their effectiveness in electromagnetic (EM) microwave absorption while maintaining an easy manufacturing process. Naturally, using conventional materials with magnetic or dielectric loss makes it difficult to achieve the last criterion and limitations the thickness of the absorber and mass production. In this work, microwave nanocomposites samples were prepared on epoxy resin with different percentages of the nanoparticles of aluminum oxide (epoxy/Al2O3) with surfaces treated by amino propyl and silane. The surface treatment was carried out to improve the adhesion, morphology, and EM properties of the samples to enhance the microwave absorption and the Shielding Effectiveness (SE). Therefore, the treated sample can be considered as potential candidate for high frequency EM absorption applications. Then, the study is followed by structural, morphological, thermal, and electrical characterization of the prepared samples in order to enhance the performances of the latters. The EM absorption and the shielding effectiveness were done in the X band frequency (8 GHz-12 GHz). The obtained results confirmed that the nanocomposites treated samples exhibit higher EM absorption performance and better electrical characteristics. Overall, these results put forward the role played by the addition of the nanoparticles films as high-performance materials in electronic devices and EM applications.
Introduction
Since the development of wireless communication technologies, a vast array of newly wirelessly connected objects have appeared, particularly with the Internet of Things (IoTs), artificial intelligence (AI), wearable electronics, and microwave sensors, which have revolutionized society and opened the way for an intelligent century.1,2 While the widespread use of wireless electronics has resulted in some adverse effects, including the potential for EM pollution, the rapid development of wireless technology has also significantly improved our quality of life.3,4 Electromagnetic interference (EMI), which can originate from various sources, refers to any disturbance or noise that affects the normal functioning of an electronic device or electrical circuit, resulting in the loss of stored data. To maintain an efficient and satisfactory EM environment, it is essential to develop advanced EM materials capable of dealing with external EM waves.2,5,6 These materials fall into two categories: EM absorbing and EM shielding materials, which have different ratios of absorption and reflection. A perfect EM absorber should have a strong absorption (measured by reflection loss value (RL)) and a wide effective absorption width (denoting the region with RL < −10dB). Therefore, it is crucial to find appropriate EM materials to avoid device malfunctions caused by EMI.1,7
Traditional metals face limitations in their applicability to EM applications due to their high density, lack of mechanical flexibility, susceptibility to corrosion, and elevated production costs. Consequently, the emergence of polymers and nanocomposites has sparked a revolution in the industrial realm by providing adaptable and modular mechanical attributes that are exceptionally well suited for EM applications. These innovative materials possess the advantages of being lightweight, uncomplicated, and significantly more cost-effective compared to metals.8,9 Moreover, the capacity to engineer composites using thermoplastics exhibiting remarkably low percolation thresholds enhances the industrial potential of these materials. In recent times, there has been a remarkable synthesis and design of diverse nanomaterials, such as magnetic materials, carbon-based substances, and composite materials, tailored for microwave absorption applications.10,11 Among these, certain highly promising nanomaterials have been explored, enabling the creation of distinct nanostructures that facilitate numerous reflections and interfacial polarization. These materials deliver exceptional conduction loss and polarization loss properties. Notably, the focal point in the domain of microwave absorption materials (MAMs) centers around these advanced materials. As researchers delve into the synthesis of MAMs, the fabrication and meticulous assessment of microwave absorption and shielding (MA&S) structures have garnered significant attention.12,13
In the existing literature, microwave absorber design primarily focused on optimizing reflection loss (RL) parameters without considering Electromagnetic Interference Shielding Effectiveness (EMI-SE). For instance, P. Kang et al. utilized a graphite nanosheet combined with epoxy for electromagnetic shielding, achieving an EMI-SE of 18 dB with a 2.6 vol % composite. 14 V. Tunakova and M. Tunak employed epoxy and carbon fiber to enhance EMI-SE between 30 MHz and 1.5 GHz, achieving 50 dB with 1 mm fiber spacing but only 7 dB with a 20 mm spacing. 15 Additionally, Merizgui et al. investigated epoxy with E-glass fiber, Ag nanoparticles, and Ni nanosheets in the J band frequency, obtaining a maximum wave attenuation of 48 dB with a 3 mm thick composite. 16 In the X-band (8–12 GHz), a study by Parameswarreddy et al. examined epoxy polymer composites reinforced with carbon fiber mat (CFM), short carbon fiber (SCF), and multi-walled carbon nanotube (MWCNT). A single-layer unidirectional CFM with 30wt % epoxy composite achieved EMI shielding of 5 dB and 29.6 dB at 0° and 90° orientations, respectively. 17
For absorption measurements, Shah et al. used carbon fiber and Fe nanoparticles in epoxy resin, yielding a high reflection loss (RL) of −26.8 dB at 4.9 GHz. 18 In another study, Li and al. developed Ni0.6Zn0.4Fe2O4/Ti3C2Tx nanocomposites modified epoxy resins with varying additive content for absorbing and anticorrosive coatings on cement mortar. When 3% Ni0.6Zn0.4Fe2O4/Ti3C2Tx nanocomposite was added to epoxy resin, the coated cement mortar exhibited outstanding EMW absorption properties, including a minimum reflectivity of −34.39 dB and an absorption bandwidth with reflectivity below −10 dB spanning 8.96 GHz. 19 In a different approach, Fan et al. synthesized a magnetic/dielectric composite precursor by growing zeolitic imidazolate framework-67 nanoparticles on acidified multi-walled carbon nanotubes (MWCNTs). In the X-band, the Co–C–MWCNTs/EP composite, with a 17.5 wt % loading, achieved an effective absorption bandwidth of 2.38 GHz and an RL of −19.58 dB at a matching thickness of 1.6 mm. 20
To address these limitations, this paper introduces a novel nanocomposite comprising epoxy resin and aluminum oxide nanoparticles for both microwave absorption and shielding applications. The study comprehensively analyzes the structural, morphological, thermal, and electrical properties of the prepared samples, while EMI-SE measurements and RL assessments were conducted over a broad frequency range (8 GHz to 12 GHz) using a WR 90 waveguide connected to a vector network analyzer. The results substantiate that the epoxy/Al2O3 composite with a 20% ratio exhibits significant absorption loss across a wide frequency band.
Theory of microwave absorption and shielding
Three components of incident energy can be identified when an EM wave interacts with an absorbing material: reflected, absorbed, and transmitted energy.21,22 Therefore, there are two ways to increase microwave absorption: the first is to direct the incident EM wave inside the material rather than having it reflect off the surface, and the second is to increase the EM absorption capacity by changing the EM parameters.12,23
Allowing incident EM waves to penetrate the absorption layer, which is determined by the impedance matching capability, is the initial stage in synthesizing the absorbers. 24
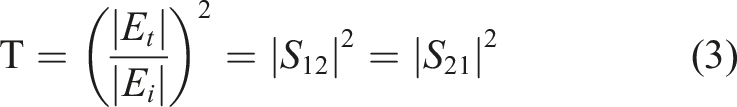
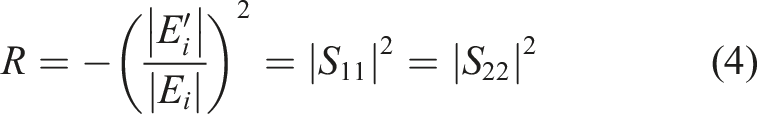
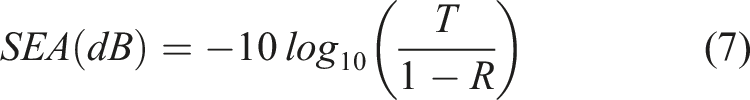
The most common methods for measuring EM absorption performance are the free-space method or the indirect method (coaxial line and waveguide method). The size of the observed sample varies with frequency when using the waveguide or free-space methods. Otherwise, frequency dependent of RL values can be directly obtained according to formula (1).
9

The shielding effectiveness of the cast films quantifies the ability of the slab to stop the transmission of the signal and is simply obtained as the inverse of the normalized transmitted power, determined using S parameters (S11, S12, S21, and S22), measured by the wave-guide method. 25
Equation (2) illustrates the expression of a material's SE (Shielding Effectiveness) as the summation of three distinct terms, with each term corresponding to one of the phenomena: reflection loss, absorption loss, and the cumulative impact of multiple reflections.
26

According to the analysis of S-parameters, transmittance (


The SE of a material can be also calculated by using the equation (8) below.
5

Experimental
Materials
The epoxy resin (DGEBA) was generously provided by Jiangxi Huacui Advanced Materials Co. Ltd. (China), while the DDM hardener was sourced from Tianjin Kernel Chemical Reagent Co. Ltd. (China). Hefei Kaier Nanometer and Technology (China) was the supplier of the alumina (Al2O3) nanoparticles, which exist as white powders with an average particle diameter of 60 nm. The silane-coupling agent GX-540 (aminopropyl trimethoxy silane) was kindly furnished by Sigma Aldrich (France). Figure 1 gives an overview of the chemical structures of DGEBA, DDM, and GX-540 silane-coupling agent. Chemical structures of DGEBA, DDM, and GX-540.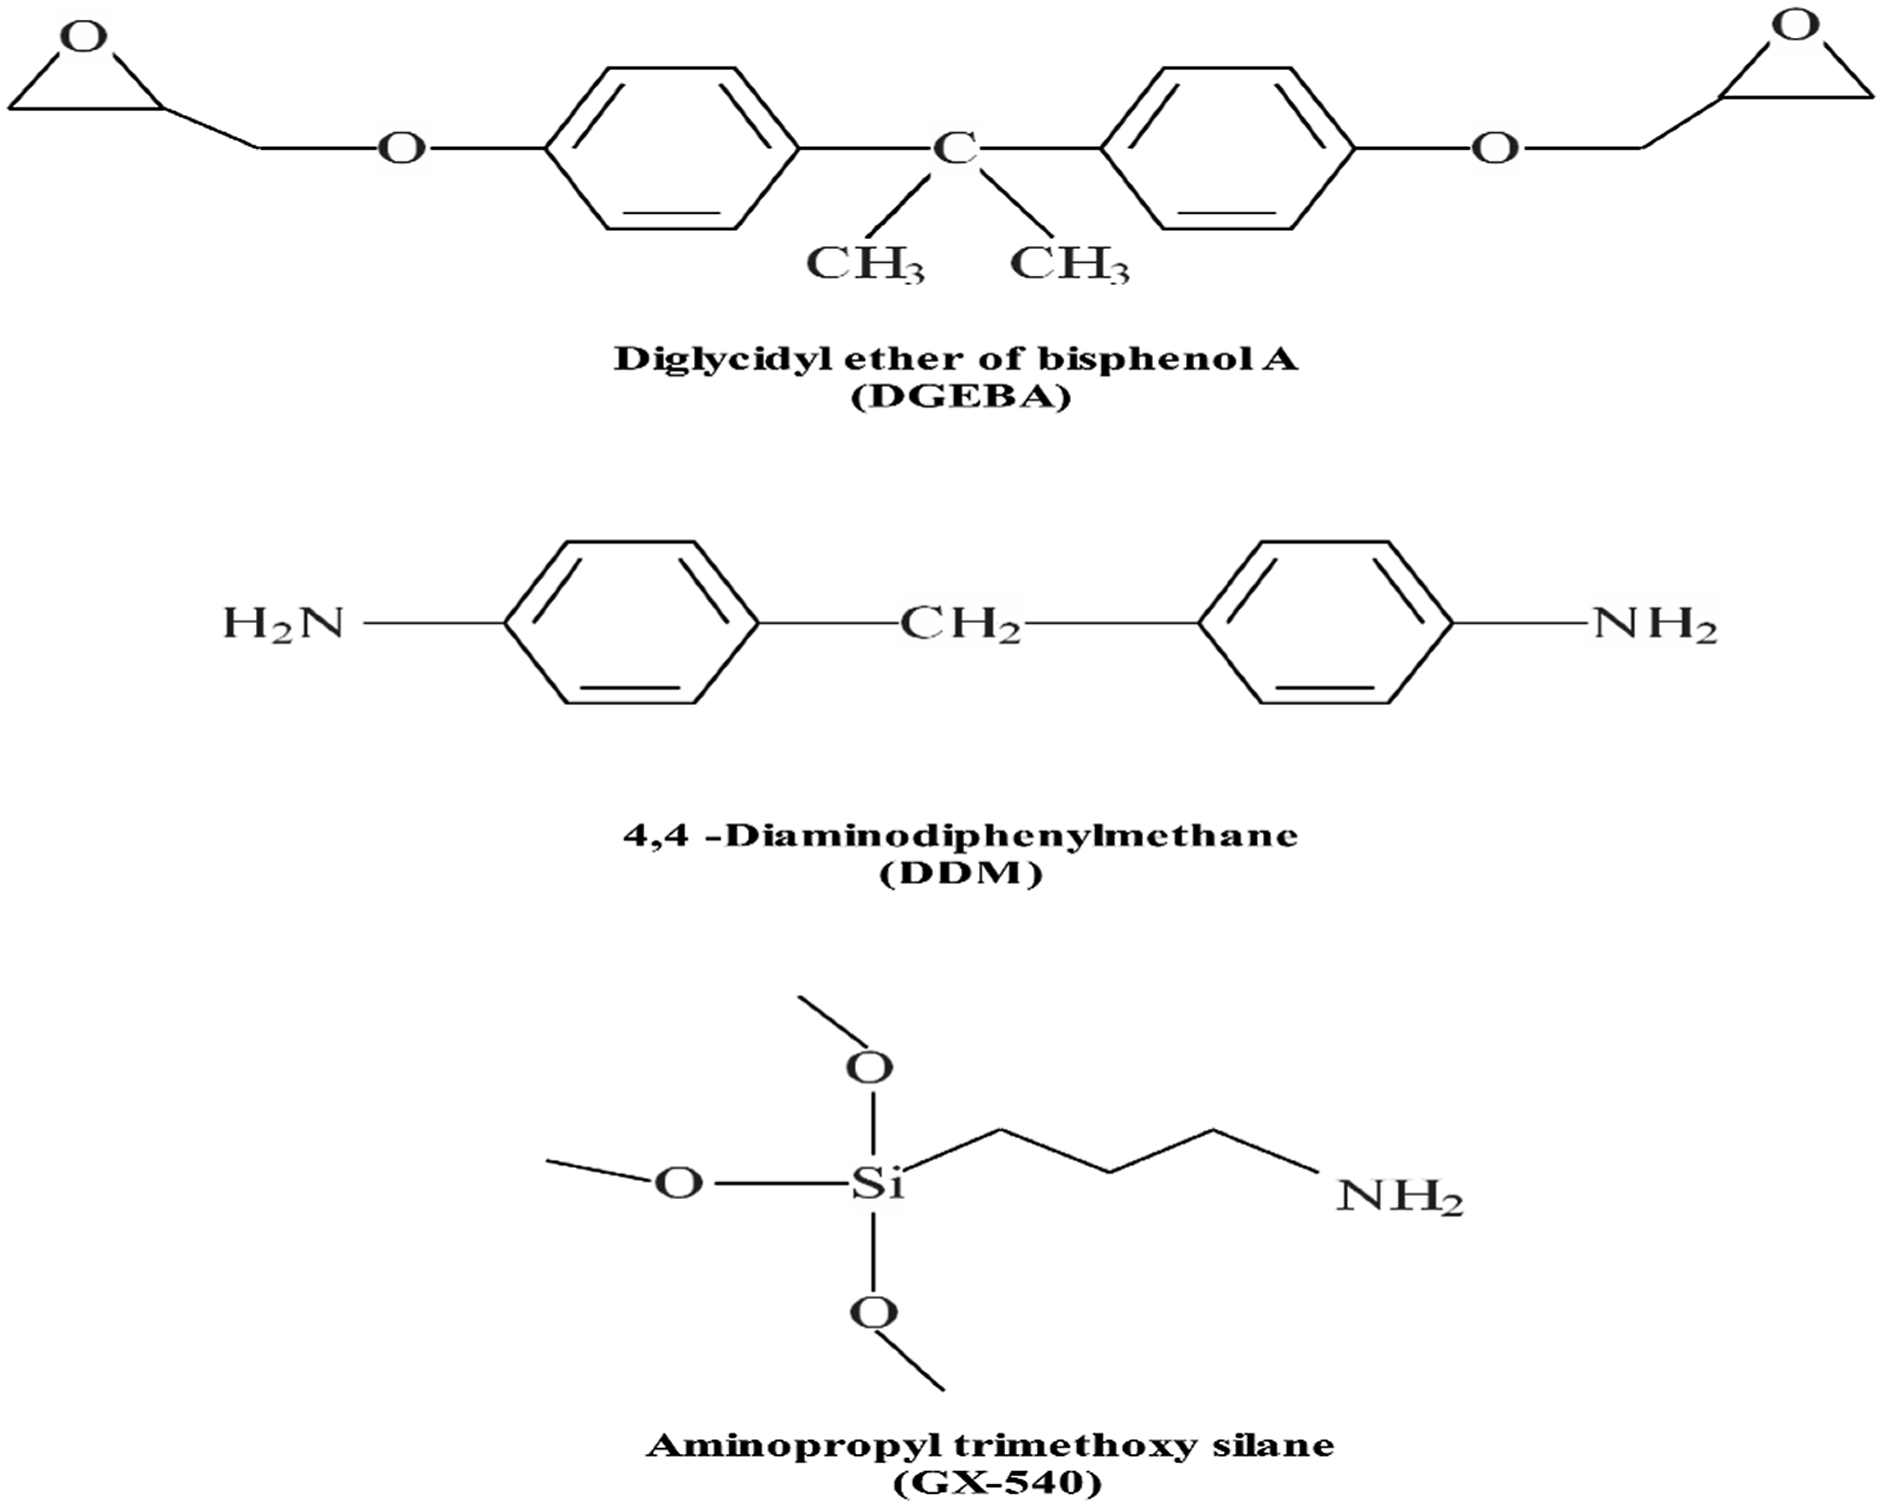
Preparation of epoxy/Al2O3 nanocomposites
For the development of an appropriate EM absorption material, it is crucial to fine-tune the impedance matching and EM dissipation properties of the materials, which are closely intertwined with the material's component composition as well as its morphology and structure, to achieve a favorable outcome. In addition, it is essential to consider the following criteria based on the presented data: Meeting commercial standards with a RL of over 10dB with a wide and effective absorption zone, ensuring a robust absorption intensity, maintaining a thin thickness, being cost-effective with low density and demonstrating acceptable chemical stability.12,13,27 In the realm of EM absorption, the typical approach involves employing a conducting material that combines its EM absorption with a polymer matrix, often in a specified weight or volume ratio. As a result, a low filling ratio also becomes a requirement. 28
The silane surface modification, using the silane-coupling agent GX-540, can be done by the interaction of this agent and the hydroxyl groups in the surface of the nanoparticles. Hence, an FTIR analysis (Figure 2) was carried out to confirm the presence of the targeted groups on the alumina nanoparticles surface before starting the modification. In a solution of water and ethanol (20/80), the nanoparticles were mechanically stirred, for 6 hours, with the coupling agent. This procedure aims to hydrolyze the alkoxy groups present in the silane coupling agent (-OCH3) into silanol groups (Si-OH). Subsequently, the latter groups underwent a condensation reaction with the -OH groups already adsorbed onto the nanoparticles surface. Finally, the silanes sustained a self-condensation reaction. The resultant nanoparticles were gathered via filtration and subjected to repeated washes with toluene to eliminate any remaining unreacted siloxane components. To conclude, the nanoparticles were subjected to vacuum drying at 110°C to ensure the complete removal of any lingering solvents. Scheme of the epoxy/Al2O3 nanocomposites network.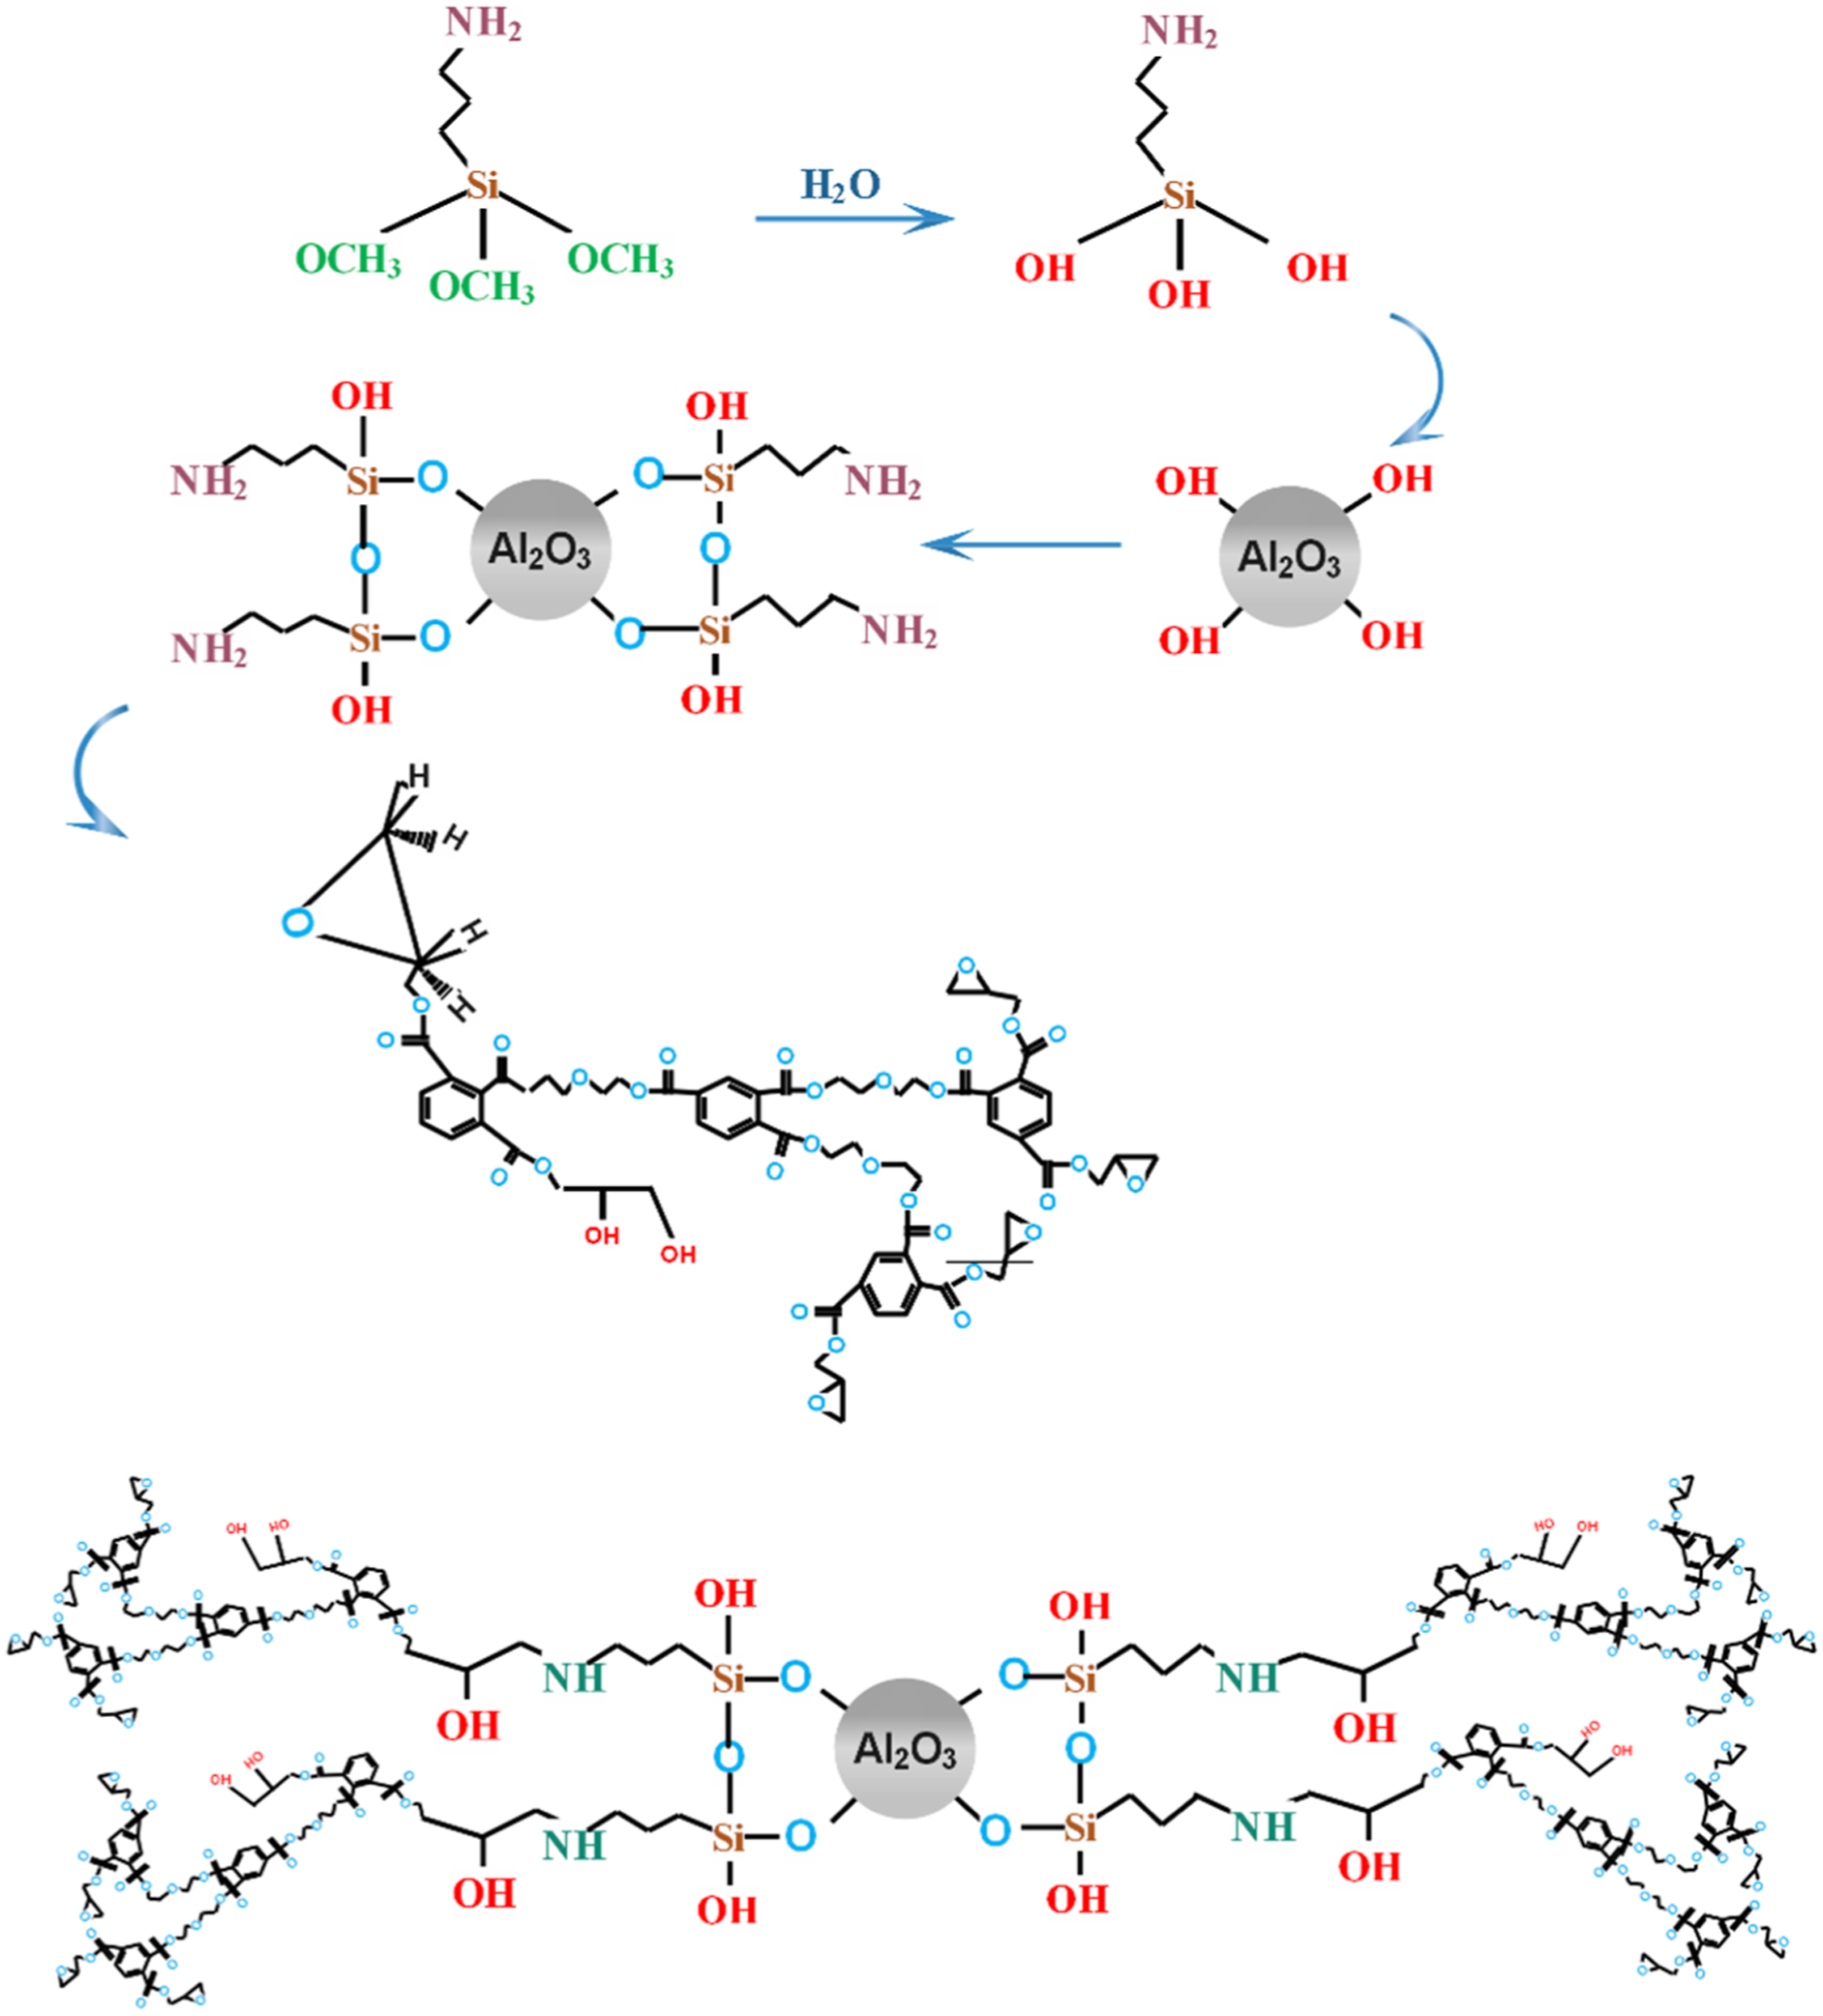
The nanocomposites were prepared by first, mixing the treated nanoparticles and the epoxy pre-polymer. After that, the curing agent was added to the mixture with a weight ratio of 100:50, to the pre-polymer. The nanocharges amount varied from 0, 10 or 20% of the epoxy mass. The mixture was then transferred to a steel mold having the desired shape (according to the experimental EM test setup) and cooled to room temperature. The curing was held for 48 hours to ensure a total hardened material, the nanocomposites were labeled epoxy/X % Al2O3 (X = 0, 10 or 20).
Instruments and measurements
Recording Fourier transform infrared (FTIR) spectra encompassing the 4000–500 cm−1 range involved utilizing a Perkin-Elmer Spectrum 100 spectrometer, which featured KBr optics and a deuterated triglycine sulfate (DTGS) detector. For transmission spectra, after averaging two scans, a 4 cm−1 resolution was applied.
Thermogravimetric (TG) analyses were conducted with a TA Instruments Q50, employing a nitrogen atmosphere at a flow rate of 50 mL/min. The temperature ranged from 50 to 800°C, with a heating rate of 20°C/min.
For dynamic mechanical analysis (DMA) of the prepared nanocomposites, having a rectangular shape (50 × 10 × 2 mm), a TA Q800 dynamic mechanical analyzer was employed.
To gauge absorption and shielding, measurements were executed within the X band frequency domain. The procedure involved integrating an HP 8362 B vector network analyzer connected to WR90 waveguides.
Results and discussion
FTIR analyses
As already mentioned above, after alumina nanoparticles’ salinization process, FTIR analyses were conducted to confirm the success of the treatment method. Figure 3 presents the obtained spectra of neat and treated nanoparticles, which display distinct differences between them. FTIR spectra of native and treated Al2O3 nanoparticles.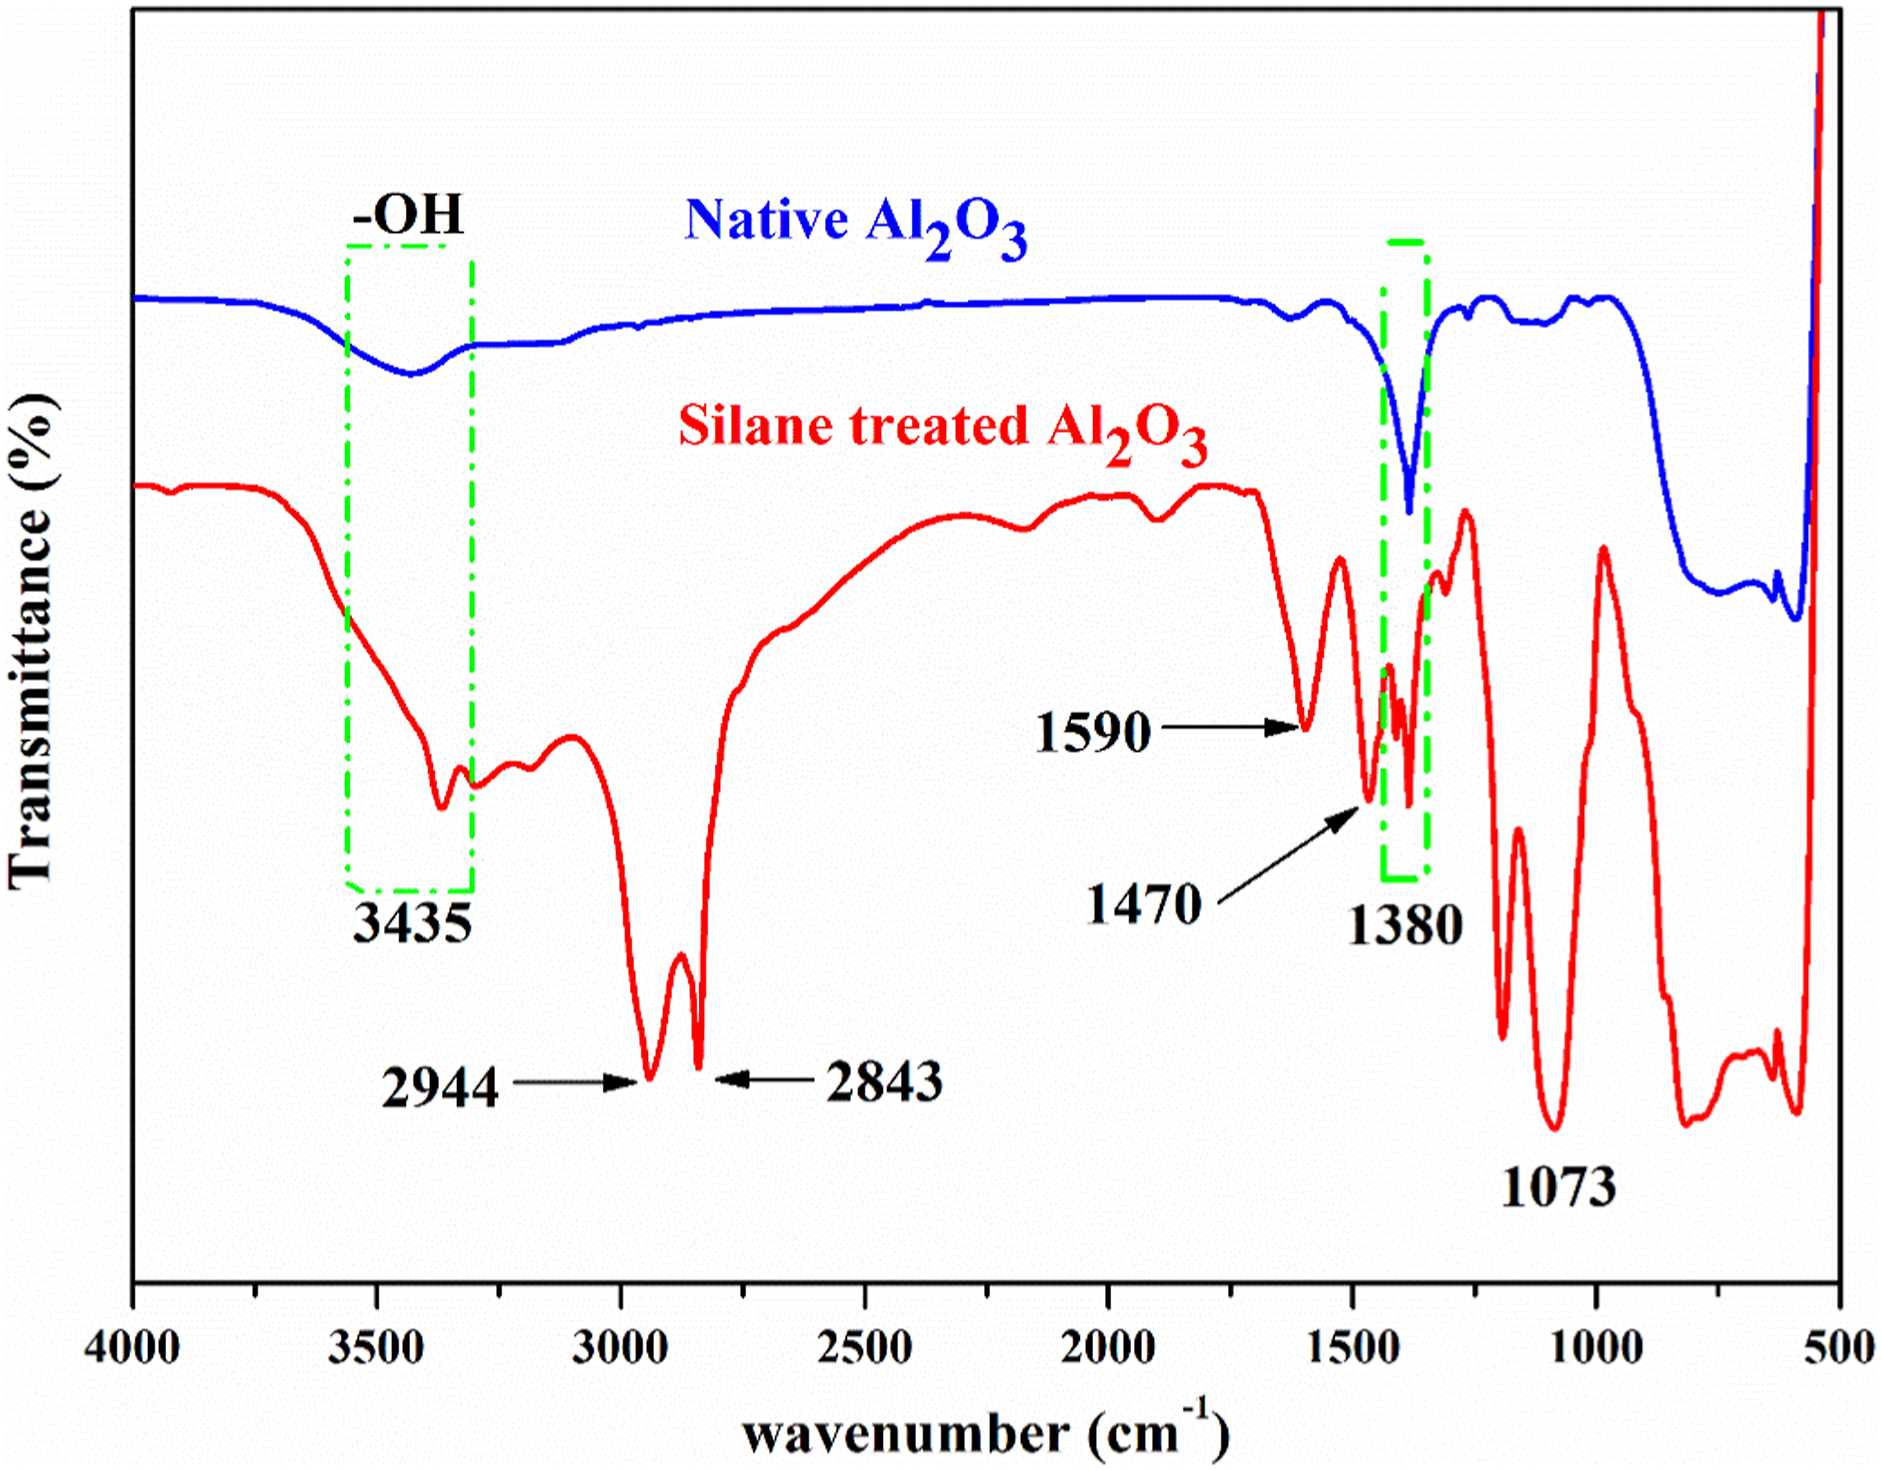
For both spectra, we can notice a broad band in the range of 900-500 cm−1 wavenumber related to the alumina fingerprint. Furthermore, the hydroxyl groups stretching vibrations at 3435 were observed in both treated and native alumina nanoparticles spectra. The presence of these groups is due to water absorption on the charges surface.29–32
The treated nanoparticles’ spectrum shows new absorption peaks which are absent in the untreated samples. The main bands at 1590 and 1073 cm−1 were assigned to the bending (scissoring) of (N-H) groups and the stretching of (Si-O-CH3) groups, respectively. Further, the modified nanoparticles showed peaks at 2944 and 2843 cm−1 attributed to the asymmetric and symmetric stretching vibrations of (-CH2) groups, respectively, while the band at 1470 cm−1 indicated the (-CH2) bending (scissoring) vibration. 33
These FTIR results, the introduction of new chemical functional groups onto the alumina nanoparticles surface may indicate the successful of the GX-540 silane agent grafting method.31,32
Thermogravimetric Analysis (TGA)
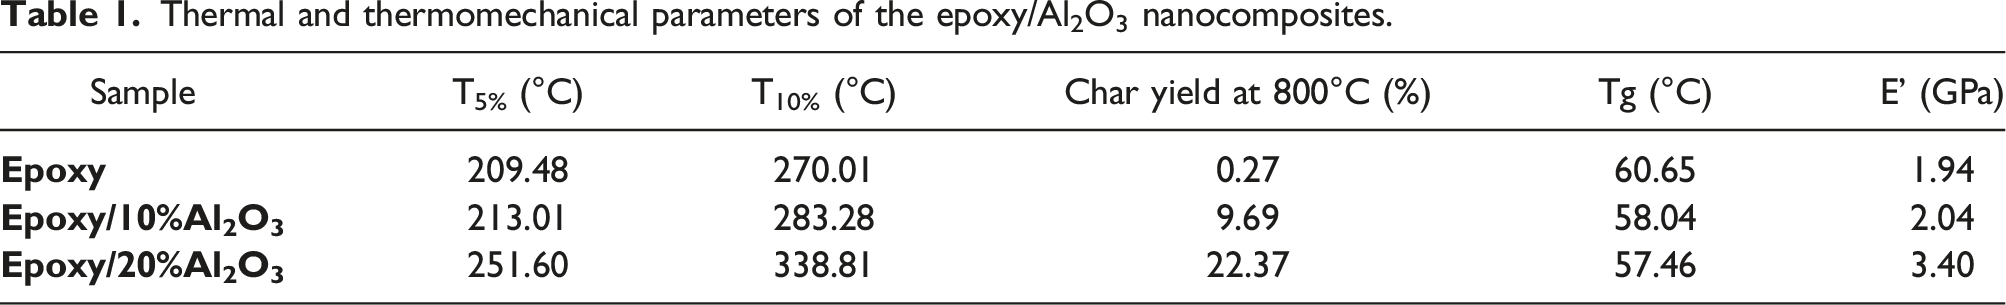
Since the prepared nanocomposites will serve as EM shields, where they may be exposed to high temperatures, it is judicious to estimate their thermal stability. Therefore, TGA analyses, under a nitrogen atmosphere, were done and the degradation temperatures at 5% and 10% weight loss (T5% and T10%, respectively) as well as the percentage of the residual weight at 800°C (char yield Yc) were determined. Figure 4 present the TGA curves of all samples and Table 1 list their properties. By incorporating and increasing the nanofillers amount within the polymer matrix, T5% and T10% and Yc values raised from 270.01, 283.28°C and 0.27%, respectively, to 251.60, 338.81°C and 22.37%, respectively, at 20% nano-Al2O3 content. The rise in T5% and T10% can be credited to the protective effect of the nano-Al2O3 particles. These particles create a barrier that restricts movement and insulates the materials from the heat source.34,35 When inorganic particles are well dispersed, they become impermeable to small molecules or volatile products that might form during thermal decomposition. This poses a challenge in evacuating these volatile products, leading to significantly higher initial decomposition temperatures. Additionally, the exceptional thermal stability of the alumina nanoparticles, which exhibit no weight loss up to 800°C, elucidates the enhancements in the char yield of the nanocomposites. At 800°C, only the polymeric matrix undergoes decomposition, and the remaining residue corresponds to the content of the alumina nanoparticles combined with the char yield of the epoxy resin. TGA of the Epoxy/Al2O3 nanocomposites. Thermal and thermomechanical parameters of the epoxy/Al2O3 nanocomposites.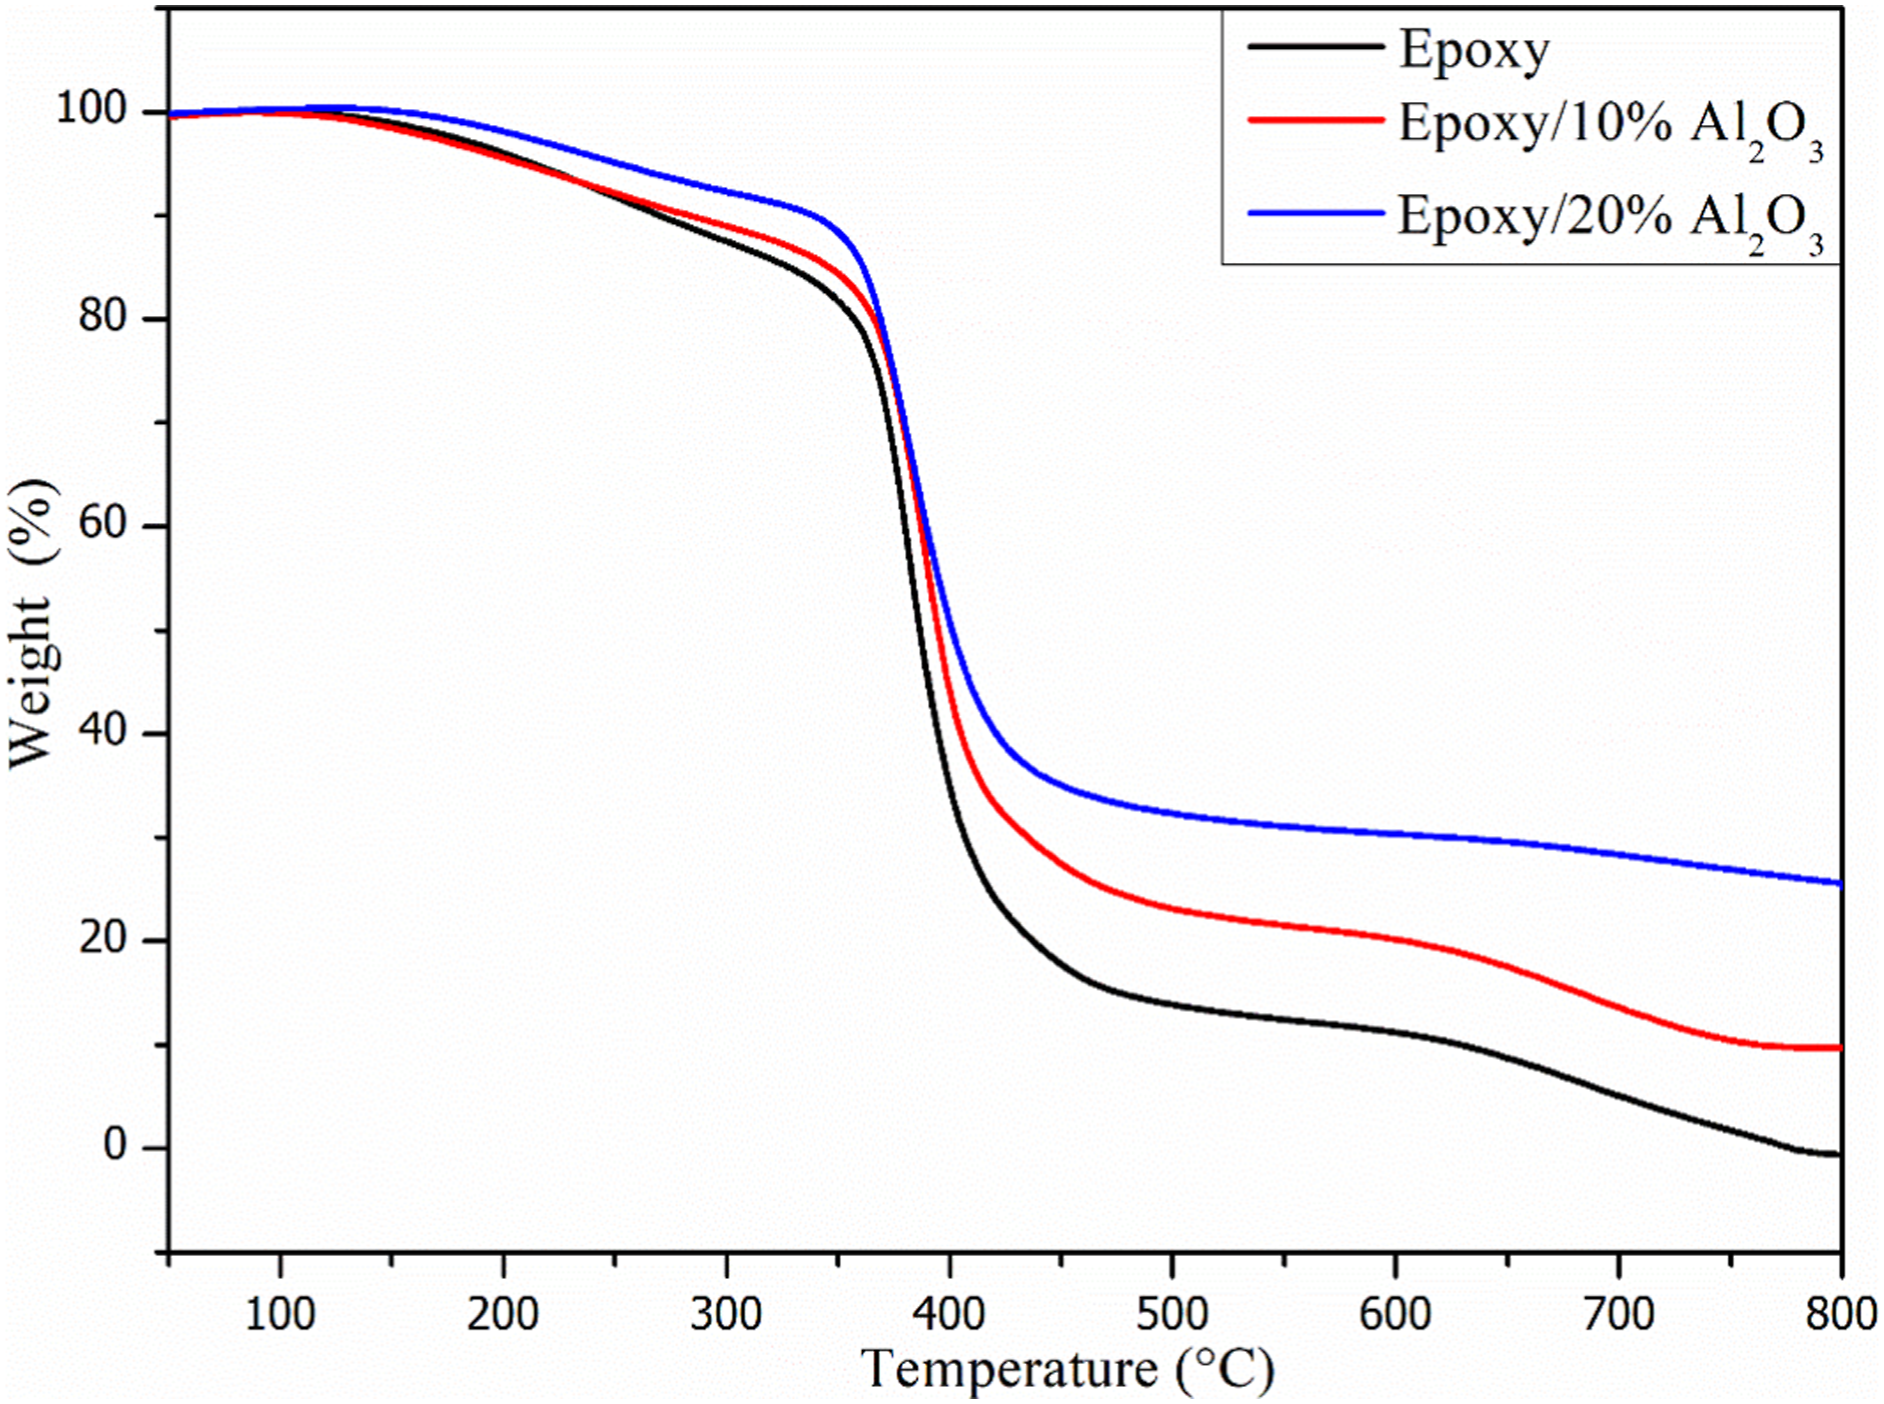
Dynamic mechanical analysis
The dynamic mechanical analysis (DMA) was employed to assess the mechanical characteristics of composites comprising epoxy resin reinforced with various percentages of metal oxides. DMA is an essential analytical technique for characterizing the mechanical and thermal properties of epoxy-based nanocomposites containing alumina nanoparticles. These properties are critical in applications where both electromagnetic shielding and mechanical performance are required, such as in electronics and aerospace industries. The evaluation encompassed measurements of the storage modulus in MPa, providing insights into material stiffness, as well as the Tan (δ), which quantifies the correlation between stored elastic energy and energy dissipated per vibration cycle.35–37 The thermomechanical attributes of these composites are contingent on diverse parameters, encompassing the nature and quantity of the reinforcing phase. Consequently, alterations in these conditions lead to distinct values for the modulus and glass transition temperature (Tg).
At 20°C, the storage modulus for the unmodified resin stood at approximately 1.94 GPa. Intriguingly, upon incorporating 10% and 20% aluminum nanoparticles, this value notably escalated to 2.04 and 3.40 GPa, respectively, as shown in Figure 5. Determination of the glass transition temperature (Tg) was derived from peak analysis of Tan (δ) curves. The Tan (δ) profiles exhibited a tendency towards broader shapes and increased magnitudes with the inclusion of 10% and 20% weight of fillers. For the pristine resin, the glass transition temperature (Tg) registered at 60.65°C. Post addition of 10% and 20% weight of nanoparticles, this value underwent reductions of 2.61°C and 3.19°C, respectively, as shown in Table 1. DMA of the epoxy/Al2O3 nanocomposites; (a) tan delta, (b) storage modulus.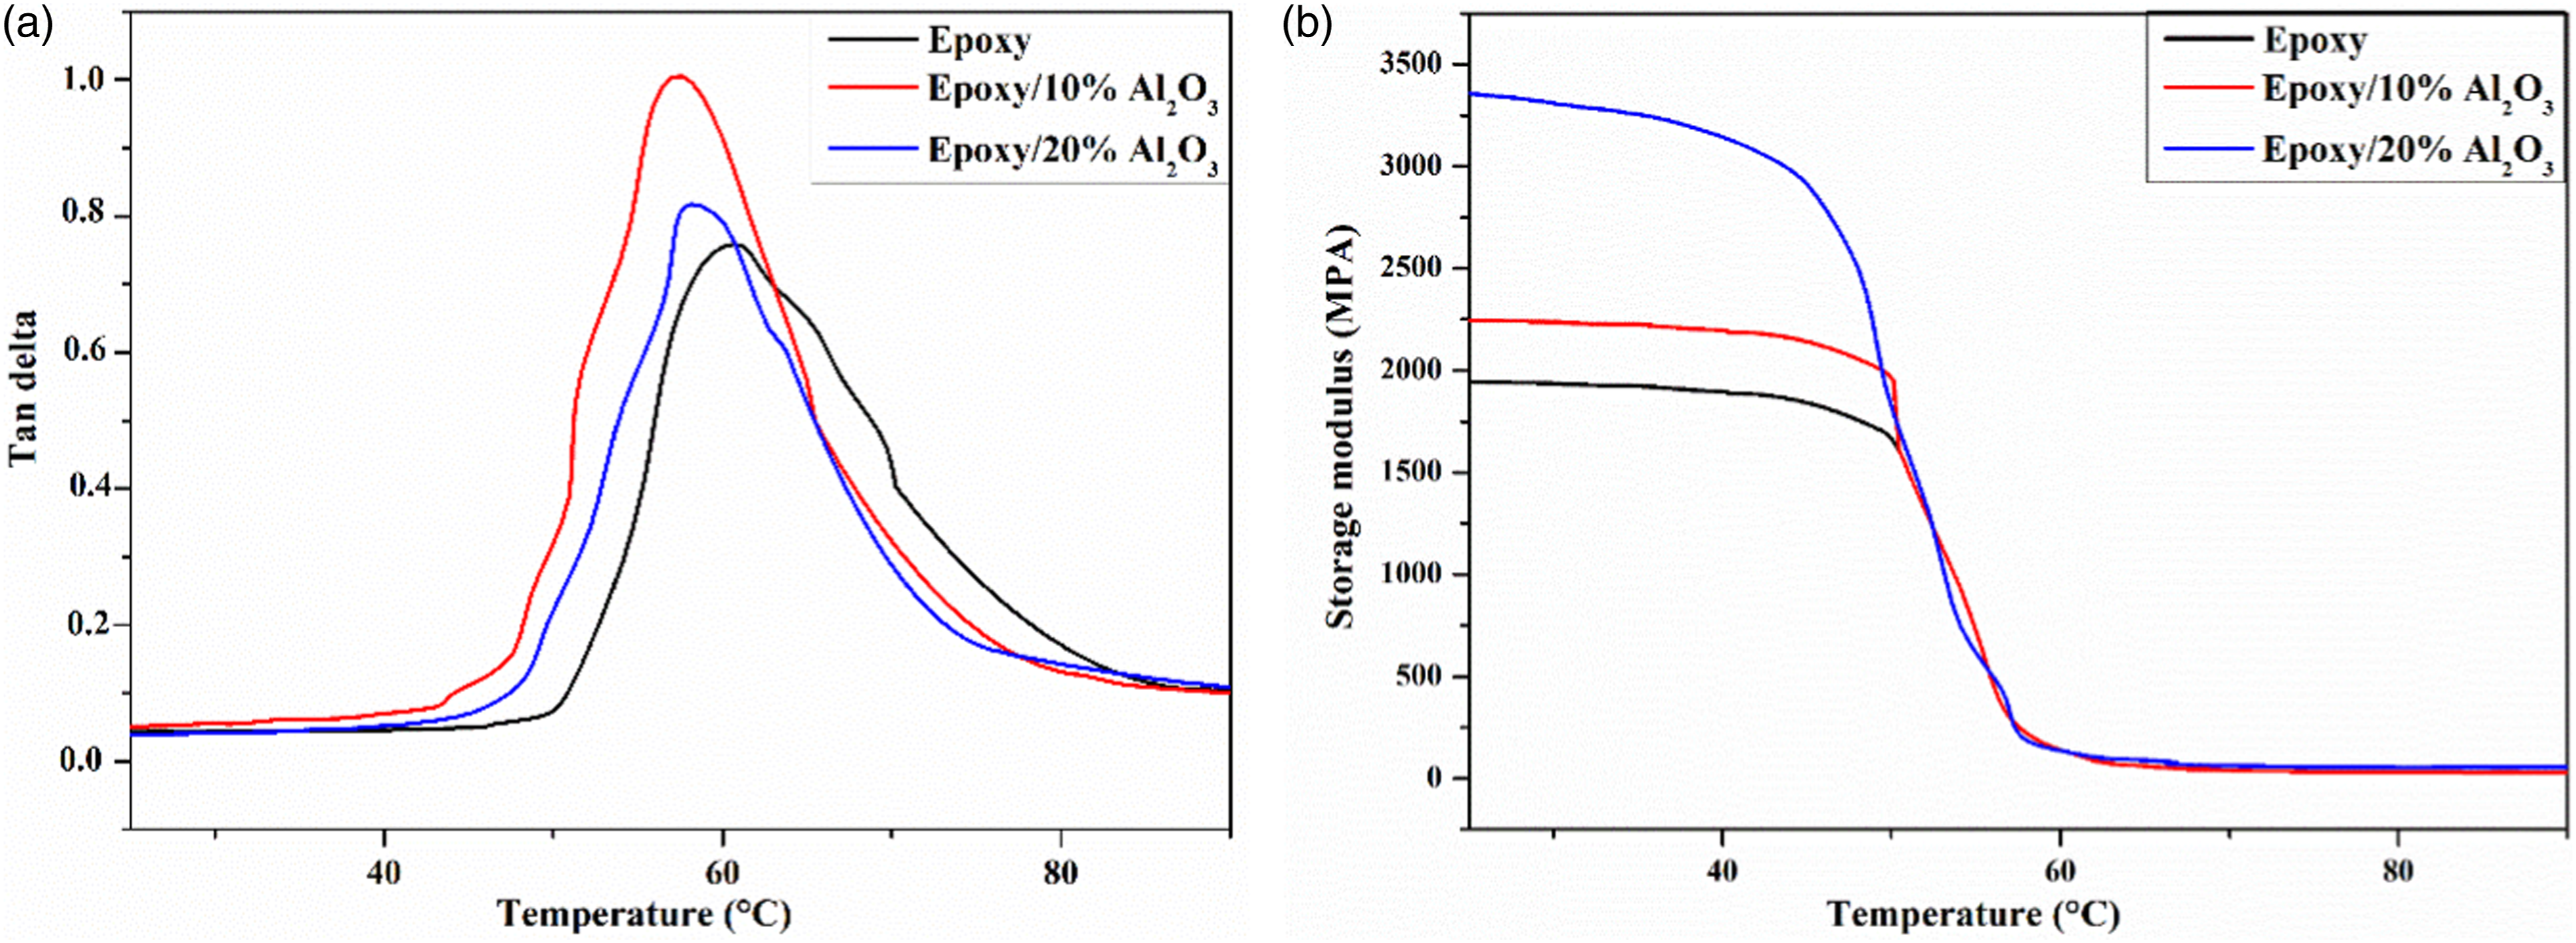
The findings underscore the substantial impact of incorporating metal oxide reinforcements into epoxy resin on the thermomechanical characteristics of the resulting composites. Elevated storage modulus with heightened reinforcement content signifies enhanced composite stiffness and overall mechanical attributes, with the reinforcing effect being more pronounced at higher concentrations. However, a contrary trend emerges for Tg as reinforcement quantity rises, implying diminished thermal stability of the composites. This could lead to a compromised stiffness and tensile strength at elevated temperatures. Additionally, the introduction of reinforcement results in amplified height and breadth of Tan (δ) peaks, indicative of augmented energy dissipation per vibration cycle, consequently leading to reduced stiffness.
Absorption measurement
For the microwave characterization of materials, the measurement of the reflection coefficient is typically employed using specific methods. In our case, we utilized guided propagation within a rectangular guide in the X-band frequency range. The measurement was focused on the parameter S11 of the distribution matrix, which corresponds to the reflection coefficient of the sample when deposited on a metal plane acting as a short circuit.
To carry out these measurements, we utilized a system consisting of the following components: 1. HP 8362 B vector network analyzer: This instrument has a frequency range of 10MHz to 20 GHz and is used for analyzing and measuring the microwave characteristics of the samples. 2. Two APC7 coaxial cables: These coaxial cables are employed to establish the connection between the vector network analyzer and the measurement setup. 3. Two “coaxial-guide” transitions: These transitions are utilized to connect the rectangular guides used in the measurement setup to the vector network analyzer, allowing for the guided propagation and analysis of the EM waves.
By employing this setup, we were able to measure and analyze the reflection coefficient of the sample deposited on the metal plane, providing valuable insights into the microwave characteristics of the material under investigation.
The minimum of S11 corresponds to the maximum absorption and attenuation of incident energy by the material under test. For homogeneous materials, this method has the advantage of using very small quantities of materials, because of the small dimensions of the cell. These dimensions will be even smaller when high frequencies are chosen.
The materials based on Aluminum oxide/epoxy resin composites, with different loading rates, have been elaborated in aluminum molds with an opening of the same dimensions as those of the waveguide used for the different microwave characterizations (22.86*10.16) mm2.
The microwave study allowed us to measure the Sij parameters as well as the shielding effectiveness and reflection losses in our materials. The effect of the thickness and the nature of the filler on the wave absorption characteristic will also be presented and discussed.
Figures 6(a) and (b) illustrate the measured reflection coefficients (S11) obtained using a network analyzer. In Figure 6(a), the influence of thickness and filler ratio on the reflection coefficient is shown for a loading ratio of 10%. It can be observed that composites with the same thickness, based on the resin and aluminum oxide, exhibit reflection coefficients that increase with the loading ratio in the matrix. Specifically, at the X-band frequency range, the reflection coefficients for the Al2O3-based composites reach −37 dB, −32 dB, and −30 dB for thicknesses of 3 mm, 2 mm, and 1 mm, respectively, at a peak frequency of 10.75 GHz. This indicates that, for a particle ratio of 10%, the composites achieve 90% absorption across all thicknesses. Absorption measurement of the Epoxy/Al2O3 nanocomposites in the X band frequency (a) 10% and (b) 20%.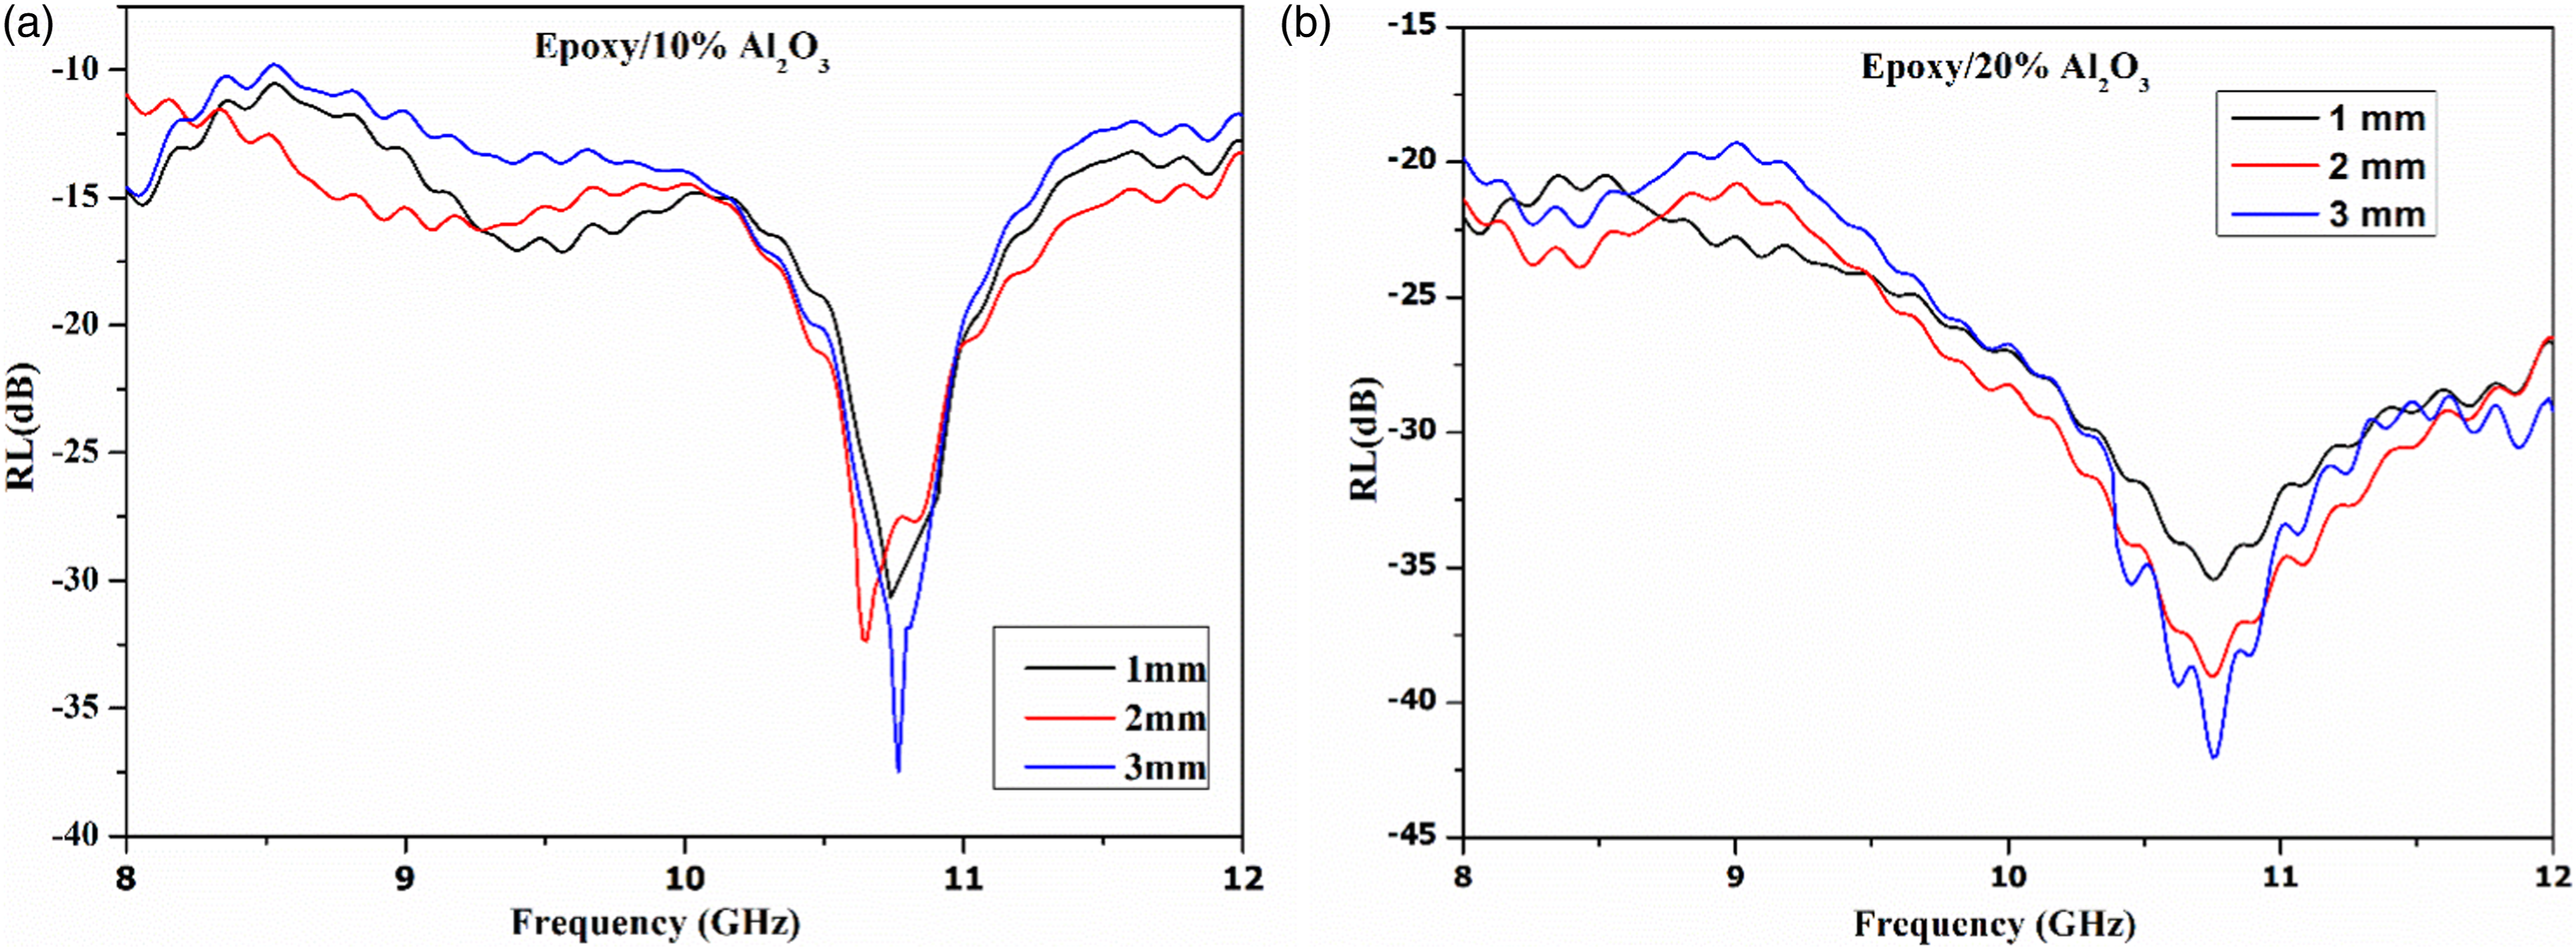
Moving on to Figure 6(b), which represents a particle ratio of 20%, the reflection coefficients of the composites show an increase compared to the previous composites. The values recorded at the same frequency peak are −42 dB, −39 dB, and −35 dB for the respective thicknesses. It is worth noting that the composites synthesized with a particle ratio of 20% consistently demonstrate absorption levels exceeding 99% regardless of the thickness.
The peak observed in the reflection loss (RL) is attributed to the combined effect of two phenomena. The first phenomenon arises from the destructive interference of a quarter wavelength, which is equivalent to the thickness of the sample. This interference leads to a reduction in the reflected waves. The second phenomenon is related to the ability of the electromagnetic (EM) wave to propagate within the sample by matching its impedance to approximately 10.75 GHz, indicated by a ratio close to 1. In simpler terms, the matching impedance reduces the reflection of the EM wave at the sample surface, allowing it to enter the sample more efficiently.
Medium conductivity materials exhibit a notable characteristic where the majority of the energy is absorbed by the material and converted into heat through the conductive networks created by dispersed conductive charges within the matrix. This absorption process occurs due to the interactions between the microwave energy and the composite material's EM field, as well as the electric and magnetic dipoles present.
The significance of absorption is particularly prominent in materials with high permeability, permittivity, and a certain level of conductivity. In such cases, the material's ability to absorb the microwave energy becomes more pronounced, further contributing to the attenuation of the EM field.
The presence of minimal reflection in the reflection spectra signifies the maximum absorption of EM energy. The intensity and frequency at which these minimum reflection values occur are influenced by the electromagnetic properties and thickness of the absorber material.
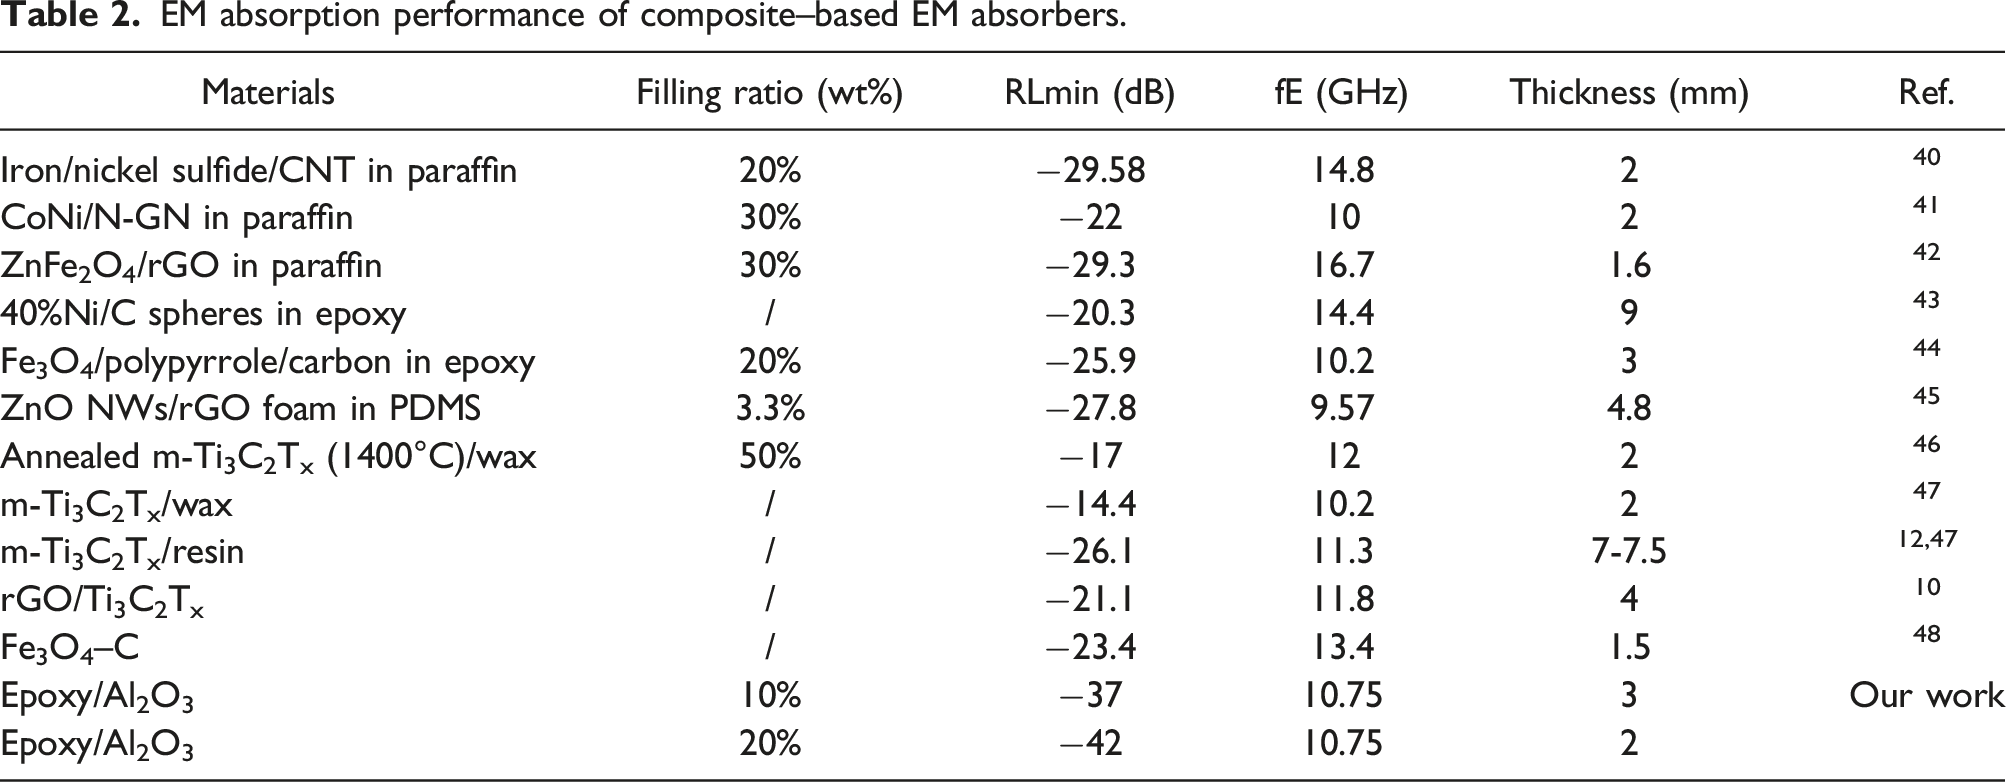
EM absorption performance of composite–based EM absorbers.
Shielding measurement
We have determined the SE of our materials in the X-band (8 -12 GHz) using the reflection/transmission measurements.
The principle of the method is to measure the reflection coefficient S11 and transmission coefficient S21 of a film of material that completely fills the cross section of a rectangular guide. The transmission/reflection measurements of the parameters S11 and S21 are performed with the same composed system used in transmission/reflection.
The flat sample is placed and clamped between the guide flanges by means of screws and centering guides. The sample under test must cover the flange surface to avoid any possibility of EM wave leakage.
We analyzed the mechanism of SE (Shielding Effectiveness) in synthetized epoxy/Al2O3 films by examining the S-parameters. Specifically, we investigated the reflection loss and absorption loss by varying the concentration of Al2O3 (10 and 20%) and adjusting the thickness of the samples (1 to 3 mm). The findings, depicted in Figure 7, illustrate the results obtained for both reflection loss and absorption loss. Shielding effectiveness mechanism measurement of the epoxy/Al2O3 nanocomposites in the X band frequency (a) SER10%, (b) SEA10%, (c) SER20%, (d) SEA 20%.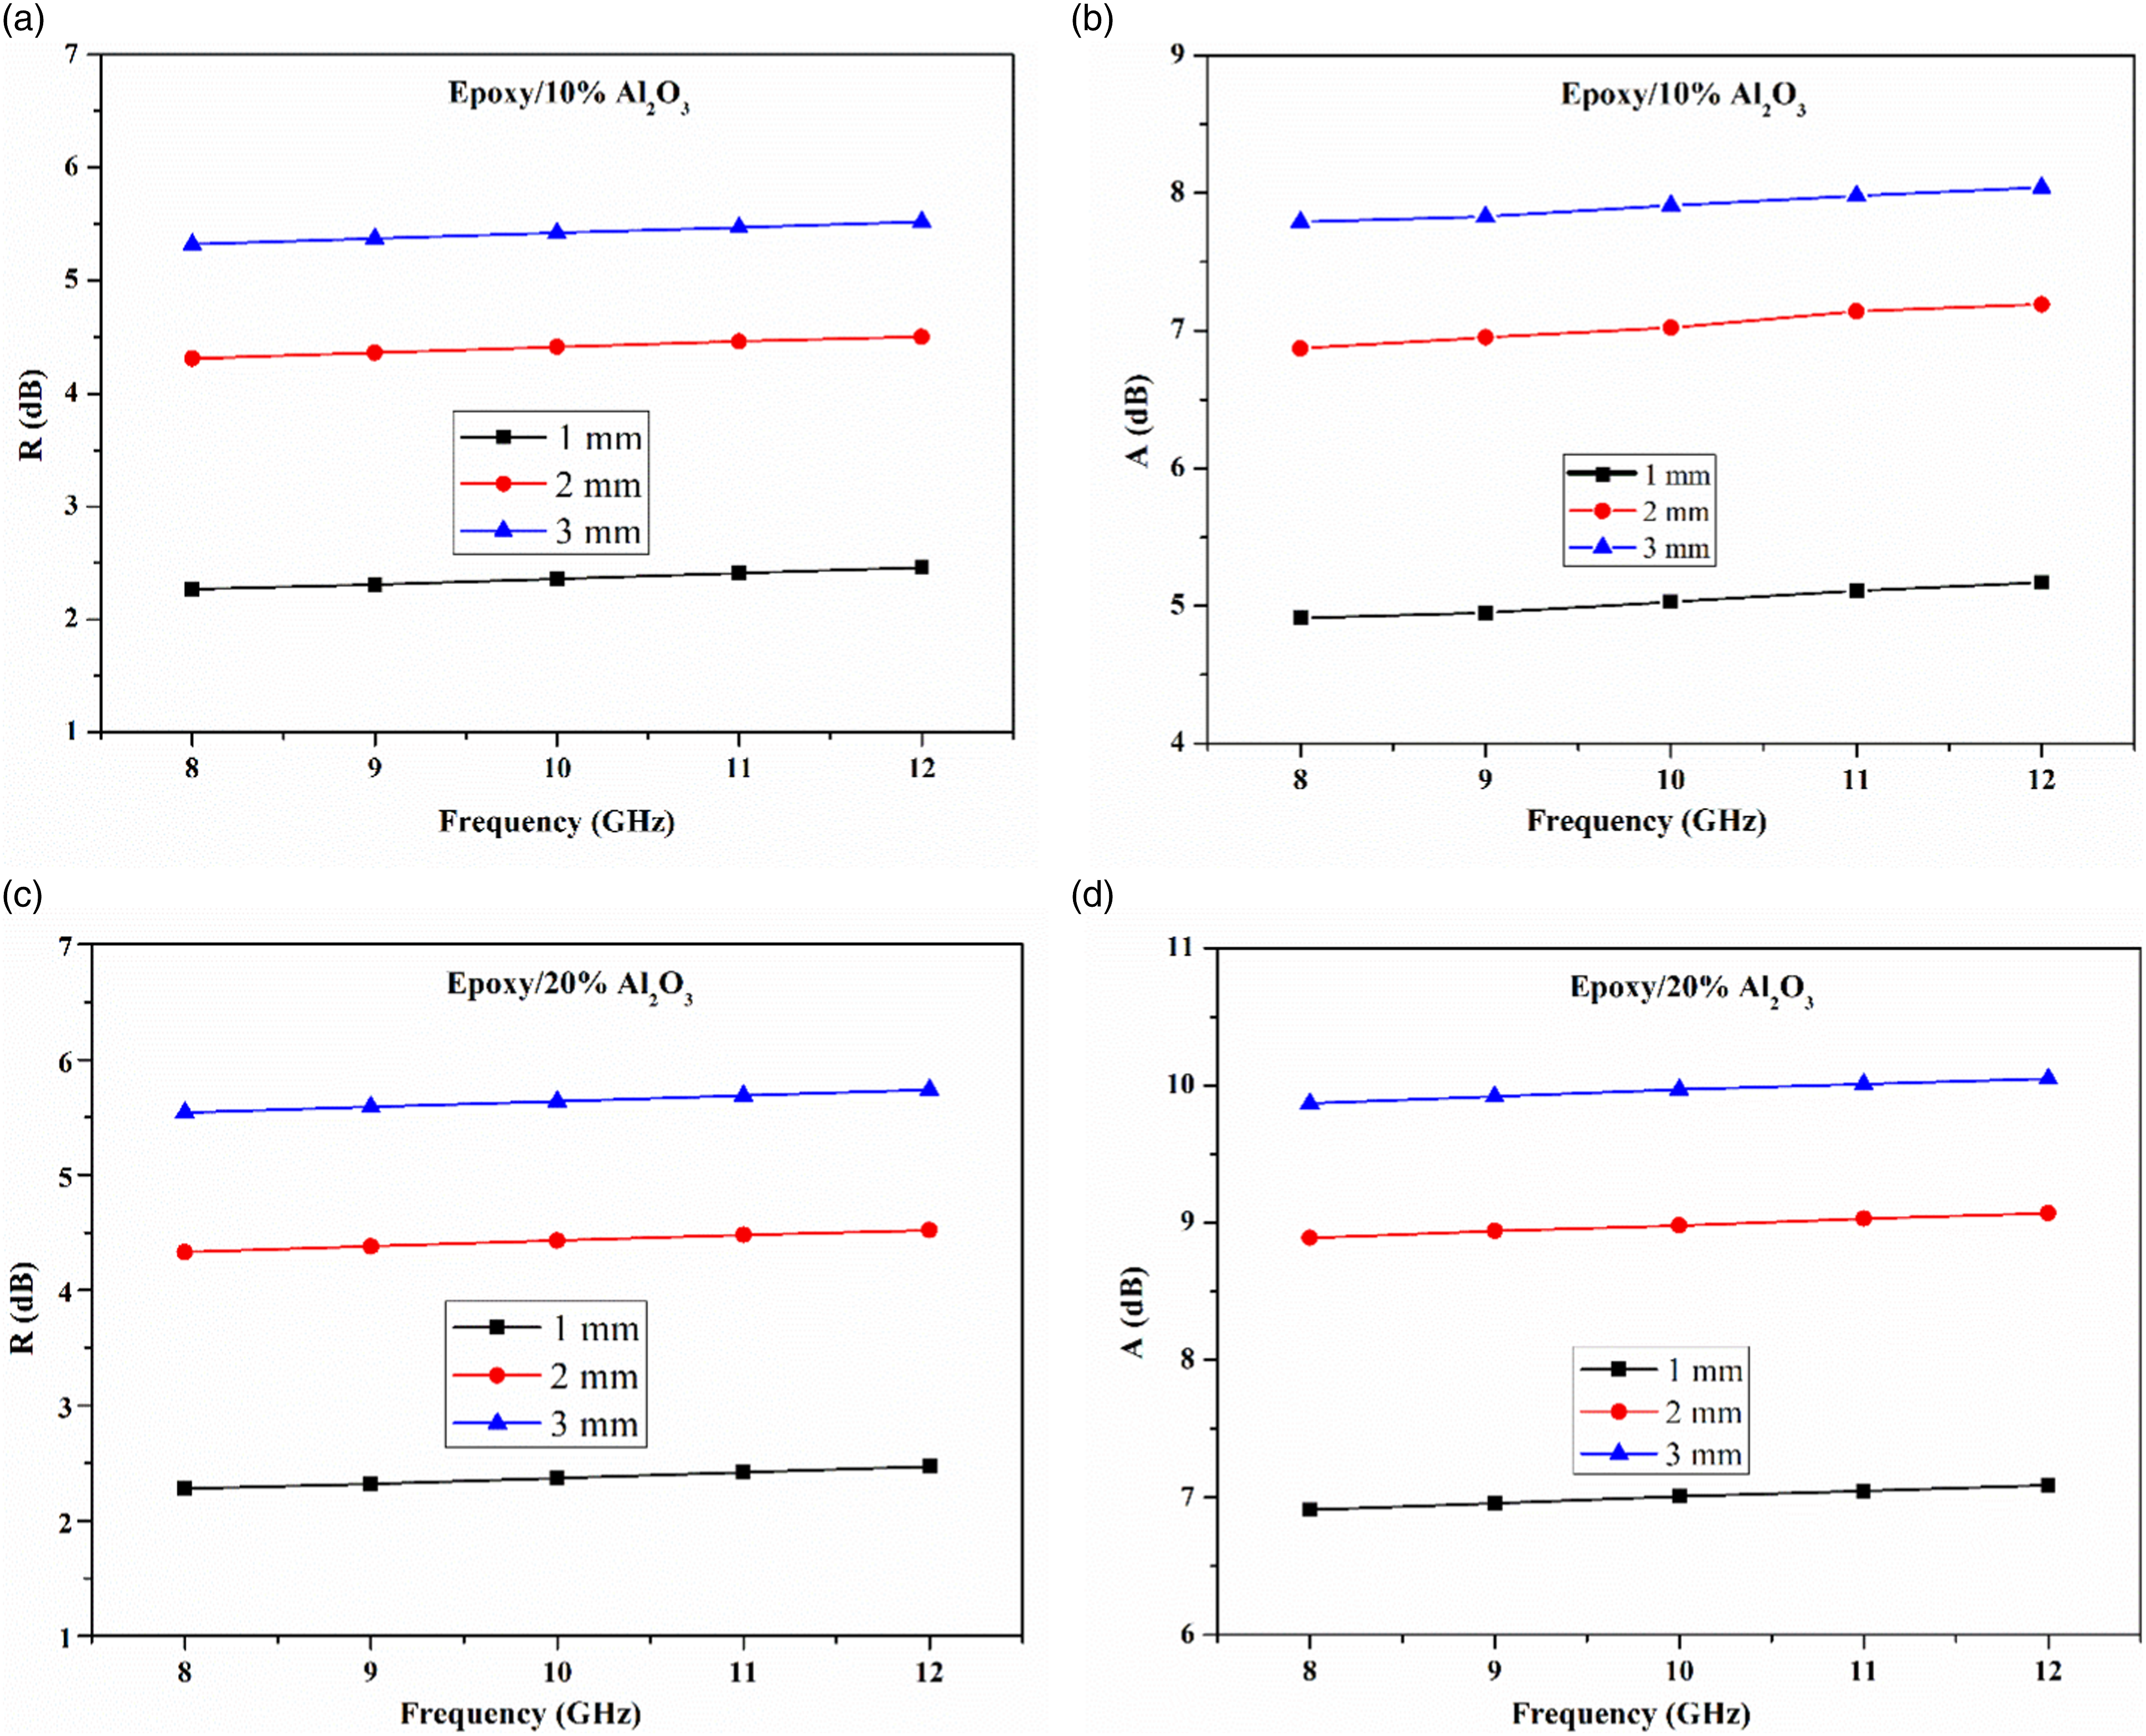
Figure 7(a) illustrates the frequency-dependent variation of reflection loss Ratio (SER) within the frequency range of 8 GHz to 12 GHz, as described by equation (6). Reflection is one of the mechanisms contributing to EMI shielding. The magnitude of the reflection loss, SER, is directly proportional to the electrical conductivity of the shielding films. In this case, the presence of conductive Al2O3 particles within the sample matrix contributes to this mechanism.
The SER parameter values for the different samples range from 2 dB to 5 dB, indicating that the films possess conductive properties. For the 10% Al2O3 films, the SER values are 2.5 dB, 4.5 dB, and 5.5 dB for thicknesses of 1 mm, 2 mm, and 3 mm, respectively. Notably, the 20% Al2O3 samples exhibit the highest SER, with values of 3 dB, 4.5 dB, and 6 dB, respectively. These results can be attributed to the impact of electrical conductivity on the material's impedance, as the reflection factor depends on this impedance.
In Figure 7(c), the variation of absorption loss with frequency is presented according to equation (7). It is important to note that absorption is another significant mechanism contributing to EMI shielding. The measured Shielding Effectiveness Absorption (SEA) values for samples with a 20% Al2O3 ratio are 7 dB, 9 dB, and 10 dB for thicknesses of 1 mm, 2 mm, and 3 mm, respectively. For the 10% Al2O3 samples, the SEA values are 5 dB, 7 dB, and 8.5 dB for the same respective thicknesses.
The absorption loss is closely related to the film thickness (ds), and it is directly influenced by conductivity and frequency (skin depth). This explains why the 20% Al2O3 sample exhibits the highest absorption. Furthermore, it is evident that EMI absorption serves as the dominant shielding mechanism, as indicated by the significantly larger SEA values compared to SER.
Figure 8 depicts the variation of total shielding effectiveness (SEt) with frequency obtained from the vector network analyzer. It is evident that as the frequency increases, the SEt also increases. The absorption loss, which is directly related to frequency (skin depth), dominates the overall shielding effectiveness. This characteristic is advantageous in the application of conductor composite films. Consequently, absorption losses outweigh reflection losses. Shielding effectiveness measurement of the epoxy/Al2O3 nanocomposites in the X band frequency (a) 10%, (b) 20%.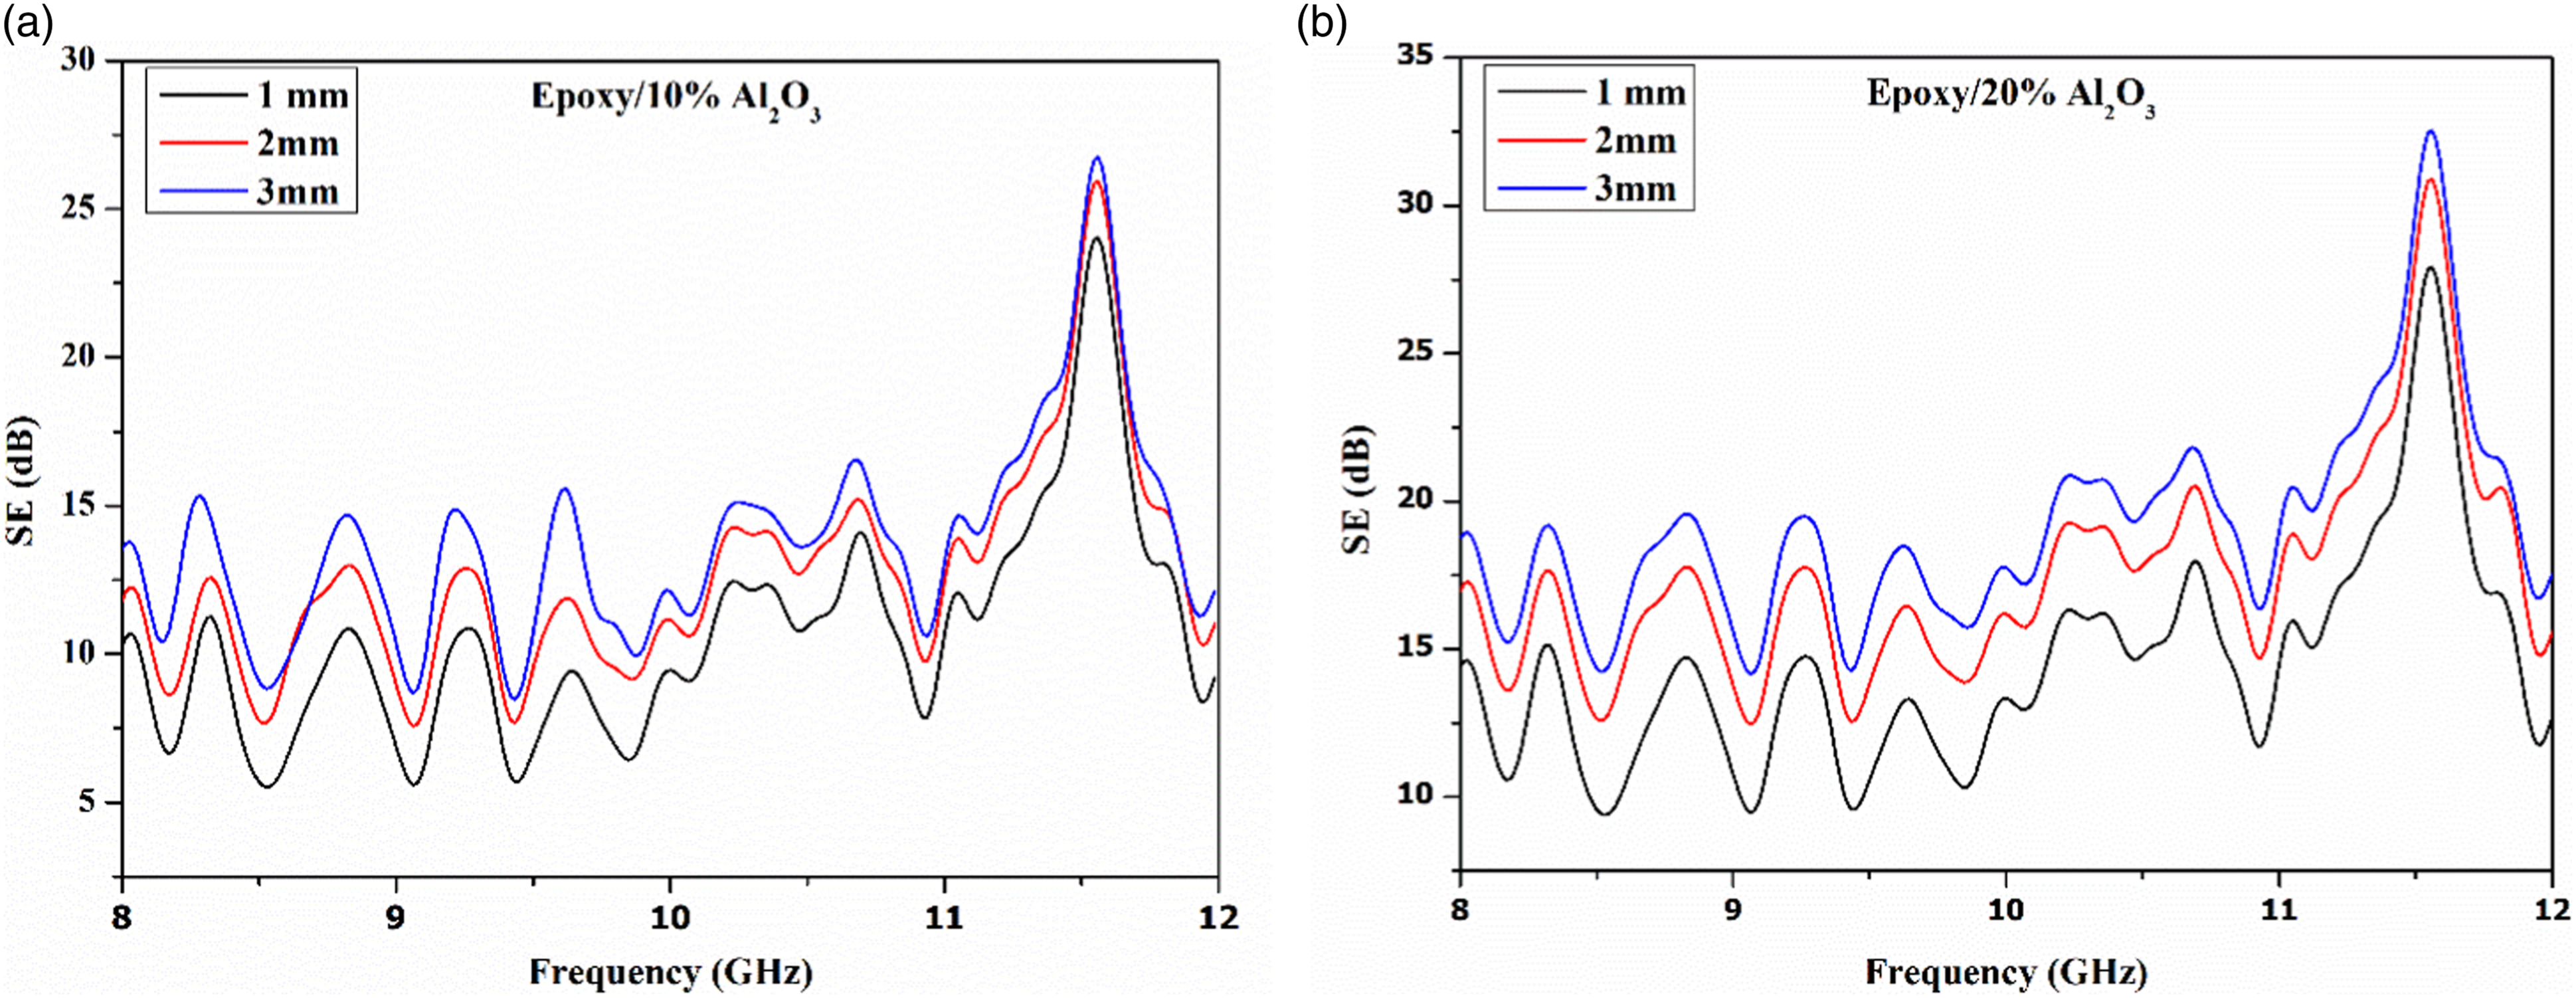
Examining Figures 8 (a) and (b), it can be observed that the EM shielding performance of the cast films gradually improves with both particle content and thickness. For the 10% Al2O3 content, the SE values range from approximately 8 dB, 10 dB, and 14 dB in the 8-11 GHz range, for samples with thicknesses of 1 mm, 2 mm, and 3 mm, respectively. As the thickness and frequency increase, the SE values exhibit further improvement and extend the peak at 11.5 GHz, reaching 24 dB, 25 dB, and 27 dB for samples with thicknesses of 1 mm, 2 mm, and 3 mm, respectively. This indicates effective shielding and absorption for the intended application.
When the Al2O3 content is increased to 20% (Figure 8(b)), the average SE values increase slightly comparing with those of 10% content, suggesting saturation of the nanoparticles and indicating over 90% shielding of EM waves. Moreover, the SE values of the samples exhibit significant fluctuations with frequency, highlighting a variable shielding performance depending on the frequency.
Furthermore, it is worth noting that SEt is influenced by both the electrical conductivity and the thickness of the shielding material, as described in previous studies.38,39 This explains why the film with a 20% Al2O3 content exhibits a higher EMI-SE of 30 dB, while the film with a 10% Al2O3 content has SE values of 25 dB. The measured results of EMI-SE validate that the incorporation of nanoparticles enhances both EM reflection and absorption in the resin matrix due to their inherent characteristics.
Conclusions
The dissipation of microwave energy arises from the intricate interplay of multiple factors, encompassing dielectric loss, magnetic loss, well-matched impedance, the cumulative impact of multiple reflections, and absorption along the intricate pathways defined by nanoparticles. Leveraging their inherent strengths in both high RL and absorption values, composites built upon Al2O3 exhibit tremendous potential as ideal candidates for the terminal component within micro-radar absorption structures. This proposition gains further credence considering that approximately 50% of the incident wave is reflected at the material boundary, and subsequently, an impressive 90% of the transmitted wave is absorbed within the material itself. This configuration effectively limits the penetrating wave through the composite panel to a mere 5%, corresponding to an impressive 20 dB in terms of shielding effectiveness. Consequently, these Al2O3-based composites emerge as formidable contenders for a premium end material choice, bearing remarkable microwave shielding capabilities.
Footnotes
Declaration of Conflicting Interests
The author(s) declared no potential conflicts of interest with respect to the research, authorship, and/or publication of this article.
Funding
The author(s) received no financial support for the research, authorship, and/or publication of this article.
Data Availability Statement
The data given in this article are Raw data were generated at Ecole Militaire Polytechnique. Derived data supporting the findings of this study are available from the corresponding author Oussama Mehelli on request.