
Abstract
This article offers a close examination of a small selection of pedigrees taken from German Mendelian and eugenic scholarship of the 1920s and 1930s. It examines the procedures that became customary for presenting data on human inherited pathologies, as well as the frequent changes in the information content of those charts. Relevant biographical and genealogical data was removed, and important indications regarding the diagnostic methods applied by the investigating scholar were lost, as soon as a pedigree was charted or reproduced. Data on healthy individuals was condensed, leading to an emphasis on the hereditary burden of pathological traits. At times, healthy individuals were entirely omitted, as were exogenous martial partners. These modifications paved the way for further theoretical amendments, including the addition of ‘carrier’ status to chosen individuals along the pedigree. With this addition, these pedigrees changed their ontological status, from empirical records of human reproduction to partially hypothetical illustrations of Mendelian theory itself. This process was complemented by the representation of theoretical genetic models in the format of a human pedigree. A comparison to practices of charting pedigrees still common today suggests that the processes hereby revealed are far from exceptional. In line with the ideas put forward by Ludwik Fleck, they are interpreted as germane to the way scientific ideas are communicated and propagated and to the scientific culture of genetics. The article also offers a refinement to Fleck’s analysis of textbook construction, which highlights the extent to which textbook examples differ from the original data on which they are based.
Introduction
Over the past 150 years, pedigree charts have been central to the study of the inheritance of human pathologies. Despite some continuities in their form and format (Resta, 1993), their role and meaning has changed continuously, corresponding to revolutionary changes in our understanding of the mechanisms governing the hereditary process. In 2008, Jean-Paul Gaudillière offered a useful typology of medical pedigrees throughout this period. He differentiated between ‘eugenic pedigrees’, which disseminated the notion of societal degeneration; ‘clinical pedigrees’, which visualized illness as a familial matter; ‘genetic pedigrees’, which made palpable the mechanisms of Mendelian transmission; and ‘molecular pedigrees’, used for exemplifying molecular mutations. Building on the ideas put forward by the scientist, doctor, and philosopher of science Ludwik Fleck (1979), Gaudillière showed how each type of chart was circulated in different lay (exoteric) and expert (esoteric) circles and embodied the predominant ideas and ideals of its respective ‘thought collective’ (Gaudillière, 2008).
Like Gaudillière, previous scholars who have studied the role of pedigrees in promoting eugenic causes or in disseminating Mendelian theory often point to the overall association between pedigree formats and the ideology of those circulating them (Lombardo, 2001; Mazumdar, 1992; Müller-Wille and Rheinberger, 2012; Shotwell, 2021; Stillwell, 2012). Only rarely, however, do they examine how specific charts were reworked as they migrated from one arena to the next, even within the same ‘thought collective’. 1 That is precisely what I wish to do here: to reveal and analyze the changes in pedigree information content, beginning with their first version in print and following their reproduction in later scientific and popular venues. I have identified eight different practices of presentation and re-presentation that influenced the information content of genealogical-turned-medical-turned-Mendelian pedigree charts, which, for convenience's sake, I have grouped into four categories.
All of the pedigrees in my sample stem from publications by German scholars who studied or publicized human Mendelian heredity during the 1920s and 1930s. At the time, in the context of German-turned-Nazi eugenic agendas, Mendelian theory was highly imbued with social and political agendas. Mendelian ideas informed perceptions of the dangers believed to be posed by racial others (primarily Jews) and by socio-medical ‘inferiors’ (the ‘feebleminded’ or ‘insane’), and also guided some of the steps that were taken to eradicate these perceived dangers (Bock, 1986; Teicher, 2020; Weingart, Kroll, and Bayertz, 1988). The pedigrees at the center of the present study therefore lie somewhere between Gaudillère's first, second, and third categories; they began as clinical pedigrees, morphed into genetic ones, and ended up serving explicitly eugenic goals. Despite this fact, I argue that my findings tell us much more about ordinary scientific work – which, in this case, revolved around the consolidation of the Mendelian paradigm – than about any sinister form of Nazi propaganda or eugenically tainted scientific misconduct. 2 Toward the end of article I will support this argument by comparing my findings to practices still customary today among human geneticists, and, building on Ludwik Fleck's writing, by offering a theoretical interpretation that will place my findings well within the bounds of ‘normal science’.
The dearth of the clinic (or: Turning genealogies into medical pedigrees)
One of the defining features of medical pedigrees – often evident already in their first version in print – was the utter disregard of biographical data, that is, of the names of the individuals depicted; of their birth, marriage, or death dates; and of similar personal information that in other contexts – whether historical, sociological, or genealogical – was considered essential for depicting human familial relations. The replacement of individual names and birthdates with geometric forms (Mars and Venus signs, or circles and squares), which may seem natural to us today, was far from trivial at the time. For example, after his visit to the 1911 Dresden Hygiene exhibition, the influential genealogist Kekulé von Stradonitz fiercely criticized this mode of graphical presentation. He drew the attention of physicians to the fact that ‘the mere depiction of characteristics without the accompanying names and years is extremely unsatisfactory, because it rules out any verification of the accuracy [of the data]’. It had already been proven, he explained, that family charts often contained mistakes, and it was therefore essential that such charts be presented along with the relevant biographical data to enable their re-examination by peers (von Stradonitz, 1912: 39; see similarly von den Velden, 1915).
Von Stradonitz was one of the main advocates of adapting genealogy to the needs of biological research; still, he considered it crucial to avoid the sole depiction of traits when compiling pedigrees, even if those pedigrees’ explicit goal was to follow the familial transmission of medical or pathological features. Notwithstanding his medico-biological inclinations, this approach is indicative of his primary affiliation – in Fleck's terms, the ‘thought collective’ to which he belonged and from which he drew his methodological preferences and sensitivities – which was the genealogical community, with its own set of values and norms. The tension, and sometimes even manifest conflict of interest, between the clinical, medical, and biological perspective and the genealogical, sociological, and historical one found various expressions in Germany at the time. Ultimately, all the attempts by willing genealogists to try to adapt to the needs of hereditary researchers failed; the gaps in the aims, methods, and suppositions of the two groups could not be bridged, if only because the former were interested in particulars and the latter in generalizations (Gausemeier, 2006; Teicher, 2020: 56–63).
In addition to names and birth/marriage/death dates that were routinely omitted, perhaps the most significant type of data that became lost upon the first publication of a pedigree was the method of clinical diagnosis. For example, in 1923, an important otolaryngologist from the Tübingen University Clinic by the name of W. Albrecht published a paper discussing the mode of heredity of ‘constitutional sporadic deaf-mutism’. Albrecht (1923) prided himself on the fact that unlike previous scholars, who had based their studies on questionnaires, he had collected his material from institutes for the deaf mute, personally examined many individuals, and then complemented his familial inquiries with information he had extracted from parish records. Since deaf mutes were denied confirmation in Protestant churches and, when considered ‘idiotic’, did not receive the anointing of the sick sacrament in Catholic ones, church records could reveal deaf mutes of earlier generations that had previously been unknown. Such discoveries were then cross-referenced with other sources or testimonies. In short, it was Albrecht's talents as an amateur genealogist, not only as a doctor, that helped him devise his pedigrees of deaf mutism. His text openly outlines these issues; his charts, however, do not (see Figure 1). In another case, a psychiatrist studying the heritability of Huntington's chorea published a pedigree where he distinguished between those who were dead at the time the study was performed – designated with a cross sign – and those who were still alive (Entres, 1921: 98). This at least hinted to the reader that many of those included had not been diagnosed by the researcher publishing the data. When his chart was reproduced in the commentary to the Nazi Sterilization Law (to which we will soon turn), this distinction disappeared (Gütt, Rüdin, and Ruttke, 1934: 23).
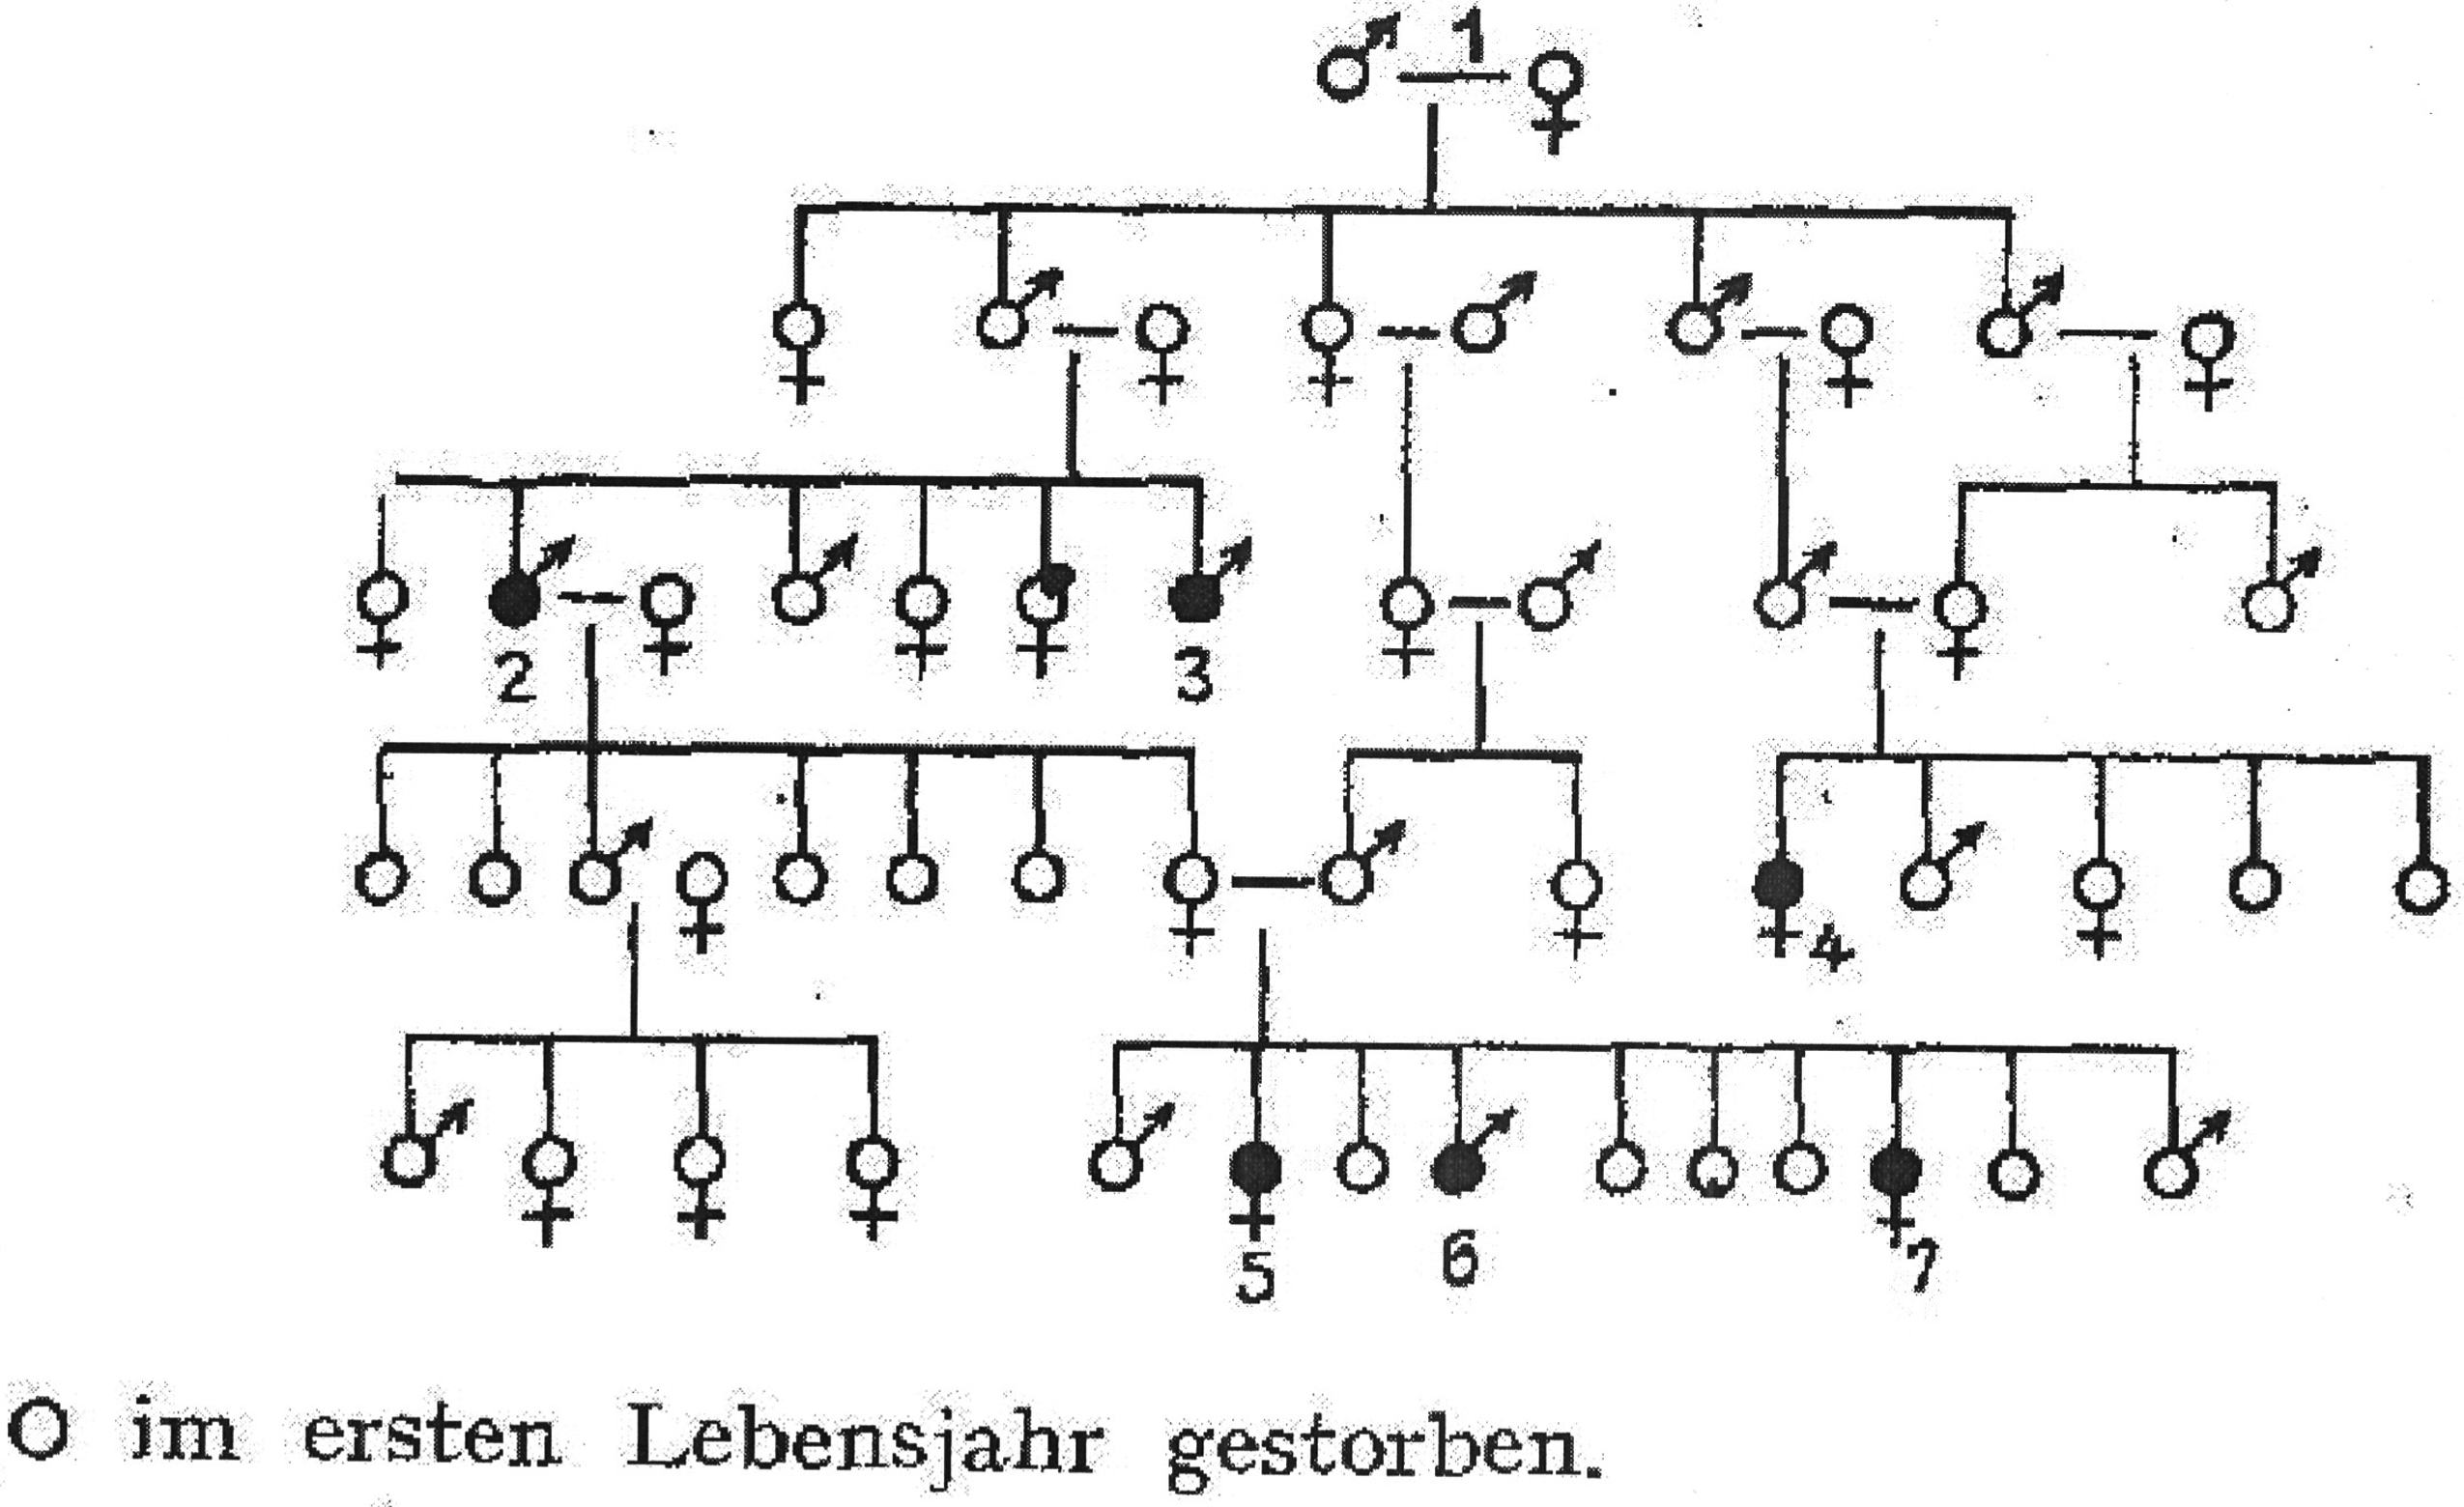
A pedigree of deaf mutism in a family, as it appeared in a 1923 publication by a German otolaryngologist. An empty circle without cross/arrow designates children who died in infancy (Albrecht, 1923: 25).
Beyond these two specific examples, the sheer number of generations depicted within human pedigrees – anywhere between three and seven was the norm – pointed to an intrinsic diagnostic conundrum, because no researcher could possibly have determined the existence of the same trait, using the same method, for an infant and for their (already deceased) great-grandparent. Whether the trait under study was palm shape, short-sightedness, epilepsy, or schizophrenia, information on distant family members by necessity had to rely on judgments made by others, on testimonies of acquaintances, on official records, or on inferences from photographs, school records, and so on. As in the case cited above, original papers usually documented these subtleties, supplying details on how diagnoses had been practically determined. 3 Yet as soon as the data was presented in a chart, even within these original papers, such discrepancies in the way data had been obtained and interpreted – along with the aforementioned genealogical data – receded into the background or vanished altogether. The chart, an epitome of what Bruno Latour (1990) terms the ‘immutable mobile’ (easily reproducible, communicable, and combinable), focused on one thing only: who had the outstanding trait, and who did not. All those who were deemed to have it were denoted using the same graphical symbol, thereby leaving no trace of the (often indirect) way traits had been determined.
The disappearance of the healthy man from Mendelian cosmology (or: The merging and omission of healthy siblings)
As a general rule, one of the features that distinguished eugenic (or eugenic-related) pedigrees from Mendelian (or soon-to-be-Mendelian) ones was that the former displayed the relationship between many maladies or talents in a group of interrelated families, whereas the latter focused on the presence or absence of a chosen trait (usually a ‘deviant’, ‘pathological’ one) among different members of a single, if extended, family. In the second case, it was customary to denote those who had the trait with the color black (a filled circle or square) and those without the trait with an empty, white shape. When pedigrees became large, scholars found it convenient to use a single symbol to denote jointly all the healthy siblings of a single couple, and write the number of such siblings in the shape's center. Thus, for example, five healthy brothers could be depicted using one circle with the number 5 inside it. Importantly, however, this graphical shortcut was only rarely applied to individuals who did exhibit the trait under study. Thus, as a rule, every individual who manifested the trait was represented with their own independent symbol. In theory, this practice did not alter the information contained within the pedigrees. But it did give more visual prominence to those exhibiting the (often malignant) traits than to their unaffected relatives, thus contributing to the visual impression of pedigrees overloaded with sick individuals.
This impression was reinforced by another practice customary among researchers of human heredity: the omission of healthy individuals from pedigrees altogether, unless they were essential for showing genealogical connections between those who were sick. Already in 1906, the British Mendelian biologist William Bateson warned against this common practice: ‘It is absolutely necessary that the normal or unaffected members should be recorded, together, if possible, with the information as to their offspring. In the records hitherto published these essentials have too often been omitted, the doctor's attention having been more or less exclusively directed to the individuals manifesting the disease’ (Bateson, 1906: 67). His warnings would later find resonance in the development of better techniques for statistical treatment of genealogical data to correct such biases. But when it came to visual representation, the same (mal)practices continued – even in Bateson's own publications (e.g. Bateson, 1906, 1913).
The merging of unaffected siblings and the omission of healthy relatives stressed the burden of disease, a fact that fitted smoothly with the eugenic anxieties aroused by ‘hereditarily burdened’ families. As psychiatrist Wilhelm Strohmayer admitted as early as 1908, ‘When looking at pedigrees, one is always attracted to the black spots, because they make themselves noticeable in the most unpleasant manner. Little or nothing at all is said on the healthy elements’ (Strohmayer, 1908: 480). Again, what appeared noteworthy and perhaps even problematic to Strohmayer seemed entirely trivial two decades later to Johannes Lange, another psychiatrist, who commented that ‘our chart includes, naturally, only the psychotic and psychopathic members of the family with the necessary connecting links’ (Lange, 1925: 330).
As Lange's statement further reveals, the omission of healthy individuals from pedigrees often occurred in the first printed version of those charts. At other times, it took place when scholars reproduced previously published pedigrees – in order to offer alternative hypotheses to those expounded originally, to further propagate theoretical views similar to those shared by the original authors, or to use the pedigrees as part of scientific and political propaganda – and took the liberty of omitting supposedly redundant information. 4 Importantly, this graphical reduction of information was not done insidiously; the fact of omission was often stated explicitly or otherwise indicated. 5 As soon as those healthy individuals were removed from the chart, however, they were quickly forgotten altogether. This was the case with one of Albrecht's pedigrees, mentioned above. In his 1923 paper, Albrecht took special note of toddlers who had died in infancy. Given their premature death, it was impossible to know if they were deaf or not. Still, Albrecht gave graphical expression to these toddlers. Four years later, the third edition of the German textbook on Human Heredity and Racial Hygiene was published. Authored by Weimar Germany's most prominent plant geneticist (Erwin Baur), racial anthropologist (Eugen Fischer), and eugenicist (Fritz Lenz), this textbook was quick to acquire its status as an authoritative, widely read, and highly esteemed publication (Fangerau, 2001). In the reproduced version of Albrecht's chart, those infants who had passed away were not redrawn (Lenz, 1927a: 213; Figure 2). The fact of their removal from the chart was at least mentioned in writing; a subscript explained that ‘children who died in their first year of life are omitted’. Six years later, this chart was reproduced once again, appearing in the aforementioned commentary to the Nazi Sterilization Law (Gütt, Rüdin, and Ruttke, 1934: 29; Figure 3). The commentary was a binding legal document instructing doctors on the implementation of forced sterilization in Nazi Germany; its introduction summarized the relevant knowledge regarding the hereditary nature of human traits, stressing the fact that Mendelian laws were valid for a range of human pathologies. When the reworked version of Albrecht’s chart was printed in the commentary, the subscript mentioning the dead infants had disappeared, and along with it, the fact that these children had ever existed.
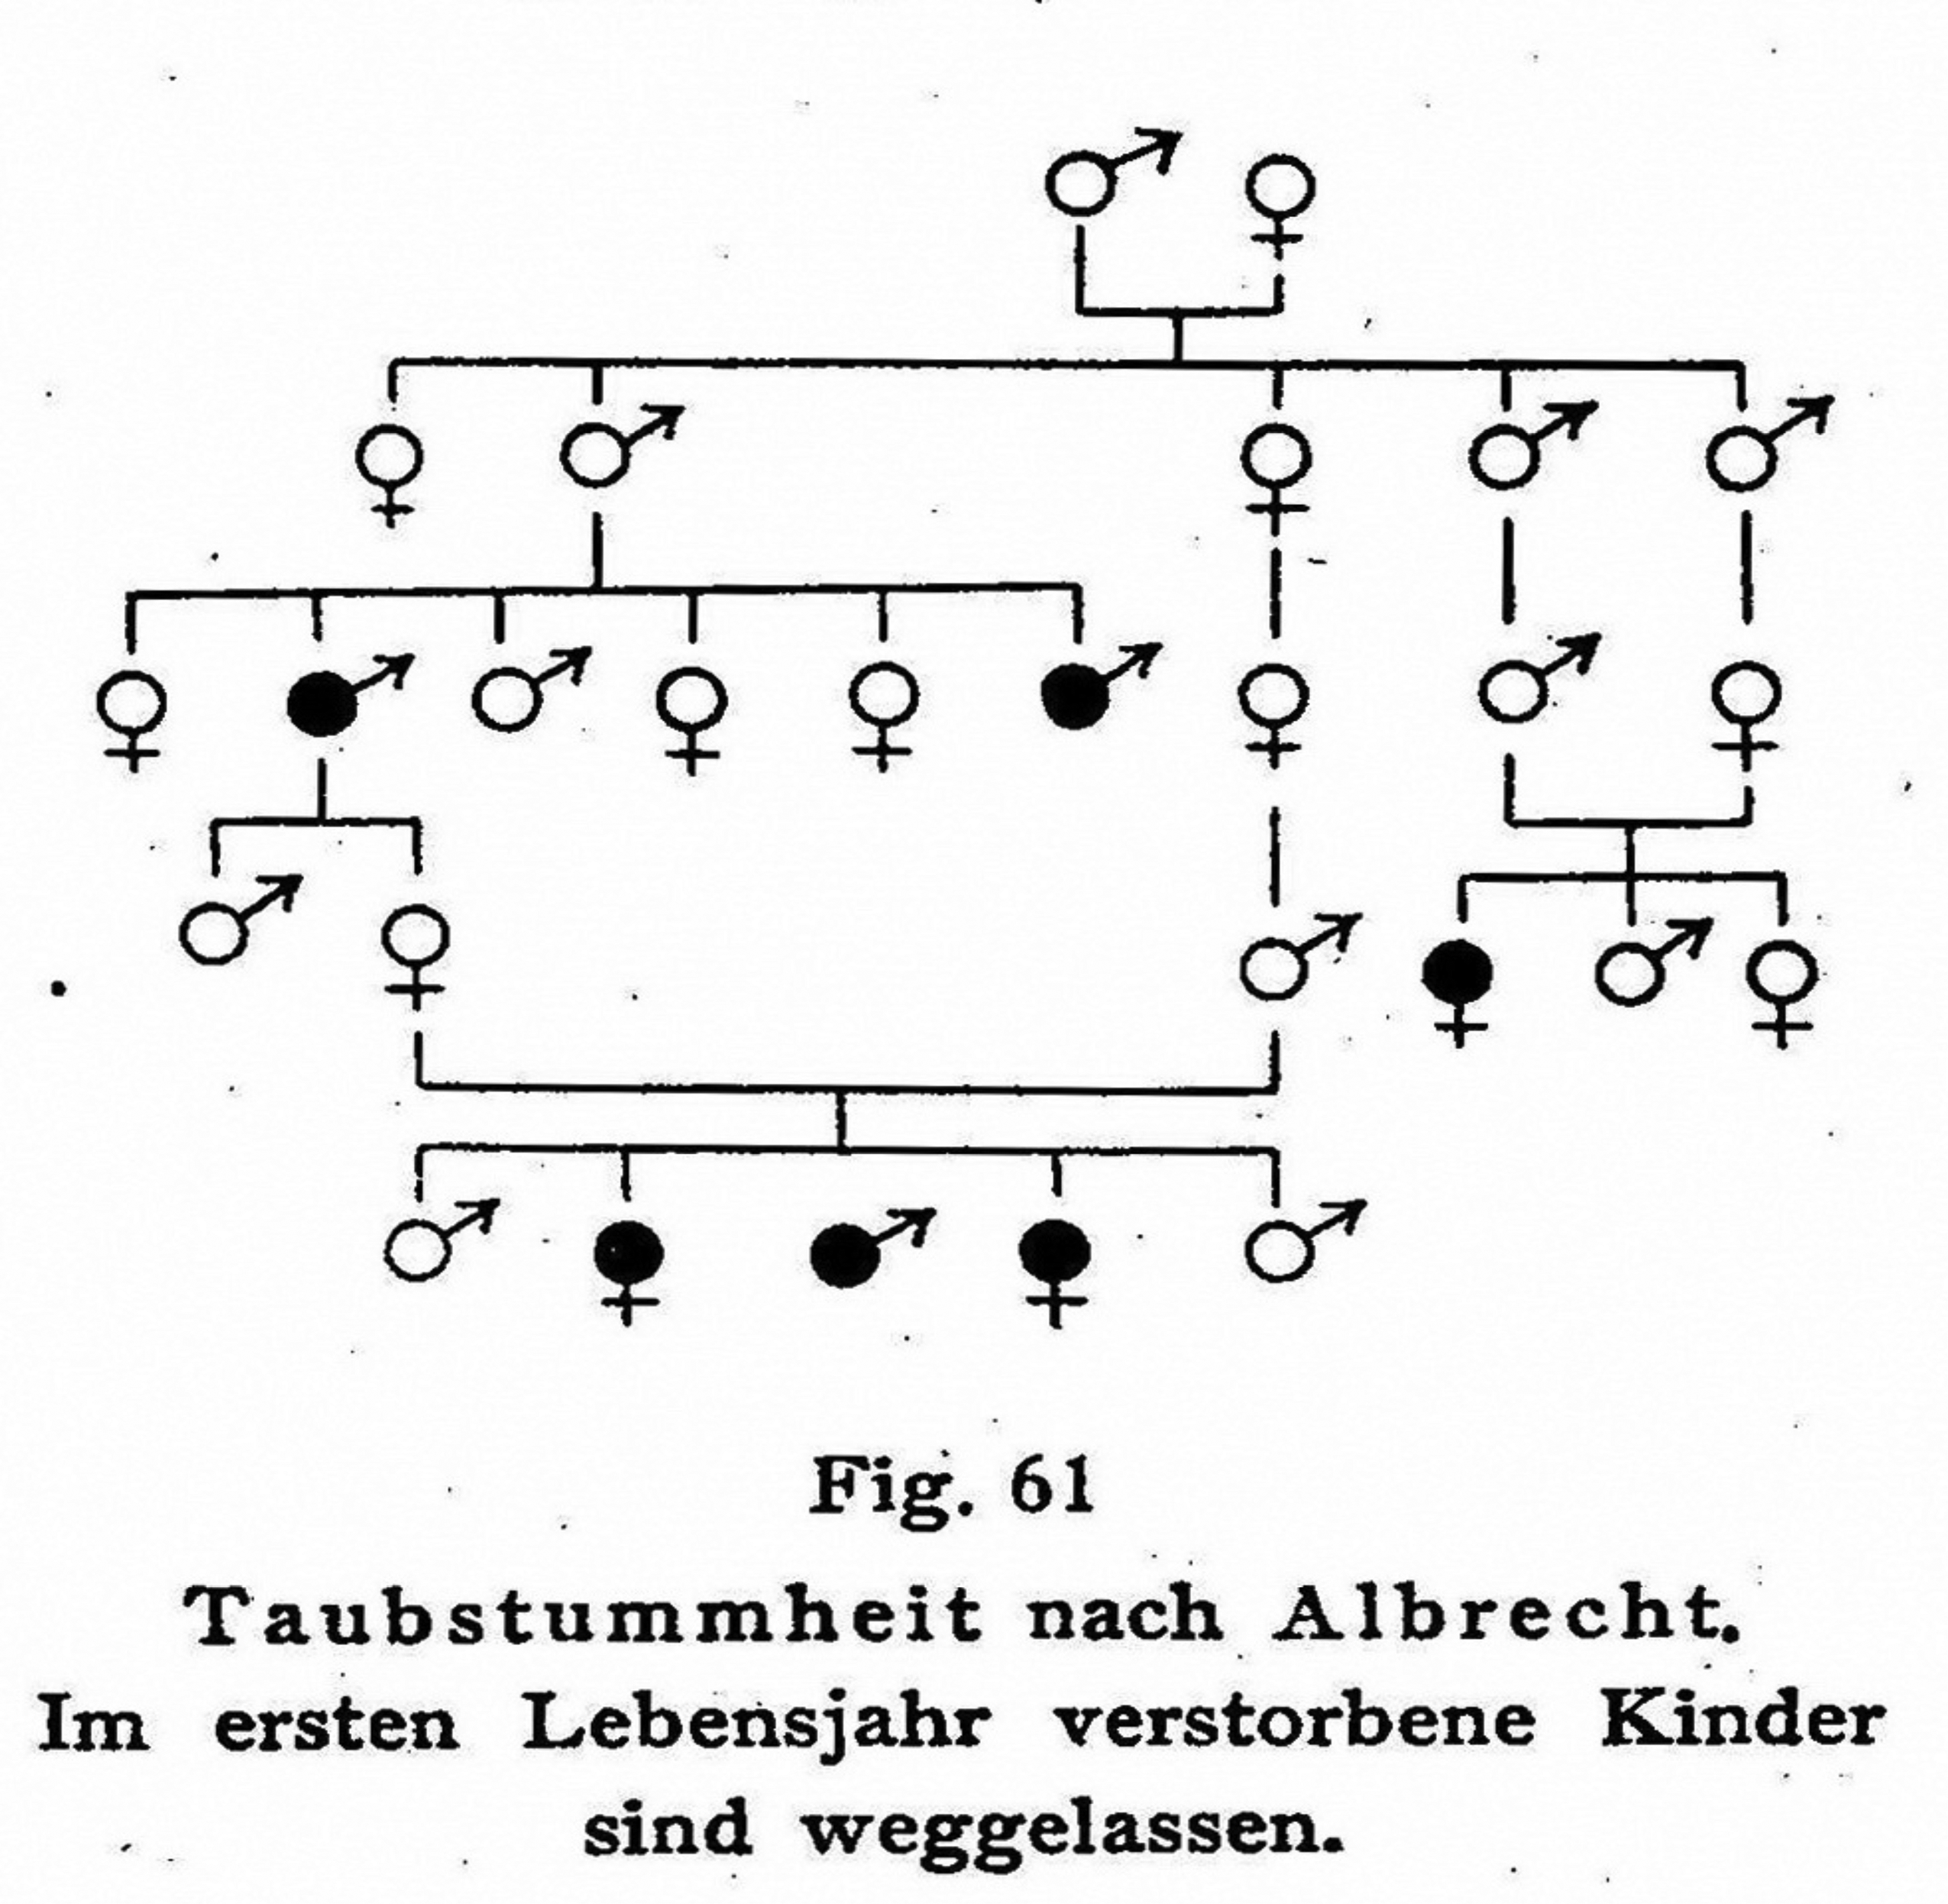
Albrecht’s pedigree of deaf mutism as it was reproduced in a German textbook of genetics and eugenics. Children who died young are omitted from the chart, but their omission is stated explicitly; exogenous marital partners and healthy family branches are also omitted (Lenz, 1927a: 213).
The pedigree of deaf mutism from Albrecht as it appeared in the official commentary to the Nazi Sterilization Law. Note the addition of ‘carrier dots’ (see text; Gütt, Rüdin, and Ruttke, 1934: 29).
Yet even before such losses of information took place, the abbreviation of data on healthy siblings and the omission of healthy relatives could lead professional researchers to misleading visual impressions regarding their very own materials. For example, in 1932, a scholar named Hans Christoph Meyer published a paper on the heritability of the tendency to give birth to twins. Meyer argued that his drawings ‘clearly show the existence of a hereditary disposition’ for twin birth in the family (Meyer, 1932: 397, 408). This claim was heavily criticized by the eugenicist Fritz Lenz, who pointed out that this astonishing accumulation of twins has been created to a large extent by Meyer's manner of representation. As he himself says, for the sake of saving space he has ‘reduced [the drawings] to a minimum’. Basically, only the siblings of twin pairs, their parents and their grandparents have been fully specified. Of the rest of the family, only the ancestors who could be carriers of hereditary dispositions according to Meyer's view and the twins stemming from them in the next generations were depicted. Wherever several brothers and sisters are present, they are not shown separately, but given only summarily by a number. Meyer’s kinship charts therefore owe their impressive accumulation of twin pairs to an enrichment process. (Lenz, 1933: 294; emphasis in original)
Twin birth was not considered a pathological disposition (even though it was, to an extent, a ‘deviant’ one). Meyer was not suspected of manipulating his chart to make it more compatible with eugenic ideology. But by applying conventional graphical practices to his own chart, he superficially and perhaps unintentionally created a misrepresentation of the phenomenon he was investigating, one that overstressed the role of heredity. These practices were indeed so common that – his own critical remarks notwithstanding – Lenz had no hesitation in using the same kind of denotational conventions in pedigrees that he himself published, and even in recommending on other occasions, ‘not as proof, but merely for purpose of illustration’, ‘the substantial contraction of pedigrees’ both ‘by omitting whole branches’ and by ‘drawing together siblings with a single number in their circle’. 6
Theorizing and intervening (or: The adaptation of pedigrees to the Mendelian framework)
A specific category of omission of healthy persons deserves special attention, since it was particularly bound up with Mendelian reasoning. Already during the 19th century, the centuries-old preoccupation with the consequences of marriage among kin-relatives began to gain a biological inflection, with some scholars pointing to the fact that children of close relatives (siblings, cousins, fathers, and daughters) suffered from multiple physiological deficiencies (e.g. Bemiss, 1858). After 1900, this observation found corroboration in one of the core features of Mendelian experiments: the reappearance of recessive traits when siblings were mated. The accepted orthodoxy stated that maladies that appeared following consanguineous marriage, or even maladies that were frequent in strongly inbred populations (i.e. in isolated communities, in remote rural villages, among orthodox Jews, etc.) were in all probability caused by recessive genes (e.g. Lenz, 1927b: 435–40; Wulz, 1925). This association, still considered valid today, was grounded on probabilistic reasoning: for any given trait controlled by a rare recessive gene, the chances that such a gene would regain its homozygosity and thereby manifest itself in the phenotype was greatly enhanced as soon as endogenous marriage took place (Lenz, 1919).
These statistical principles could be demonstrated most easily with the help of concrete examples. Textbooks on human heredity therefore showed a strong preference for presenting the inheritance of recessive traits with examples of pedigrees of inbred families. Within these pedigrees, exogenous spouses (i.e. those that did not stem from the family's common ancestors) were systematically omitted; after all, it was (presumably) not from them that the recessive disposition emanated. This omission of exogenous marital partners is conceptually distinct from the omission of healthy family members mentioned above. The practice of discarding healthy family members was motivated primarily by scientific parsimony; in contrast, the omission of extraneous marital partners was based on a specific line of reasoning regarding the hereditary transmission of the trait under investigation. The former was based on clinical, phenotypic criteria, the latter on who was (or was not) a likely carrier or transmitter of the genes believed to be responsible for the later appearance of the trait.
Consider, once again, the difference between the pedigree shown in Figure 1 (Albrecht, 1923) and its reproduction in the textbook of heredity (Lenz, 1927a: 213; Figure 2). In the reproduced version, all the exogenous marital partners have simply disappeared. As was the case with the previous alterations, the cumulative impact of this graphical reduction was that consanguinity became even more pronounced; the family circle seemed to be composed only of individuals belonging to one and the same family, and all the troubles of that family became attributable to a single source, or couple. The introduction of ‘foreign blood’ into the family was lost from sight, along with the alternative hypotheses that it could have raised.
In addition to all the changes to the content and form of the pedigrees surveyed above, another graphical procedure was pivotal in reconfiguring pedigrees to support the Mendelian research program. This procedure included the addition, not the subtraction, of information. A black dot was drawn inside symbols denoting those who were presumed to be carriers of recessive ailments, the alleged transmitters of a hereditary disease. At first, this dot was added to the parents of those who manifested a recessive disposition. Designating those parents as carriers was a necessary corollary of the definition of the disease as a recessive ailment. 7 Dots were also added to the parents of those parents: the grandparental generation. Due to the customary screening of exogenous marital partners already performed at an earlier stage, at this generation level there was often only a single parent depicted by this point. Thus, the only remaining parent was designated as a heterozygous carrier. Finally, in cases where the familial malady could be attributed to a single common ancestral root, the origin of the malignant gene needed to be attributed to one of the partners of the original couple. At this stage, the choice of whether to accredit the origin to the great-great-grandmother or great-great-grandfather could be an arbitrary one (see Figure 3).
The designation of carriers therefore built on the previous processes of graphical reduction, but added to them a series of inferential moves. Analytically, dots were added from the bottom up: from the manifested trait to its hypothetical origins. But once the pedigree had been charted, it was ‘read’ from the top down: from the ancestral couple and the (presumed) carrier parents to their descendants. In this reading, carrier parents ceased to be scholarly inferences stemming from their children's manifested traits, and turned into natural entities, causative agents for their children's maladies. In this way, the addition of carrier dots to the pedigree authoritatively transformed probable hypotheses into seemingly factual statements and created a facade of scientific certainty about the origins of human pathologies, instead of presenting them as hypotheses or scientific conjectures. 8
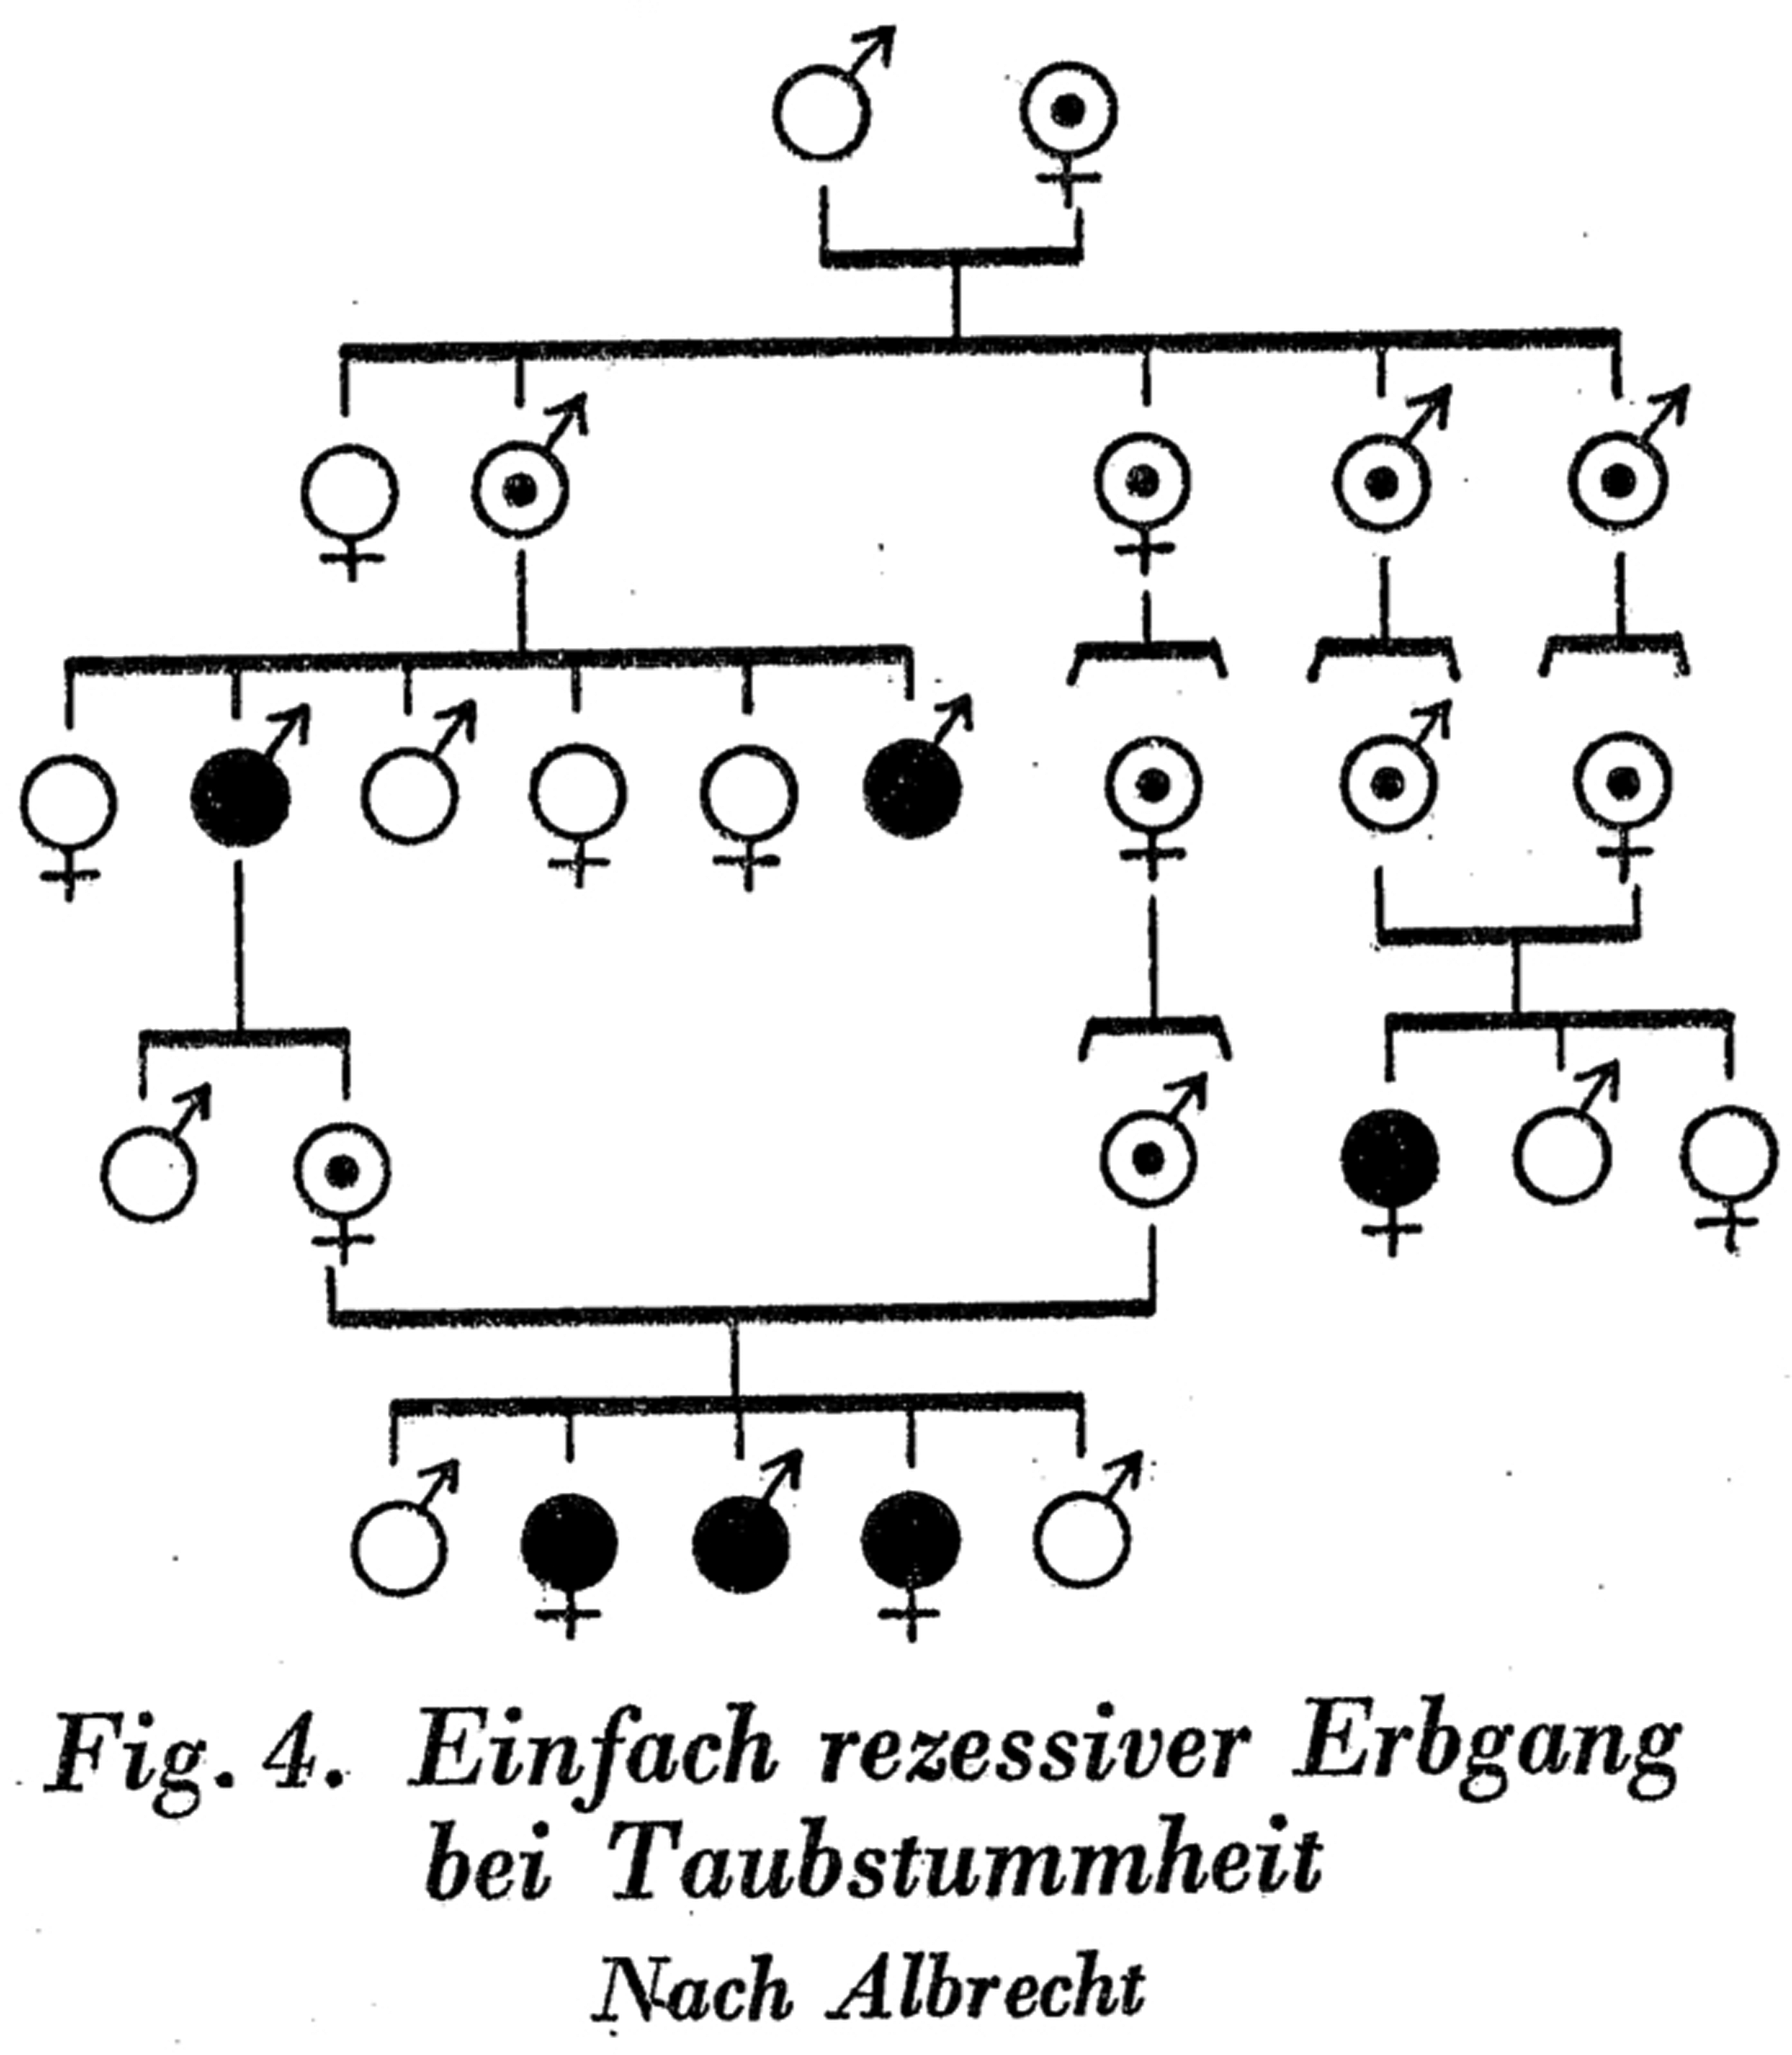
This manner of visual presentation, which assigned the carrier status to parents of carriers simply because they belonged to the carrier family, may have seemed reasonable from a geneticist's point of view. But it was not inevitable. Even if one accepted that the trait under study was a recessive one, one could make a sharper differentiation between necessary corollaries, probable inferences, and arbitrary choices. In 1929, physician Max Bigler, who shared the view that deaf mutism was a simple recessive trait, provided an alternative. In the chart that he drew, he made a clear distinction between two levels of scientific certitude. A dot in the middle of a circle denoted a heterozygous carrier; a tiny inner circle, however, stood for ‘questionable latent [hereditary] burden: when both partners of a marriage carry this denotation, then one of them is burdened for sure, but it cannot be distinguished which one’ (Bigler, 1929: 83; Figure 4). Accordingly, Bigler also used two different formats for connecting persons on the chart: a solid line stood for ancestral origins through which the ‘hereditary burden’ must have passed, while a dotted line stood for ancestry through which the burden might have passed.
An excerpt from a pedigree on deaf mutism that offers an alternative method for representing genetic relations, one that differentiates between different levels of certainty regarding the source of the recessive malady (Bigler, 1929: 83).
Bigler's method, however, found very little resonance. Researchers chose not to embrace such a denotation system, which may have been more meticulous but was also more cumbersome. By practically rejecting his method, the scholarly community opted not to distinguish between different levels of scientific validity. Consequently, it became difficult to distinguish in such pedigrees which information represented empirical findings and which stood for (probable, plausible, or even arbitrary) scholarly inferences.
We have never been empirical (or: The total conflation of theoretical models and empirically based pedigrees)
Carrier dots could be added not only upward but also downward, to descendants of carriers. Consider the case of the pedigree shown in Figure 5, which deals with the inheritance of glaucoma, and which also appeared in the commentary to the Nazi Sterilization Law. Glaucoma was identified as following sex-linked inheritance. In the chart shown here, carrier status was given not only to the parents of the glaucoma sufferer and their ancestors, but also to healthy daughters of carrier mothers. According to Mendelian expectations, on average half of these daughters should become carriers. To express this visually, every second female child of a carrier mother in the pedigree was denoted as being a carrier (see in Figure 5 the family in the bottom-left corner as well as the family on the right), even though there was no (and could not have been any) indication that they were indeed such carriers. As a result of this addition, the families in the pedigree presented distributions that corresponded with Mendelian expectations (Gütt, Rüdin, and Ruttke, 1934: 35). Due to such additions, however, the pedigree moved one critical step further away from presenting empirical findings and toward describing a theoretical model. Since such charts were juxtaposed with theoretical descriptions of Mendelian inheritance and used to corroborate the relevance of Mendelian teaching to real-life phenomena, an extraordinary circular argumentation was formed: Mendelian theory was corroborated by its own representations.
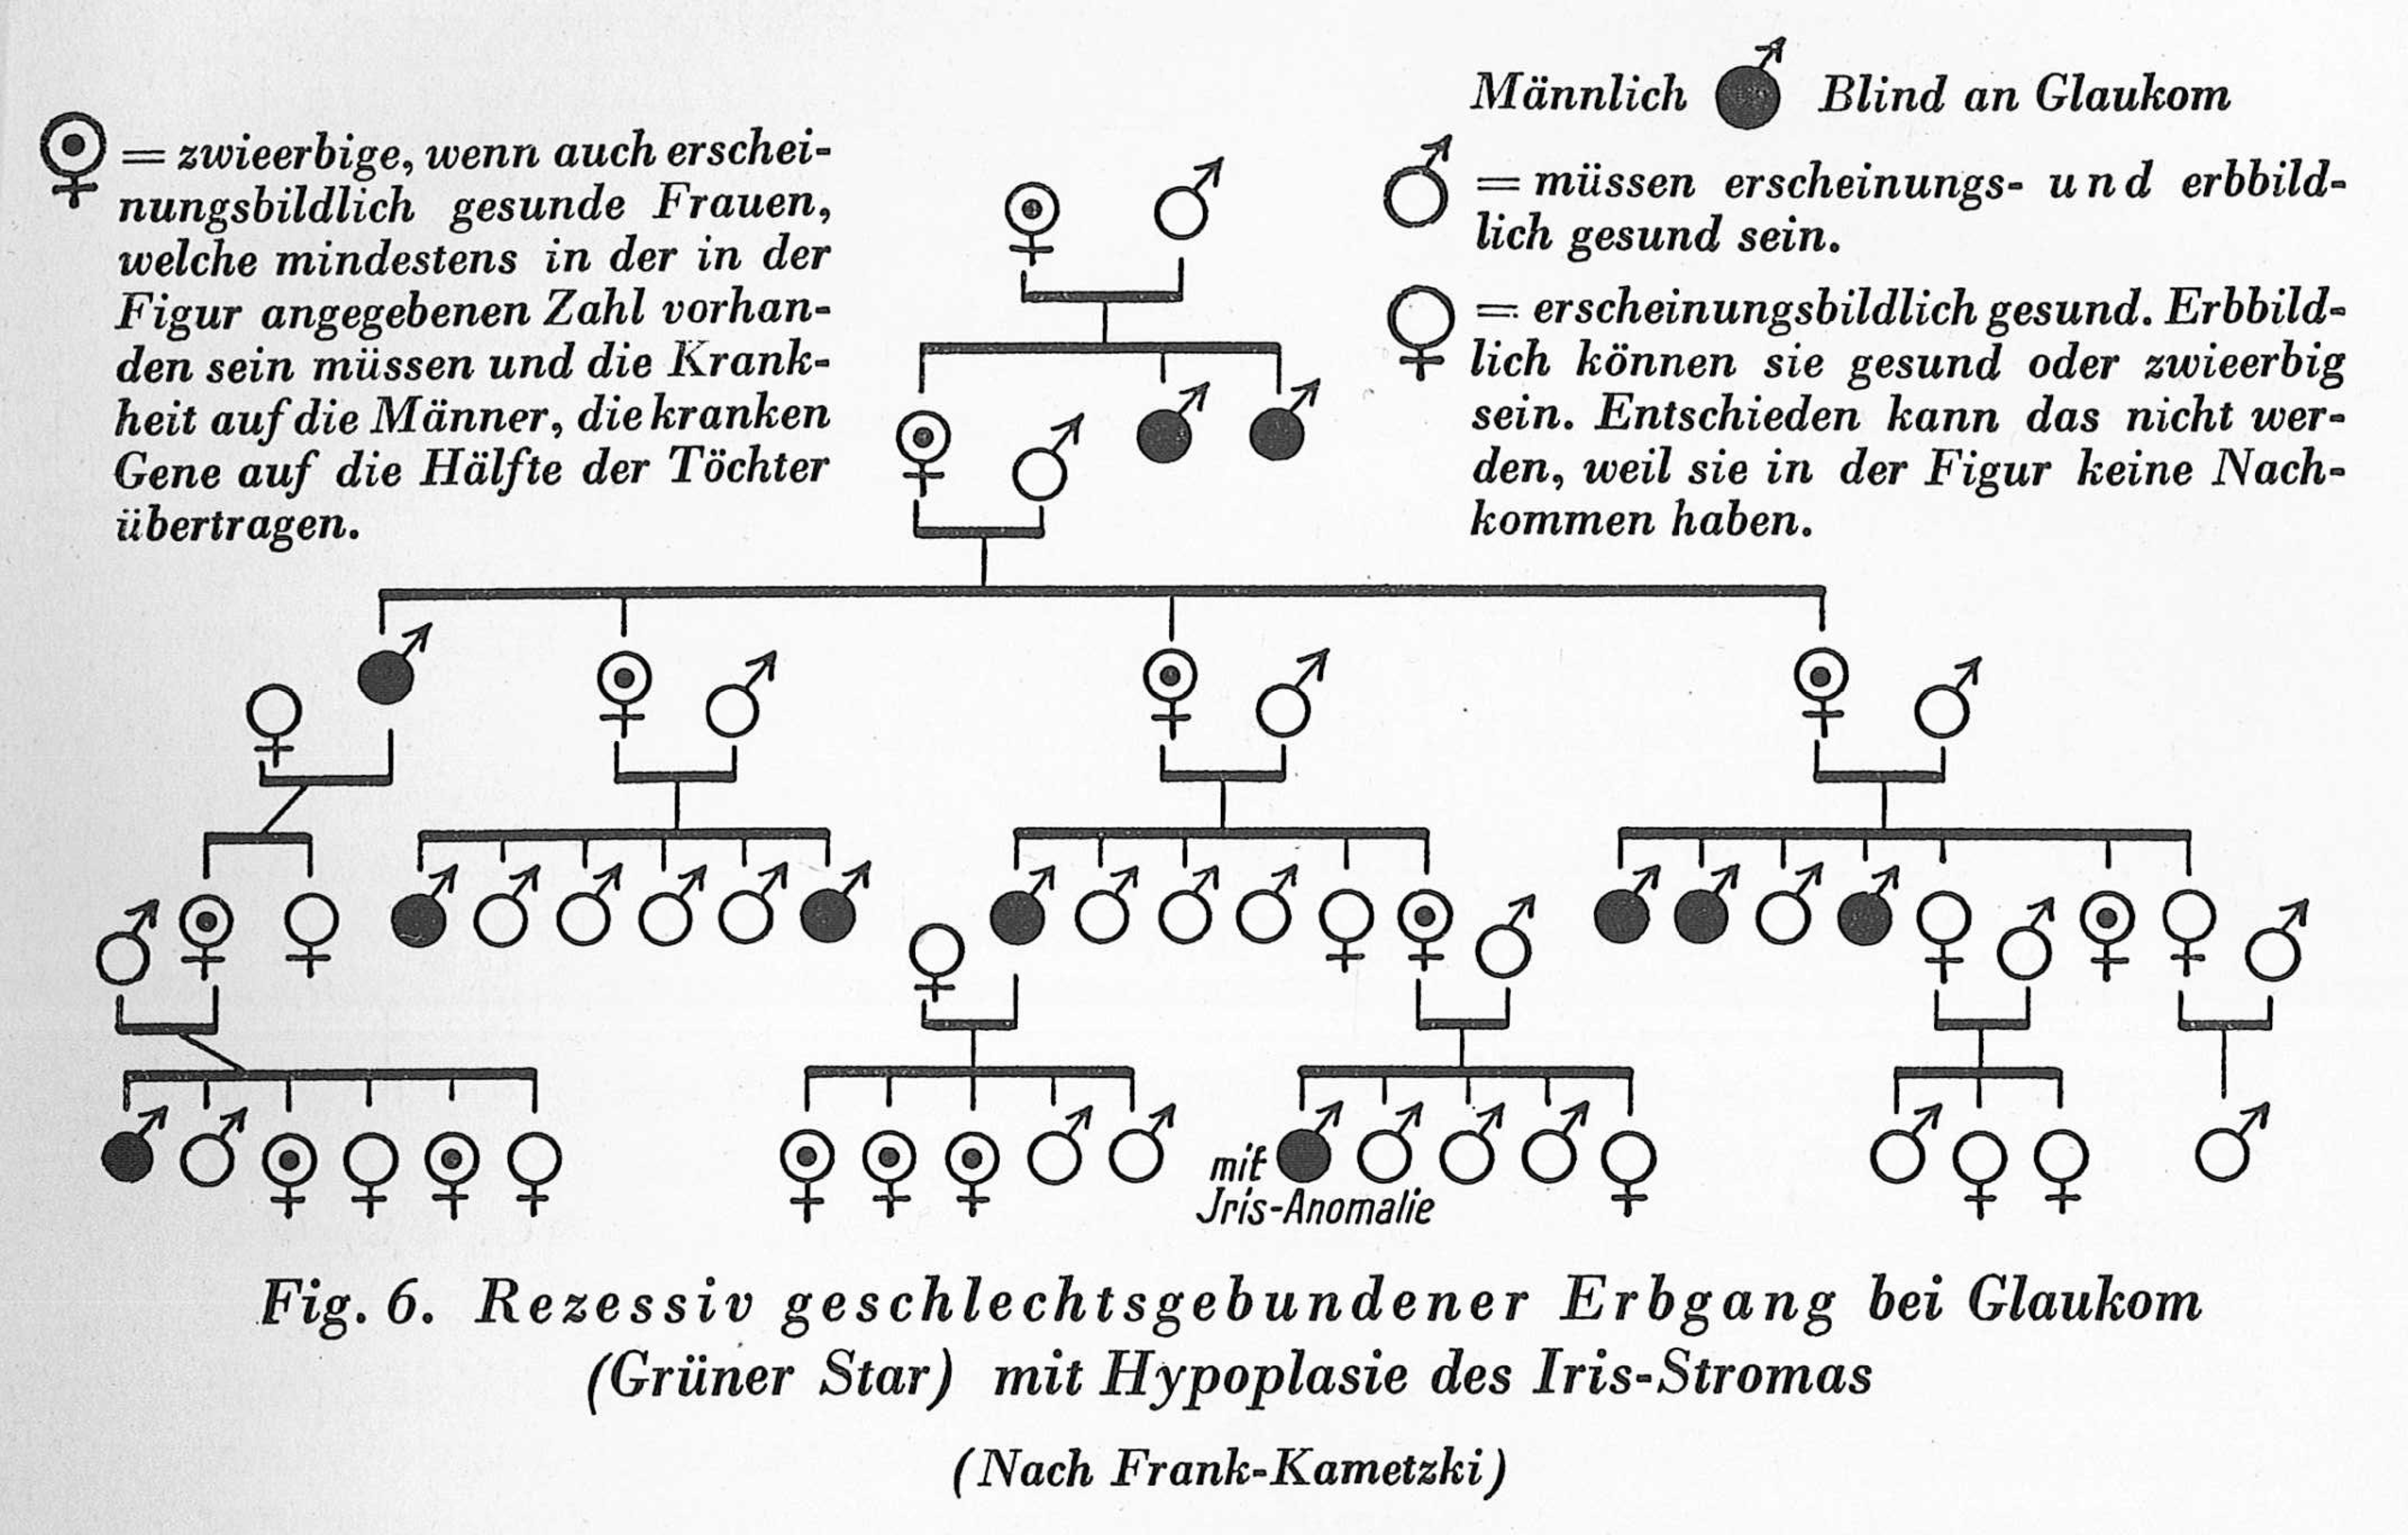
A pedigree of a family suffering from glaucoma, in which the carrier status was added to certain individuals so as to make the pedigree fit Mendelian theory (Gütt, Rüdin, and Ruttke, 1934: 35).
The conflation of Mendelian theory and empirical findings could go even further. As a final example, consider the following description offered by a Dr Hermann Römpp, an expert advisor (Gaureferent) on racial research for the National Socialist Teachers’ League, in a 1934 paper for high school teachers on Mendelism (Römpp, 1934). Römpp began by explaining that ‘a recessive disposition … can reappear after dozens of generations, if it is recombined with another recessive disposition’. The pedigree he cited, he argued, demonstrates this in an especially meaningful way. The family forefather 1 of the entire clan was deafmute (deaf-mutism is inherited recessively!), the family foremother 2 was healthy. All of their children and grandchildren (3 to 17) showed no sign of deaf-mutism; but some of them certainly contained the recessive disposition for this disease, hidden. Now, when the blood-related grandchildren 12 and 13 married, a deafmute appeared among their offspring. Obviously, two recessive dispositions, hitherto hidden, were joined, and that led to deaf-mutism. (ibid.: 44)
Römpp went on to discuss what would have happened if those grandchildren had not married each other. Importantly, his narration style gave the clear impression that he was telling a story about a real family, and a pedigree chart (Figure 6) corroborated the story he outlined. A closer inspection of that pedigree, however, reveals that it does not represent a real family at all. There are several indications of this. First, the chart elegantly covers all possible combinations of recessive mating – DD × RR, DD × DR, DR × DR, DR × RR and RR × RR – each of them exactly once. Second, most couples along the pedigree have exactly four children. Those that have more than four are couples all of whose children are expected, according to Mendelian presumptions, to be similar with respect to the trait being analyzed (all healthy, or all diseased), in which case their exact number is meaningless for presenting ratios and can therefore be changed (they have five). Third, the ratio of ill to healthy children in each family is precisely what Mendelian theory predicts it should be. One does not need a chi-square test to realize that this pedigree is, indeed, too good to be true.
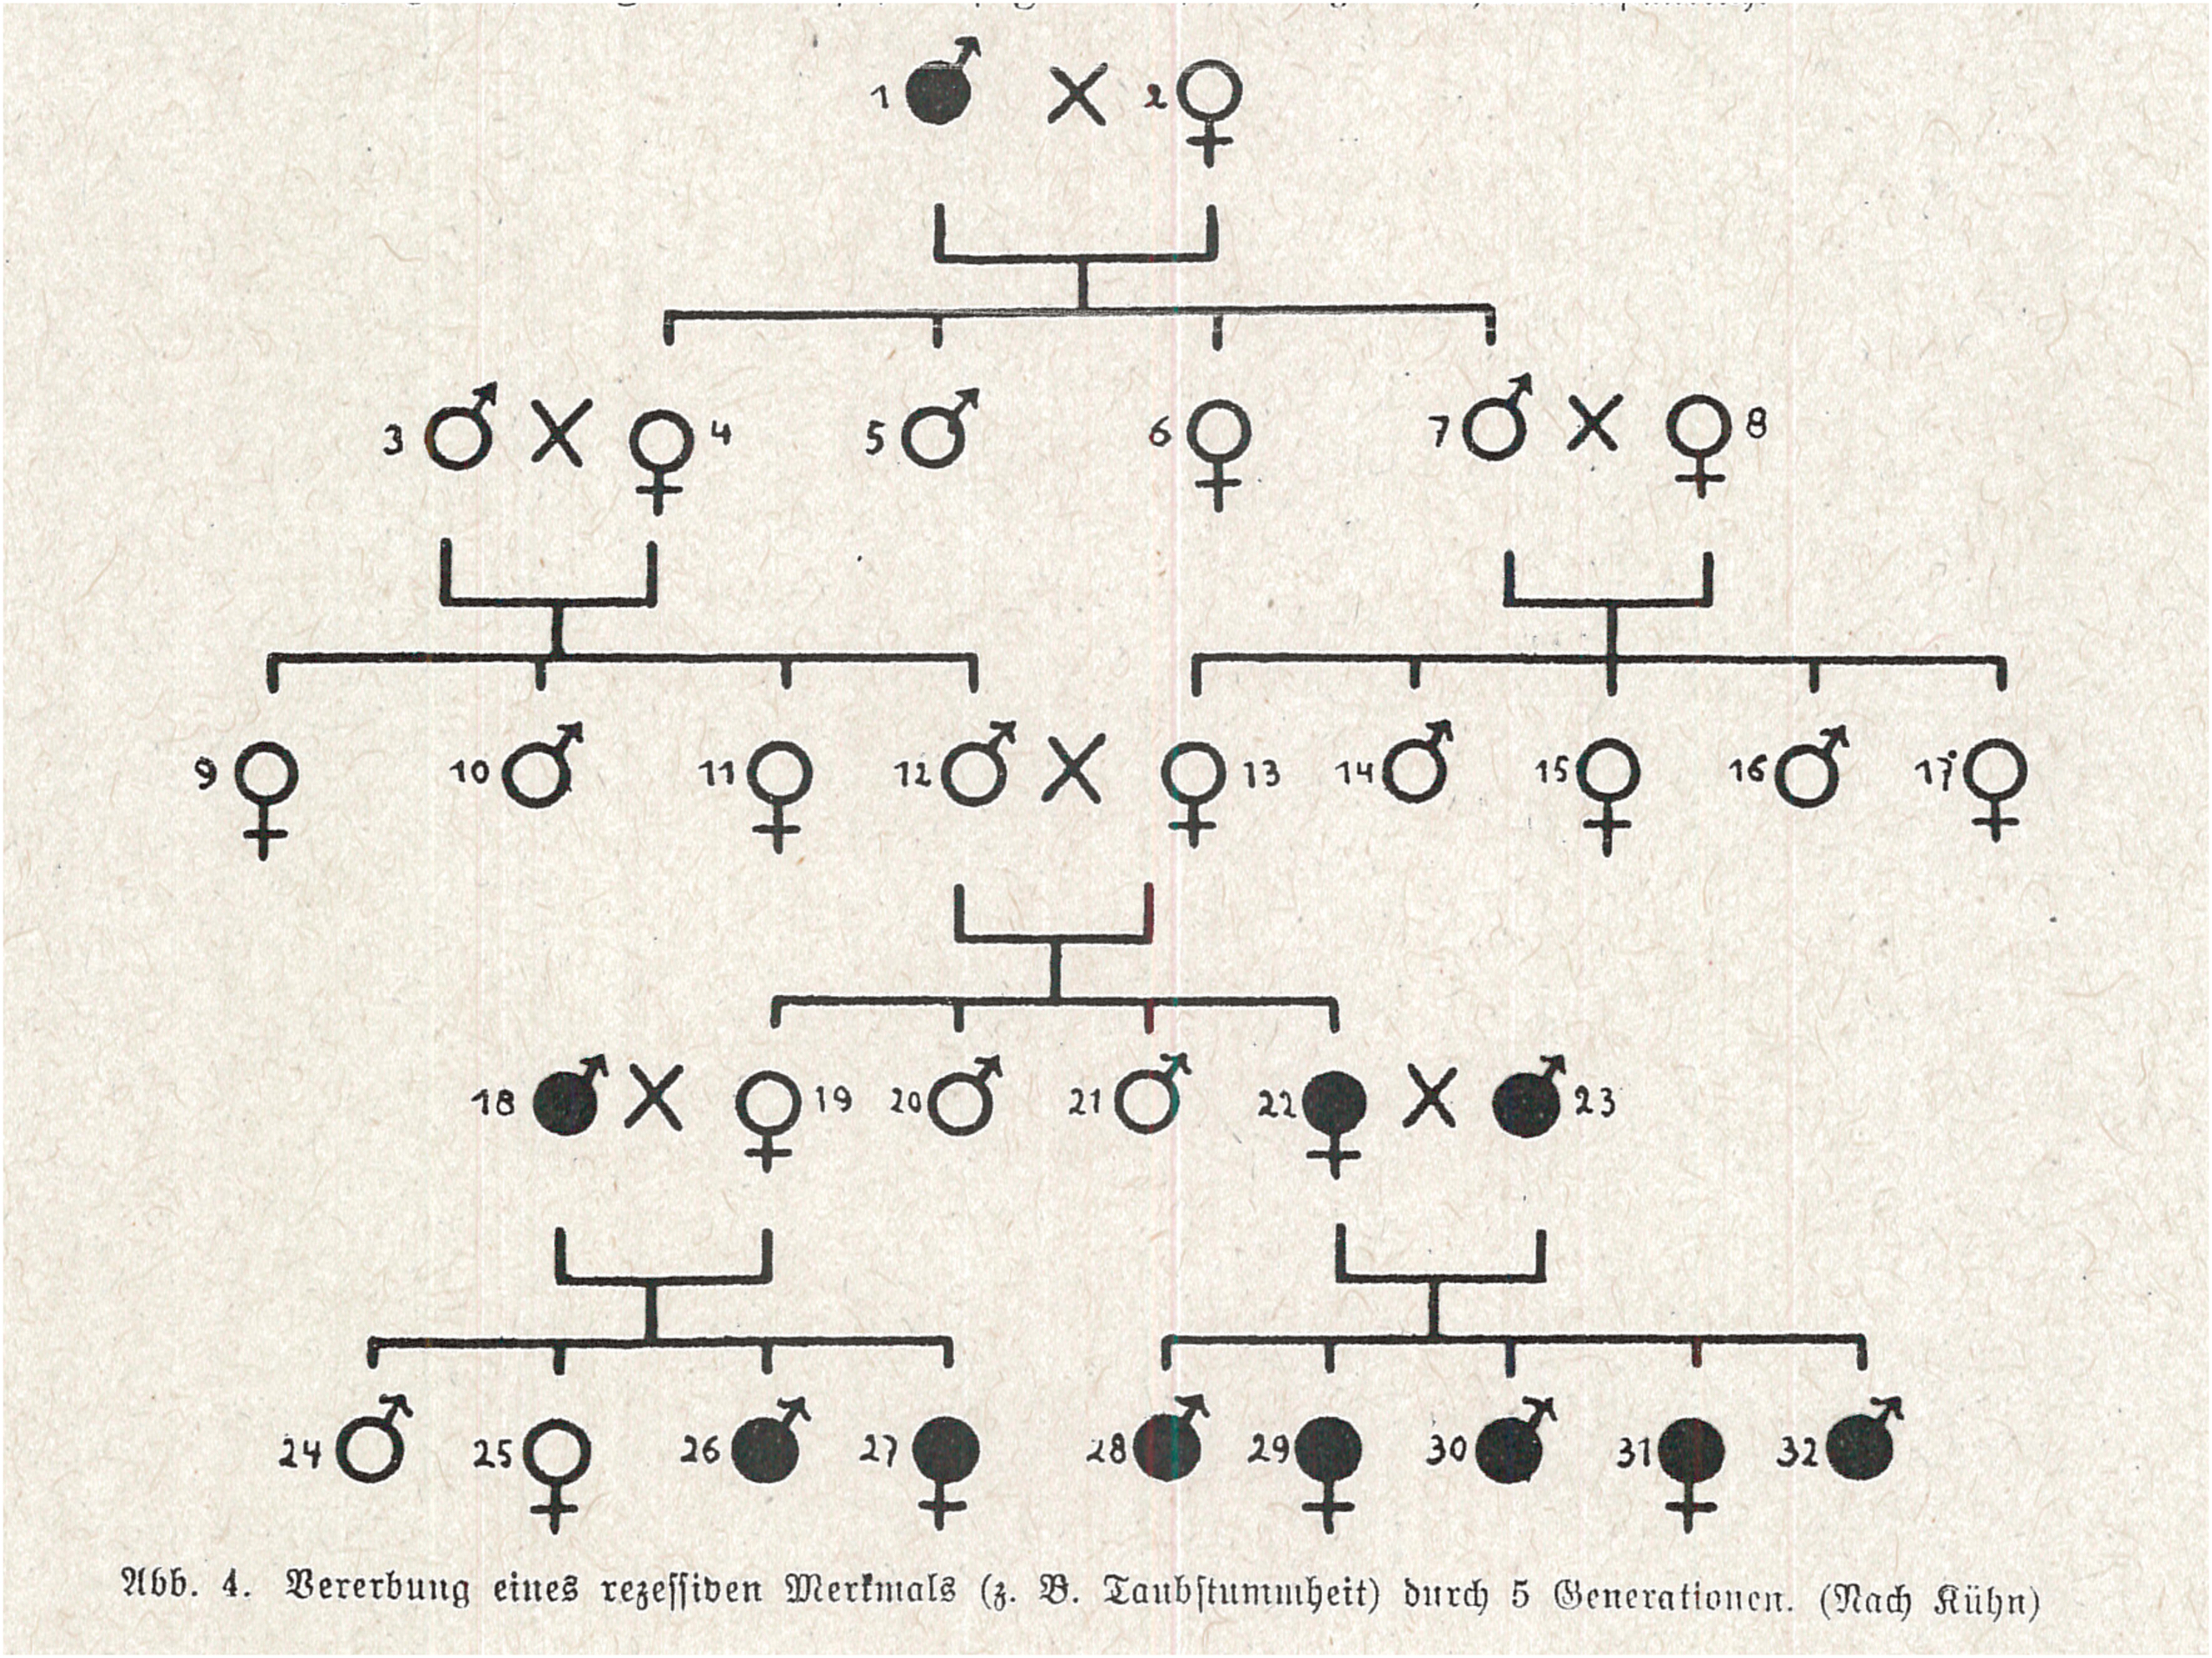
A pedigree presumably showing the inheritance of deaf mutism in an actual family. In reality, this is a pedigree-styled depiction (or a model) of all possible results of mating in case of recessive inheritance (Römpp, 1934: 45).
Römpp took this pedigree from the German zoologist Alfred Kühn's Grundriß der allgemeinen Zoologie (Outline of General Zoology). Kühn, however explicitly wrote in his book that this was a ‘Scheme of the inheritance of a recessive trait, e.g. a recessive disease (e.g, deaf-mutism)’ (Kühn, 1926: 235; emphasis added). In Römpp's text, the word ‘Scheme’ was removed. Kühn also added letters denoting the genetic composition of every person along the chart (AA, Aa, aa), a fact that helped to stress that this chart was a pedigree-styled version of the more ordinary scheme commonly used for explaining Mendelian heredity. In Römpp's reproduction, these AA, Aa, and aa's were removed. Kühn used the present tense (‘The children of the marriage 1 × 2 are all heterozygous and healthy’), because he was characterizing a biological rule, not describing actual observations; Römpp preferred the narrative-like past (‘1 was deafmute … 2 was healthy.… Their children … showed no sign of deaf-mutism’). Finally, Römpp employed the Mendelian framework as an undeniable explanation for what presumably happened: ‘Obviously, two recessive dispositions, hitherto hidden, were joined, and that led to deaf-mutism.’ Due to all of these modifications, what started as a superficial, carefully construed pedagogic tool morphed into an alleged factual description of a real family history – which miraculously reinforced and corroborated the validity of Mendelian doctrine. Whether Römpp was aware of the fallacy in his description is unknown; either way, his readers – high school teachers and their students – could easily be misled.
Römpp's case may seem extreme, but what made his (perhaps innocent) mistake possible was the fact that already from the 1910s onward, not only were human pedigrees gradually being transformed into theoretical hereditary charts, but the reverse was also taking place. Indeed, one of the unique innovations of Mendelian scholars was to depict the various possibilities of hereditary combinations not with separate and independent schemes, but woven together in a pedigree-like form (e.g. Bateson, 1913: 230; Gütt, Rüdin, and Ruttke, 1934: 16, 26, 30; Rüdin, 1911; Scheurer and Wasserloos, 1931: 59). As in the case of Römpp, these pedigree-like charts covered all possible combinations of certain crosses. An efficient pedagogic instrument carefully designed to exemplify the rules of inheritance not with formulas or tables but graphically, these pedigree-like models could easily be mistaken for representations of real genealogical relationships.
Contemporary perspectives and theoretical considerations
We have thus far identified eight different procedures that turned genealogical charts into Mendelian pedigrees. The first two, (1) the abstraction of familial histories through the loss of genealogical data, and (2) the blurring of information on how clinical diagnosis was actually performed, removed the information on familial disease from its original context, where it was tied to particular life-stories, singular individuals, and specific doctors, and turned it into timeless representations of instances of certain type of pathologies. The next two steps, (3) the visual condensing of data on healthy/normal/non-pathological siblings/children, and (4) their outright omission, magnified the visual presence of disease in the chart. (5) The omission of parents stemming from healthy/normal/non-pathological families, and (6) the addition of carrier dots to ‘obligatory’ carriers both underlined the Mendelian mechanism – recessivity – that was believed to underlie the observed pathologies. With the help of these two steps, charts of familial disease morphed into ‘factual’ demonstrations of the validity of Mendelian theory. Finally, (7) the addition of carrier dots to probable/possible carriers, and (8) the presentation of theoretical/idealized charts in a way that implied they represented actual findings blurred entirely the gap between empirical investigations and Mendelian theory.
How common were these practices? As some of the passages quoted above indicate, the first four were quite standard. As for the others, further research is needed in order to answer this question with certainty, although some of the examples I cite in the notes testify that they were not entirely exceptional. More significantly, a quick survey of the practices common today among professional geneticists and genetic counselors shows that neither of these procedures can be dismissed as representing bygone, Nazi, or eugenic-laden practices.
To begin with, at least in the past half century, (1) the detachment of a chart from the actual family on which it was based has been considered a desideratum, due in large part to concerns over the legal and psychological effects that may result from breaching the privacy and confidentiality of sensitive genetic and familial data. 9 In fact, it has become standard among human geneticists not only to omit identifying markers, but also to ‘mask’ data such as the sex of healthy siblings, and, moreover, to actively alter (!) some of the data in published charts, including birth order and sex, to further disguise the identity of patients and their families (Botkin et al., 1998). 10 Such alterations are, by necessity, theory-laden: one has to choose which types of information are so irrelevant that they could not only be omitted but actively transfigured, and one has to be confident that introducing such modifications into the ‘web of science’ will have absolutely no effect on both present and future scientific knowledge – a problematic assumption in its own right (see Bennett, 2000).
When it comes to (3) the visual compression of data on healthy siblings with the help of a counter inside a symbol, (4–5) the omission of healthy family members, and (6–7) the addition of carrier dots, all of these are customary procedures, as any examination of a modern textbook of genetics would immediately reveal (e.g. Cummings, 2008; Harper, 2010; Lewis, 2004; Nussbaum, McInnes, and Willard, 2007). 11 As for (8) the conflation of theoretical and empirical charts, this also happens frequently. For example, the two most popular textbooks introducing basic genetics to non-science majors in the US (Cummings, 2008; Lewis, 2004) each contain a considerable number of pedigrees of human pathologies, for which it is impossible to know whether they represent genuine families or pedagogically constructed ones. 12 Some of them explicitly lie on the boundary between the two, as in the case, for example, of a family chart of television characters (‘According to this pedigree from the soap opera “All My Children”, is Charlie the product of a consanguineous relationship?’; Lewis, 2004: 93). With relation to the others, the student simply cannot tell whether a ‘pedigree for a family afflicted by sclerosteosis’ (ibid.) or a pedigree that ‘shows the characteristics of X-linked recessive traits’ (Cummings, 2008: 84) depicts data (even if partial) on actual families, or models illustrating how such family charts would probably have looked according to Mendelian theory.
The most straightforward way to account for the similarities in practices of handling and (mis)representing data – despite the great social, political, cultural, and scientific transformations that separate today's human geneticists from the German scholars surveyed above – is to claim for a direct transference of methodological habits (or ‘scientific tradition’). Seen from this perspective, today's science of genetics still owes a lot to its eugenic-cum-Mendelian origins; these cast a long shadow on the field’s presuppositions, goals, and practices (Ekberg, 2007; Resta, 1993). Alternatively, even without suggesting a linear transference of scientific habits, we may point out that both today's geneticists and those of the past share several overarching ideals regarding the nature of scientific work. Among these we can mention (a) the trust accorded to researchers, without which one could not imagine omitting, let alone altering, data that could have allowed others to verify published results; (b) the preference for generalizable biological regularities over singular, personal, clinical peculiarities; and also (c) the stylistic preference for focus and clarity over richness and comprehensiveness (thus favoring thin pedigrees exemplifying a sought-for phenomenon over thick ones that can be interpreted in various ways). 13
Yet an additional factor is needed to account for the processes hitherto analyzed, as well as for the similarities between past and present practices of reworking charts. This factor has to do with the principal question of what happens to scientific knowledge as it migrates from specialized scientific journals to textbooks, teaching materials, and popular – or even propagandistic – scientific accounts. It is here that Fleck becomes useful again. Fleck described how scientific journals, by their very nature, presented findings whose meaning was still unresolved and awaited evaluation by peers. Textbooks, handbooks, and later popular presentations, on the other hand, displayed cases that could contribute to, conform with, and enforce an already established theory. Thomas Kuhn later reiterated similar ideas (Kuhn, 1961; see also Skopek, 2011). 14
Our findings not only corroborate Fleck's descriptions, but also add to them, because Fleck did not say a lot about how those textbook cases – Kuhn's ‘exemplars’ – were formed. Fleck mainly relates that those textbook materials were ‘built up from individual contributions through selection and orderly arrangement like a mosaic from many colored stones’ (Fleck, 1979: 119). Such a description gives the impression that textbooks mainly choose existing cases that can best exemplify a certain phenomenon or theory, without, however, substantially altering them. At least in the case examined here, however, ‘selection’ and ‘arrangement’ far from exhaust the multiple processes of data manipulation (omission, addition, reduction, alteration) that take place along with the migration of knowledge between different publication venues. Chosen case studies were transformed into exemplars through gradual graphical processes of adaptation, loss of information, and addition of theoretical layers.
This helps explain why the most theoretically laden modifications (6 and 7) all occurred within textbooks and pedagogic materials – then and now. The changes in the pedigrees were not the result of scholars belonging to different ‘thought collectives’ or sharing different assumptions. For example, there was hardly any divergence of opinion between Albrecht and Lenz with regard to the Mendelian nature of deaf mutism. Albrecht's paper clearly reveals that he was no less an adherent of Mendelism than Lenz. The modifications between his chart and Lenz's reproduction of it are grounded in their different venues of publication. Albrecht presented data still in the making and reasoned by aggregating results; Lenz accepted the conclusions of this aggregation, chose from Albrecht's publication the most salient example of the theory he wished to convey, and altered the pedigree slightly to communicate that theory. In fact, considering these modifications as stemming from the requirements inherent to the venues of publication achieves three goals simultaneously: it explains why and how such modifications were possible, or even necessary; it normalizes them, removing the suspicion that there was something oddly unscientific about them; and it can help account for the fact that similar alterations are still being made a century later.
To conclude: in our small sample of early 20th-century studies of human heredity – which, however, have striking parallels in contemporary practices – the first printed version of a pedigree was usually intended as an orientation device. It was designed to accompany a text, not to be examined independently of it, and it was often relatively ‘messy’, containing (some) information that could hint at alternative interpretations. But when these pedigrees were reproduced in a textbook, a legal commentary, or a pedagogic guideline, those charts changed their roles, and the urge to distinguish (Mendelian) signal from (empirical) noise pulled human pedigrees toward the Mendelian center of gravity. At the same time, theoretical models were also presented visually in the format traditionally reserved for presenting actual findings. The result was that, at least in the visual domain, the line separating theory from observations, or model from experience, became blurred. This blurring may have been detrimental to the accuracy and completeness of the presented data, but this was a price worth paying, since it helped reinforce the discipline's cherished paradigm. Thus, as pedigrees moved from journal articles to textbooks, their content was altered, and visual depictions, forms, and formats were continuously reworked until empirical findings finally landed in the warm lap of Mendelian iconography.
Footnotes
Declaration of conflicting interests
The author declared no potential conflicts of interest with respect to the research, authorship, and/or publication of this article.
Funding
The author disclosed receipt of the following financial support for the research, authorship, and/or publication of this article: This work was supported by the Israel Science Foundation (grant no. 145/18).