
Abstract
The popular science of phrenology is known for its preoccupation with geniuses and criminals, but this article shows that phrenologists also introduced ideas about the ‘average’ person. Popular phrenologists in the US and the UK examined the heads of their clients to give an indication of their character. Based on the publications of phrenologists and on a large collection of standardized charts with clients’ scores, this article analyses their definition of what they considered to be the ‘average’. It can be concluded that phrenologists were some of the first to teach individuals to see their identity in relation to an imagined statistical community.
Introduction
In the US and the UK between 1840 and 1940, generations of popular phrenologists spread their ideas by publishing journals, organizing lectures, and examining people’s heads, in public as well as in private sessions. Phrenologists believed that specific areas in the brain, called organs, were responsible for specific mental characteristics. As the brain pushed the skull outwards, they thought that the size of these areas could be examined by analysing the shape of the skull’s surface, its bumps and its indentations. In the course of the 19th century, phrenology was taken less and less seriously as an academic subject and was shifted to the margins of the scientific community, while remaining immensely popular among the wider public.
Those who visited the phrenologist’s consulting room for an examination left with a written delineation of character or a standardized chart that was filled in for them. These charts are an interesting but little-studied source for understanding phrenology and its popular appeal (Bittel, 2013, 2019; Sokal, 2001). Each contained a list or table of phrenological organs with the client’s score indicated on a scale ranging from ‘small’ to ‘large’. The charts were either broadsheet certificates with official-looking seals, or part of a larger booklet in which clients could read in greater detail about phrenology, the meaning of their scores, and suggestions on how to improve their character or skills. Irrespective of the layout, the charts were an attractive and persuasive certificate of character, which thousands of people received during the heyday of phrenology (Sysling, 2018).
My analysis in this article is based on the publications of phrenologists, but also on a collection of phrenological charts, completed for individual clients between 1838 and 1940. 1 Because the charts from the UK and the US are remarkably similar, I include both in this analysis. In the charts, the scale went from ‘small’ to ‘moderate’ to ‘full’ to ‘large’, and the middle score was usually called ‘average’. By focusing on the phrenologists’ use of the term average, this article traces how phrenologists introduced and applied an idea of the ‘average’ person. As the article will show, phrenologists were interested in population statistics and propagated the idea of the average man or woman within a population as early as the 1840s. Their use of the average suggested that individuals could be compared with others in the same population, even though phrenologists – especially when challenged – occasionally insisted that they only compared the size of one organ to that of other organs in the same head.
Historians of phrenology have directed their attention mostly to the phrenological study of geniuses and delinquents, and, indeed, books and journals by phrenologists are full of descriptions of the characters of famous statesmen and incorrigible criminals. Franz Joseph Gall, the founder of phrenology, was inspired by his frequent visits to the insane asylum, and phrenologists continued to insist that they could detect criminal tendencies. Famous statesmen, on the other hand, offered examples of well-developed heads in which faculties such as ‘calculation’ and ‘conscientiousness’ figured prominently. Phrenological books also included the phrenological trope in which the author asserted that they would recognize the head of a great man even if this man came to an examination disguised in beggar’s clothes. However, I will argue that this was only one of the ways in which individual clients of phrenology could assess themselves against others. Because the charts were tailored to the individual, the average score was also an important instrument for conceptualizing the client’s place in the world.
Historians and philosophers have shown that the definition of the statistical normal resulted in both the creation of certain social categories and the construction of social norms. Ian Hacking and Alain Desrosières, for example, have shown how statistics constructed seemingly natural categories such as society, poverty, or the criminal. That the statistical normal went hand in hand with new social norms is also a well-established historical finding (Cryle and Stephens, 2017; Desrosières, 1998; Ernst, 2006; Foucault, 1978; Hacking, 1982, 1986). The case of phrenology throws light on the emergence, alongside the average known to statisticians, of a more rudimentary popular idea. Phrenologists were supposing, or appearing to suppose, that there existed a statistical community with which one could be compared. This was an ‘imagined community’ in Benedict Anderson’s (1985) sense of the term, as individual people started to perceive themselves as part of the larger group, even though phrenologists did not actually base their assessments on real population statistics. The case of phrenology is also a very early example of a practice that spread the notion that it was best to be above average.
Whereas some scholars consider the normal and the abnormal as two co-constructed concepts, others have emphasized that, contrary to the 19th-century focus on ‘degenerates, delinquents and defectives’, the early 20th century developed the popular fascination with the average or the normal, simultaneously with data collection on a larger scale. For example, Ian Hacking argues that the idea of the ‘normal’ shifted from scientific circles into popular culture in the early 20th century (Hacking, 1986: 222; 1990: 160). Similarly, Sarah Igo argues in her book on the collection of survey data in the 20th-century US that data gathering intensified in the early 20th century and that this had a profound effect on individual Americans, because the collection of data created statistical communities that people increasingly felt they related to. According to Igo, ‘The seemingly private and atomized act of divulging personal information to a surveyor…could have significant political effects. In such ways, social scientific data created novel possibilities for community and self-assertion even as they placed new constraints on self-fashioning’ (Igo, 2008: 285; for the history of [social] statistics, see also Alborn, 2009; Bouk, 2015: xvii; Davis, 1981; Gigerenzer et al., 1989; Murphy, 2010; Porter, 1986, 1995).
Peter Cryle and Elizabeth Stephens consider a widely shared idea of the ‘normal’ to have appeared at an even later stage. They argue in their book on the history of the ‘normal’ that ‘contemporary popular ideas of the normal emerged not in the context of the large disciplinary institutions and biopolitical systems that came into being at the start of the nineteenth century, where Foucault locates the emergence of normalization, but much later, in the emergent self-improvement and consumer cultures of the mid twentieth century’ (Cryle and Stephens, 2017: 14; see also Creadick, 2010). However, the phrenological charts show that even though the phrenological scores were by no means based on any statistical aggregates, popular phrenologists spread the idea of the ‘average’ person, and especially the idea that it was good to be more than average, as early as the 1840s.
This article first addresses the history of phrenology and the interest of phrenologists in measurement and statistics, which is followed by a description of the charts and their use by popular phrenologists on both sides of the Atlantic. The following section analyses the phrenologists’ use of the term average. At the end of the article, I will examine how phrenology used both the extremes and the average to convey their message, and I will conclude that individual consumers of phrenology started to see themselves in relation to a larger group and were encouraged to think about their own position in this group.
Phrenologists and social statistics
Phrenology, then still called organology, was conceived by Franz Joseph Gall, a physician in Vienna, who based his ideas on his study of skulls, dissections, and his realization that some people with distinctive talents had bumps on their heads whereas others had none, which he thought indicated that these were the places in the brain where these talents originated. For example, Gall discovered the organ or faculty of vanity and ambition, when he encountered a woman in a mental hospital ‘who imagined herself to be the Queen of France’ (Eling, Finger, and Whitaker, 2017; see also Van Wyhe, 2002). After studying her head, he found a protuberance, where he then located this faculty. In 1798, three years after Gall had published an initial description of his ideas (Gall, 1798), he was banned from Vienna, following which the basic tenets of phrenology were disseminated among scientists when Gall toured Western Europe with his assistant, Johann Gaspar Spurzheim.
Phrenology became popular in the United Kingdom after Spurzheim went on a lecture tour there in the 1810s and convinced men such as George Combe of the truth of the new science. Spurzheim and Combe helped transform Gall’s science into a more wide-ranging psychology that was not deterministic but propagated the view that individuals could develop their characteristics favourably through effort and exercise. It therefore became attractive as a philosophy for education, reforming criminals, and individual self-help. At the same time, phrenology was vehemently criticized by parts of the medical establishment, and while scientific specializations were developing, phrenologists were successfully kept outside this establishment. But this did not diminish the popularity of phrenology outside scientific circles, where its exponents continued to insist on the scientific basis of their discipline (see Cooter, 1984; de Giustino, 1975; Lyons, 2009: 51–86; Shapin, 1975; Van Wyhe, 2004). Because of this insistence, phrenology offers a unique opportunity to study the life of scientific concepts in popular culture, even if these concepts were watered down.
In the 1830s, phrenology spread from Britain to the US, where it became even more popular and more commercial as it was applied to the individual consumer. This was due partly to the interest and entrepreneurial spirit of one family, the ‘phrenological Fowlers’, who propagated phrenology by means of lecture tours, book and journal publishing, phrenological examinations, and the sale of phrenological busts and other souvenirs. The Fowlers were initially based in Philadelphia and later in New York, where they set up a museum, the Phrenological Cabinet, and a publishing house. The members of this family also travelled around and conducted examinations at hotels, while their lecture circuit at one point employed no fewer than 26 lecturers. The family also rekindled interest in phrenology in Britain in the 1850s and 1860s, when they moved part of their business overseas (Davies, 1955; Stern, 1971).
Translating Gall’s science for the Anglo-Saxon world, Spurzheim carried out the groundwork by changing phrenology’s focus on the extremes to place greater emphasis on the general, such as by renaming certain faculties. As he wrote later: The nomenclature, introduced by Dr. Gall, was not only incorrect…but it was further objectionable as several organs were even named from abuses of their primitive functions. Disorders, however, are the effect of the predominance of particular powers, on account of the disproportionately large size of their organs but are not to be confounded with the regular operations of the faculties. (Spurzheim, 1827: 18–19)
Quantification arrived only slowly in phrenology. In his Elements of Phrenology, an extended version of his earlier essays first published in 1824, Combe wrote about using calipers to measure certain dimensions of the head, and published a table with the ‘measurements from nature’, including average head size, of 20 men between the ages of 25 and 50 (Combe, 1824: 162–3). He measured the distance between organs, not the size of the organs. To determine size, he suggested that the length of organs (by which he meant the height of the bumps, measured from the centre of the brain) could be measured by means of the craniometer, a new instrument, and their breadth (their expansion on the surface of the skull) could be judged by hand or eye. Other phrenologists followed his lead and also produced lists of head measurements, printed in their publications or in the various journals of phrenology. For example, a London milliner sent in his data on hat size/head size in different parts of England to the Edinburgh-based Phrenological Journal in 1827 (‘Size of Head’, 1826–7). In the US, the American Phrenological Journal, which had seen its first publication in 1839, published a table with the proportions of the heads of American ‘leading men’ in 1840 (‘Measurements on the Heads of the “Great Men”’, 1840).
The idea that it was useful to collect these data received greater impetus after Adolphe Quetelet started to publish his statistical findings. The Belgian Quetelet had a profound influence on the development of social statistics and coined the powerful idea of the ‘average man’ (Desrosières, 1998; Stigler, 1999: 51–65). Partly as a result of Quetelet’s work, averages became ‘the core business of nineteenth century statistics’ (Cryle and Stephens, 2017: 123, quoted from Feldman, Lagneau, and Matalon, 1991: 10). Quetelet declared that if one measured individuals in a population, the results followed the same pattern (the normal distribution) as repeated measurement of the same object. Thus, individual human qualities, such as height, were distributed around the ‘average man’ according to the laws of chance and could be studied by the use of probability theory. Quetelet was convinced that it was equally possible to prove the existence of the average man in terms of moral and intellectual qualities (Donnelly, 2015; Quetelet, 1835, 1870). His research into crime rates, for instance, suggested the presence of a surprising regularity. Nevertheless, the concept of the average did not go uncontested. For example, in 1837 debates raged in French medicine about the usefulness of the concept, and Quetelet was repeatedly criticized for the idea that there could be an abstract ‘average man’ who incorporated averages of a variety of qualities (Cryle and Stephens, 2017: 127).
Quetelet’s mathematical notion of the average strengthened the link between measurement and concepts of normality. The ‘normal state’, established in medicine in the 1830s and 1840s, particularly in French physiology, came to mean the point of reference to a patient in his or her healthy condition or to a ‘normal’ man or woman. In this sense, the normal was located between the pathological states at either end of the scale, and any deviation from the average or normal meant ill health. This emphasis on the average and the equilibrium as the perfect physical state had roots going back as far as Aristotle and was a staple of early modern medicine. Nineteenth-century scientific work brought the concepts of the healthy, the normal, the typical, and the average together, even though the exact meaning of these terms was often imprecise. The idea of the ‘normal’, for example, continued to oscillate between the qualitative and the quantitative, as Cryle and Stephens (2017: 62) show.
Quetelet saw the ‘average man’, like the ‘normal state’ in medicine, as a positive figure: it was an ideal man, in the sense that it existed only on paper, but also in the sense that it was a moral ideal. Quetelet believed in stability and moderation, whereby the extremes were dangerous in the life of an individual, even though statistics made these extremes predictable in the larger scheme of things (Porter, 1986: 103). For the person who took up Quetelet’s studies on the normal distribution, the English statistician and eugenicist Francis Galton, the ‘average man’ was mediocre, not ideal. With eugenic measures, he wanted to cultivate the one end of the curve where superior people stood out and make sure they did not regress to mediocrity (Hacking, 1990: 181–4). Galton was in fact more interested in variability, and in the differences between types of people and between ‘races’. Quetelet was more interested in unity than in diversity, and he did not emphasize differences between populations so much: his ‘average man’ usually referred to the average of the whole of humankind or of the nation. Phrenology, as we shall see, incorporated all these trends: it warned against the excesses of the extremes, but it also insisted that people could rise beyond mediocrity. Its use of averages often implicitly referred to the nation, but it also had a branch that focused on racial differences.
After Quetelet started to publish his findings, they were also read by phrenologists. Combe’s book A System of Phrenology mentioned Quetelet in its fourth edition in 1836 (Combe, 1836[1819], Vol. 2: 768–75). 2 Combe, for example, wrote that he was highly interested in moral statistics and in Quetelet’s work and he was keen to apply his own statistical inquiries. He admired the tables that Quetelet and others produced: ‘Facts, founded on observations made on numerous individuals, and reduced to average results, are interesting and useful’ (Combe, 1843[1819], Vol. 2: 372). Yet he saw them as no more than that, facts, which he considered meaningless if they had no bearing on the causes producing these facts. ‘Causes’, in his view, denoted the ultimate cause, the development of the brain in particular.
Combe did not refer to the most obvious area where Quetelet’s work could be applied: collecting data to produce an ‘average brain’ or an ‘average head’. However, others, both phrenologists and their critics, took up this idea, the latter to use it as an argument against phrenology. The undefined terms that were often used by phrenologists for the size of organs – small, full, large – put wind in the sails of phrenology’s critics, who argued, ‘If a thing is large, what’s the size of it? if it is small, tell us the measurements’ ([Skae], 1846: 398). The answer that Combe gave to the question of the undefined terms was that comparisons should be made not between individual skulls or heads, but between the different organs in a single head, which made it very practical to speak of small and large, similar to comparing the fingers on one hand (Combe, 1846–7; see also Jones, 1836: 23).
This answer ignored the fact that followers of phrenology were also calling for more precision. ‘In regard to mere size of head as a whole’, wrote one commentator in the UK in 1840, ‘each manipulator at present appears to have some fancied average, vaguely floating (so to speak) in his own mind’ (‘On the Requisites’, 1840: 101). Instead of evidence that was based on extreme examples occasioned by injuries and diseases, this author proposed ‘precision in our estimates of development’ by ascertaining the average size and average proportions of the human head, ‘either that of the race in general, of Europeans, or of Englishmen’ (ibid.: 100). Similarly, in 1839, phrenologist David Nicol called for the use of an organometer to measure distances to bumps and to calculate averages. Once phrenologists knew the calculated averages, Nicol suggested, they would know the ‘exact amount of its functional excess or deficiency’ (Nicol, 1839: 237).
James Straton from Aberdeen was perhaps one of the few phrenologists who, in his The Mathematics of Phrenology (1845), made a thorough attempt to standardize phrenological measuring practices and the scales to be used. He suggested, for instance, linking the terms small, moderate, full, and large, as they related to the size of the head, to specific measurement results in cubic inches, so that the words would ‘have a definite mathematical meaning which cannot be misunderstood’ (Straton, 1845: 22). Obviously, the circumference and even the volume of the skull were easier to measure than the different organs separately. ‘It remains for the eye to determine the size of individual organs’, wrote Straton, even though certain phrenologists argued that it was possible to quantify bumps (ibid.: 35). Nonetheless, not all phrenologists were happy with this call for standardization. Almost half a century later, James Coates wrote that he was not a fan of the ‘numerical “bump-feeler”’, such as Straton, because he did not think ‘the soul of a man can be pinned in a corner like that’ (Coates, ca. 1891: 21–2, 99).
Average head sizes were most often used in comparisons between races, a field in which phrenologists considered themselves experts. This was not a question Quetelet had delved into much, but the emergent discipline of craniology picked it up and made it a central concern. Dimensions of individual skulls of different ‘races’ were becoming available at this time, and Combe included a table in his A System of Phrenology (1825[1819]: 477) that would be republished often. It contained the measurements of several individual skulls from different regions, but without the dimensions of the ‘Caucasian’ head (see also Morton, 1839; Poskett, 2015). It should be noted here that there was some tension in phrenology between the phrenologists’ measurement of what they considered innate qualities and their promotion of self-improvement. This played out most prominently in the contrast between the phrenologists’ conceptualization of racial differences, which they considered innate and unalterable, and their insistence that individuals from white middle classes could work on self-improvement (and, indeed, some phrenologists took the logical next step and argued that self-improvement would change the size of people’s bumps; see Sysling, 2018: 269–70).
Interestingly, very few practical phrenologists put much effort into collecting more data about the middle-class Caucasian men and women who were their clients (for exceptions, see ‘Measurements and Statistics’, 1875). Nevertheless, head circumference, the easiest to measure, became the most widely circulated set of numbers, with 21 or 22 inches (53.5 or 56 cm) often used as an average, and usually around half or three-quarters of an inch (1.3 or 1.9 cm) separating men and women. 3 According to the 1861 chart and booklet published by phrenologist Charles Henry Burrows from Atlanta, an average head was ‘21 inches by 13 ¼…and with good conditions will pass through the world well, but never be great, but may be good’. 4 By 1900, the Fowler family’s New Chart was able to include both a table with the brain weights of ‘distinguished men’ and tables with standard head measurements, as well as average body weights for men, women, boys, and girls. 5 As we will see in the following section, it was to the advantage of phrenologists conducting these examinations not to be too specific about numerical averages.
Popular phrenologists and the charts
The charts that I collected for this article were completed by more than 90 different phrenologists, often lesser-known itinerant phrenologists who carried out their practice for only a few years in the towns they visited. Not many of these men (and a handful of women) have left traces to posterity, except for single charts or announcements in newspapers or posters advertising their work. Several dozen charts used for this article came from the larger Fowler family: Orson Fowler, Nelson Sizer, or Samuel R. Wells. The publishing house of this entrepreneurial family was responsible for a sizable portion of the paper trail of phrenology in the US. Also well represented in the collection is the phrenologist couple Stackpool Edward O’Dell and Catherine Stackpool O’Dell, who ran a phrenological business in London in the early 20th century and founded the London Phrenological Institution (not to be confused with the London Phrenological Institute) in around 1880.
Especially in histories of the UK, these popular figures have received less attention by historians than the more highbrow men who participated in debates about phrenology and reform. Nevertheless, Roger Cooter’s bio-bibliography of the British Isles includes listings for hundreds of popular phrenologists. According to Cooter, there were still over 150 practising ‘professors’ of phrenology after 1860, mostly from humble backgrounds, who practised their trade on the piers of Blackpool and Brighton, although many were largely unsuccessful in their careers or lasted for only a season (Cooter, 1984: 154, 260; 1989). Estimates from the US suggest that there were thousands of travelling phrenologists in the US throughout the 19th century (Colbert, 1997: 21). These numbers illustrate that phrenologists were able to cover large regions and reached a large British and American public of middle-class men and women.
The charts these phrenologists produced for their clients all had different layouts (see Figures 1 and 2), but what they shared was a table or list with phrenological organs and with the client’s score. While Gall had started with 27 different faculties, Spurzheim rearranged the list and used a total of 32 organs. Others were added in the course of time. ‘Conjugality’ (the desire to marry), for example, showed up for the first time in a Fowler chart of 1859, and ‘human nature’ (intuition) and ‘agreeableness’ also became more prevalent from 1850 onwards. 6 Depending on the phrenologist, the number of faculties varied, but usually amounted to about 40 organs, often grouped under headings such as ‘domestic’, ‘selfish’, ‘moral’, and ‘intellectual’ faculties. Most charts also included temperaments and, from the late 1850s onwards, health indicators. Some charts also included vocational advice and, for an extra fee, guidance on which characteristics to seek in a future spouse.
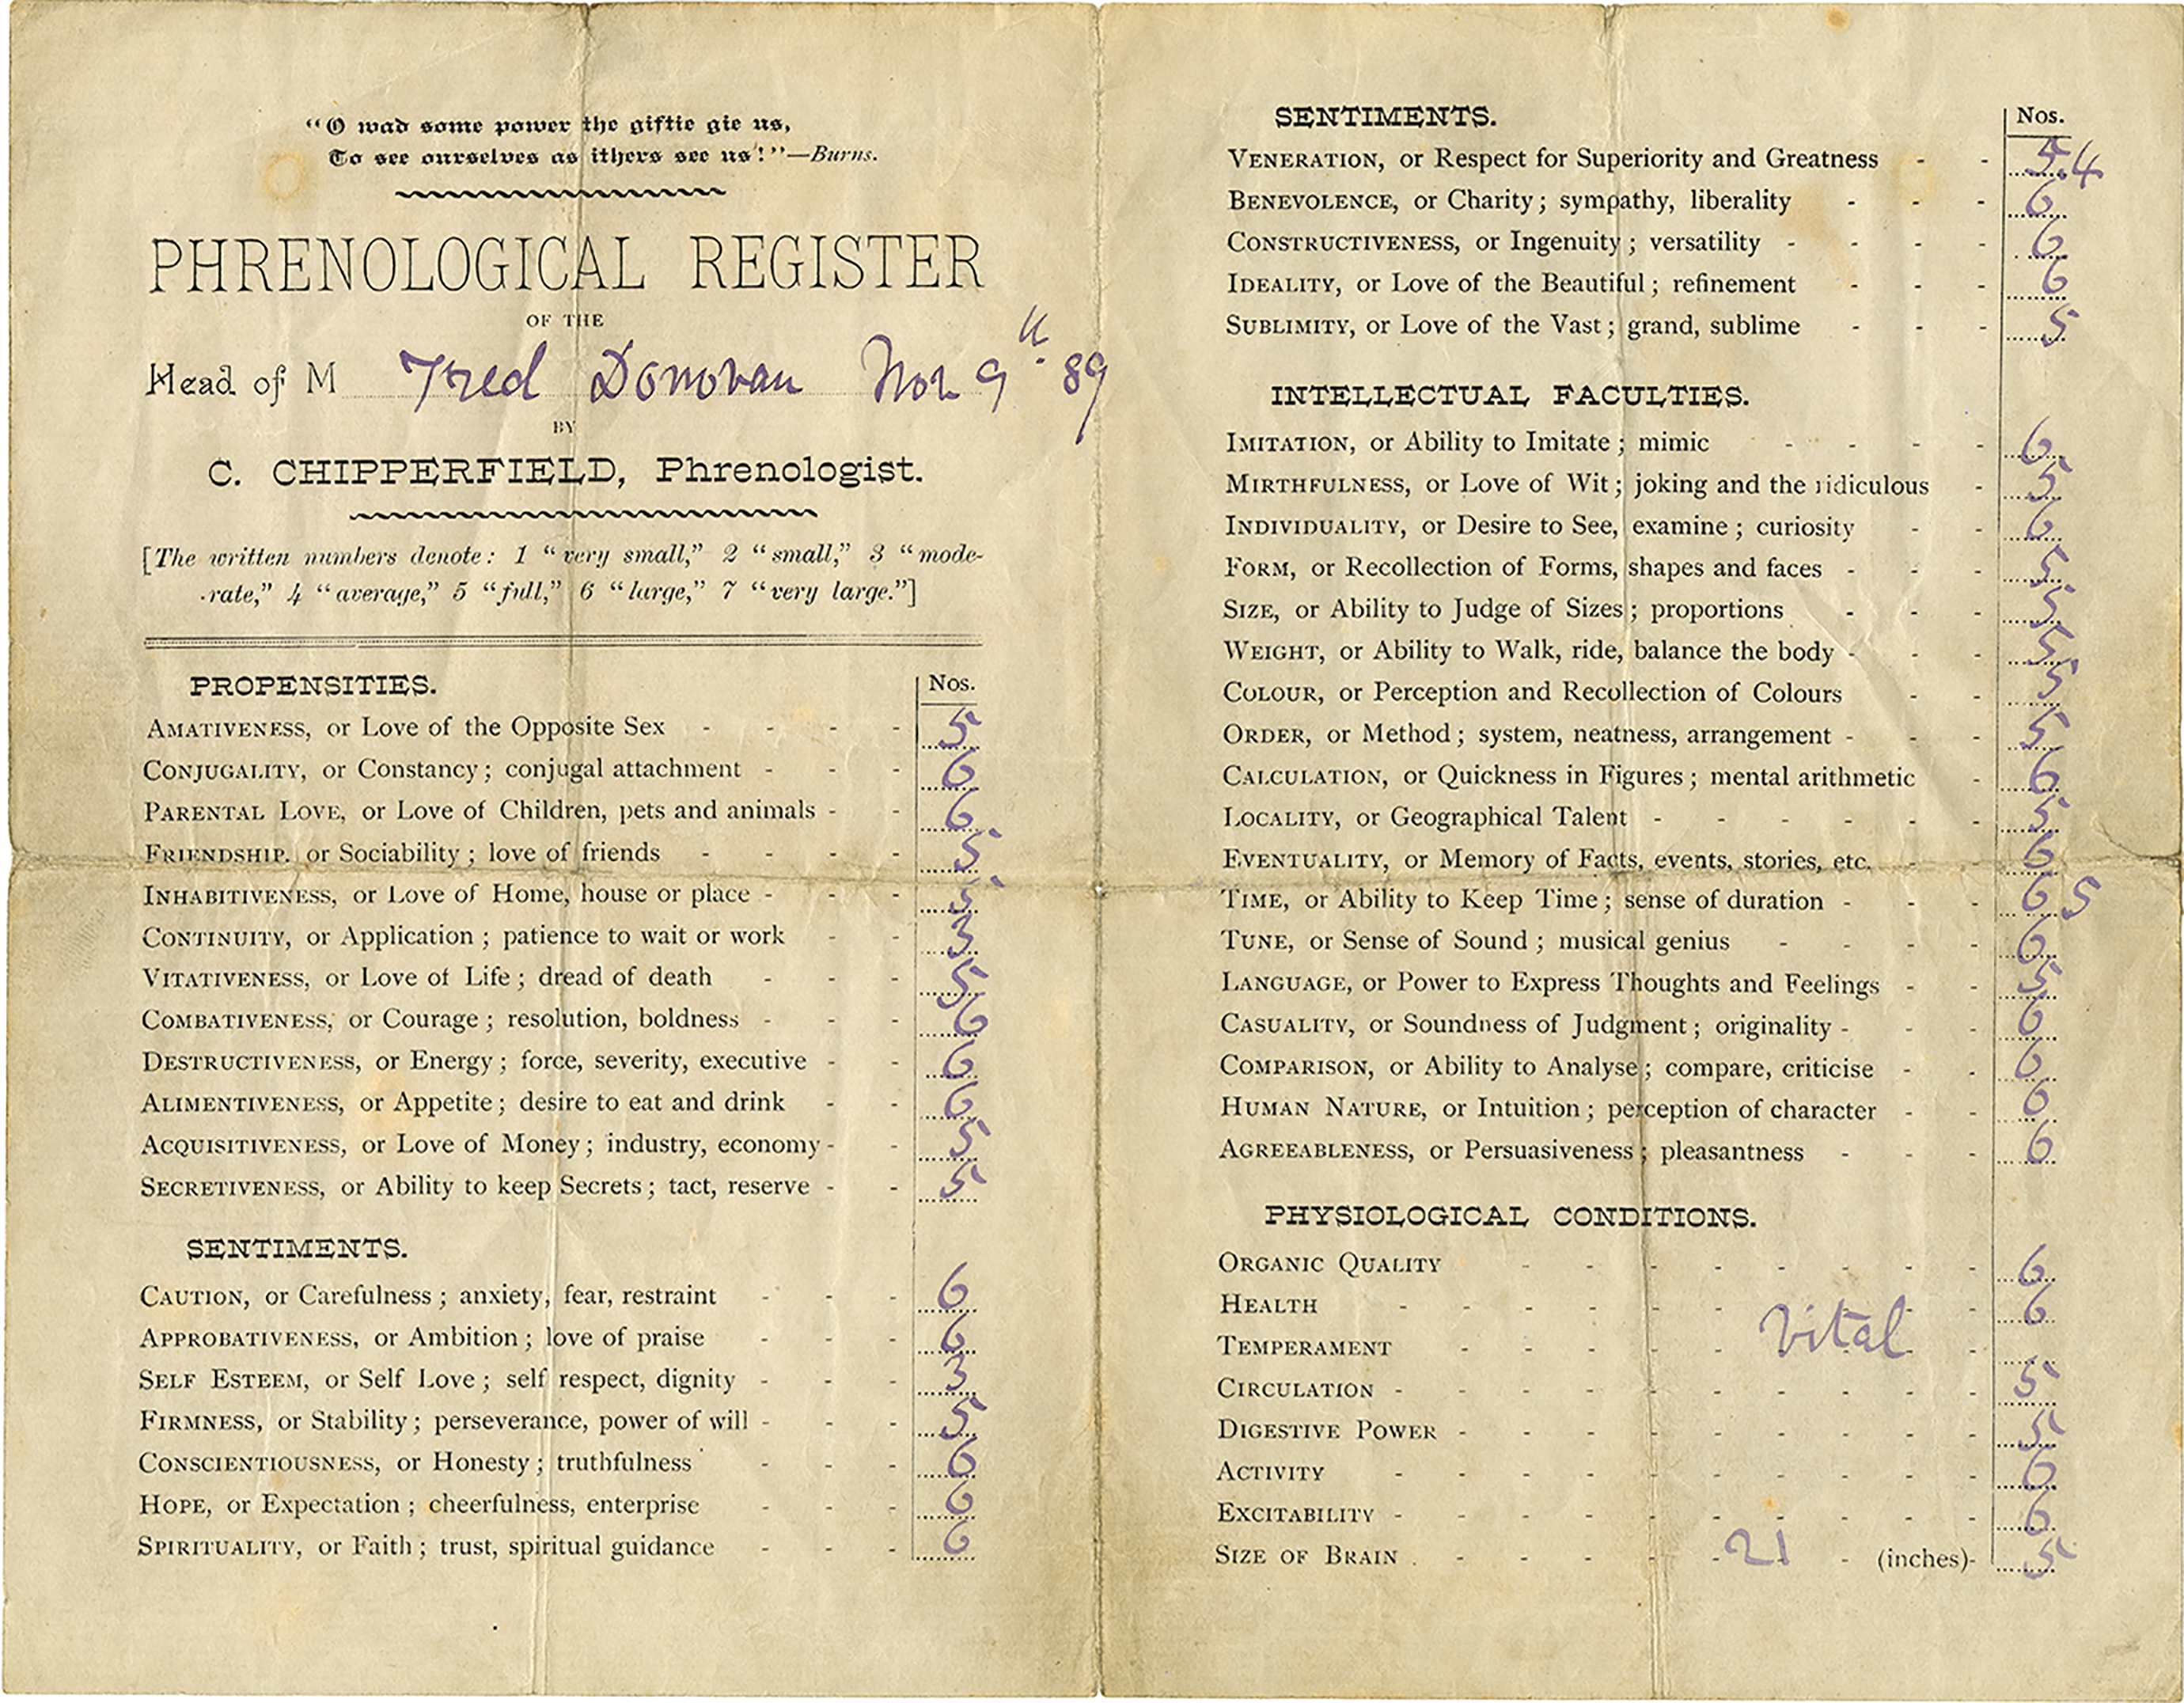
C. Chipperfield, Phrenological Register of the Head of M [Fred Donovan, Nov[ember] 9th [18]89], University of California, Los Angeles, Louise M. Darling Biomedical Library, History & Special Collections for Medicine and the Sciences (hereafter, ‘UCLA Biomedical Library’), 504.036.
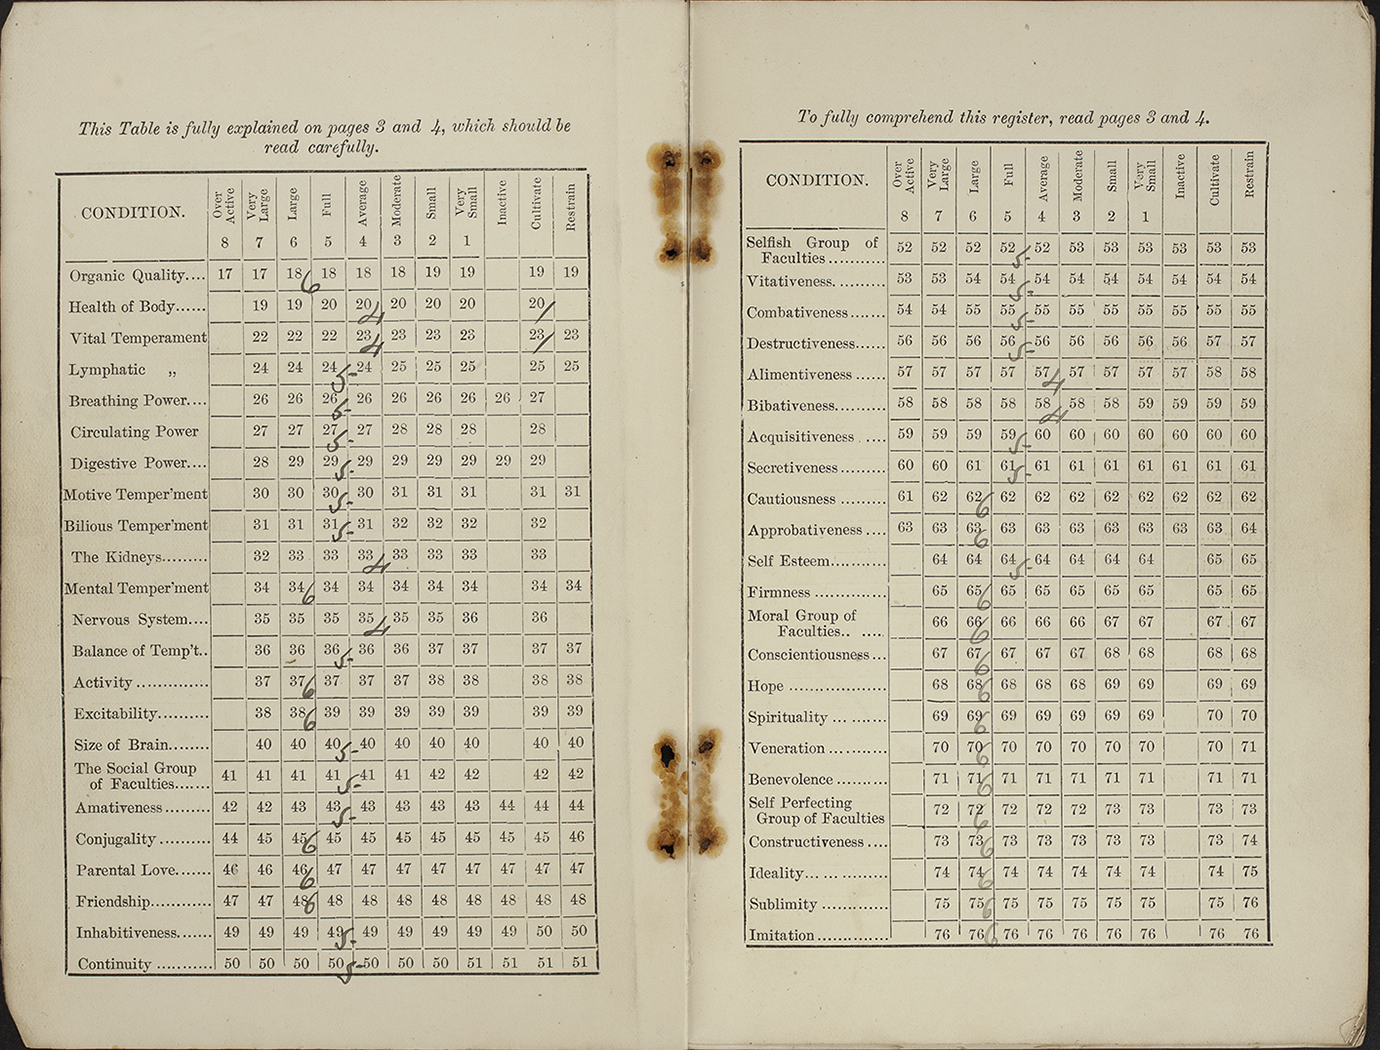
J. B. Keswick, The New Phrenological and Physiological Register, Embracing Directions for the Cultivation and Restraint of All the Mental Faculties, and Improvement of Health (Scarborough, n.d.), UCLA Biomedical Library, BF871.K42n 1892, record completed in ink for Miss Tomes, as given by W. Thompson in Taunton, 1892.
Numbers played an important role in the charts, and clients were taught how to read and understand the numbers on the charts and how they related to themselves. This was an era in which the public became more science-minded and even numerically literate, and the charts explained in detail how the numbers were to be interpreted, introducing quantification into everyday life (Cohen, 1982). The numbers on the charts signified scientific practices and objectivity, and they could therefore be seen by consumers as authoritative and persuasive. As Roger Cooter noted, one general intellectual legacy of phrenology was that it ‘established in the public mind the notion that human behavior was capable of classification and measure’ (Cooter, 1984: 271).
This quantification of character was much to the amusement of humourist George Derby, who in 1856 described a visit to a phrenologist in which he learnt that he had a benevolence of 12 (out of 12) and a self-esteem of only ½. He then commented, ‘Figures won’t lie’, and suggested that quantification should become even more fully integrated into everyday life (Phoenix, 1856: 38): The most ordinary question asked of you is, ‘How do you do?’ To this, instead of replying, ‘Pretty well,’ ‘Very well,’ ‘Quite well,’ or the like absurdities – after running through your mind that perfection of health is 100, no health at all, 1 – you say, with a graceful bow, ‘Thank you, I’m 52 to day;’ or, feeling poorly, ‘I’m 13, I’m obliged to you,’ or ‘I’m 68,’ or ‘75,’ or ‘87,’ as the case may be! Do you see how very close in this way you may approximate to the truth; and how clearly your questioner will understand what he so anxiously wishes to arrive at – your exact state of health?
Of the earliest 16 charts I collected, which dated from between 1836 and 1848, half used the term ‘average’ (including the earliest two). Of 157 charts, 115 used the term ‘average’. In charts that did not use ‘average’, the middle score (if there was one) was called ‘rather full’ or ‘fair’. Only rarely do we see other terms used. Walton Felch used ‘medial’ for the middle score in 1840. 7 Robert Dilks, an English phrenologist in New York, used both ‘medium’ and ‘average’ in 1853. 8 Only one chart used the term ‘normal’ for the middle score: Prof. Windsor and Mme Lilla Windsor’s chart of 1891 said that an organ of ‘normal development’ – 5 on a scale of 1 to 10 – was ‘liable to be entirely controlled by other organs’. 9
Orson Fowler and Lorenzo Fowler related that they had started head examinations in 1833 or 1834. The earliest chart I have been able to find dates from 1836. It did not yet include a table for the scores, but showed them scribbled in the margins. Just as Combe had done, Orson Fowler mentioned in this chart that the numbers referred to ‘the proportionate size of the Phrenological organs, and consequent strength of the corresponding faculties, in the same head, but not in different heads’. 10 Equally, in his 1840 chart, Walton Felch insisted that the estimations ‘compare the different parts of the same head’. 11 Fowler continued to repeat this argument until about 1845 and continually used it against criticism, as when a complaint was lodged that a phrenologist had marked the same head differently at a second reading. Fowler continued to repeat this argument until about 1845 (Fowler, 1845) and continually used it against criticism, as when a complaint was lodged that a phrenologist had marked the same head differently at a second reading. ‘I indicate the relative size’, Fowler wrote in 1837, so ‘if I mark one organ 12, another 14, &c. and again mark the first organ 14, the second 16, &c, their proportionate size is the same’ (Fowler and Fowler, 1837). A similar concept of proportionate size was adopted by other popular phrenologists, such as E. B. Wheelock, who insisted, in 1861, that the size of the head should be relative to the body and the size of the faculties should be compared ‘with the faculties of the same head’. 12 The majority of the charts made no mention of this or merely referred to ‘relative size’.
Interestingly, there was a shift when the Fowlers started to publish their New Illustrated Self-Instructors, a new series of charts with explanations, in which they wrote, ‘The examiner will mark the power, absolute and relative, of each function and faculty, by placing a figure, dot or dash on a line with the name of the organ’. 13 That this was intentionally vague can be concluded from another Fowler family booklet, which propagated comparisons with respect to a single head as well as between different heads: ‘The different appearances in all the varieties of relative size must be discovered [by the aspiring phrenologist] by inspecting numbers of heads and comparing one with another’. 14 Two pages later, Lorenzo Niles Fowler insisted that the scores indicated ‘merely the relative proportions of the organs to each other’, and explained the anomaly by stating that while, in order to prove phrenology to be true, relative size was important, for beginning phrenologists ‘it is useful to contrast the same organ in different heads’. 15
Other aspects also suggest that in practice the terms in the charts implied comparisons with imagined fellow American or British men and women. Characteristics such as ‘organic quality’ or ‘health’ or ‘size of brain’ were also classified as ‘average’, even though they could not be compared within the individual body. 16 There were also phrenologists who were more explicit. Enos Stevens from Pennsylvania unambiguously wrote in 1839 that he used standard head and bump sizes. He organized his measurements around what he called ‘General Mediocrity’, the standard form and size of a man of 33 years of age, although he did not specify the average measurements. 17
The fact that every single client in my collection of charts scored above average supports this article’s hypothesis that, in practice, phrenologists conveyed the message to their clients that they were compared with their peers. Both the numbers and the layout of the tables on the chart guaranteed that an individual’s score was immediately obvious, and this score was generally remarkably optimistic about the client’s character and intellectual capabilities. On a scale of 1 to 7, clients typically scored 5 or 6, with 4 usually identified as the average. 18 Interestingly, in most phrenological charts, the measured circumference of the head was indicated by a number, but there was also an additional row in the table called ‘size of brain’, which gave the score on an ordinal scale. These scores bore no relation at all to the measured head circumference, and comfortingly, clients always had a brain size above average. So even though head circumference was the only thing phrenologists did measure, the message to the client was more important than attempts to link the scores to statistical aggregates.
Phrenologists were aware of this practice. Grimes wrote that the ‘common practice of all the examiners in the country, using a scale of numbers from 1 to 7, and then marking most, and sometimes all of the organs above 4, the average, is a palpable mathematical absurdity.…Surely the principles of mathematical truth should not be sacrificed to flatter the vanity of the persons examined’. 19 N. N. Riddell found the practice ‘misleading to the subjects’ and ‘degrading to the profession’, but also stated that a higher score should be reserved for a real grand head, which again suggests that this implied a comparison between individuals. 20
If everyone scored above average, this also shows that the average was not a perfect score. Some suggested it was: James Stanley Grimes, a phrenologist from Boston who was trained as a lawyer, wrote in 1860 that ‘in this chart, 4 denotes the average degree of the faculty; and if an organization is perfect in every respect, every faculty should be marked 4. Any variation from 4, either above or below, indicates a departure from a balanced organization’.
21
His client, however, scored suitably above average. Another booklet similarly stated, The more organs in each head we mark average, the more symmetrical that head is made; the more harmonious their functions; and consequently, the more uniform will be the character of the individual. Average is the size from which all functions should be studied; it expresses neither deficiency nor redundance, but plain useful, elementary, and harmonious activity.
22
Nonetheless, other examples show that the average score was seen as neutral or slightly negative. The meaning of average, according to an 1838 chart by Orson Fowler, was ‘fair, or between moderate and full’. According to phrenologist W. H. Gibbs, average implied ‘a respectable minority of power; and that the strength and activity of the faculty is subordinate’. 23 According to John Barton Keswick, average ‘is used to denote par. It indicates an active, but not an energetic organ; one that has a fair influence in the mental council, but it will never be the predominating power unless cultivated’. 24 Phrenologists thus moved away from Quetelet’s notion of the balanced state as the ideal, and towards the idea that to be average was to be stagnant and to lack the power to shape one’s life and circumstances.
In descriptions of the faculties, the average score was usually not very favourably defined. English phrenologist J. Wood wrote in his description of an average score in his section on ‘amativeness’, ‘Your love is warm, but you do not love passionately’. Average ‘health’, on the other hand, was not good: ‘Your health is none too good. You work beyond your strength, therefore should take more rest’. 25 Nelson Sizer wrote that ‘one having an average-sized brain, with activity only average, will discover only an ordinary amount of intellect; be inadequate to any important undertaking; yet in a small sphere, or one that requires only a mechanical routine of business, may do well’. 26 That ‘only’ was coupled here with ‘average’ is a strong indicator that more than ordinary brainpower was expected from a phrenologist’s client and was seen as necessary to succeed in life.
It is hard to say how consumers interpreted these scores. The numbers in phrenology had little connection to the ‘real’ world, but may have confirmed ideas or surprised consumers positively. As Carla Bittel has shown, consumers were not passive receivers of knowledge, but varied from ardent believers to those who went to the phrenologist for a fun night out and took their scores with a healthy dose of scepticism (Bittel, 2019). Yet the charts taught this kind of consumer that there was such a thing as the average head and that it was a positive thing to be among the better-scoring half of this imagined statistical community.
Conclusion: Extremes versus averages
As this article indicated earlier, both geniuses and deviants featured prominently in phrenological publications. At some point, the American Phrenological Journal and Miscellany filled most of its pages with phrenological analyses of the characters of famous men (see Hagner, 2003). On the other side of the spectrum were the criminals and idiots. The roots of phrenology originated in observations in madhouses and prisons, and in the years of the phrenology craze, shops in London began to produce plaster phrenological busts of infamous criminals as lecture aids and merchandise (Parssinen, 1974: 12). In phrenological booklets, drawings of idiots with low, retiring foreheads and protruding jaws were printed next to those of famous statesmen and scholars with high foreheads. ‘Contrast the massive foreheads of all giant-minded men-Bacons, Franklins, Miltons, etc. with idiotic heads’, said The Illustrated Self-Instructor in Phrenology and Physiology, and the images were assumed to speak for themselves. 27
However, as I have shown in this article, this was not the only aspect of phrenology. White middle-class consumers who visited phrenologists not only learnt to place themselves between these ends of the spectrum, but were also encouraged to think about what an average score might signify. Phrenologists borrowed the term average from scholars collecting social statistics, but did very little data gathering themselves. Phrenologists were supposed to gauge the relative size of the bump based on their experience with other heads, but in the charts they produced and filled in, they benefitted from the aura of scientific accuracy that surrounded the use of numbers and averages.
Phrenological charts were tailored to the individual and included a personal score. The accompanying text in the charts explained to clients how to read the tables with the scores, and although phrenologists were intentionally vague about whether the bumps were compared with each other or between heads, the vague contours of an average person were sketched in the tables and descriptions. It was taken for granted that this average person excluded non-white populations. As the same charts were used for men and women alike, the average person referred to both genders (a distinction was made only for head circumference). The average person in phrenology was the ordinary, but not the ideal person. Although the average person had a positive connotation in the sense that he or she was balanced and moderate, in most charts only the descriptions indicating above-average scores, such as ‘full’ or ‘large’, were defined as truly positive. The clearest indication that the average was not the ideal was the way the charts were filled in. With everyone scoring above average, the reassuring message of the charts was that everyone was special and should be able to rise above the masses.
‘Scientific characterizations of “average” or “typical” Americans’ were therefore not a ‘striking phenomenon of the new century’, as Sarah Igo (2008: 11) argues. As we have seen in this article, phrenology had already introduced the ‘average’ to the masses, no matter how little factual basis it had. It provided, both in the US and in the UK, a new way for white middle-class men and women to position themselves in an imagined statistical collective.
Footnotes
Declaration of conflicting interests
The author declared no potential conflicts of interest with respect to the research, authorship, and/or publication of this article.
Funding
The author disclosed receipt of the following financial support for the research, authorship, and/or publication of this article: Nederlandse Organisatie voor Wetenschappelijk Onderzoek 275-69-008.