
Abstract
Keywords
Introduction
Rare diseases (RDs) are very different nosological entities, but all share the same difficulties in diagnosis, treatment and management pathways, affecting not only the patients’ life, but also impacting their families, caregivers and community. 1 Much has been done in recent years to support and protect them. In 2001, in accordance with the principles of the Italian National Healthcare System (NHS), which is public, universal and regionally-based, Italy established a National network made up by the Regional networks and promoted the implementation of a National and Regional RD Registers. 2 A list of rare diseases has been defined with special benefits within the Health Benefit Basket (HBB), updated in 2017. 3 Regional Administrations identified Regional and inter-regional centers of reference responsible for diagnosis, treatment and follow-up of patients.
Veneto Region, in the north-east of Italy with about 4.9 million of inhabitants, was the first Region in Italy to establish a Regional rare disease Registry in 1999.4,5 It manages the unique regional information system for diagnosing and taking care of people with RDs. Therapeutical plans for patients affected by a RD are drawn up by the centers of reference and shared with hospitals and services of the Local Health Authority (LHA) of residence that are involved in the patient’s care pathway. In Veneto Region there are 9 LHAs which are in charge of providing and purchasing the health services for their residents. All prescriptions of drugs and aids are managed in the therapeutical plans, both those included in the national HBB and those included in the regional HBB, as well as any ad personam additions authorized by the LHA of residence.
Rare diseases have complex care needs and involve a high care burden. Often the rarity of these conditions is such that research and development costs of drugs intended for their prophylaxis or therapy are usually too high to make the products profitable. Following the principle of equal access to treatments for RD patients, the European Union (EU) adopted a particular legislation defining incentives and special market conditions (f.i. 10-year market exclusivity) to encourage industry to develop the so-called “orphan drugs” (OD). 6 They are known to be the most expensive treatments within the drug market.7–11
Pharmaceutical companies claim that the costs of researching and manufacturing ODs are very high and justify the prices; while economic researches are worried that a risky monopoly regime has been setting up.
While orphan drug designation and marketing authorization are defined at European level, their prices and reimbursement are defined nationally, often guided by the results of local health technology assessment (HTA), with different choices among countries regarding prices and drugs’ access.
Usually, ODs are completely reimbursed by the Italian Health Service. According to a Report by the Italian Medicines Agency (AIFA), 12 in 2019 in Italy ODs reimbursed by the NHS made up 6.6% of the total pharmaceutical expenditure (in 2010 it was 3.5%), amounting to about 1.5 billion euros.
In the last few years, there has been an increasing attention on sustainability issues of National healthcare systems. Health economists have expressed fears that ODs “could impose substantial and increasing costs on the health system”. 13 Studies conducted in the field of RDs, at European level, have been trying to estimate the budget impact of ODs. Unfortunately, their forecasts often relay on theoretical assumption, because of the difficulty of obtaining real or reliable prevalence and consumption data on RDs or the different adopted list of RDs or ODs.
For instance, Schey et al., 14 in 2011, predicted that spending on ODs would increase in the future, given the likely increasing availability of such drugs. However, the study stated that, although total spending was destined to rise, the growth rate of spending on ODs would reach a plateau at around 4–5% of total pharmaceutical expenditure, aligning with the growth rates of the broader pharmaceutical market.
Moreover, little is known about high cost drugs for RDs that are not recognized as ODs.
Although principles of good practice for carrying out a correct budget impact analysis 15 keep underlying the importance of using real-world data about prevalence, consumption and expenditure data, that represents an infrequent occurrence in literature.16–18
The main objects of the present population-based study are to provide a picture, based on real-world data, of the budget impact of drugs used for RD patients, whether they are ODs or not, assisted in the Regional public Health System (Veneto Region, Italy) and describe the expenditure structure and dynamics of these drugs in a real-world setting, using a combination of Regional databases.
Methods
Study design
A population-based multi-source retrospective study was conducted, covering a one-year period (2019), where data was taken from different Regional administrative databases and gathered in accordance to the Italian privacy laws and following the procedures required by the different databases.
Data about the residents was obtained by the Regional health-assisted subjects’ database containing residents’ demographic data. Data about exemptions was derived by the Regional diseases’ exemption database recording subjects residing and assisted by the Veneto Region Healthcare System with a special exemption from co-payment of the healthcare costs because affected by chronic or rare diseases. Individuals with exemption codes for RD were used and considered. 3
Data about reimbursement and prescription was obtained by the three Regional pharmaceutical databases: outpatient, inpatient and retailed pharmaceutical data flows. They provide information for each medical prescription reimbursed by the National Health Service (NHS), about the drug name, the Anatomical Therapeutic Chemical (ATC) code, the dispensing date, the number and cost.
List of drugs
An ad hoc list of high-cost drugs used for RDs was drawn up. We drew up a first list with the orphan drugs approved with centralized procedure by the European Medicine Agency (EMA) and already available in the Italian market, indicated for rare diseases included in the Italian reference list (Annex 7 of the DPCM January 2017). The selection of drugs with orphan designation concerned both those currently included in the Community Register of orphan medicinal products for human use, available on EU Commission web site, and those removed from this Register, including those that have ended their ten-year market exclusivity.
Then, we drew up a second list of drugs with the highest impact on regional pharmaceutical expenditure for RDs, through the analysis of the regional pharmaceutical data flows and the Regional RDs Register, not classified as ODs, but with a specific indication for any rare disease on drugs’ monographs.
For the purposes of this study, we classified the high-cost selected drugs according to the international Anatomical Therapeutic Chemical (ATC) classification system that utilizes five levels of granularity from the therapeutic group (level 1) to the active substance (level 5). 19
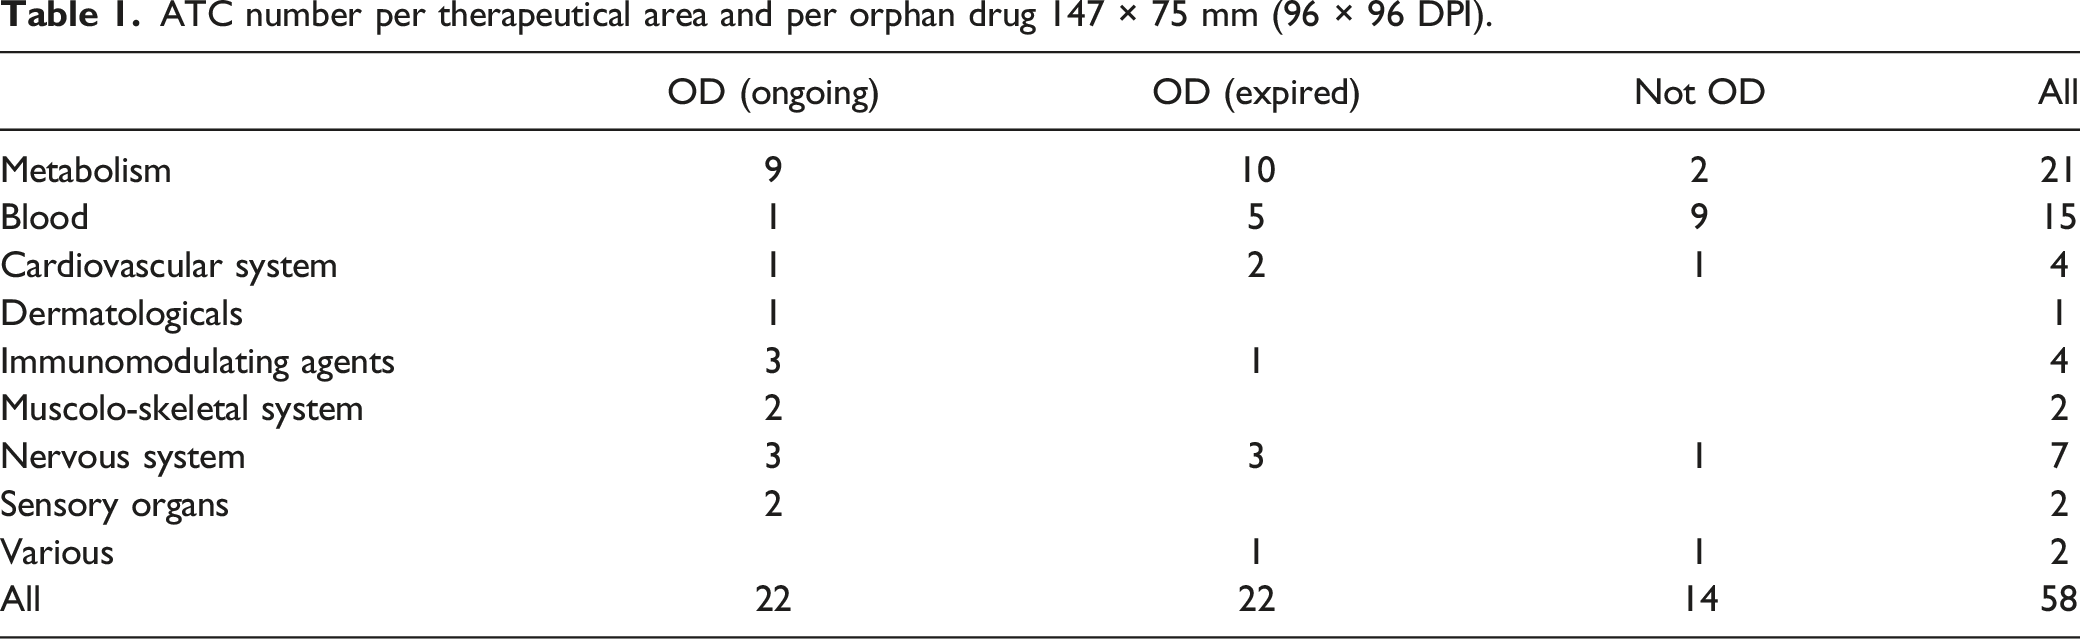
The final list (Annex 1), bringing together the first and second list, included 58 ATC codes out of the total 1,843 ATC codes available (3.1%).
Study population
Eligible subjects were considered all the 36,956 individuals diagnosed with a RD included in the Italian RD list 3 and residing in Veneto Region, present in the Regional diseases’ exemption database, with an effective exemption from copayment of the health care costs for rare diseases and entitled to get special benefits free of charge by the NHS and RHS.
Among them, 31,026 were considered as “treated” (84%), because they had received at least one distribution in the pharmaceutical databases in 2019 of any drugs, among the available 1,843 ATC codes, reimbursed by the NHS; 2,758 were considered as “treated using a RD drugs”, because they had received at least one drug, in 2019, included in the drawn-up list in Annex 1.
Statistical analysis
Through record linkage operations utilizing anonymous individual identification code univocally attributed to each person assisted by the Regional Health System, we integrated the data from multiple data sources settled on an individual level, that are: assisted subjects database, exemptions database, outpatient and retailed pharmaceutical data flows. Individual data, instead, were not available for inpatient drugs’ data flow; therefore, it was not possible to differentiate the expenditure by each patient, but only by the type of ATC code.
The steps we followed are listed below: 1. We calculated the whole Regional pharmaceutical budget allocated to pharmaceutical expenditures by analyzing the total costs on drugs in 2019 in the three pharmaceutical data-flows (inpatient, outpatient and retailed ones) referring to the three possible drugs distribution types in the RHS. 2. We focused on the Regional budget allocated to RD patients, restricting the analysis only to people with a RD exemption among all assisted people in the Region. We analyzed, at first, the whole pharmaceutical expenditures for “treated” RD patients (utilizing inpatient and retailed dataflows) and, then, restricted the analysis only to expenditures for drugs of the RD list for “treated using RD drug” patients (utilizing only outpatients dataflow and excluding retailed data, because there are no such distribution of these drugs).
Besides, for inpatient data flow, non-allowing ad individual record linkage due to the lack of individual anonymous data, we estimated the whole expenditure, not at an individual level, utilizing the ATC codes of the drugs’ list. 3. A descriptive cost analysis using the outpatient dataflow was carried out for each ATC code of the RD list by comparing the total expenditure (in descending order) and the average expenditure per patient affected by RD, differentiating between orphan and non-orphan drugs and, among ODs, differentiating the ODs with ongoing patents and 10-year market exclusivity and expired ODs. Drug rankings were then created based on the number of treated patients, per patient mean expenditure and the overall expenditure. 4. Finally, we focused on the local budget impact analyzing the variability among the 9 HLA of Veneto Region in relation to the expenditure about RD drugs list. In Veneto Region, each individual is residing in a different HLA according to where she/he lives and it is responsible of providing the health services she/he needs and/or paying for them. We assessed the average budget per resident, distinguishing between OD and non-OD, and comparing the percentage distributions of expenditure and of treated patients, split up by each therapeutic area of administration referring to the ATC codes (first digit of ATC explains the area).
Results are reported using figures and tables. Categorical data are given as numbers with percentages and continuous data as average, sum and percentages. Mean expenditures were calculated by dividing the absolute number of patients (mean expenditure per patient) or of inhabitants in the corresponding year (expenditure per resident, per LHA and per whole Region).
Various methods of data graphical representations were utilized as a way analysing numerical collected data and giving, thorough figures, a visual and immediate display of the investigated complex phenomena. Bar charts, dual axis histograms and areograms have been used.
Record linkage operations, data processing and descriptive analysis was performed with the SAS package, rel. 9.4 (SAS Institute Inc., Cary, NC, USA). Figures and tables are created with the use of Microsoft Excel software, Office 2013 (Microsoft Corp., Redmond, WA, USA).
Results
The list of RD drugs
ATC number per therapeutical area and per orphan drug 147 × 75 mm (96 × 96 DPI).
Public regional pharmaceutical budget and RDs
As Figure 1 shows, in 2019, the whole public Regional pharmaceutical expenditure was almost EUR 1,500 million (Figure 1) for marketed drugs referring to the total 1,843 ATC codes, available and distributed to residents assisted by the Veneto RHS. Veneto Region Public system pharmaceutical budget per types of distribution (inpatient, outpatient and retailed distribution) and per expenditure addressed to rare diseases patients (specific 58 ATC and other ATC) – 2019 243 × 147 mm (96 × 96 DPI).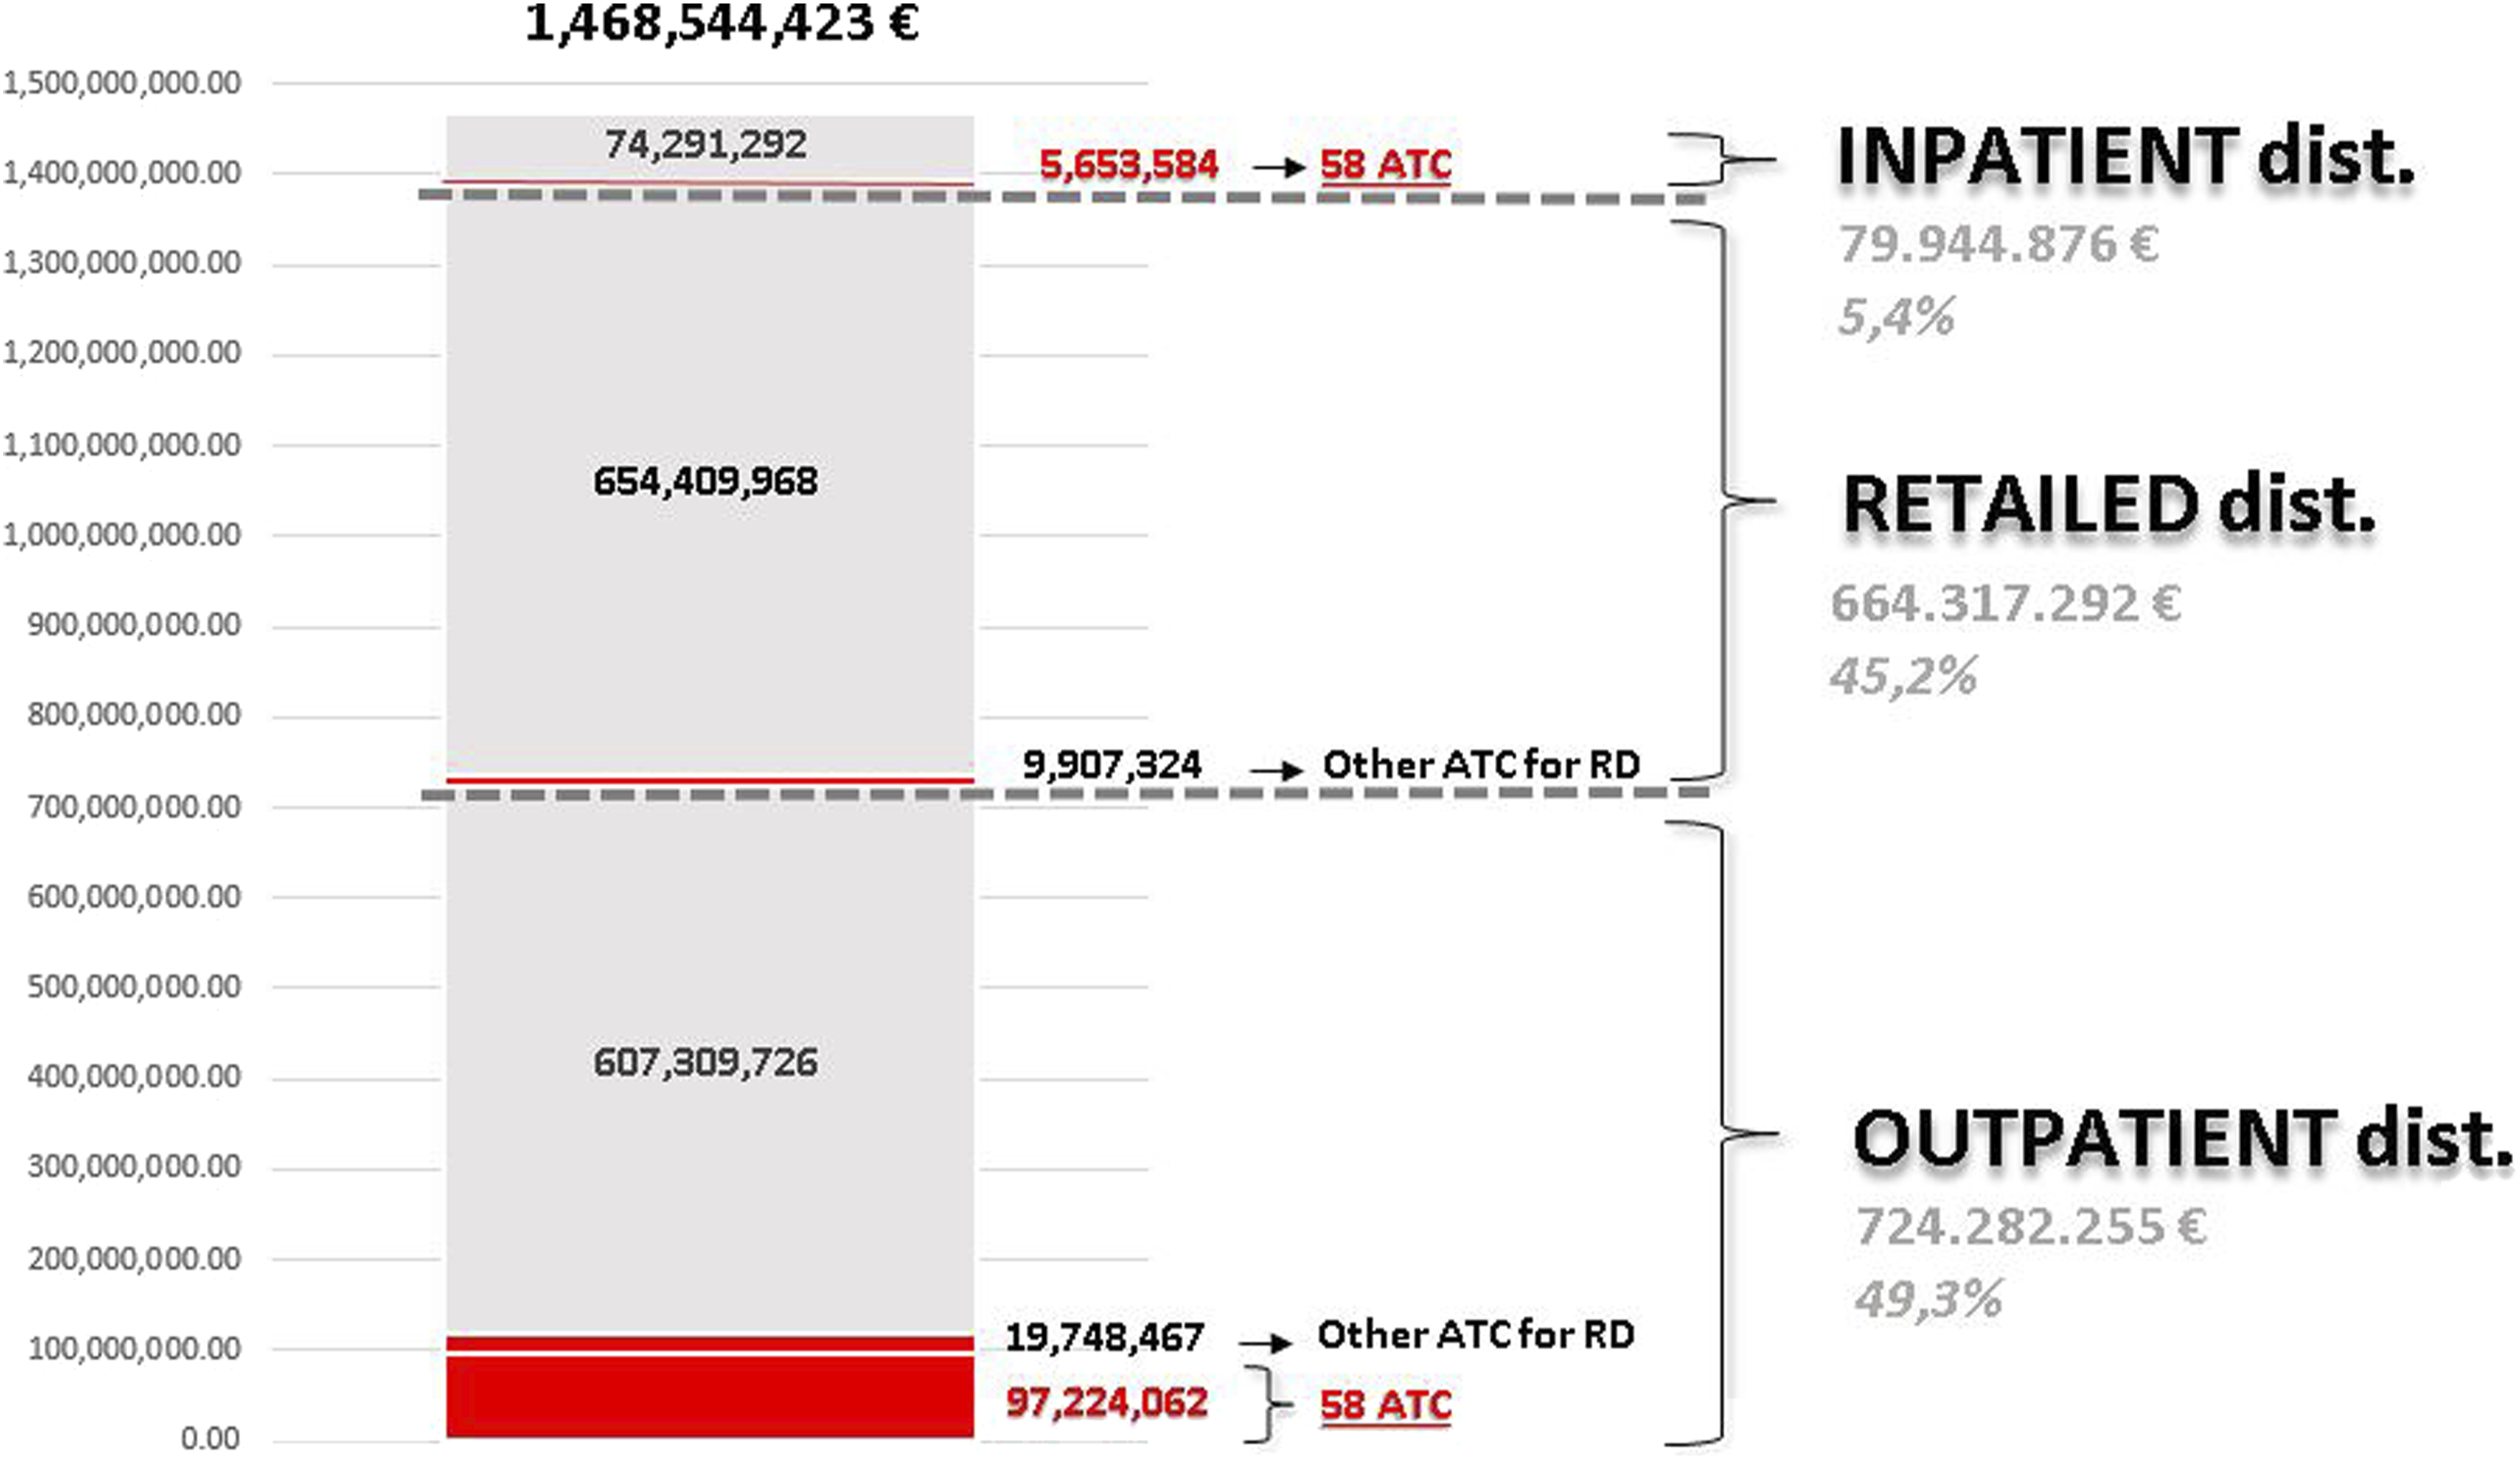
Hospitalizations aside, 84% of residents affected by a RD received any drug reimbursed by the RHS with a total budget of EUR 126.9 million through outpatient and retailed distributions (Figure 1).
The specific drugs referring to the RD list (58 ATC) were provided to a subset of 2,758 RD patients (8.9% of RD patients) and totaled an expenditure of EUR 97.2 million (6.6% of the total Regional pharmaceutical budget). Out of them, EUR 66.0 million were allocated to purchase ODs (4.5% of the total budget) 55% for ODs with ongoing patents and market exclusivity and 45% for old ODs, and EUR 31.2 to purchase non-OD (2.1% of the total budget).
Besides, Figure 1 shows that other EUR 5.6 million were used to purchase these drugs for hospital admissions (inpatient data flow).
Cost analysis per ATC (RD drug list)
Figure 2 compares, as a snapshot, the total Regional outpatient pharmaceutical expenditure per ATC code to the mean expenditure per patient for the 58 ATC codes for RD drugs coming from the list (2A) and comparing OD to non-OD (2B). At a glance, the drugs specific for RD distribute mostly in the left side of the figure, where the highest expenditure per ATC stands, and with higher expenditure peaks per drug. Fifteen ATC (12 ATC of ODs and 3 of non-ODs) out of 58 had an annual budget impact per ATC over EUR 1 million and, among them, 3 ATC (2 ODS and 1 non-ODs) over EUR 2.5 million. Yearly treatment expenditures per patient exceeded EUR 100,000 for 21 ATC, 8 ATC exceeded EUR 250,000 and 3 ATC EUR 450,000 per patient. ATC per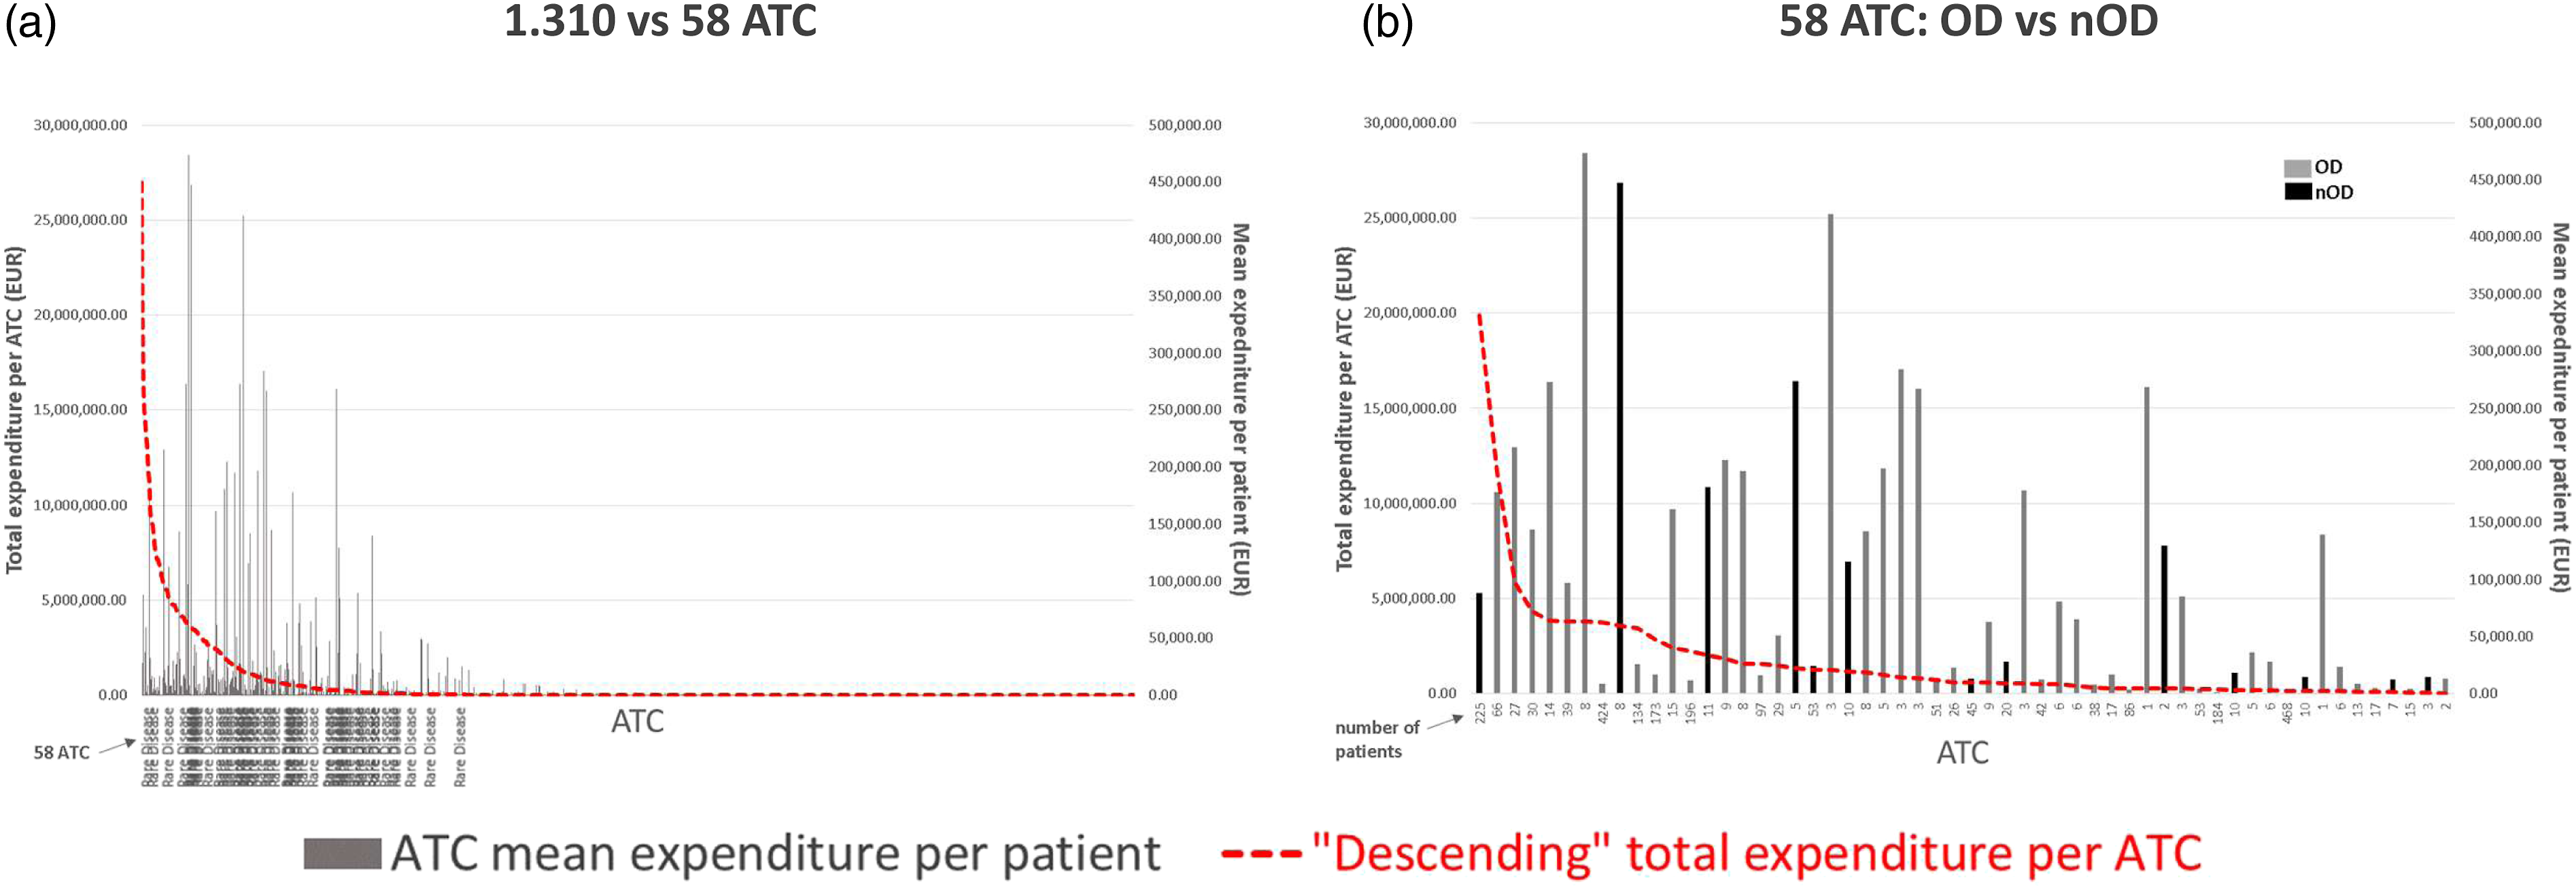
Drugs for rare diseases with the highest number of users, highest mean expenditure per patient and highest expenditure – 2019 180 × 169 mm (96 × 96 DPI).
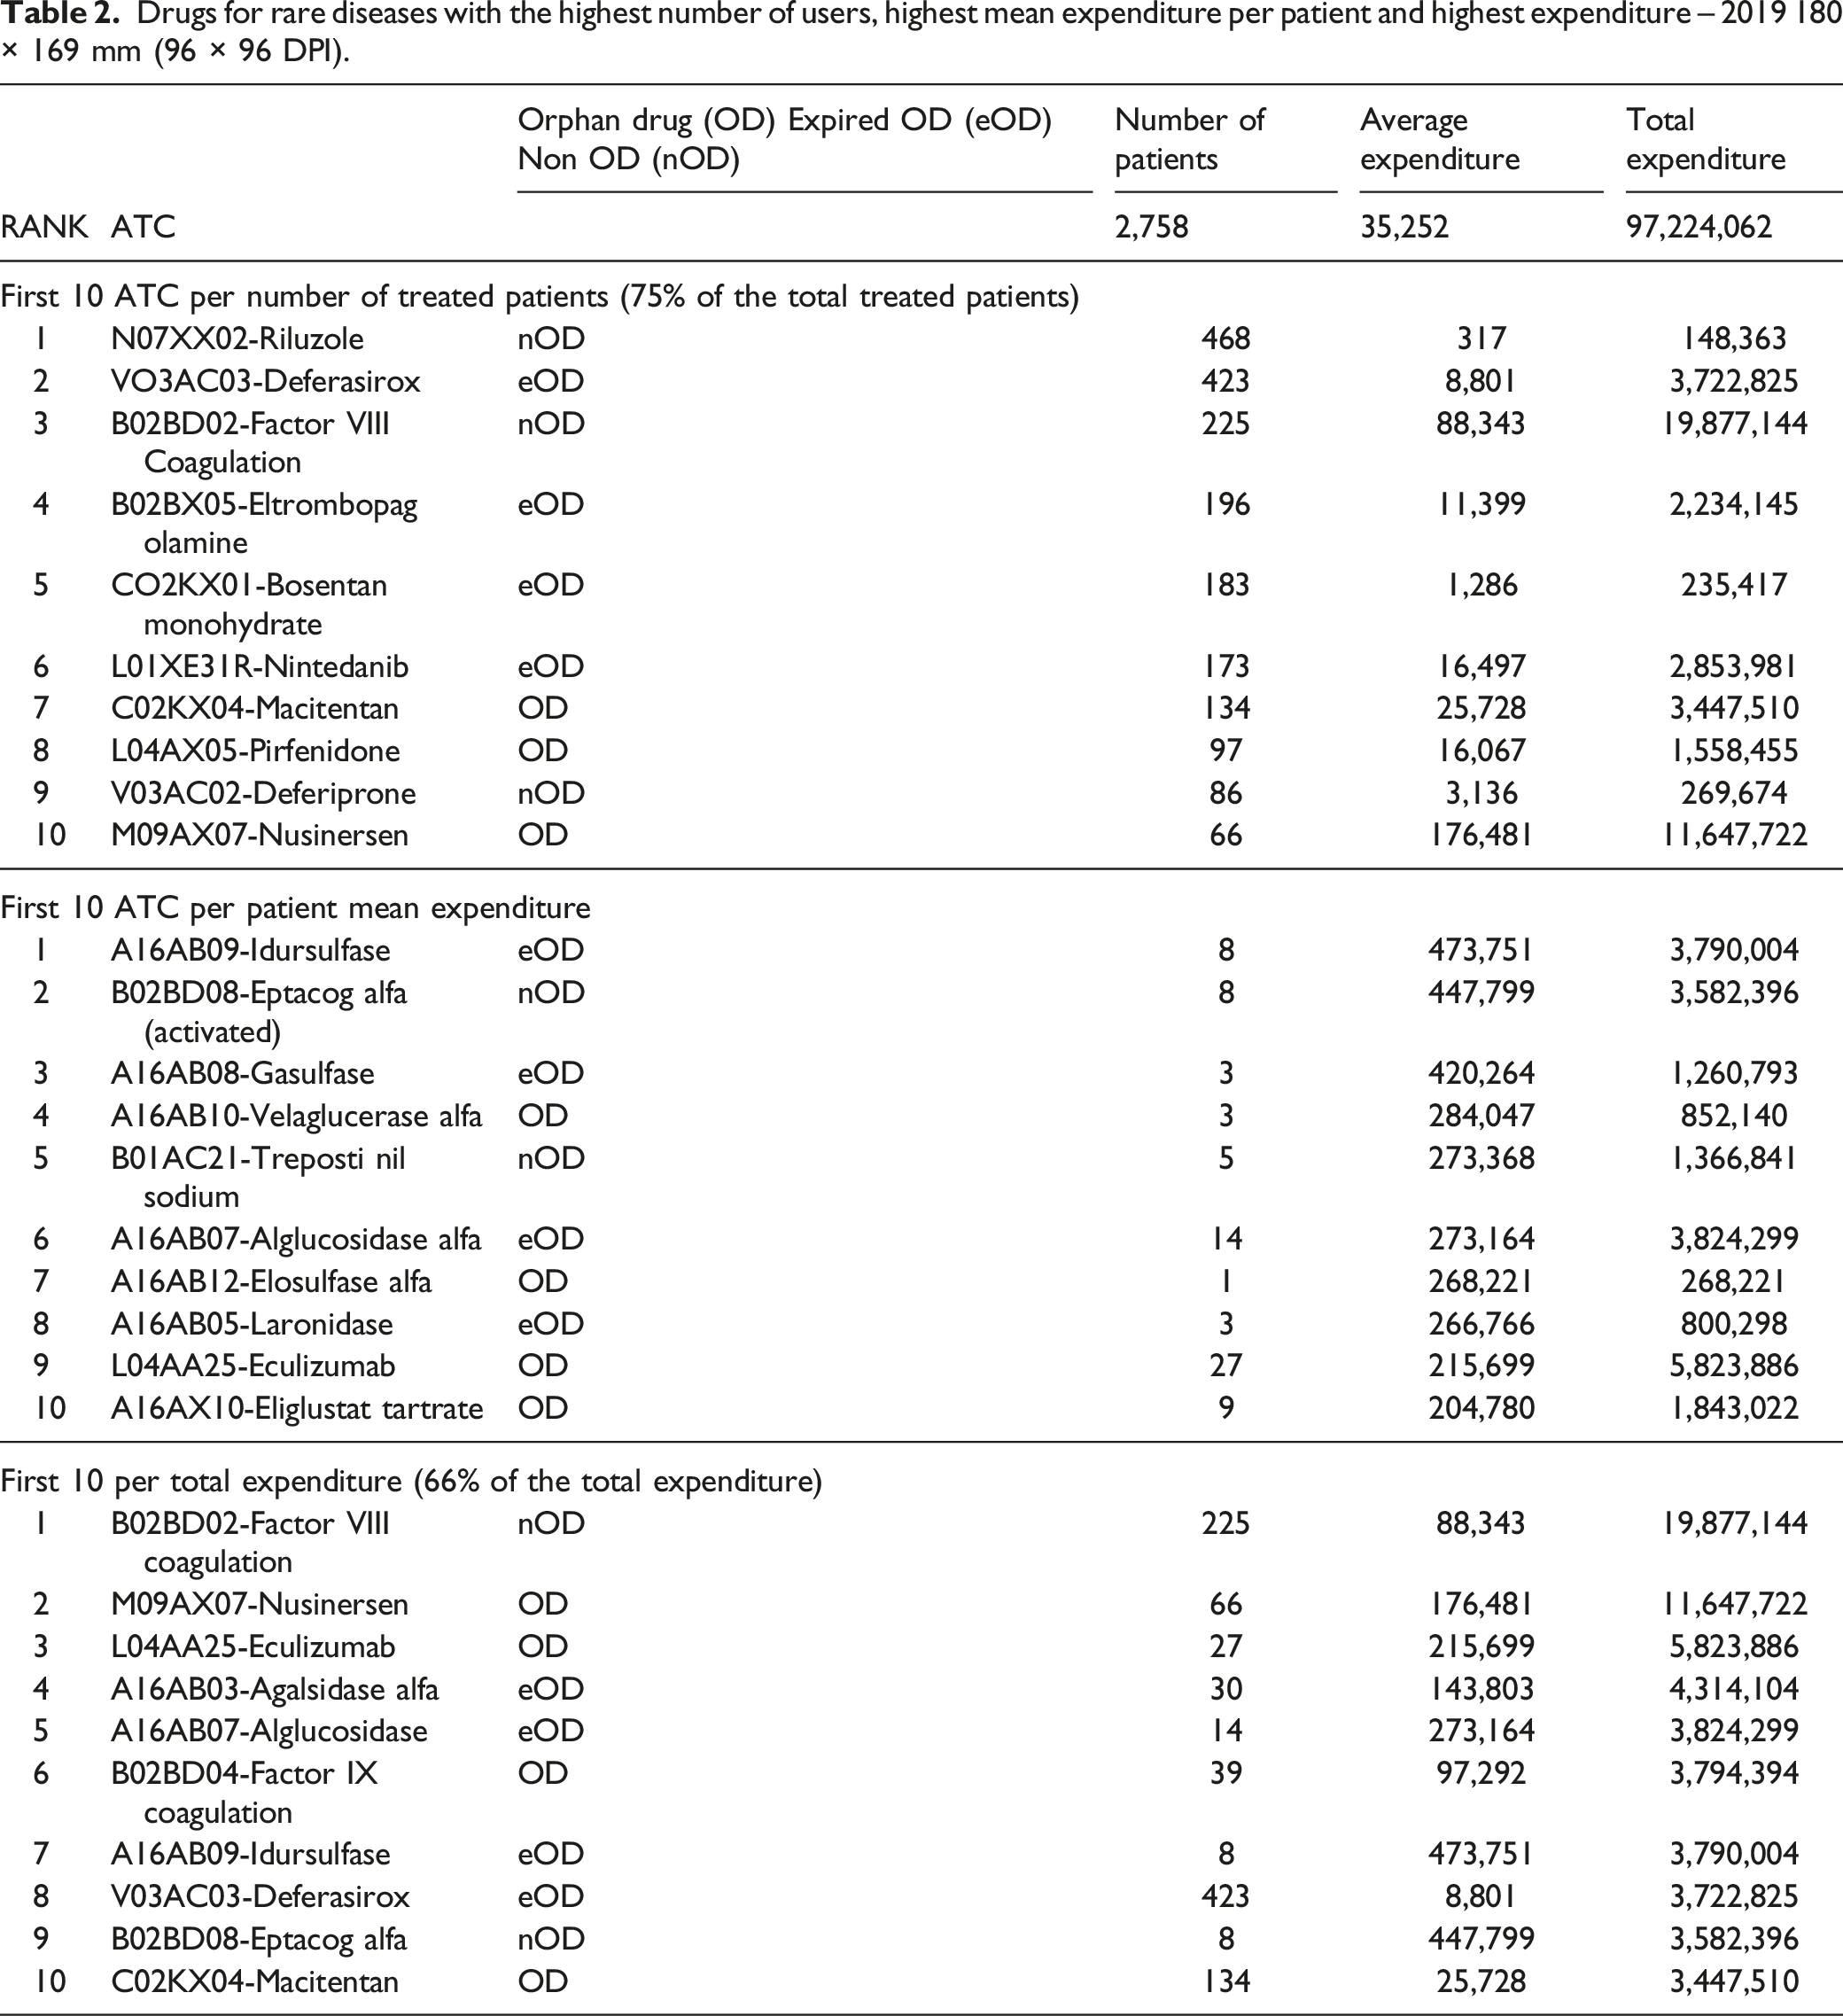
Table 2 moreover provides the ten drugs with the highest mean annual expenditure per patient and the ten with the highest budget. The first ten drugs with the largest budget impact explained an expenditure of EUR 63,8 million in 2019, nearly 66% of the total pharmaceutical budget allocated to the specific drugs for RD (EUR 97.2 million). Average annual expenditure presents a range from EUR 204,780 (Eliglustat) to EUR 473,751 (Idursulfase). Seven out of the first ten drugs with the highest mean annual expenditure per patient come from the metabolic area (ATC first digit is “A”).
The two drugs with the largest budget impact taken together (VIII^ coagulation factor for hemophilia A, EUR 19.9 million, and Nusinersen, for spinal muscular atrophy, EUR 11.6 million) had a cumulative budget impact over EUR 31.5 million that amounts about to one third of the total 2019 Regional pharmaceutical budget for RD treatments (the list).
Local budget impact for RD list drugs
Figure 3 shows the pharmaceutical expenditures for RD drugs of the list in the 9 different Local Health Authorities (LHA) of the Veneto Region Health System. Local Health Authority (LHA) total pharmaceutical expenditure and LHA budget per 58 ATC specific for rare diseases, residing patients – 2019 251 × 166 mm (96 × 96 DPI)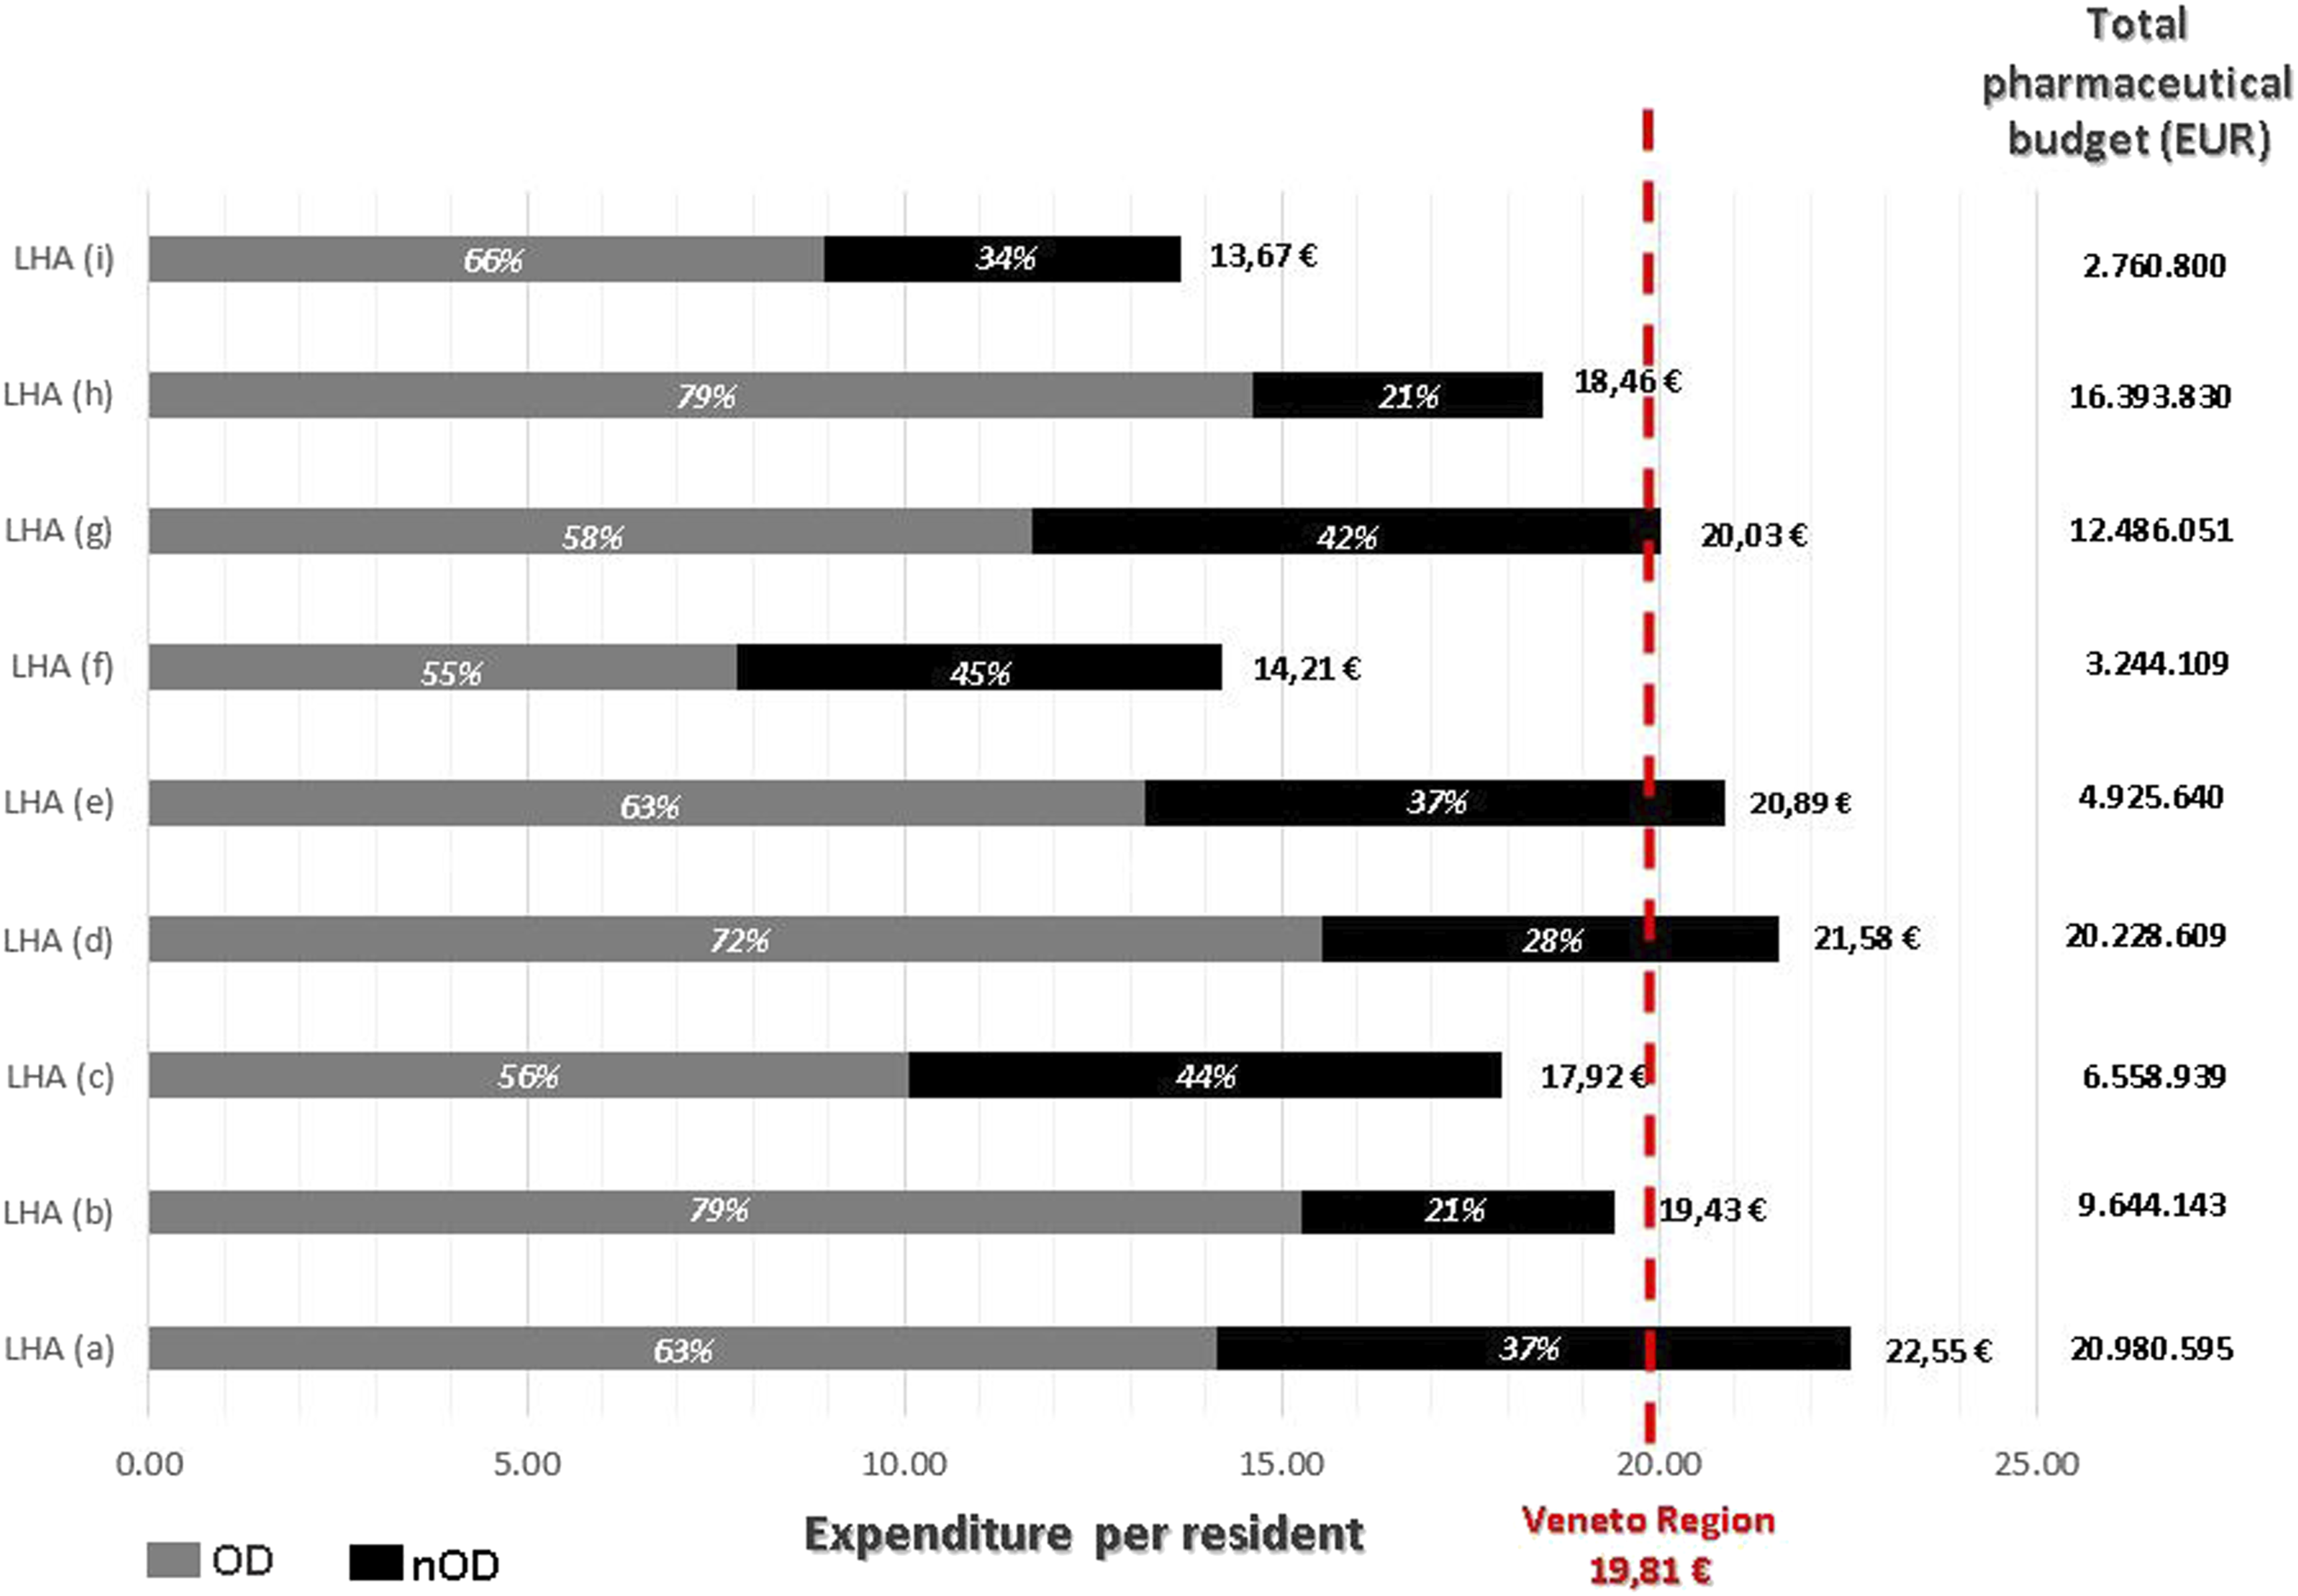
The average expenditure per RD resident of each HLA goes to a minimum of EUR 13.67 to a maximum of EUR of 22.55, compared to a regional mean value of EUR 19.81. The figure provides moreover the relative weight of ODs in the average RD drugs expenditure per resident, showing a range between 55% and 79% among the different LHAs.
Figure 4 provides, for each LHA, the relative expenditure of the budget for the RD drugs per therapeutical area, on the left, and the number of patients per therapeutical area, on the right. The drugs of the metabolic area were responsible for a very different ratio of the budget among the LHAs: from a minimum of 7% of the total budget to a maximum of 49%, with a range of treated patients from 1% to 11% of the total ones. For hematological area, the expenditure ratio range goes from 19% to 46% with a range of number of patients range from 13% to 29%. Relative frequency of Local Health Authority (LHA) pharmaceutical budget and of number of patients per 58 ATC specific for rare diasease per therapeutical area, residing patients – 2019 334 × 124 mm (96 × 96 DPI)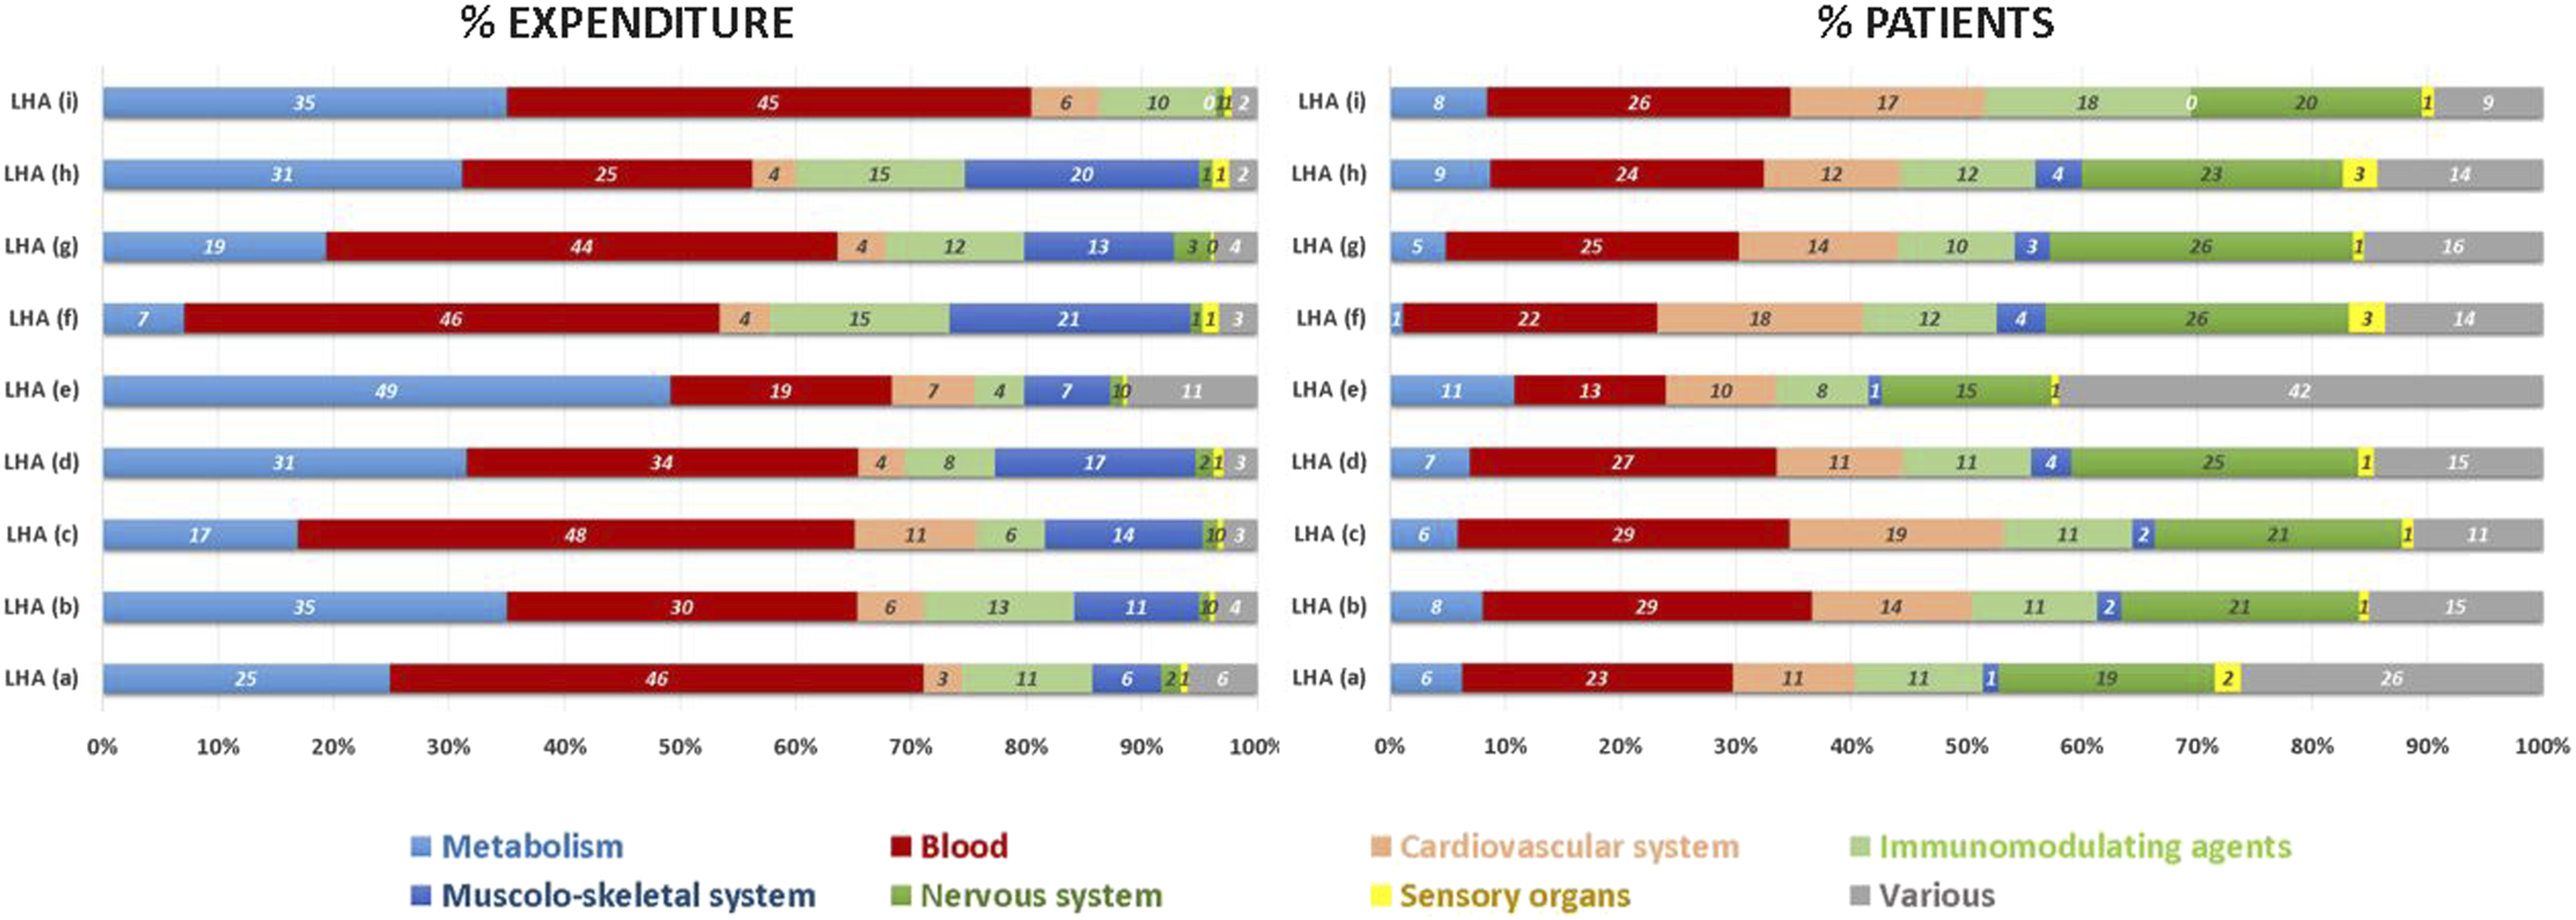
Discussion
Veneto Health System (VHS) guarantees to its residents affected by a RD the access to high cost drugs specific for RD, whether orphan drugs (OD) or not. In 2019, there have been allocated nearly EUR 100 million (6.6% of annual outpatient pharmaceutical budget) to treat 2,758 residents affected by a non-oncologic RD with drugs specific for RDs (8.9% of 31,026 residents with a RD receiving any drugs reimbursed by the VHS).
Whether ODs or not, drugs specific for RD showed off as high cost ones. In 2019 only 38% of the regional pharmaceutical budget allocated for RDs was dispensed as ODs with ongoing patents and market exclusivity. ODs with expired patents still have an impact on the budget as patients continue to use them even after the end of its period of market exclusivity. As Roberts stated in his paper, it is common experience that generic ODs are rarely produced and, however, their prices remain exceptionally high. 20
Other analyses about RD drugs’ expenditures have been performed, but often focusing only on ODs and especially on the ones with ongoing orphan designation. They usually miss other high cost drugs without orphan designation or with an expired one. Our work instead tries to give a picture of the pharmaceutical budget impact of the whole rare diseases, considering real treated patients and residing in the same Region.
ODs share of Italian pharmaceutical expenditure, for all types of ODs with ongoing orphan designation, is 6.6% according to the Italian Medicines Agency (AIFA). 12 Non-oncological ODs are estimated to explain about 40% of the total expenditure, so their share of Italian drugs’ expenditure is about 2.6% for AIFA. Our study showed a general RD drugs share of 6.6%, with a ODs share of 4.5%. If sales were only included for products which maintain their OD status, our estimate of their budget impact would be reduced to 2.5% of the total regional expenditure, in line with AIFA Report. Mestre-Ferrandiz 21 considered in his recent paper all ODs with both ongoing and expired orphan designation, and estimated a share of total pharmaceutical expenditure in eight European counties of 7.2%. Assuming that 40% of the expense was allocated to non-oncological ODs, a share of 4.3% would be dedicated to them, in line with our results (4.5%). These results are much higher than the forecasted one by Shey in 2011 estimating a 4.6% of share for all ODs in 2016.
The already-found concentration of available drugs for rare diseases in some therapeutic areas, such as metabolic and hematological diseases, is confirmed and the concerns about the presence of neglected therapeutical areas on ODs market and, in general, on drugs about RDs too. 22 In our research, metabolic and hematological diseases accounted for 62% of ATC codes available for RDs and, among them, 43% of ATC codes referring to ODs are addressed to metabolic diseases.
The drug with the highest budget was a Hematological non-orphan drug, the Coagulation factor VIII, with nearly EUR 20 million. It had a mean annual cost per patient of EUR 88,342 and was used by 225 patients. A metabolic OD for Hunter syndrome, on the other hand, Idursulfase, had a budget impact of EUR 3.8 million, with an average expenditure per patient of EUR 473,751 and eight residents treated in 2019.
The expenditure dynamics for rare diseases’ drugs are peculiar. Nusinersen, for instance, has been released in the Italian drug market at the end of 2017. 23 It was the first medication available to treat spinal muscular atrophy (SMA), a rare neuromuscular disorder affecting newborns and children often with a poor prognosis. Its release in the market has been rightly welcomed with great hope and joy by patients and parents all over the world. Its purchasing costed EUR 11.6 million to the VHS in 2019: 11.3% of the budget allocated to drugs specific for RD. That represents the so-called “blockbuster drug” due to the new marketing of a drug, usually produced for a disease without therapeutical options, generating very high sales immediately after its market release. 24
Moreover, rare diseases have often a genetic origin and patients can be differently spreaded in the territories with likely family clusters due to the presence of people affected by the same rare disease, leading to a sort of a “cluster” expenditure dynamic. The different expenditure burdens for drugs specific for RDs in the different nine Local Health Authorities in the Region, in charge of purchasing services and treatments for their residents within the VHS, may be explained by that. The average cost per person can vary from one LHA to another, with a range goes from 12–22 euros per resident, similar to the expected EUR 29.5 from AIFA Report 12 and EUR 16 by Schandler. 18
These two peculiar cost dynamics should be taken in mind when programming pharmaceutical budget allocation and expenditure monitoring. Considering metabolic drugs, for instance, just a single new treated patient can increase significantly the annual local pharmaceutical expenditure. Health administrations are usually monitored for their ability to be strict to narrow pharmaceutical budgets and often assessed through a “capping” method, without exceptions for RD drugs or patients’ clusters. New reimbursement model to experiment are needed, linked to outcomes and values of the treatment.
The scientific literature and physicians have been experiencing daily, taking care of RD patients, how far we have gone in treating RD patients thank to specific drugs that have been developing in these last decades. RD patients’ quality of lives, their prognosis have been improving and improving during these years in an unexpected way, letting them to live in adult life, to study, to work, to have children and to integrate effectively in the community. These are the best outcomes we could achieve as Health Systems.
In order to progress further and expand the therapeutical options to neglected areas, to improve the available treatment and to keep our health systems sustainable, research is needed on the economic value of these treatments. It should focus not only on the single drug, but on the complex plans of care and their outcomes in term of integration of the patient in the society, of his/her achieved autonomy. Even the costs’ structure should be examined in a wider way, assessing not only the cost of the drugs per se, but the costs of the integrated care plans and, at the same time, the avoided costs, health and social ones, direct and indirect ones, of a failed integration of the patient. 25
This work is a sectorial cost-analysis and does not consider clinical and quality of life outcomes. For its characteristics has the limit of not being able to show the advantages of therapeutical options but only to verify the financial burden of existing treatments, and need to be developed and deepened with future research.
Conclusions
To the best of our knowledge, this is the first paper analyzing the real-world financial resources allocated to drugs for patients with a rare disease (RD), focusing not only on orphan drugs, but on any specific drug for patients affected by non-oncologic RDs. It tries to give a picture of the pharmaceutical budget allocated on RD drugs as a whole and its expenditure dynamics. The paper is based on real-world data and it is population-based. It conveys the expected expenditure per resident about RD drugs that is useful for health programming and resources allocation. It demonstrates how complex the spending dynamics are, pointing out specific financial effects in RD context like the “blockbuster” and “cluster” effect.
Footnotes
Acknowledgements
We thank all the professionals of the Centres of reference for rare diseases of Veneto Region (Italy) for their precious work allowing the implementation, the coverage and the quality of the Rare Disease Register of Veneto Region. We thank the Veneto Region Health Administration for funding the research.
Declaration of conflicting interests
The author(s) declared no potential conflicts of interest with respect to the research, authorship, and/or publication of this article.
Funding
The author(s) disclosed receipt of the following financial support for the research, authorship, and/or publication of this article: This study was supported by the Veneto Health Regional Administration (Italy).