
Abstract
Thermal energy conversion using non-linear pyroelectric materials present a sustainable solution for transforming waste heat into useful energy. By utilizing the temperature and electric field dependence of these materials, heat can be directly converted into electrical energy. This review explores non-linear pyroelectric energy conversion, highlighting the use of ferroelectric materials and their non-linear behaviour in thermal energy harvesting. In this work, we critically examine the materials, thermodynamic cycles for pyroelectric energy conversion, figures-of-merit for pyroelectric energy harvesting, and the influence of material geometry, aging and conversion losses. The primary objective of this review is to emphasize the importance of power generation through pyroelectric modules and re-examine the scope of macroscopic pyroelectric energy harvesters for practical applications. Concepts related to macroscopic devices such as regeneration and heat exchange conditions using thermal control elements for thermal energy harvesting are also discussed. This article aims to provide a comprehensive overview of the advancements, challenges, and future directions in the field of non-linear pyroelectric energy harvesting.
Introduction
Nearly 72% of the world's primary energy is lost as waste heat, with the majority of it being untapped low-grade waste heat (< 200°C). 1 Surprisingly, the amount of energy that is lost in the form of low-grade heat accounts for nearly 155 exajoules (43 petawatt hour), which is 63% of the waste heat. 1 A more recent study from the U.S. Department of Energy reported that in 2023, 61.5% of the total energy consumed in the United States was rejected, meaning it was not converted into any useful form of work. 2
Given the scale and potential of this underutilized energy, several thermodynamic cycles have been developed to convert low-grade heat into electricity with varying degrees of efficiency and complexity. The Stirling cycle, a closed regenerative cycle using an external heat source, is well-suited for low-temperature differentials and offers high theoretical efficiency, though it is limited by practical challenges in heat exchange and mechanical losses. 3 The Kalina cycle utilizes a mixture of water and ammonia as the working fluid, enabling improved thermal matching with low-grade heat sources and thus enhancing efficiency over conventional Rankine cycles in certain temperature ranges. 4 The Organic Rankine Cycle (ORC) employs organic fluids with low boiling points, making it particularly effective for heat sources below 200 °C; its modularity and relatively mature technology have led to wide adoption in waste heat recovery and renewable energy applications. 5
However, these systems require an intermediate step that converts heat into mechanical energy before it can be transformed into electricity, often involving complex machinery, moving parts, and fluid management. Solid-state heat engines present an economic and sustainable solution to convert waste heat (especially low-grade heat) directly into electricity. This opens new market opportunities for waste heat recovery, which is projected to reach a value of 26 billion euros by 2025. 6 Thermoelectric generators are the predominant solid-state energy converters commercially available, transforming temperature gradients into electrical energy using the Seebeck effect. 7 The main challenge of thermoelectric energy harvesting is to impose and maintain a large thermal spatial gradient, requiring large heat flows due to the high thermal conductivity of these materials. 8 To achieve high conversion efficiency, the thermoelectric material must possess a high figure of merit (ZT) and optimal heat exchange conditions.9,10
On the other hand, solid-state pyroelectric energy conversion (PEC) is a less explored field for thermal energy conversion. However, it offers the potential to achieve higher conversion efficiencies than thermoelectric energy harvesting within a limited temperature range, as thermoelectric modules are constrained by surface heat exchange conditions due to their high thermal conductivity, which impedes the maintenance of the temperature gradient. 8 Pyroelectric energy harvesters utilize the pyroelectric effect 11 that occurs in all polar dielectric materials (or pyroelectric materials - 10 out of the 32 crystal classes) to convert periodic temperature variations directly into electrical energy. This can be achieved through various thermodynamic cycles. This technology offers niche application targets where it is difficult to establish a temperature gradient such as in micro-electronic devices. 12 Moreover, it is possible to transform a temperature gradient into a temperature variation in time, 12 indicating the potential of pyroelectric energy harvesters also for macroscopic device applications. This review addresses the challenges in optimizing materials and devices for pyroelectric energy harvesting using thermodynamic cycles and builds upon insights from existing reviews on pyroelectric materials and devices for energy harvesting.13–19 We will start with a historical perspective and notably the pure capacitive energy harvesting view that was prevailing at the time.
Historical perspective
The exploration of ferroelectric materials for thermal energy conversion dates back to the 1960s.20–27 Frood 20 termed this as the “thermodielectric” effect and also emphasized the importance of utilizing a closed thermodynamic cycle and large variations of entropy in the materials for harvesting energy. Although he concluded that the barium titanate samples available at the time were too leaky, he predicted that future materials exhibiting large variations of dielectric constant with temperature could compete against steam engines in terms of efficiency.
In 1963, Hoh provided a general explanation of a harvesting cycle based on the variation of capacitance, which is worth mentioning here. 23 Indeed, it helps in understanding how the conversion of heat into electricity occurs in dielectric materials with large variations of dielectric constant with temperature. This approach is similar to dielectric elastomers where the capacitance variation is triggered by strain. 28 Referring to Figure 1, let us consider a capacitor whose capacitance decreases with temperature. Initially, let us charge this capacitor up to the charge Q at low temperature (as indicated by the blue arrow). The energy stored in the capacitor is given by 0.5Q²/C1, with C1 representing its capacitance at low temperature. The material is then kept at a constant charge by simply disconnecting it from any power supply. Subsequently, the temperature is increased (as shown by the gradient horizontal arrow). During this step, although the charge remains constant, the capacitance decreases to C2. As a result, the initial voltage V1 = Q/C1 now reaches V2 = Q/C2 (as depicted in Figure 1), and the electric energy increases to 0.5Q²/C2, since C2 < C1. This stage represents the active phase, where heat is converted into electricity by the material. Finally, if we discharge the capacitor at high temperature (as indicated by the third arrow in red in Figure 1), the net harvested energy is calculated as 0.5Q²(C1-C2)/C1C2 (depicted by the orange area in Figure 1). In certain materials, the final energy density can be 30 times larger than the initial one. 29
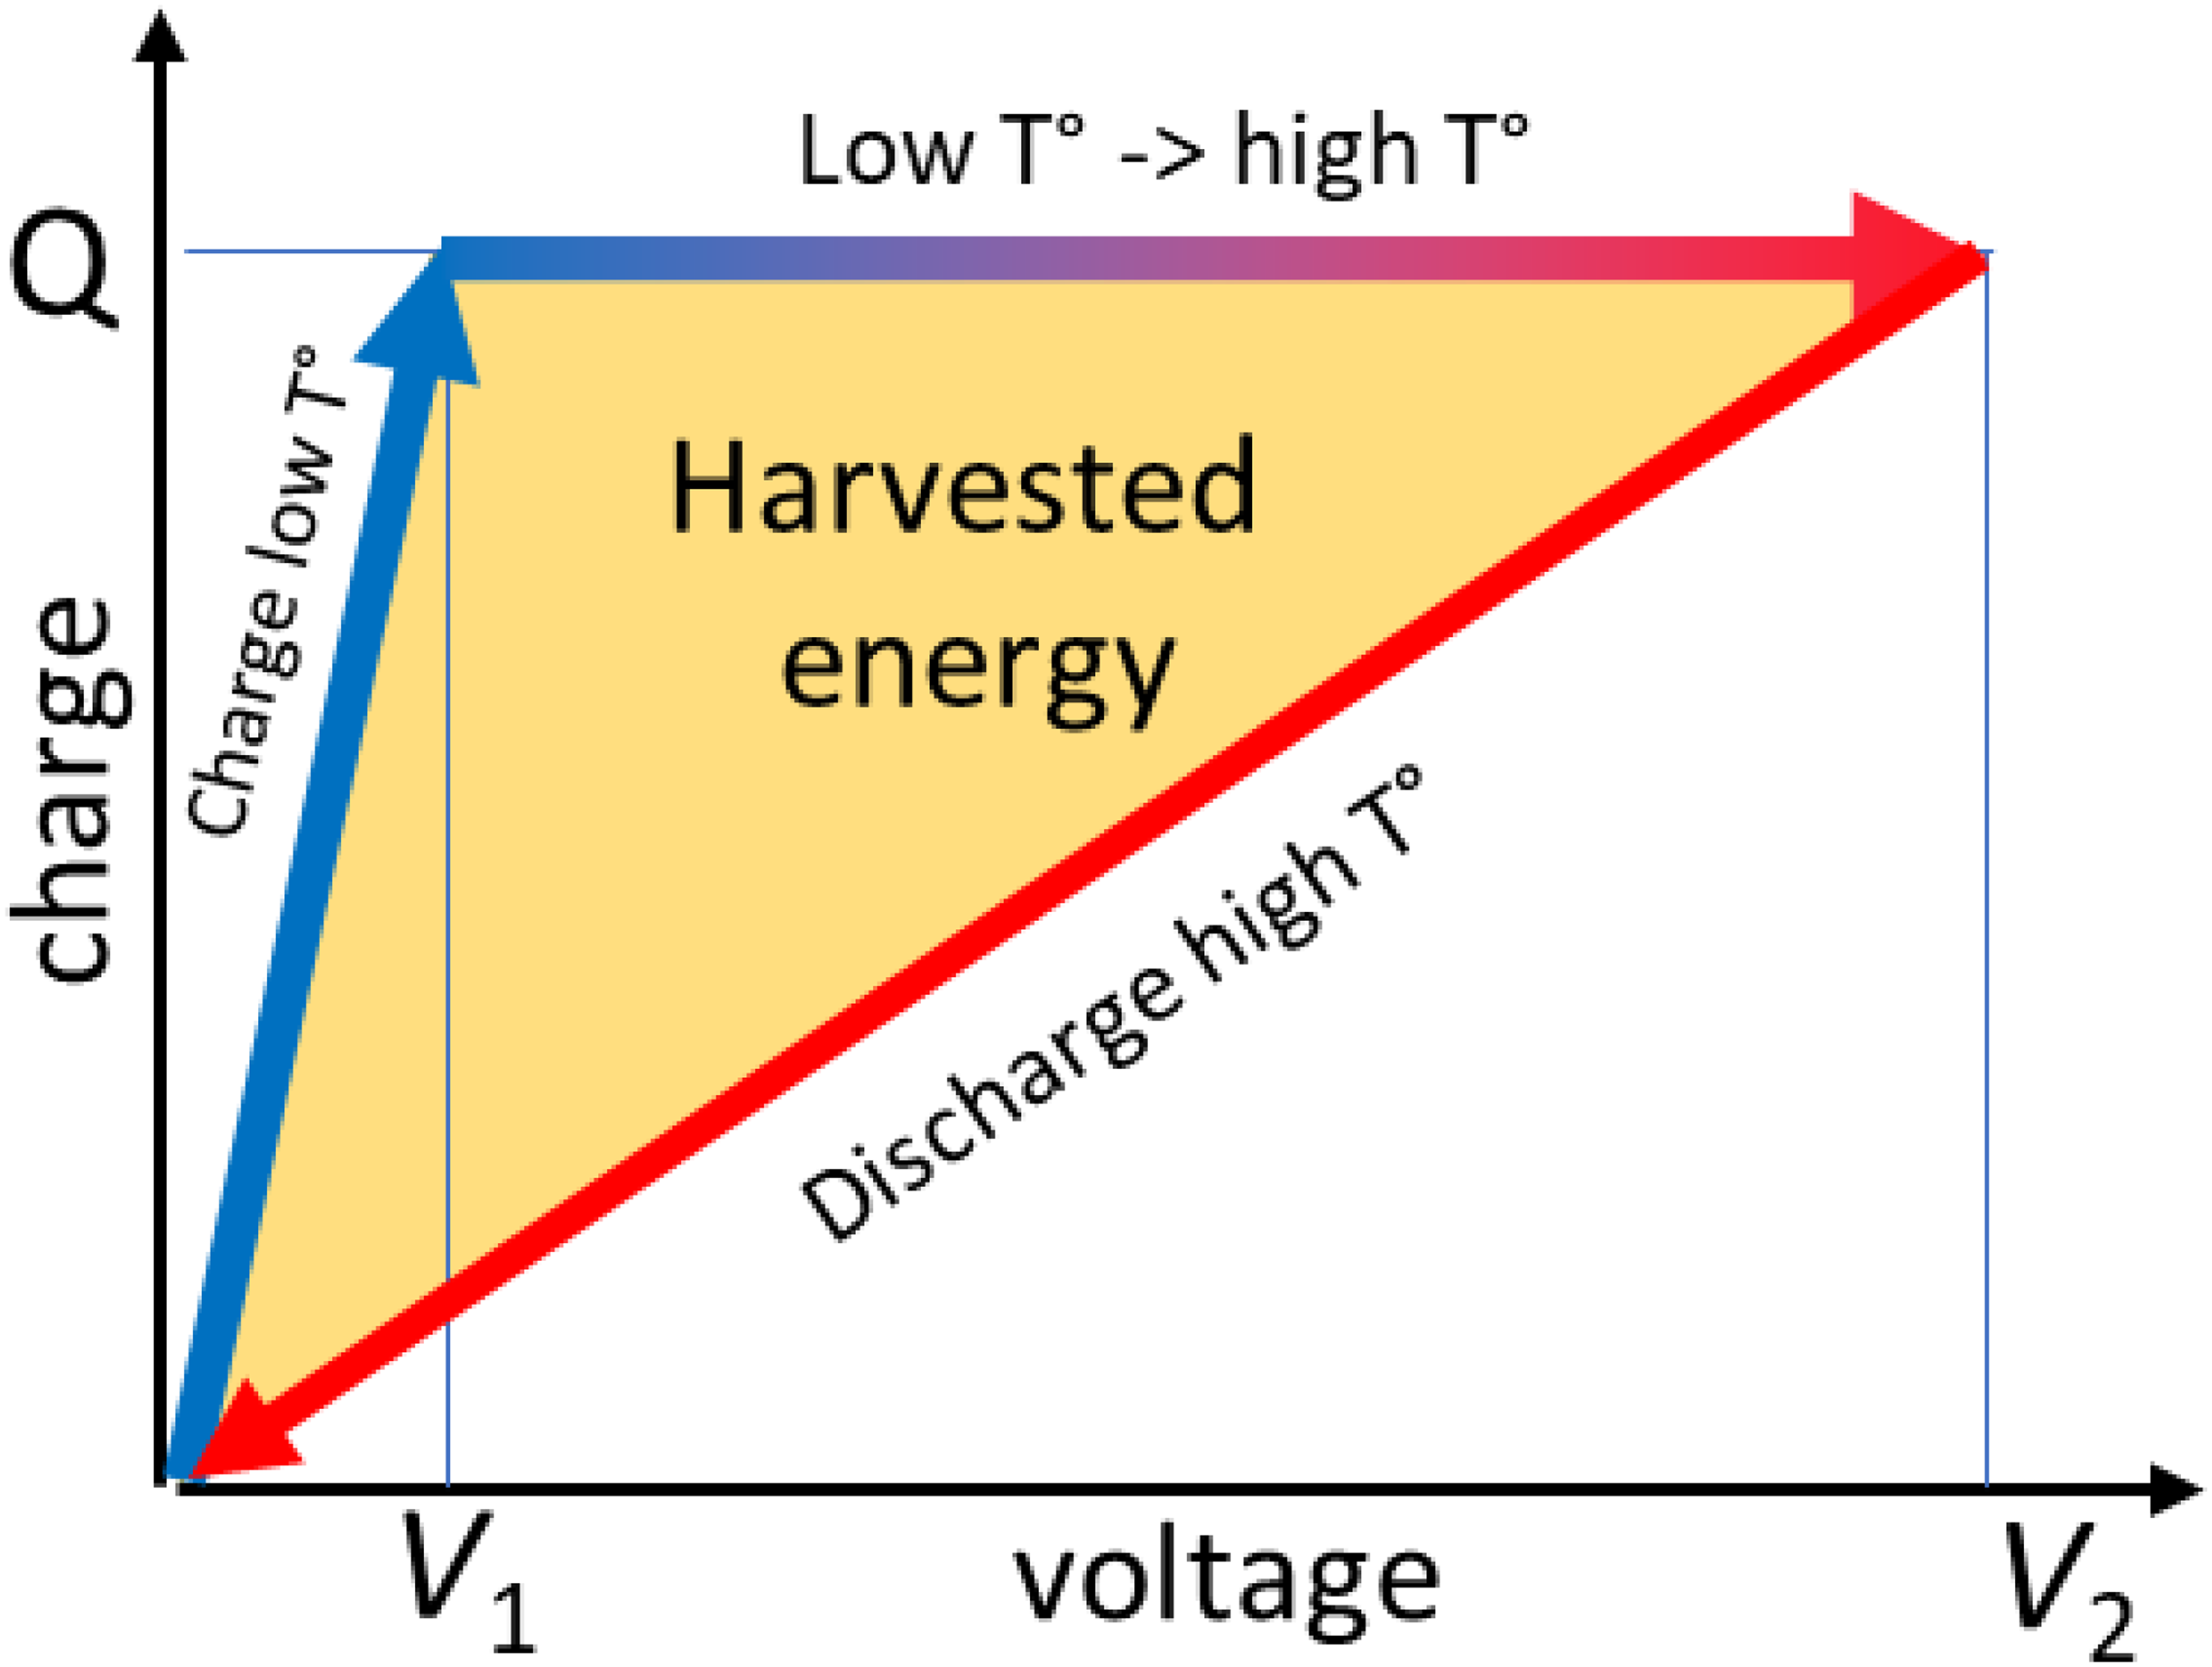
Energy harvesting cycle, converting heat in electricity with materials experiencing a strong decrease of dielectric constant with temperature.
Note that this variation of dielectric constant ε with temperature was initially considered as the driving parameter for thermodielectric energy harvesting.21,22 However, Hoh 23 later observed that the large variations of ε with applied electric field prevents ε to be the driving parameter, and the sole consideration of it can be misleading. He was the first to recognize that the variation of polarization P with temperature is the correct parameter to contemplate, as we will see in this review.
Pyroelectricity
Pyroelectric materials possess a unique polar axis and a spontaneous non-zero polarization (Ps) within a given temperature range in the absence of an applied electric field.30,31 In general, Ps is temperature dependent, so that a change in temperature results in a flow of charges to or from the material's surface, depending on the magnitude of the temperature change. If electrodes are applied to material surfaces such that the Ps vector has a component perpendicular to them, then the change in Ps can be used to generate a current in an external circuit connected to the electrodes. The pyroelectric vector p at zero applied field has a magnitude that is given by the change in polarization ∂Ps with respect to the change in temperature ∂T.
32
We can also adopt an engineering perspective to describe the pyroelectric effect. By simply subjecting a pyroelectric material to temperature variations, it is possible to convert thermal energy into electrical work. In short circuit condition, the resulting change in temperature leads to a pyroelectric short-circuit current (ip), which is as follows:
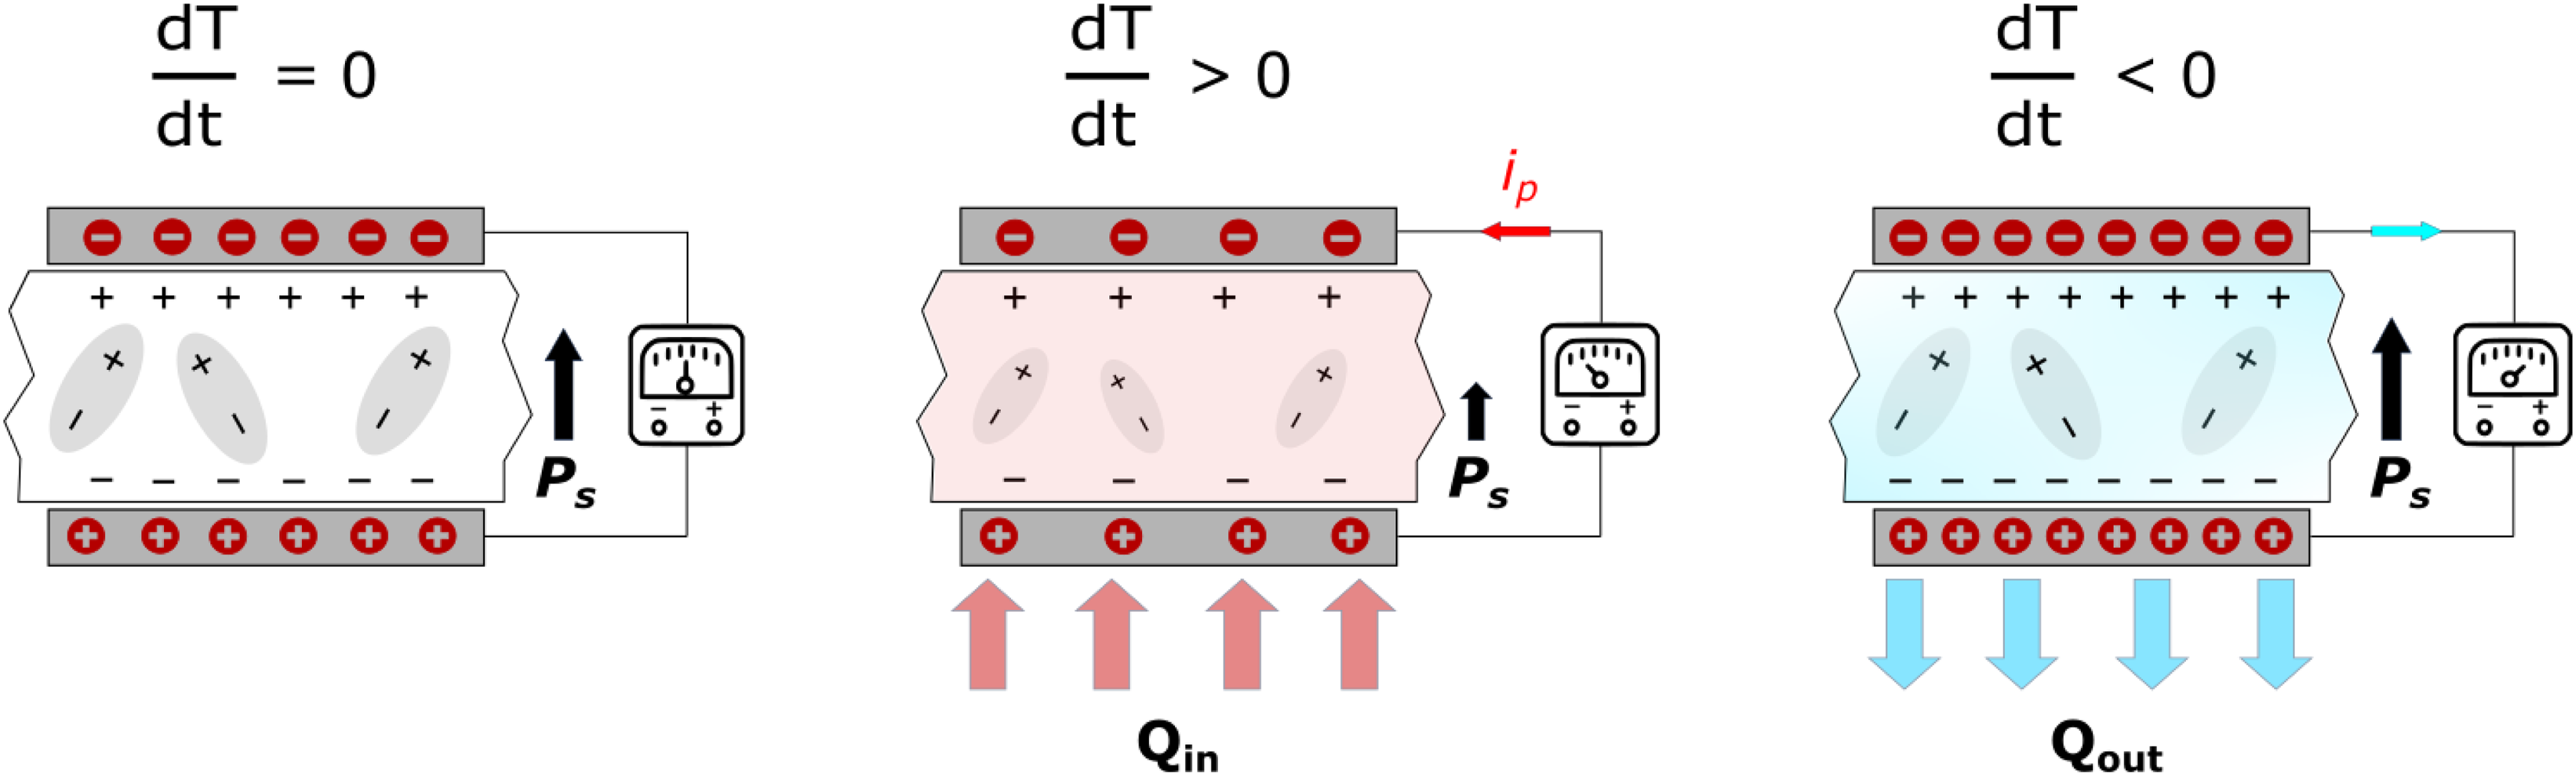
Schematic of linear pyroelectric energy conversion when the pyroelectric material is subjected to temperature fluctuations without a bias field. Figure reconstructed from. 31
In general, ferroelectric materials37–39 exhibit a larger pyroelectric response compared to non-ferroelectric pyroelectric materials, such as zinc oxide, 40 because Ps is very large and drastically reduces as the temperature increases, approaching zero at the transition between the polar ferroelectric and non-polar paraelectric phases at the Curie temperature TC as illustrated in Figure 3. Therefore, the discussion that follows in this review will be limited to the use of ferroelectrics for thermal energy harvesting.
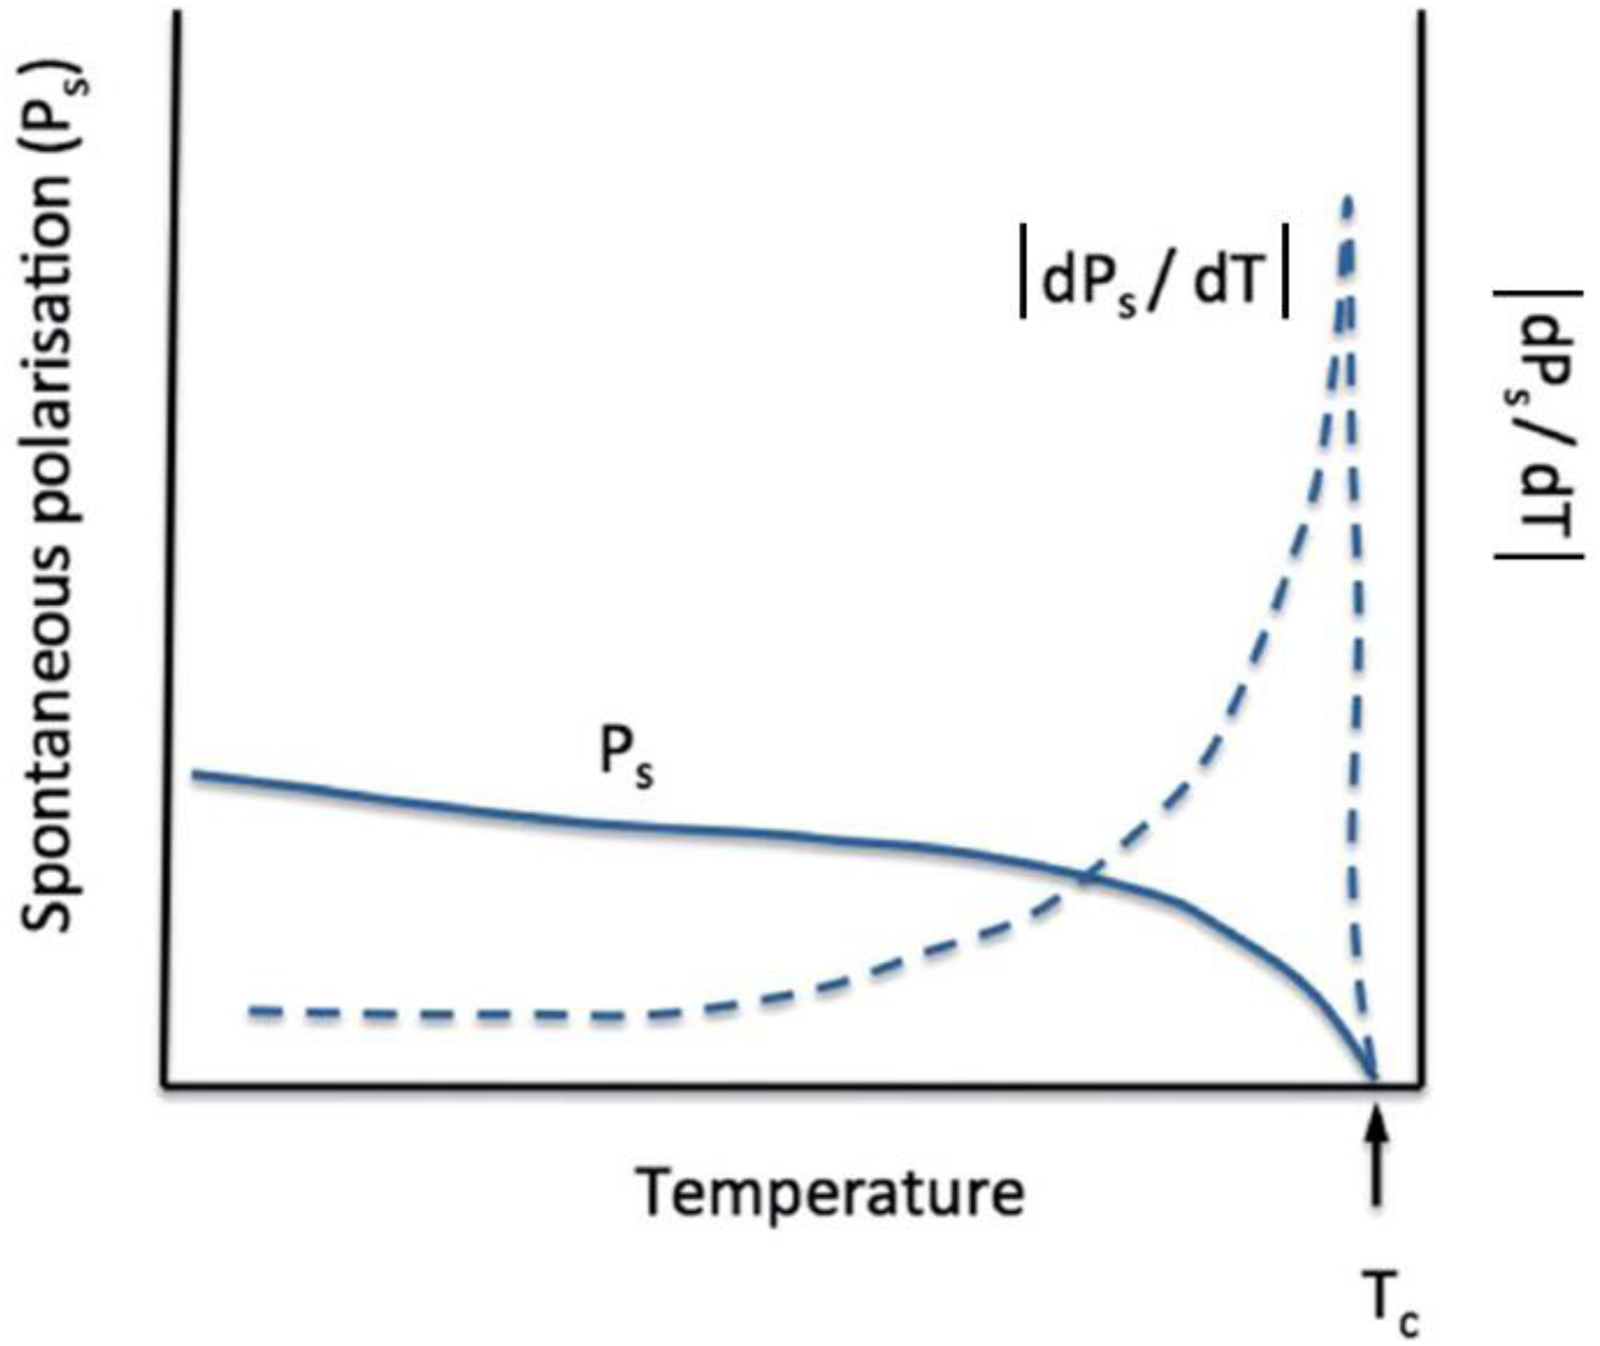
Illustration showing the temperature dependence of the spontaneous polarization and the absolute value of the zero-field pyroelectric coefficient of a ferroelectric dPs/dT, adapted from. 13
Moreover, pyroelectric energy conversion using non-linear ferroelectrics yields a much higher electrical output by taking advantage of the large variation in polarization induced by the changes in temperature and electric field near their phase transition temperature.41,42 By utilizing electric fields and the temperature dependence of polarization in ferroelectric materials, it is possible to realize closed electro-thermodynamic cycles converting heat into electricity. 43 It has been experimentally demonstrated that the electrical energy output could reach several orders of magnitude larger than linear pyroelectric energy harvesting.14,44 Let us now provide a few details about ferroelectric materials and the importance of the large variation in polarization with respect to temperature.
Ferroelectrics, antiferroelectrics and relaxors
Ferroelectrics stand for a very important class of electroactive materials, because the best dielectric, piezoelectric and pyroelectric materials belong to this class.45,46 Their polar axis (and the remanent polarization) remains stable without the presence of an external electric field. Also, the direction of their polar axis can be reversed by applying an external electric field. The variations of polarization with respect to temperature – which defines the amplitude of the pyroelectric vector - can be very large, especially close to phase transitions as seen in Figure 3. In this typical example, the ferroelectric material becomes paraelectric (no more polar axis) at a transition temperature Tc. We therefore already anticipate that this strong non-linearity of polarization will be a key asset of pyroelectric energy harvesting.
Ferroelectric materials are identified via their polarization P versus electric field E curves that are named PE loops. These exhibit a clear hysteretic behaviour that stems from the change of orientation of the polar axis - and therefore the macroscopic polarization - when the electric field successively increases and decreases, as sketched in Figure 4. The PE loops change when the temperature varies, because the polarization is sensitive to the temperature. Typically, the polarization decreases with the temperature, and the coercive field - the field at which the polarization cancels out - decreases as well. In Figure 4, two PE loops are sketched at low (blue) and high (red) temperature. Note that whilst the temperature increases, the material remains here in the ferroelectric phase and no phase transition is triggered. As will be explained in the following section, the orange area on this PE loop represents an Olsen cycle, which stands for the maximum electric energy that can be generated by non-linear pyroelectric harvesting between these two temperatures (low and high). Indeed, electric energy is by definition
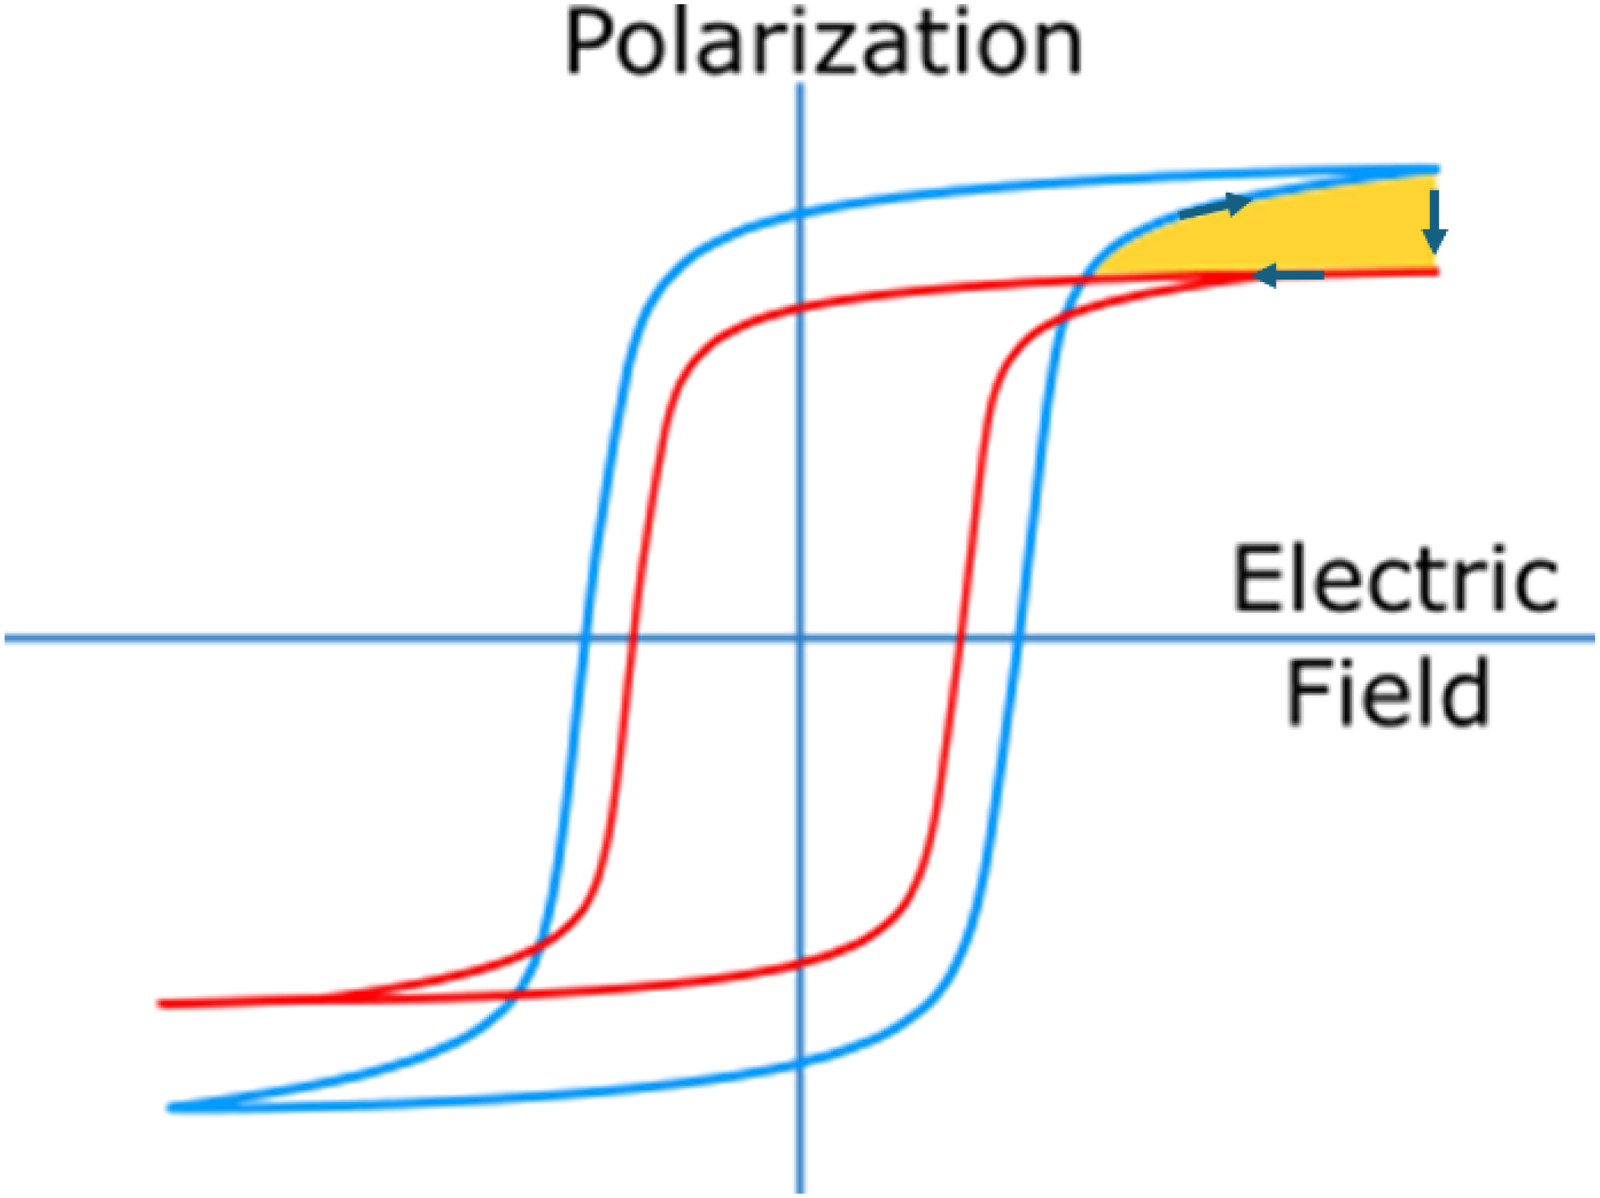
Typical polarization versus electric field loops (PE loops) of a ferroelectric material at low (blue) and high (red) temperature. The orange area corresponds to the energy that can harvested by running a thermodynamic pyroelectric cycle (Olsen), by following the arrows.
Among the different phases close to the pure ferroelectric one, there are some nuances that can be disclosed here in Figure 5. In panel a), the pyroelectric material is in paraelectric (PE) phase (no hysteresis because no polar axis and therefore no remanent polarization). The polarization is generally lower than in the ferroelectric phase, but the orange area can be substantial because there is no hysteresis, and the polarization decreases with the temperature. In panel b), we present an antiferroelectric material, characterized by a double hysteresis loop. 47 The amount of energy that can be harvested is rather large because the initial polarization is large and its variation with temperature is also substantial. In panel c), we present a relaxor material. Such materials are close to ferroelectrics, though their structure is generally a mix of a non-polar phase and polar nano regions (PNR) which size and mobility vary with the temperature. 48 Their PE loops look like the ones of very slim ferroelectrics, with very small hysteresis. Such materials can also be interesting for pyroelectric energy harvesting, because their polarization is large and varies with the temperature. Finally, panel d) shows the influence of a phase transition between the ferroelectric phase (low temperature) and the paraelectric phase (high temperature). This configuration is generally the one that has the largest potential to harvest energy because this is the one that provides the largest variation of polarization, as expressed by the size of the orange area. Later, we will discover that such transitions can be triggered by applying voltage, which enables enlarging substantially the amount of energy that can harvested.
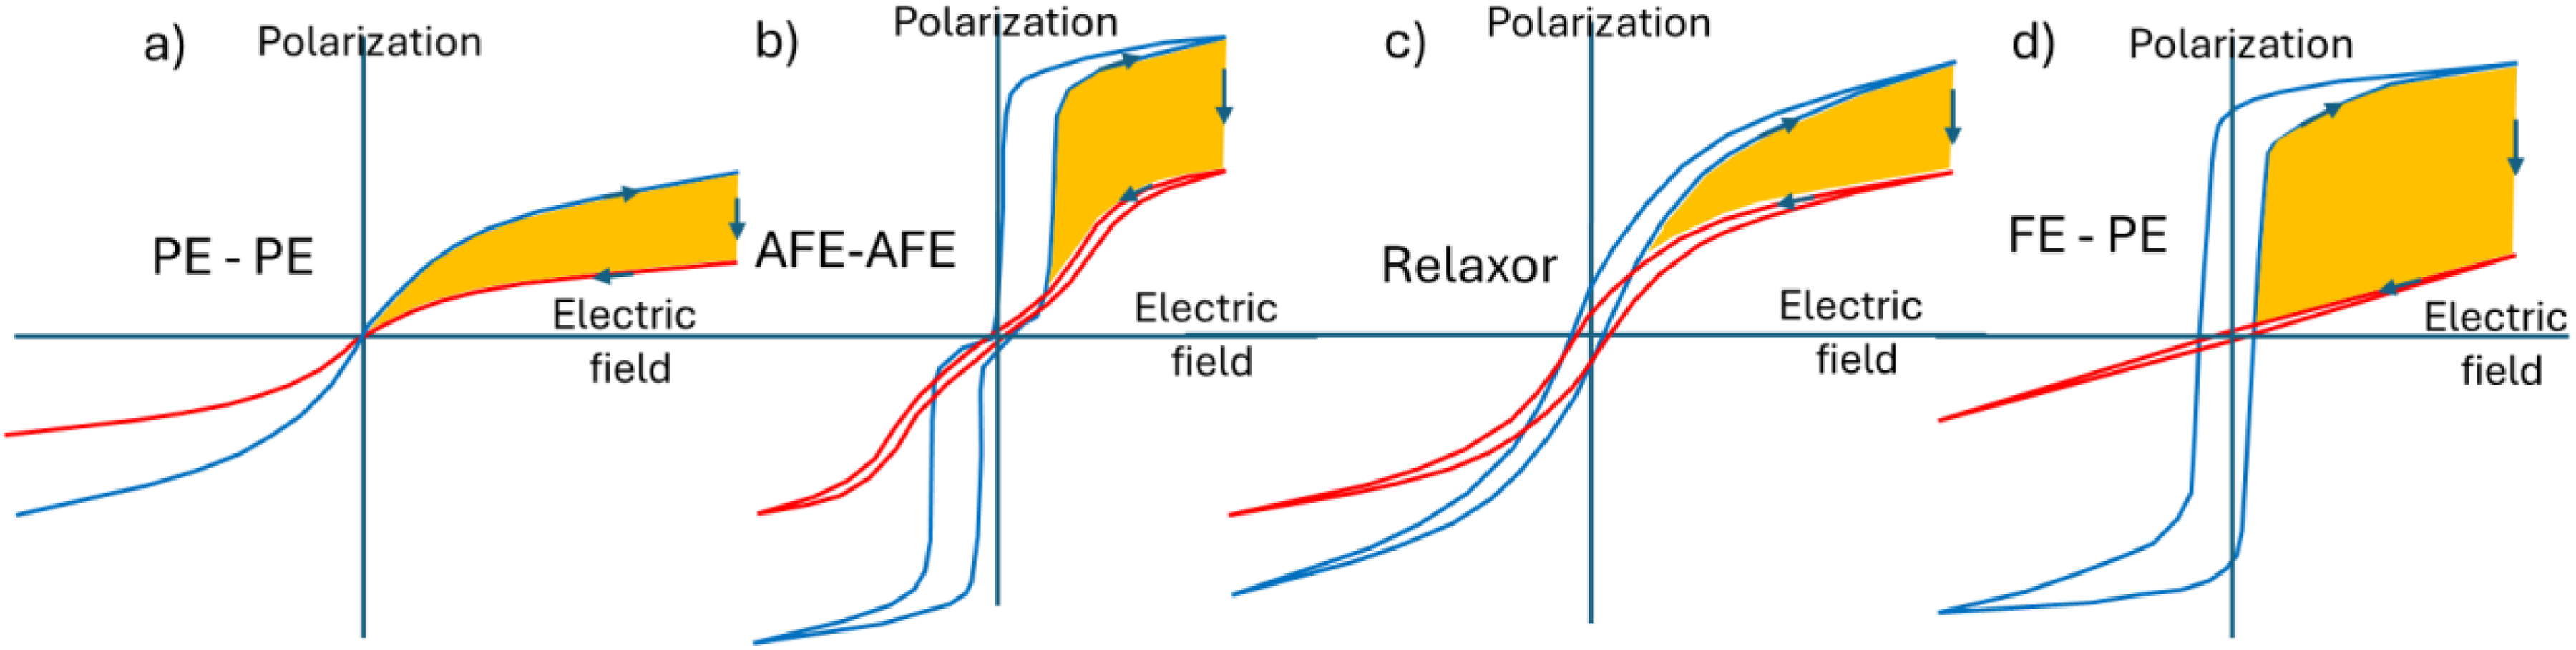
PE loops of materials in different phases, at low (blue) and high (red) temperatures, a) paraelectric and low and high temperatures, b) antiferroelectric at low and high temperature, c) relaxor at low and high temperature and d) ferroelectric and paraelectric (phase transition) at respectively low and high temperature. The orange area represents the energy that can be harvested in a pyroelectric Olsen cycle, by following the arrows.
Electro-thermodynamic cycles for pyroelectric energy conversion
Let us now review the different thermodynamic cycles that can be used in pyroelectric energy harvesting. All these cycles couple heat and electricity and are adapted to pyroelectric materials. However, their names come from standard thermodynamic cycles that were initially thought to couple heat and mechanical energy. Therefore, we can draw an analogy between the variables that are considered here with respect to the ones in use in standard cycles. Hence, voltage is similar to pressure whereas electric charges are similar to volume.
These coupled materials can be described thermodynamically. If we limit the analysis to thermal and electrical terms, the simplest total differential of the internal energy of a dielectric is

Carnot cycle
The electrical analogue of Carnot cycle was first proposed by Frood
20
using the D vs E relation in a dielectric. The Carnot cycle consists of two adiabatic (2 → 3 and 4 → 1) and two isothermal steps (1 → 2 and 3 → 4) as shown in Figure 6(a). From point 1 to 2, field, E is increased while the material is in contact with the heat sink at constant temperature (T1). At point 2, the material is thermally isolated, and E is further increased, resulting in the adiabatic increase of temperature to T2 due to electrocaloric effect (point 3). The material is placed in contact with the heat source at T2. E is then reduced very slowly to enable isothermal heat exchange with the hot source. It corresponds to the warm isotherm step between points 3 and 4. Finally, E is reduced by isolating the material from the sources, leading to the adiabatic cooling of the material to arrive at the initial point.
14
The efficiency η of a cycle is defined as the ratio of the electric work W that can be generated in one cycle over the heat Q required to cycle it. The Carnot cycle described in the S(T) graph of the first panel of Figure 6(a) is a perfect rectangle. Therefore,
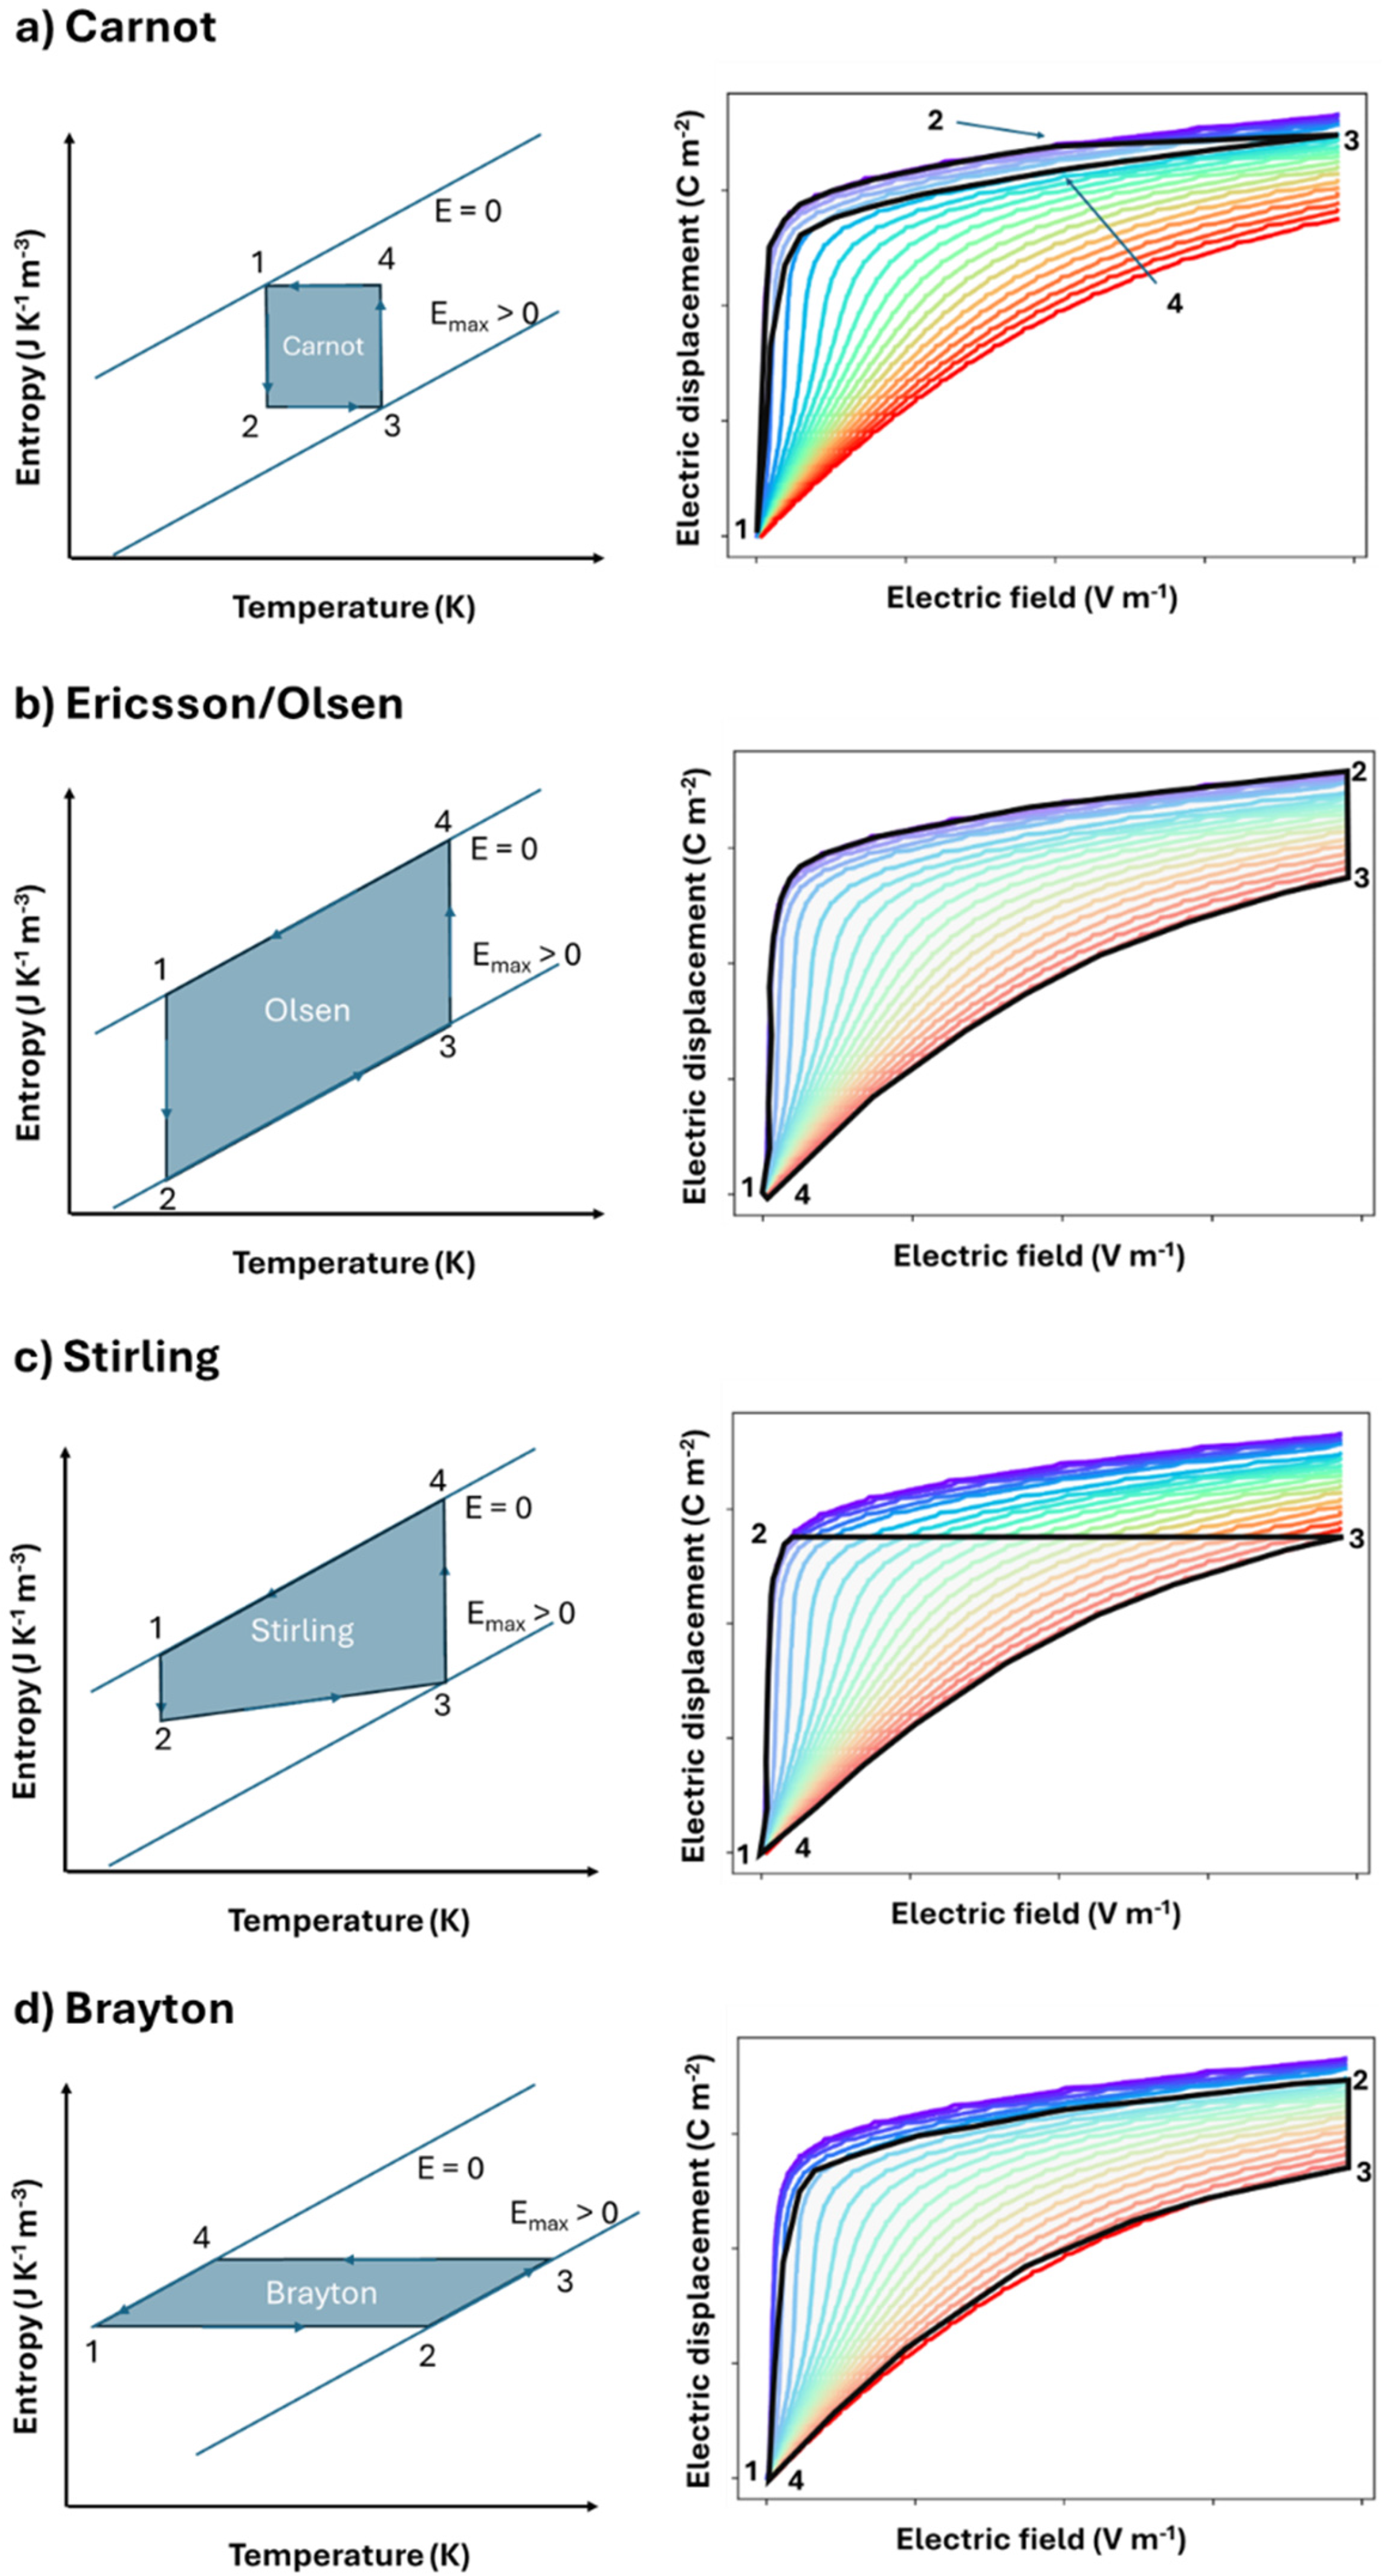
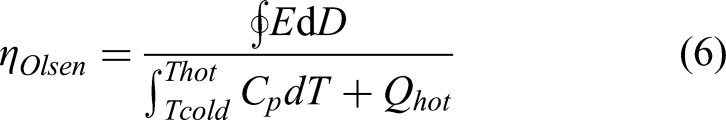
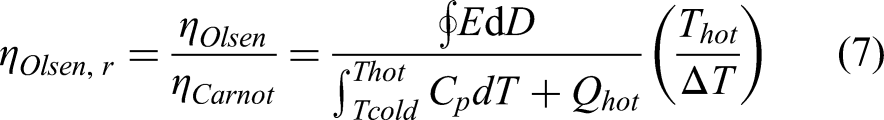
Schematic representing the entropy vs temperature pathways (left) and the electric displacement vs electric field (right) for (a) Carnot (b) Ericsson / Olsen (c) Stirling (d) Brayton cycles for pyroelectric energy conversion. In the displacement vs field graphs, the colours represent isothermal curves (blue = cold, red = hot). The semi-transparent blueish area represents the respective cycles. In the entropy vs temperature graphs, the two inclined lines stands for isofield (at zero field and non-zero field). The electric displacement versus electric field figures are experimental data corresponding to lead scandium tantalate multilayer capacitors. 29
With this definition, the Carnot cycle is the most efficient one, optimizing the area of W with respect to Q (Figure 6(a)). In this cycle, the heat taken from the hot source only occurs at the temperature of the hot source and is not used to heat up the material from the cold source. The temperature change between the two sources is provided adiabatically by the electrocaloric effect 49 of the pyroelectric material. This is the only cycle enabling such a rectangular shape in the S(T) diagram.
However, there are two significant limitations to utilizing this cycle. First, the temperature difference between the hot and cold sources must be defined as a fraction of the maximum adiabatic electrocaloric effect of the pyroelectric material. This effect is limited to a few degrees 50 which therefore strongly restrains the eventual size of the cycle. Second, the heat exchange in the two isothermal legs of the cycle must be perfectly isothermal, which by definition takes an infinite amount of time. Consequently, since the goal of such energy converters is to generate as much electric power as possible, a compromise over efficiency must be made, leading to the development of other cycles. However, cycles that are nearly ideal can be achieved through the use of regenerators that store and recycle the heat as it is moved around the cycle. This significantly increases the overall efficiency of large converters, as described later.
The right-hand side of the Figure 6(a) is an example of the typical shape of such a Carnot cycle in a DE diagram. Note that the coloured curves are isothermal DE loops of a typical ferroelectric material.
Olsen (electrical Ericsson) cycle
The Ericsson or Olsen cycle consists of two isothermal (1 → 2 and 3 → 4) and two isoelectric steps (2 → 3 and 4 → 1) as shown in Figure 6(b). The ferroelectric is charged at isothermal conditions at temperature T1 (1 → 2) followed by isoelectric heating (2 → 3) to a temperature T3 (T3 > T1). At T3, the material is discharged isothermally (3 → 4). Finally, the material is cooled under isoelectric condition to arrive at the starting point (4 → 1). Olsen 51 pioneered this important implementation and included heat regeneration in a pyroelectric converter, as will be discussed in the subsequent chapters. This is one of the highest-efficiency cycles demonstrated to date.
The main challenge with Olsen cycle is maintaining the isothermal conditions during the charging and discharging steps. The electrical energy density (Nd) or harvested energy is the closed cycle area (shown in Figure 6(b)) which is given by
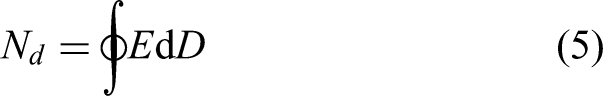
The power output is simply given by:
The scaled or relative efficiency is used to quantify the performance of the engine with respect to the Carnot efficiency. It can be written as:
Stirling cycle
A Stirling cycle (Figure 6(c)) consists of two isothermal (1 → 2 and 3 → 4) and two iso- displacement (2 → 3 and 4 → 1) steps. The first demonstration of Stirling cycle was performed by Childress.
22
In the Stirling cycle, the material is first charged isothermally at temperature T1 (1 → 2). The charged capacitor is heated under open circuit condition to maintain the charge constant, meaning iso-displacement condition (2 → 3). After reaching the temperature T3, the capacitor is isothermally discharged followed by cooling under open-circuit condition. The most challenging aspect of the Stirling cycle is the significant voltage amplification during the constant charge heating and the subsequent discharge step, which could be beyond the materials breakdown strength. Nonetheless, it has been reported that by optimizing the temperature window and field, Stirling cycles could be implemented in a practical device as the input energy is also low compared to Olsen cycle.
29
The formula for estimating the materials efficiency is the same as that mentioned for Olsen cycle. Hence
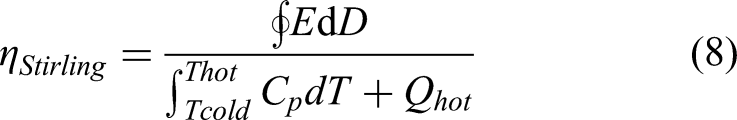
It has been reported that Stirling cycles will be able to achieve ideal regeneration (same amount of heat lost and gained in the two iso-field steps) compared to Ericsson cycle for refrigeration, as the specific heat capacity is only a function of temperature in the iso-displacement process. In the case of Olsen cycle, the specific heat capacity is a function of both T and E, resulting in inequal heat transferred into and out of the regenerator during the cycle. Hence, it was proposed that the Stirling cycle could attain ideal regeneration conditions due to the reduced regenerative losses. 52
Brayton cycle
The Brayton cycle (Figure 6(d)) consists of two adiabatic (1 → 2 and 3 → 4) and two isoelectric (2 → 3 and 4 → 1) processes. Initially, the material is subjected to adiabatic charging at temperature T1 (1 → 2) followed by isoelectric heating (2 → 3) to a temperature T3 (T3 > T2 >T1). At T3, the material is discharged adiabatically (3 → 4) followed by isoelectric cooling to complete the cycle.
During the adiabatic charging step, the temperature of the material increases from T1 to T2 due to the electrocaloric effect (assuming a positive effect). To further increase the temperature of the material from T2 to T3, which corresponds to the isoelectric heating step, heat must be added externally (
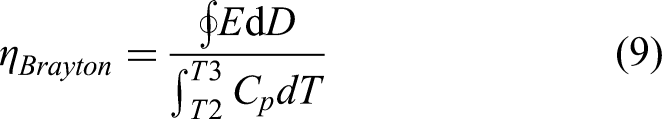
As for the Olsen cycles, we define the Brayton's scaled or relative efficiency as:
Hanrahan et al. 53 compared the performance of the Brayton and Olsen cycles at different operating frequencies in pyroelectric thin films by taking advantage of their low thermal mass to implement a faster thermal cycling. Their findings concluded that, at higher frequencies, the Brayton cycle outperforms the Olsen cycle in power output, attributing this to the rate limiting isothermal charging step in the Olsen cycle.
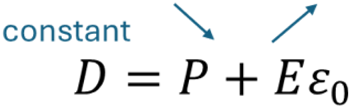
About polarization and dielectric displacement
It is now important to make a comment on the difference between polarization P and electric displacement D. In ferroelectrics, it is generally admitted that P and D are very similar in value. We therefore consider that

However, in the case of thermodynamic pyroelectric energy harvesting, we have to distinguish between P and D.
For instance, in the case of a Stirling cycle, the pyroelectric capacitor works at constant D while being heated. This means that the charge density (D) must remain constant during heating. P varies during heating - generally decreases - as seen in Figure 2. To keep equation (10) true, the electric field E must increase because P decreases while D is held constant:
 .
.
This is why electric field and therefore voltage increases in Stirling cycles when temperature increases. This is this mechanism that transforms heat in electric energy.
It is interesting to estimate the order of magnitude of the variation of polarization ΔP in a Stirling cycle. If D is constant, we can estimate the magnitude of ΔP by considering the variation of the electric field ΔE during heating. Here we have used a typical variation of electric field encountered in the following reference,
29
based on one of the best non-linear pyroelectric materials, lead scandium tantalate (PST).
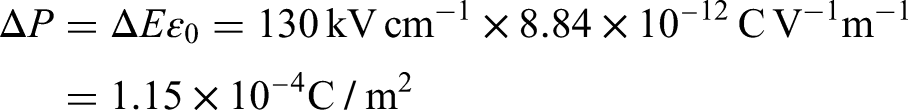
The value of D at 130 kV/cm for PST is around 0.3 C/m². We can then compare the relative variation of polarization with respect to the value of D, which yields
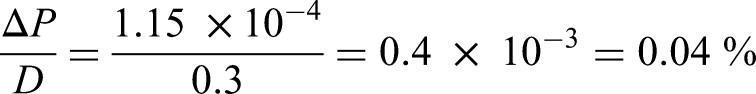
This means that the difference between P and D is only 0.04%. First, it justifies that the approximation P ∼ D is fully legitimate. And second, it shows that even a minuscule variation of polarization with respect to the charge density enables a massive variation of electric field in the pyroelectric material. Indeed, a multiplication of the initial voltage by a factor of more than 30 is possible in Stirling cycles. 29
Let us now examine the Olsen cycle using the same equation (10). The pyroelectric capacitor operates at constant electric field during heating. Since we know that P decreases with temperature, D must also decrease to keep equation (10) correct, as represented below: 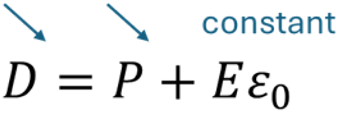
Hence, in an Olsen cycle, a negative current is observed while heating, as a consequence of D decreasing to keep E constant. This corresponds to harvesting electric energy. This extra step in an Olsen cycle compared with a Stirling cycle explains why the former enables harvesting more energy than the latter. But it is generally more difficult to use because maintaining E constant is more complex than constant D in pyroelectric materials. Indeed, changing the temperature modifies polarization, which in turn generates current. Thus, maintaining constant voltage (or field) requires controlling this current.
Role of phase transition in electrothermal energy conversion
We already saw in the PE loops representations in Figure 4(d) that phase transition between e.g., ferroelectric and paraelectric phases is an excellent way to increase the conversion of heat in electricity in pyroelectric materials. We can obtain more insights by representing such pyroelectric thermodynamic cycles in an entropy-versus-temperature diagram (Figure 7), first represented by Olsen et al.54,55 and thoroughly studied by Sebald et al. in 2008. 12 It gives the opportunity to clearly see the harvestable energy (dS·dT) and the fundamental role played by phase transitions, as first reported by Sebald et al.12,44 and Guyomar et al..56,57 Such cycles start at point A, with the materials at low temperature and zero field. The material is then charged by applying a field at low temperature (B). The temperature then increases to a maximum (point C) while maintaining the field. The material is discharged at point D by removing the electric field at high temperature, and the cycle completes by cooling back to point A. The larger the area of the cycle, the greater the harvested energy.
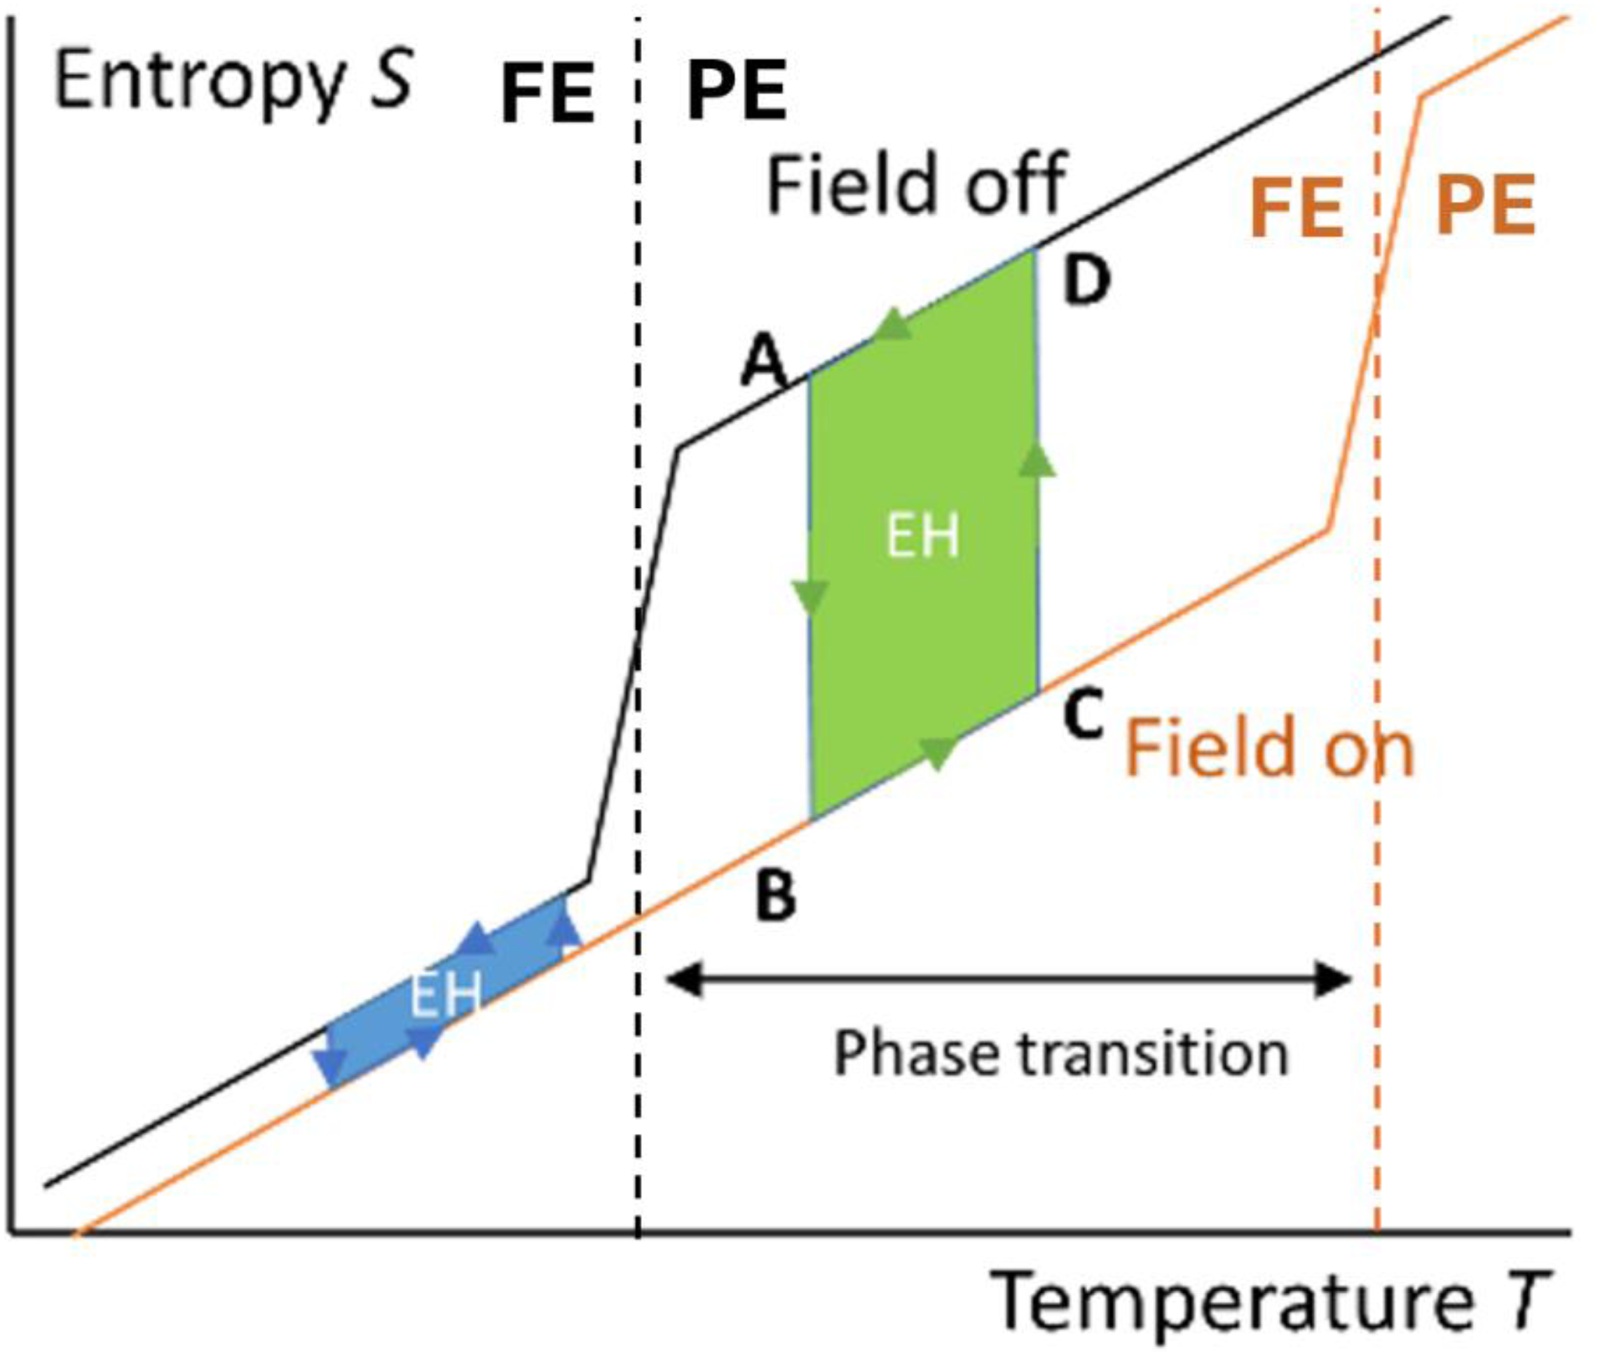
Entropy versus temperature with electric field off and on, emphasizing the role played by a well-positioned phase transition, crucially increasing the area of harvesting cycles (large green area with phase transition, small blue area without phase transition). 29 Note that the FE/PE transition temperature differs according to the field applied. FE: ferroelectric, PE: paraelectric.
As observed in Figure 7, such material experiences an abrupt increase of entropy when transiting from its low temperature structural phase (FE for ferroelectric in Figure 7) to its high temperature one (PE for paraelectric in Figure 7). Moreover, the transition temperature is shifted towards higher temperatures by the application of an external electric field. In Figure 7, the FE/PE transition at non-zero field (orange) occurs at a higher temperature than the one at zero field (black). This phase transition gives the opportunity to create thermodynamic cycles with a much larger area when positioned in the region of the phase transition (green area) rather than out of this region (blue area). To harvest energy, those cycles must be run counter-clockwise. Moreover, it is always recommended to initiate the cycles close to the Curie temperature Tc of the material or to ensure that Tc falls within temperature span of the cycle, as the largest entropy change is at Tc.
Although the maximum harvested energy is typically obtained near Tc, there are some materials such as barium titanate that undergo multiple phase transitions (FE – FE transitions), which could be of interest for energy harvesting.56,58 This is particularly relevant in cases where it is not feasible to work near the Curie temperature. While the energy harvested from these transitions will be lower than that at Tc, they still offer potential benefits in specific applications. By taking advantage of the field induced transition, we can maximize the energy output per cycle.
Working close to the phase transition in ferroelectrics means that the dielectric constant is large, which is also associated with an increase of dielectric losses, 59 as discussed later in this review. It is worth mentioning that breakdown field is an important factor because the higher the field that can be reliably applied to a material, the larger the energy that can be recovered per cycle, as can be easily deduced from Figure 7. Note that breakdown field is dependent upon materials defect density, which is generally lower for thin films than bulk materials. It also strongly depends on the materials themselves. For instance, polymers can withstand much larger fields than ceramics, as shown later in Table 1.
Performance of several non-linear pyroelectric materials when subjected to olsen cycle.
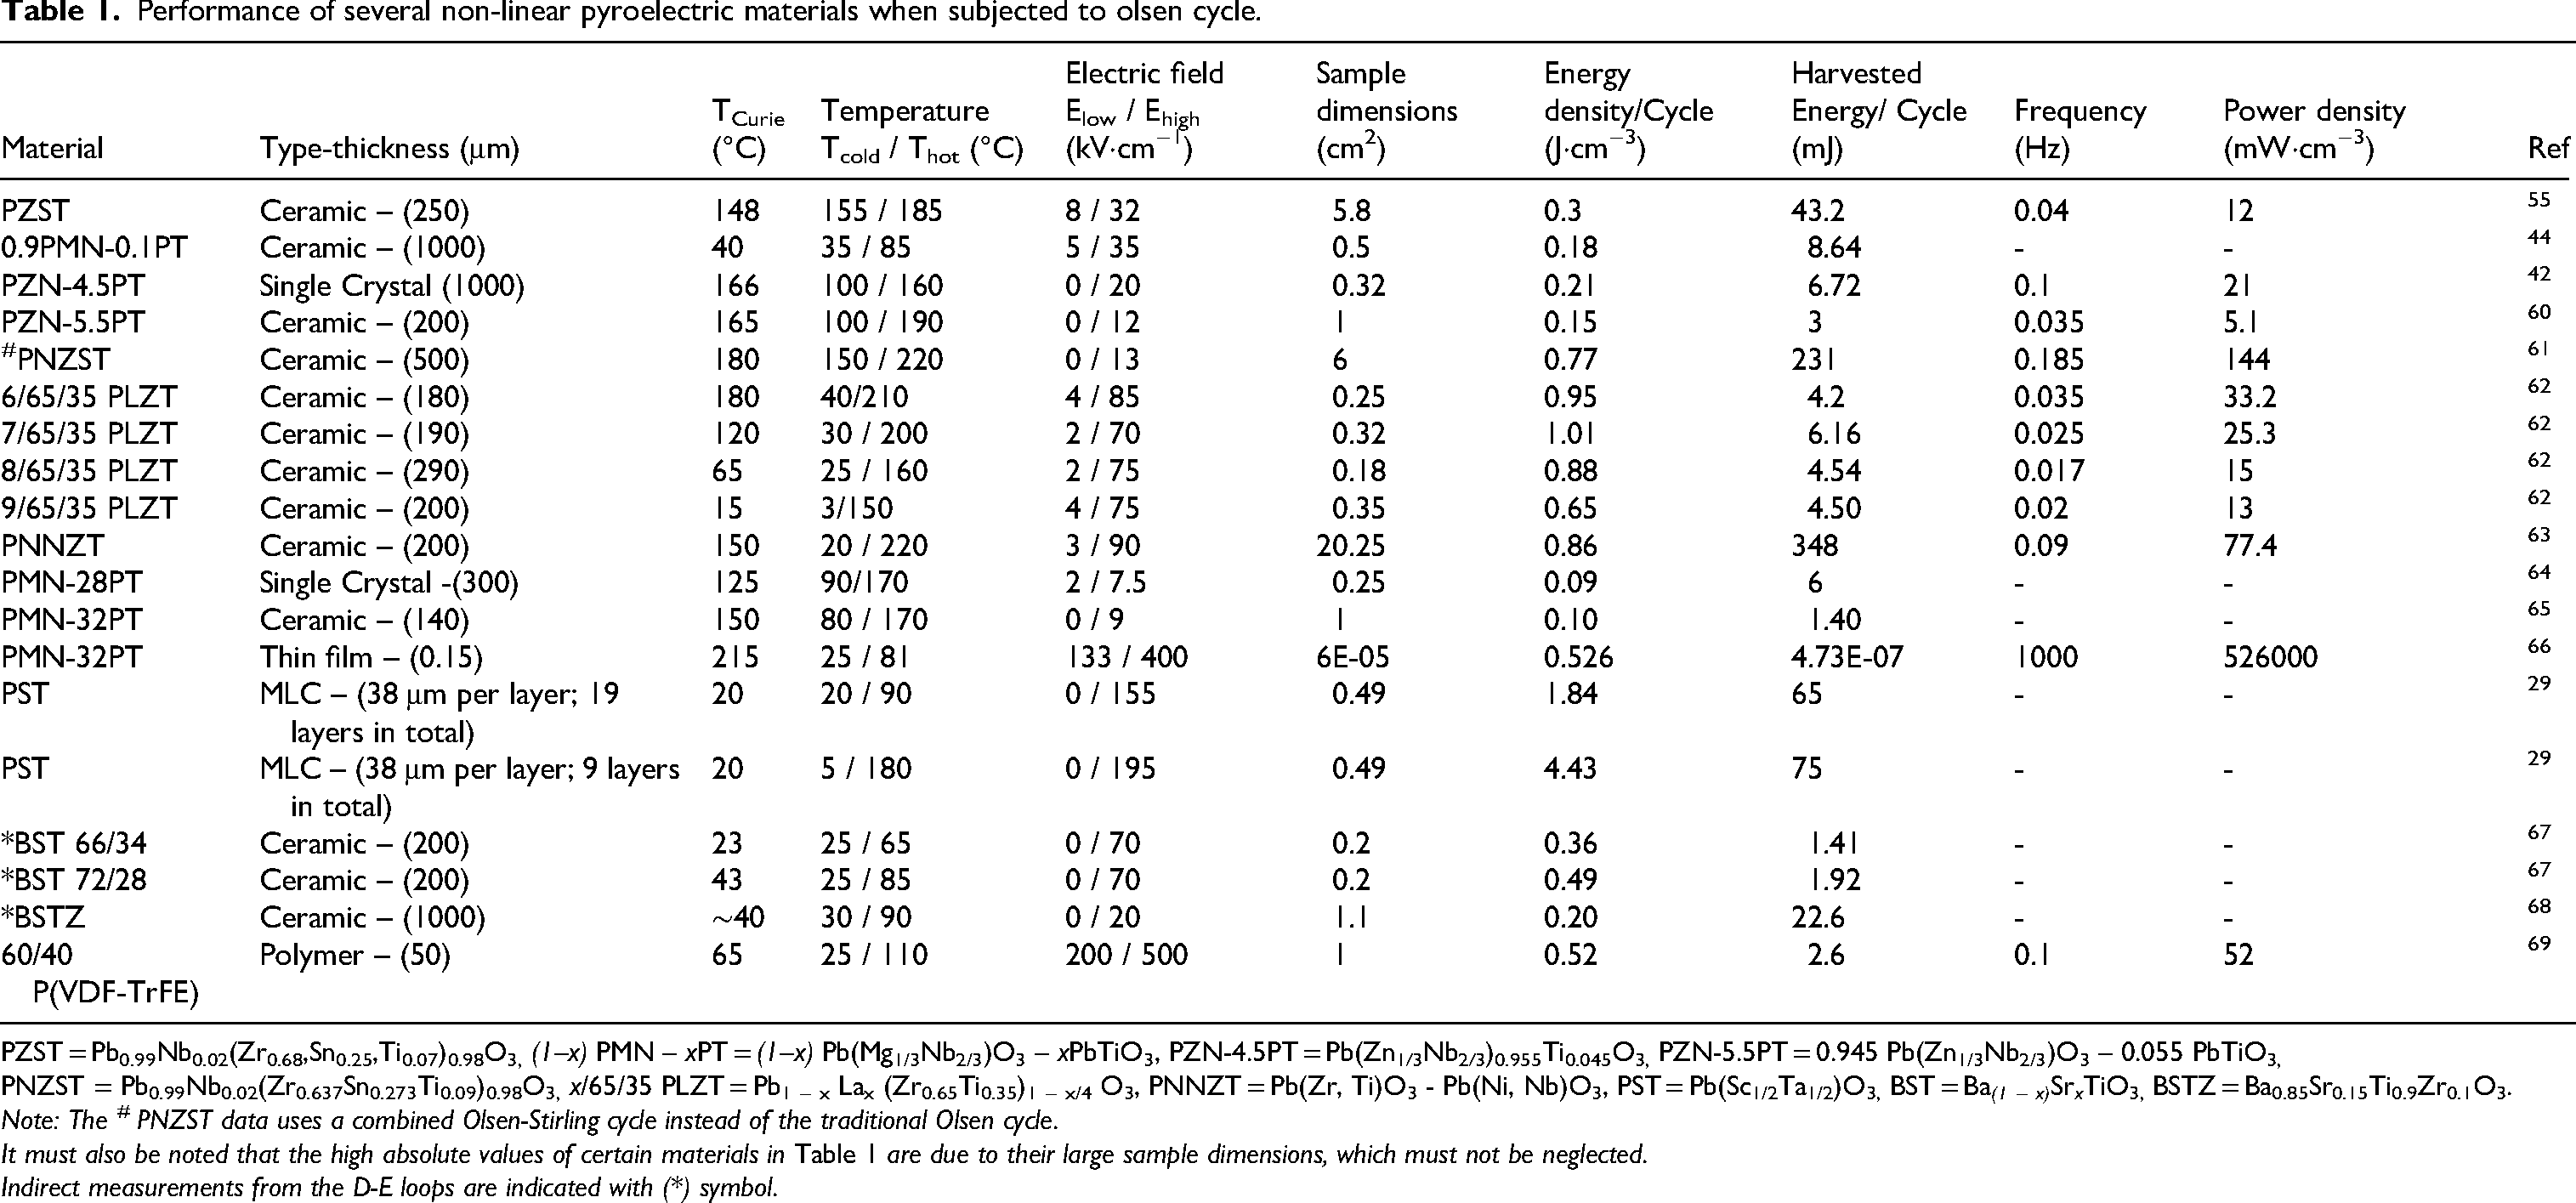
PZST = Pb0.99Nb0.02(Zr0.68,Sn0.25,Ti0.07)0.98O3, (1–x) PMN – xPT = (1–x) Pb(Mg1/3Nb2/3)O3 – xPbTiO3, PZN-4.5PT = Pb(Zn1 / 3Nb2 / 3)0.955Ti0.045O3, PZN-5.5PT = 0.945 Pb(Zn1/3Nb2/3)O3 – 0.055 PbTiO3, PNZST = Pb0.99Nb0.02(Zr0.637Sn0.273Ti0.09)0.98O3, x/65/35 PLZT = Pb1 – x Lax (Zr0.65Ti0.35)1 – x/4 O3, PNNZT = Pb(Zr, Ti)O3 - Pb(Ni, Nb)O3, PST = Pb(Sc1/2Ta1/2)O3, BST = Ba (1 – x) Sr x TiO3, BSTZ = Ba0.85Sr0.15Ti0.9Zr0.1O3.
Note: The # PNZST data uses a combined Olsen-Stirling cycle instead of the traditional Olsen cycle.
It must also be noted that the high absolute values of certain materials in Table 1 are due to their large sample dimensions, which must not be neglected.
Indirect measurements from the D-E loops are indicated with (*) symbol.
In Figure 7, the crucial point is that it is possible to displace the temperature at which the phase transition occurs by applying an external electric field. This is this displacement that enables creating this region of interest in which the size of cycles can tremendously increase. Figure 8 is an example of such a shift observed by Differential Scanning Calorimetry (DSC) at constant electric field. 70 The investigated material in this case is a ceramic of lead scandium tantalate (PST). A constant electric field is applied to the material while the temperature is first increased (heating) and then decreased (cooling). PST exhibits a strong first order phase transition that yields this characteristic peak in DSC. We clearly see a peak shift towards higher temperature when an external electric field is applied (here around 12 K between zero field and 18 kV cm−1).
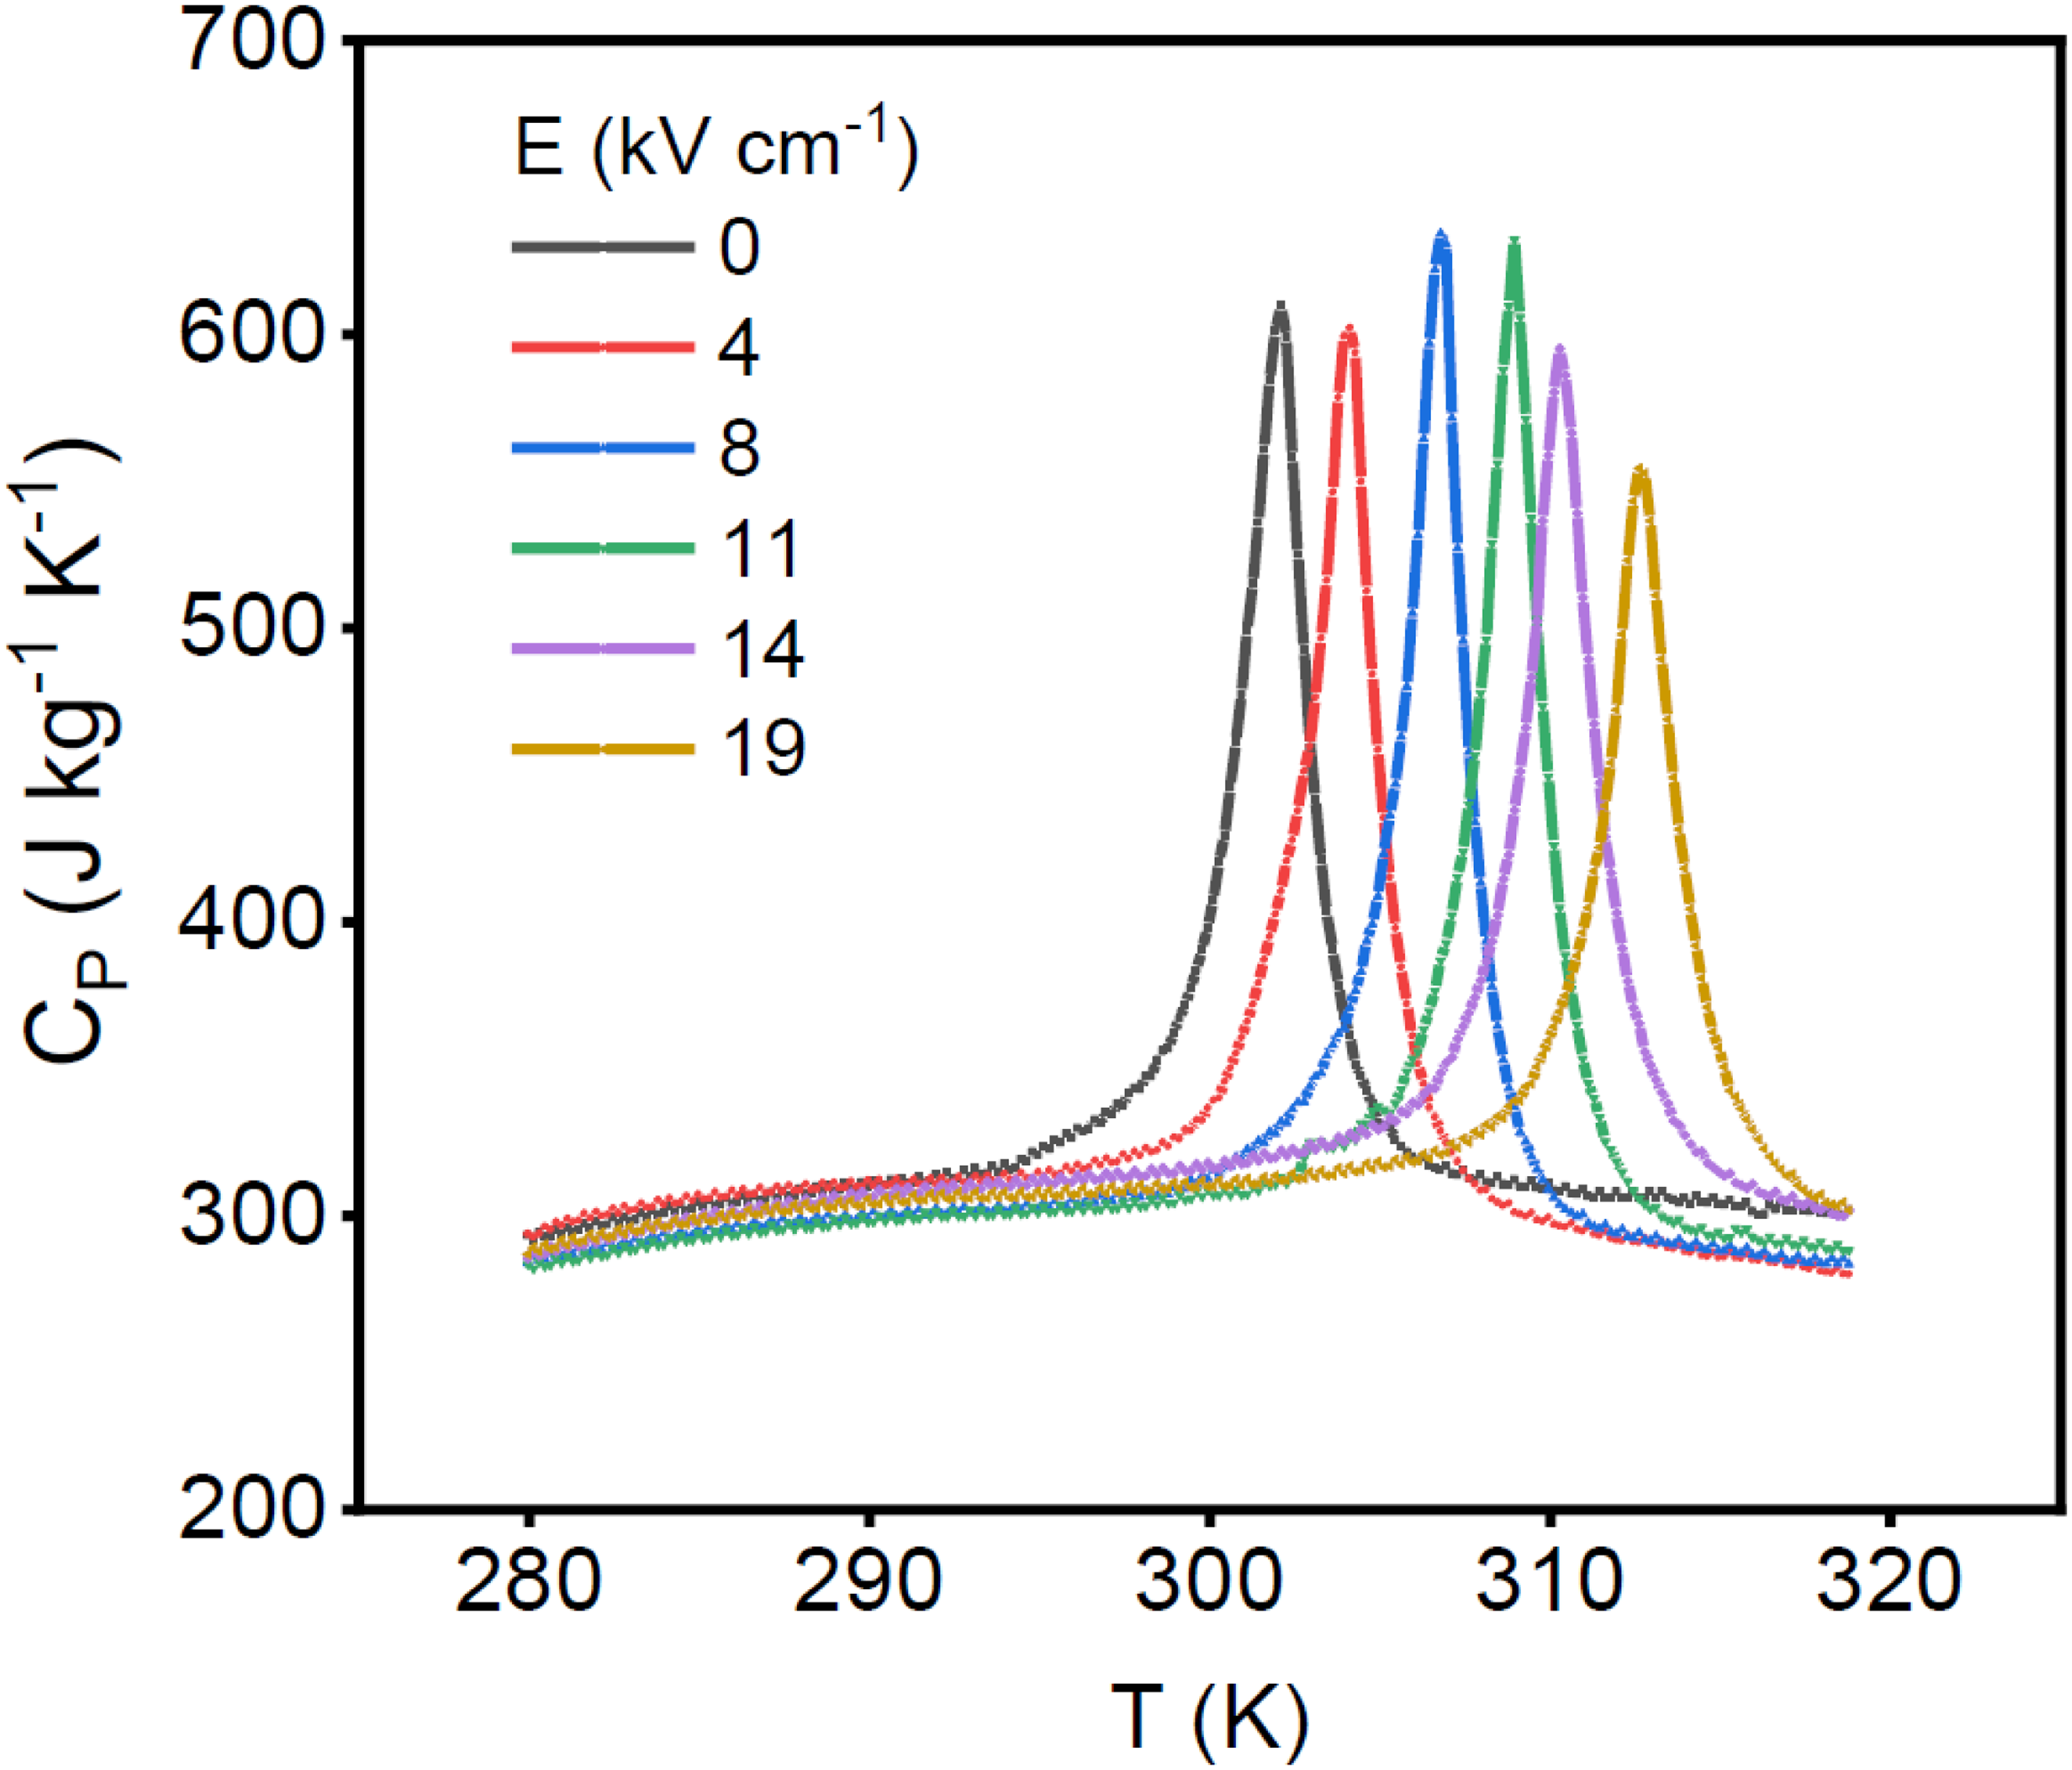
Specific heat deduced from isofield differential scanning calorimetry (DSC) measurements on PST bulk ceramic (after nouchokgwe et al. 70 ). A shift on the phase transition temperature is clearly visible.
This part on the role played by phase transitions on how much energy can be harvested per cycle emphasizes the importance of the size of the cycle. The latter is larger when the variation of the electric displacement is large, the electric field applied is large and the variation of temperature is also large. As we just saw, working close to a phase transition helps a lot. Moreover, generating power and not only energy, requires cycling fast. Therefore, non-linear pyroelectric materials must exchange their heat fast, in order to increase the cycle frequency. These comments will help defining the criteria of choice for such materials, and notably through the definition of relevant figures of merit.
Heat regeneration to increase efficiency
Beyond power generation, it is also important to consider efficiency, which can be provided by a concept called regeneration. Heat regeneration is a well-known concept for increasing efficiency in thermodynamic cycles. It has been widely used in fuel-based engines 71 and also in caloric cooling.72–75 The idea is to collect the heat produced at a certain step of the cycle and release it back during another stage of the cycle. This concept can also be applied in pyroelectric cycles and can be grasped from the S-T graph of an Olsen or a Stirling cycle. Consider the example of an Olsen cycle (two isothermal legs and two iso-field legs), as represented in Figure 9. Suppose we have a material with a positive non-linear pyroelectric effect, meaning its polarization decreases as the temperature increases.
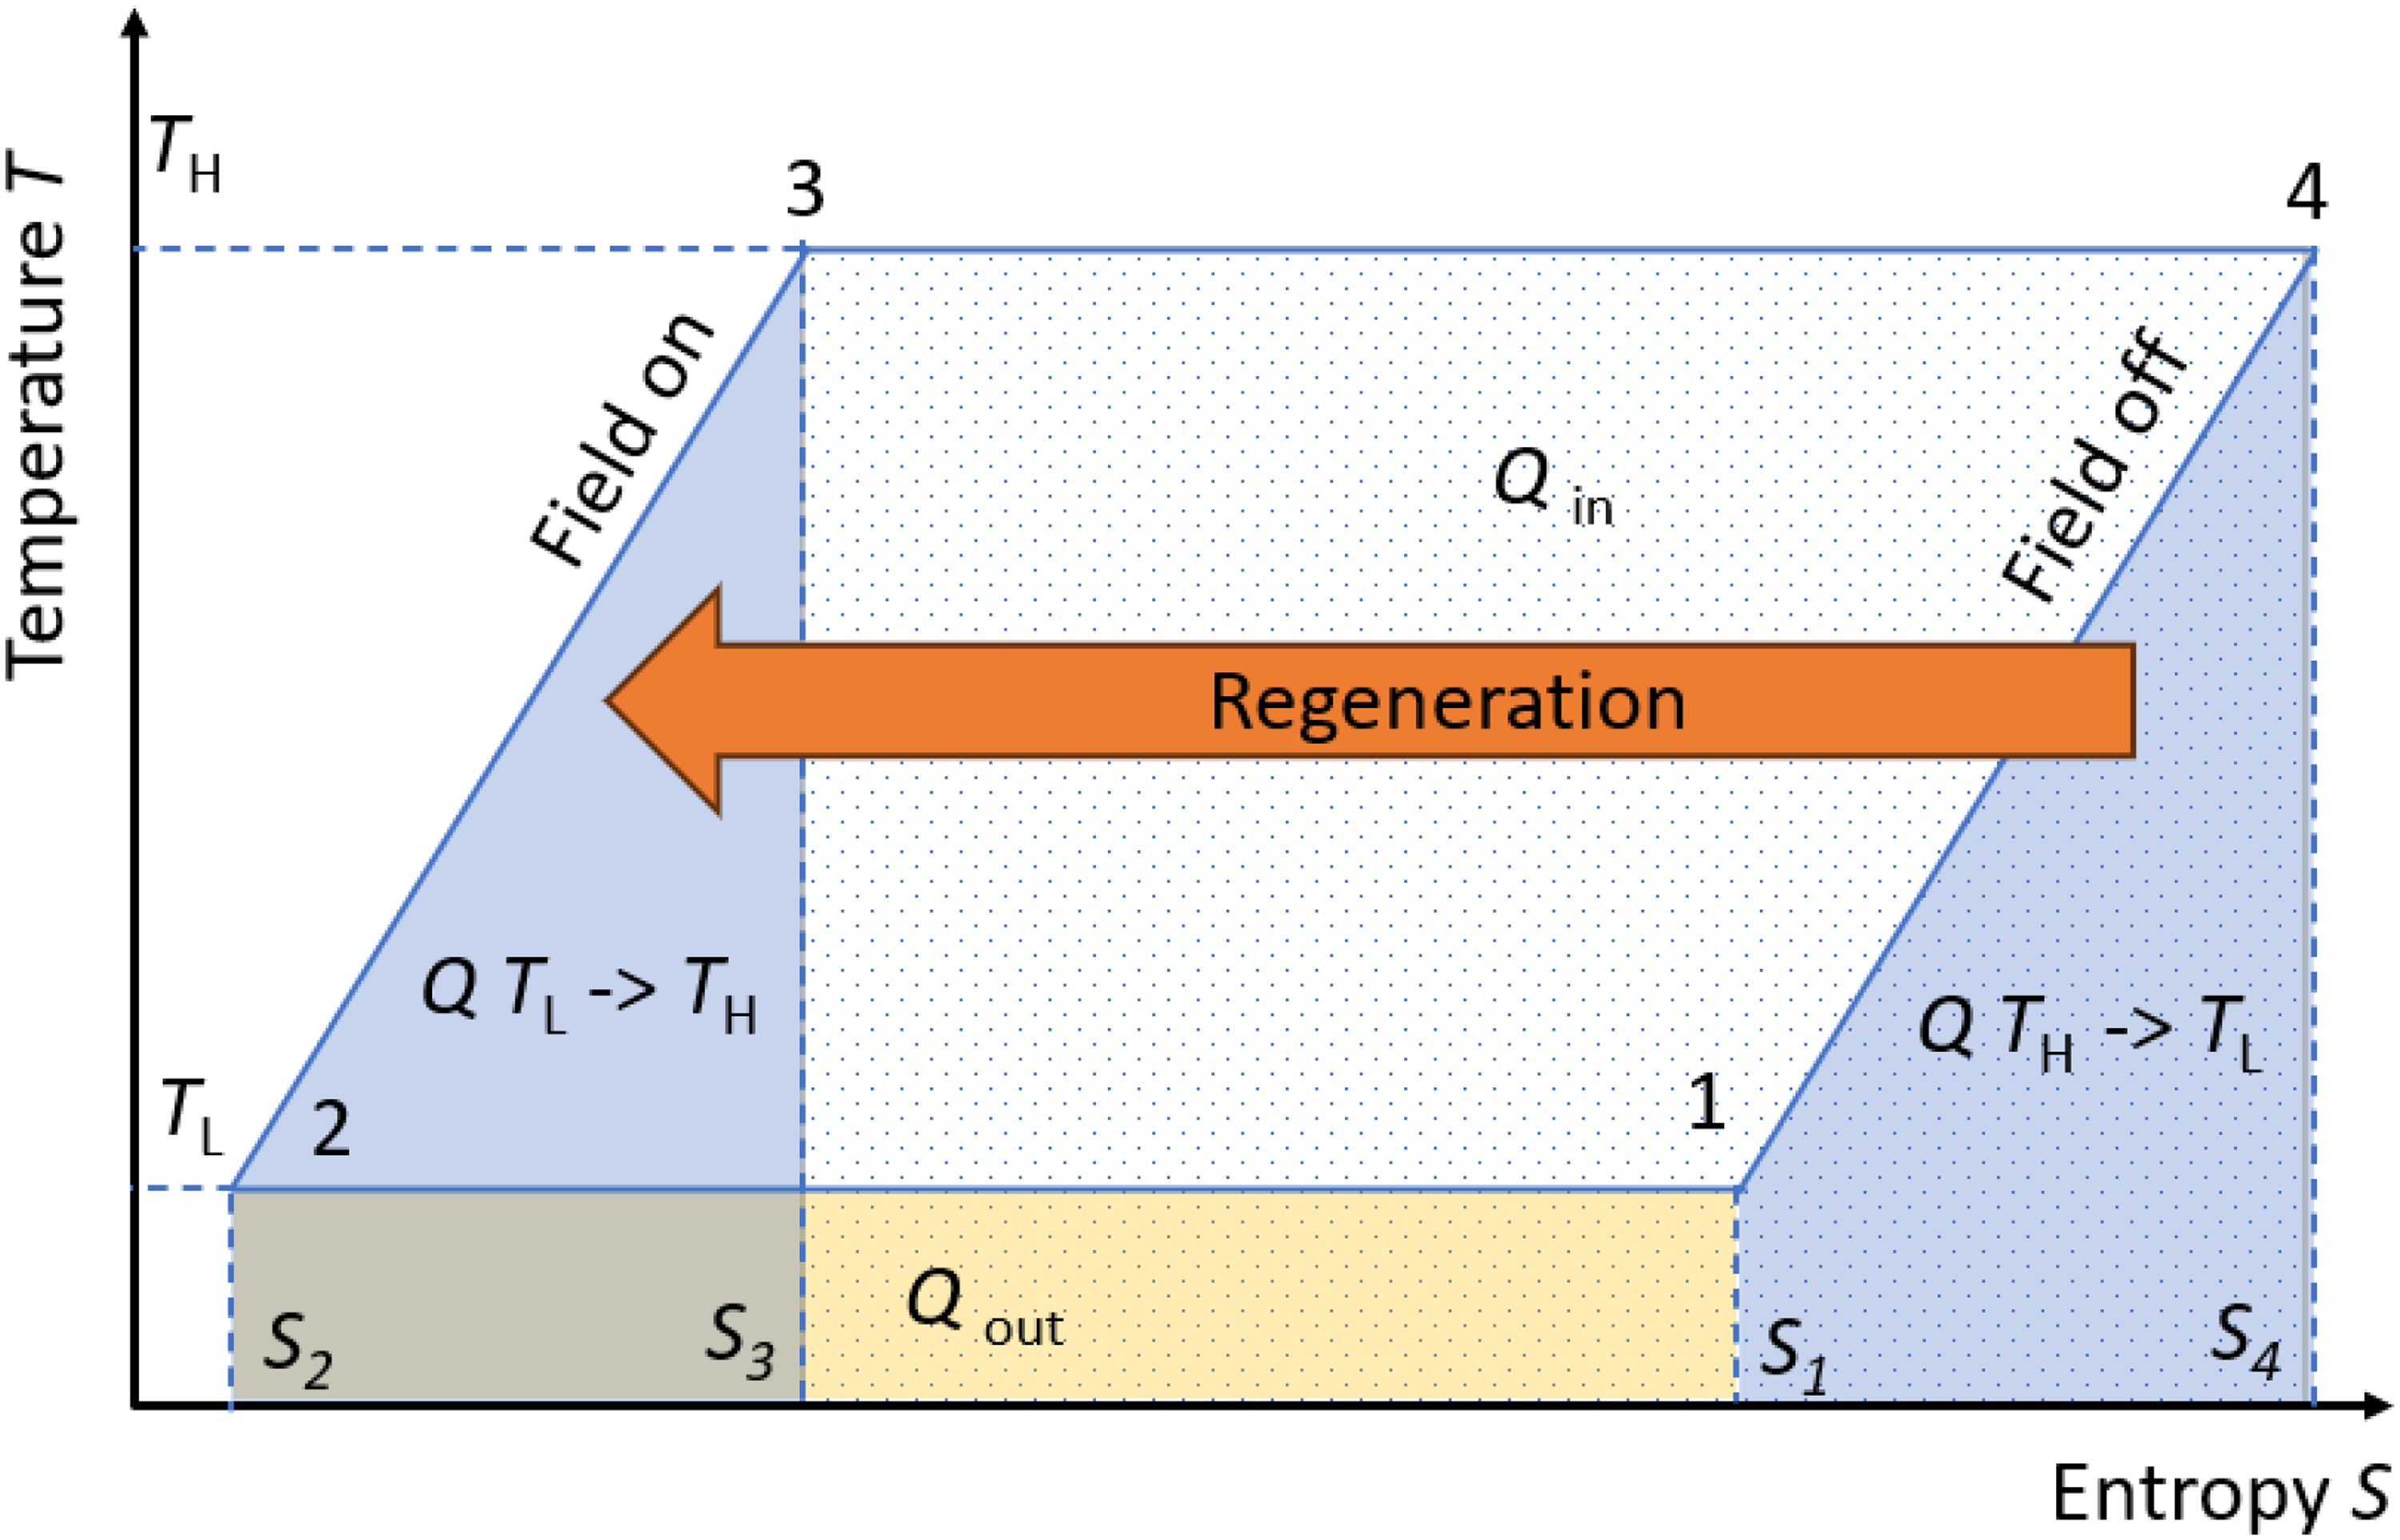
Olsen cycle of a pyroelectric material, in which the notion of regeneration is expressed. The heat needed to heat up the material when the field is on (leg 2→3) is the same as the heat given back by the material when the field is off (leg 4→1).
Step 1 is the starting point at low temperature (TL) with the field off (entropy S1). The electric field is then applied isothermally, reaching step 2 (TL and S2). During this leg from 1 to 2, some heat (Qout) is released to the environment due to the electrocaloric effect of the material. When the field is applied isothermally, for the entropy to decrease, the heat represented by the yellowish area (rectangle 1–2–S2–S1) must leave the sample. Once the maximum field is reached, the temperature is increased for the pyroelectric material to reach TH (leg 2→3). Contrary to a Carnot cycle, in which the temperature is provided adiabatically inside the material via the electrocaloric effect, here some external source must provide this heat. This is represented in Figure 9 as the area of the blue trapezoid defined by the points S3, S2, 2, and 3.
Next, the electric work (W) is collected by releasing the field at a constant temperature (leg 3→4). The amount of W is the area of the entire cycle, defined by the points 1-2-3-4. During this isothermal discharge, some heat (Qin) must be absorbed by the material. Releasing the field in a highly polarizable material increases entropy due to the electrocaloric effect, which explains the absorption of Qin (dotted rectangle 3-4-S3-S4). Finally, when the field is off (the material is therefore totally discharged), the last leg (4→1) brings the material back to TL without any field applied. This step requires the material to release some heat, represented by the trapezoid 1-4-S4-S1. In a perfect regenerative process, this heat Q (TH→TL) (leg 4→1) is exactly the same as Q (TL→TH) (leg 2→3), but of opposite sign. Therefore, this cycle demonstrates that it is possible to recycle all the heat used to cool down the pyroelectric material when it is subsequently heated up. This is feasible when the slopes of the two iso-field legs are the same.
Note that straight lines were used here to simplify the cycle. It is not possible to have identical curves at different electric fields in pyroelectric materials because their heat capacity also depends on the electric field.52,76 However, it is likely possible to obtain very similar curves for these two legs if the Olsen cycle is slightly modified by changing the field during these legs, as performed by Crossley et al. 77 in the case of an electrocaloric regenerator. Moreover, some authors suggest that Stirling cycles (two isothermal legs and two iso-displacement field legs) could achieve ideal regeneration because the heat capacity of pyroelectric materials does not depend on electric displacement. 46
Suppose a cycle like this could be implemented; the efficiency η would then be as high as that of a Carnot cycle. Indeed, η = W/Qin, and geometrically, we deduce from Figure 9 that this is simply (TH -TL)/TH, which is the same as Carnot.
This approach is extremely attractive because it shows that pyroelectric energy harvesting is theoretically bounded only by Carnot's efficiency. This is a key advantage of this technology compared to others, such as thermoelectrics or even photovoltaics. However, this simplified description of an Olsen cycle does not explain how to proceed experimentally to recycle this heat. The first challenge is to recycle the heat from the iso-field heating step to the iso-field cooling step, enabling regeneration. The second challenge, which is common to Carnot, Stirling, and Olsen cycles, is that isothermal legs are not practical because they require reversible heat exchanges based on infinitesimal temperature differences.
Despite these challenges, regeneration has been implemented in a few studies. The concept initially envisioned by Robert Stirling involves using a passive porous material with a high thermal mass to collect and temporarily store the heat from the isofield legs. It is interesting to mention it here in the case of a gas-based engine, as schematically described in Figure 10. 71 It gives the opportunity to visualize how the heat is exchanged during the two isofields. There is a temperature gradient that builds up in the porous structure over the cycles between TH and TC, which is not in place right from the beginning but only when the steady state is reached. The use case described in Figure 10 is a gas-based Stirling cycle, in which a gas is displaced by two pistons. As any Stirling cycle, it is constituted of two isothermal legs during which some heat is exchanged (QOUT at low temperature and QIN at high temperature) and two isofields of the extensive variable (here volume, which is the equivalent of electric displacement in pyroelectric cycles). The key point of the regenerative process is that the gas, when displaced at constant volume from left to right between steps 2 and 3, traverses the porous regenerator and cedes its heat to the porous medium. In an ideal situation, all gas’ heat is transferred to the regenerator. When the gas uses the opposite path later in the cycle and reaches a constant volume state from step 4 to 1, it collects the heat back as it passes through the regenerator. Hence, when the steady state is reached, there is no heat to be spent over one cycle during the two iso-volume legs. If this regenerative process is ideal, the heat spent during the constant low volume leg is the same as the one given back during the constant large volume leg. And this cycle is as efficient as a Carnot cycle.
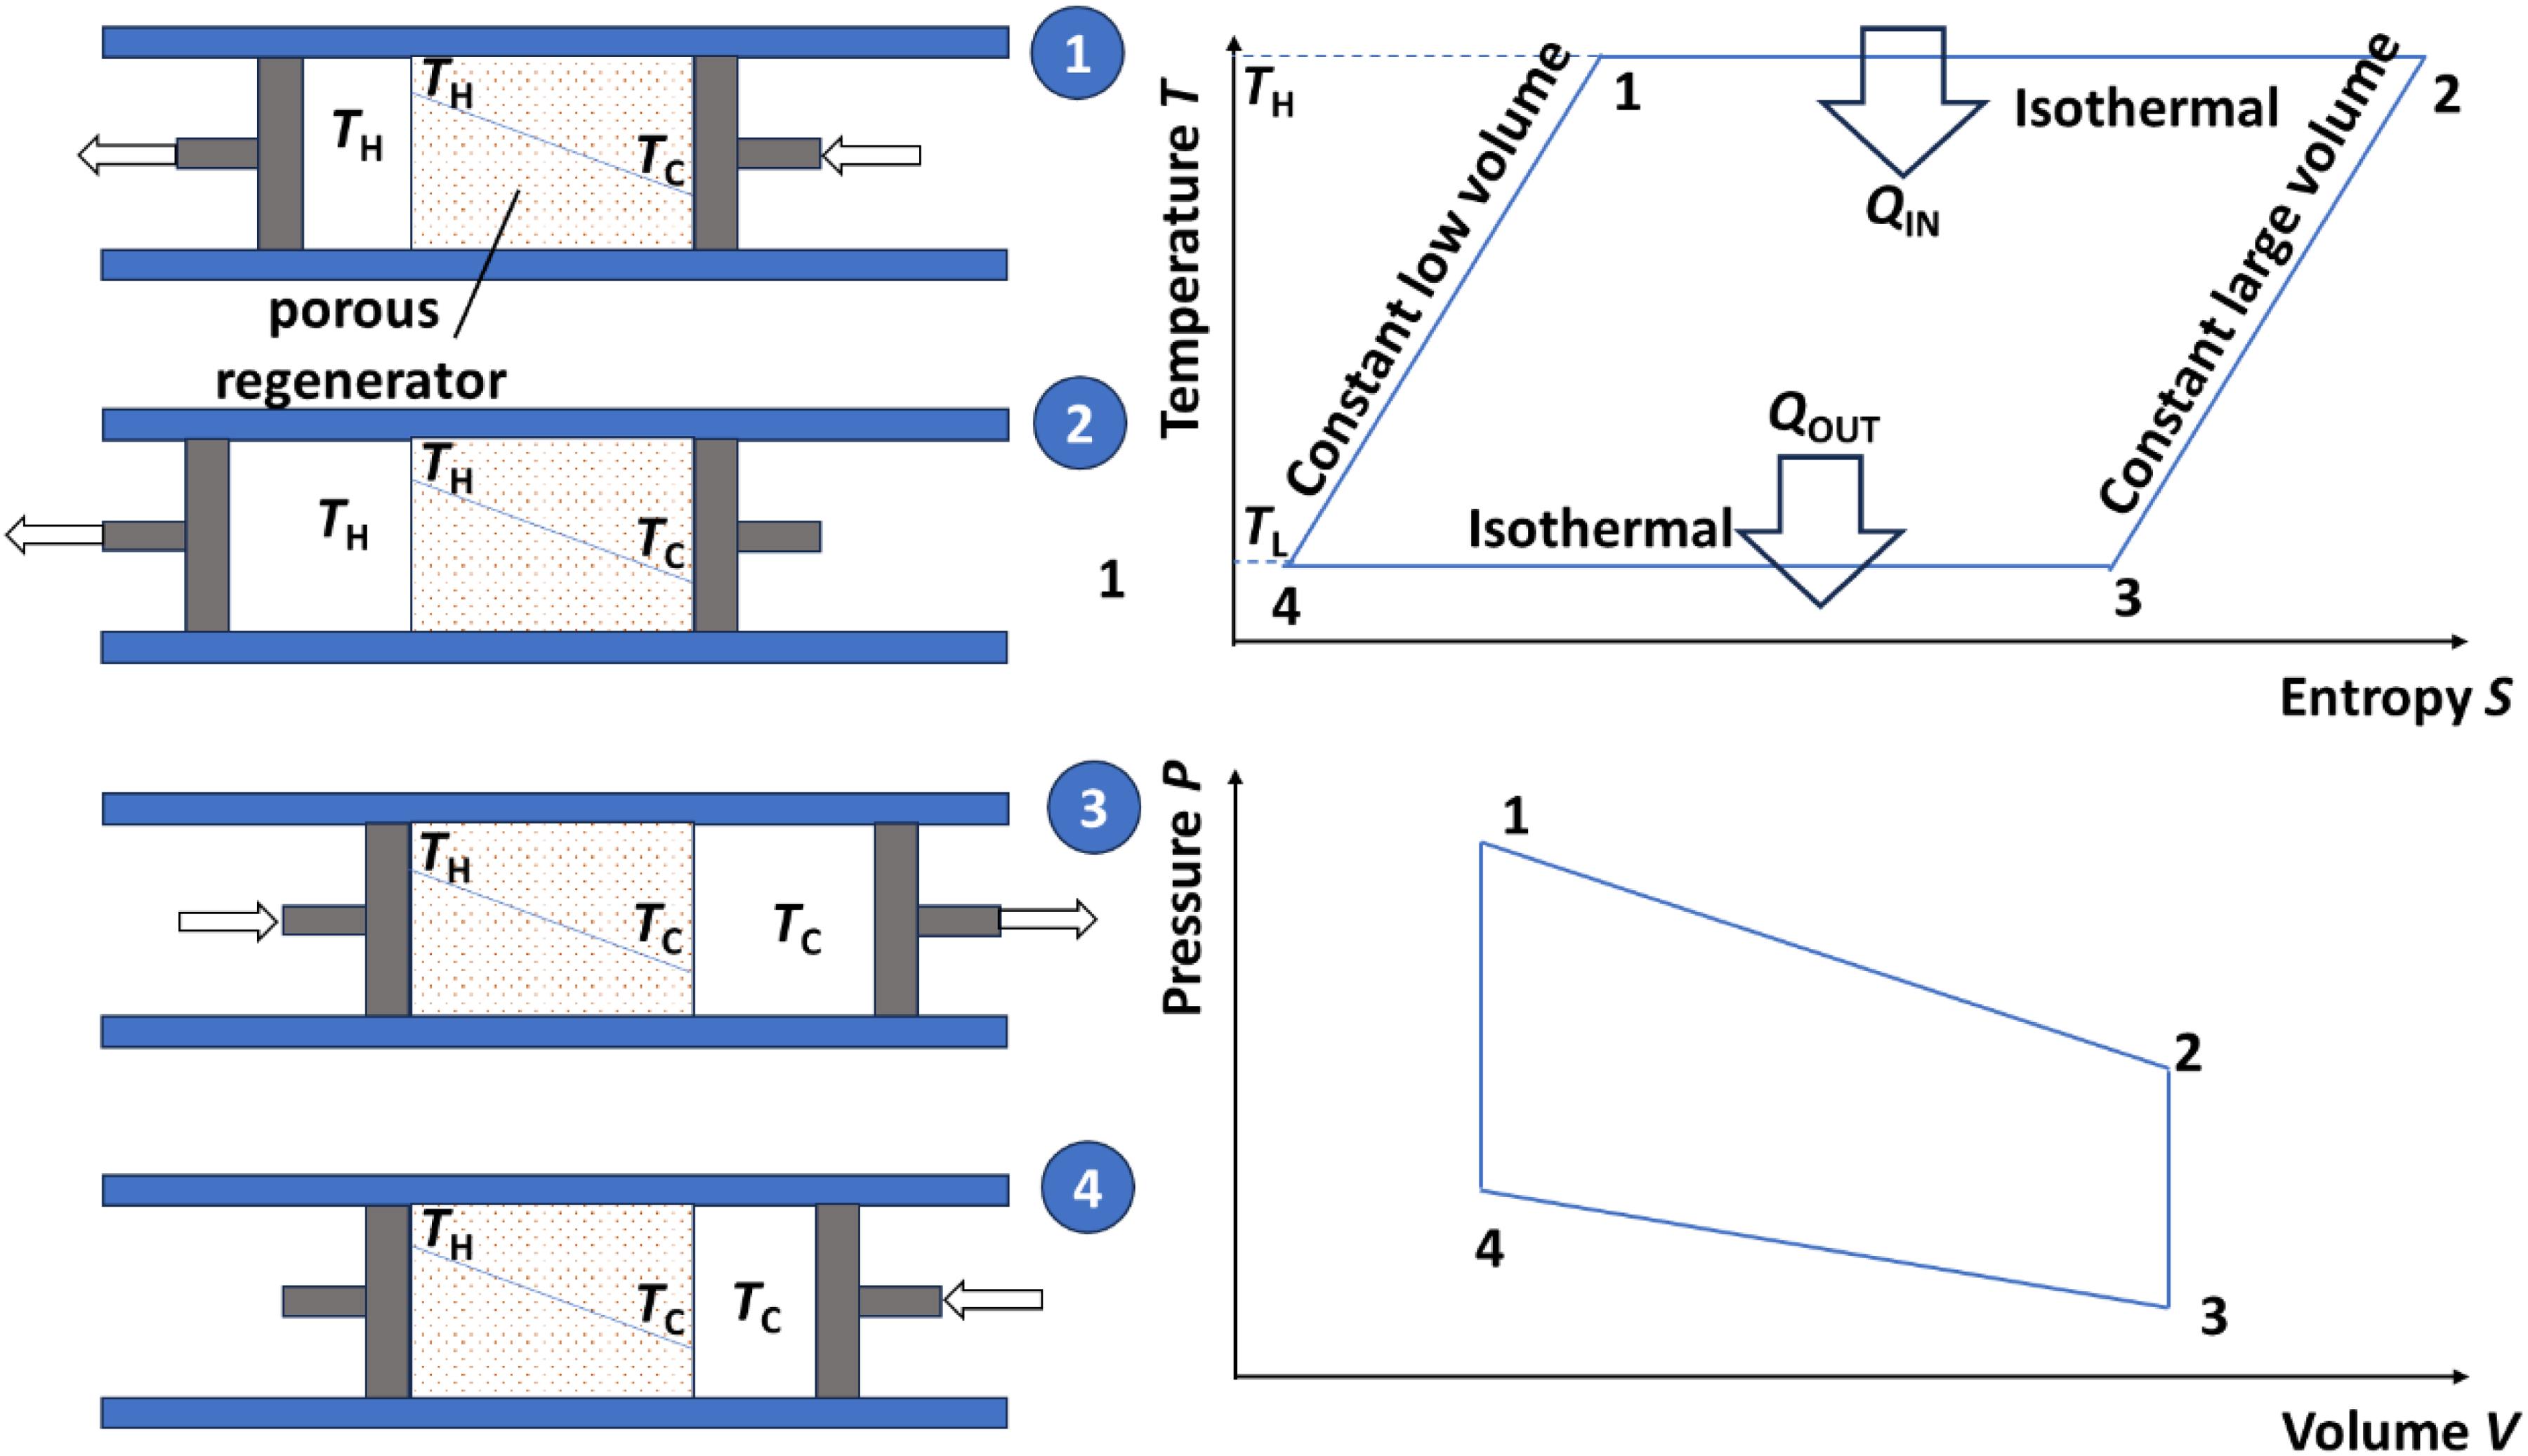
Example of a gas-based Stirling cycle including a porous regenerator, with a scheme of the four steps representing the cycle, and the corresponding temperature-entropy and pressure-volume graphs (reproduced from 71 )
Closer to our use case, this regenerative process was applied in 1975 by G.V. Brown in the case of magnetocaloric cooling. He proposed to apply a similar approach by using a column of fluid as the regenerator itself. 78 The idea was to oscillate a fluid mixture of water and ethyl alcohol up and down along the column of a cylinder assembly. This oscillation took place with respect to plates of gadolinium (which is magnetocaloric) that were held stationary. A strong magnetic field of 7T was applied periodically to the gadolinium plates, enabling to build up a temperature difference from −1°C to +46°C in the fluid, while the adiabatic temperature variation in the gadolinium plates were limited to 14 K. This experiment was the first clear demonstration of a regenerative process in any caloric cooling system, with the fluid acting as the regenerator.
In 1978, Steyert 79 proposed what is called the active magnetocaloric regeneration, which has been extensively studied since, not only in the case of magnetocaloric cooling, but also in the case of elastocaloric80–82 and electrocaloric cooling.72,73 The main idea is to consider the active caloric material as the porous structure in which the temperature gradient will be built in. These findings were a tipping point in this research field and all cooling prototypes based on caloric materials since have been using this principle. 83
Heat regeneration and cascading concept in pyroelectric energy harvesting
When it comes to pyroelectric energy harvesting, the obvious idea stemming from the previous example is to displace a fluid exhibiting a gradient of temperature inside a regenerator. Figure 11 illustrates non-regenerative (Figure 11(a)), passive regenerative (Figure 11(b)), and active regenerative (Figure 11(c)) cycles involving a pyroelectric material and two reservoirs (hot end and cold ends). In the non-regenerative cycle (Figure 11(a)), the total heat flow between the pyroelectric sample and the reservoirs is very large due to the large temperature difference. All the heat absorbed by the material at the hot end is released into the cold end, which makes the process strongly irreversible, and therefore not efficient. In the passive regenerative cycle (Figure 11(b)), the sample is moved from the hot end to the cold end through intermediate heat reservoirs at increasing temperatures (T1, T2 …Tn). Here, the heat absorbed by the sample is relatively small due to the small temperature difference between two consecutive reservoirs (Q = Cpyro (Tn – Tn−1)), with Cpyro the specific heat of the pyroelectric sample. In theory, if the temperature difference is very small, the heat flow becomes reversible, enabling approaching Carnot's efficiency. To initiate the next cycle, the sample travels through the regenerator reservoirs absorbing a small amount of heat stored in them before reaching the hot reservoir. Like in the non-regenerative case, in the passive regenerative case (Figure 11(b)), the sample undergoes an identical temperature change from Thot to Tcold, but the heat absorbed at the hot end that is not part of the regenerative process is limited to Cpyro (Thot – T1). It means that the heat stored in one intermediate reservoir (Cpyro (Tn − Tn−1)) when the pyroelectric material travels from the hot end to the cold end is fully recovered when it travels back from the cold to the hot end. Therefore, only the first step cannot be recovered (C(Thot –T1) in the regenerative case (Figure 11(b)).
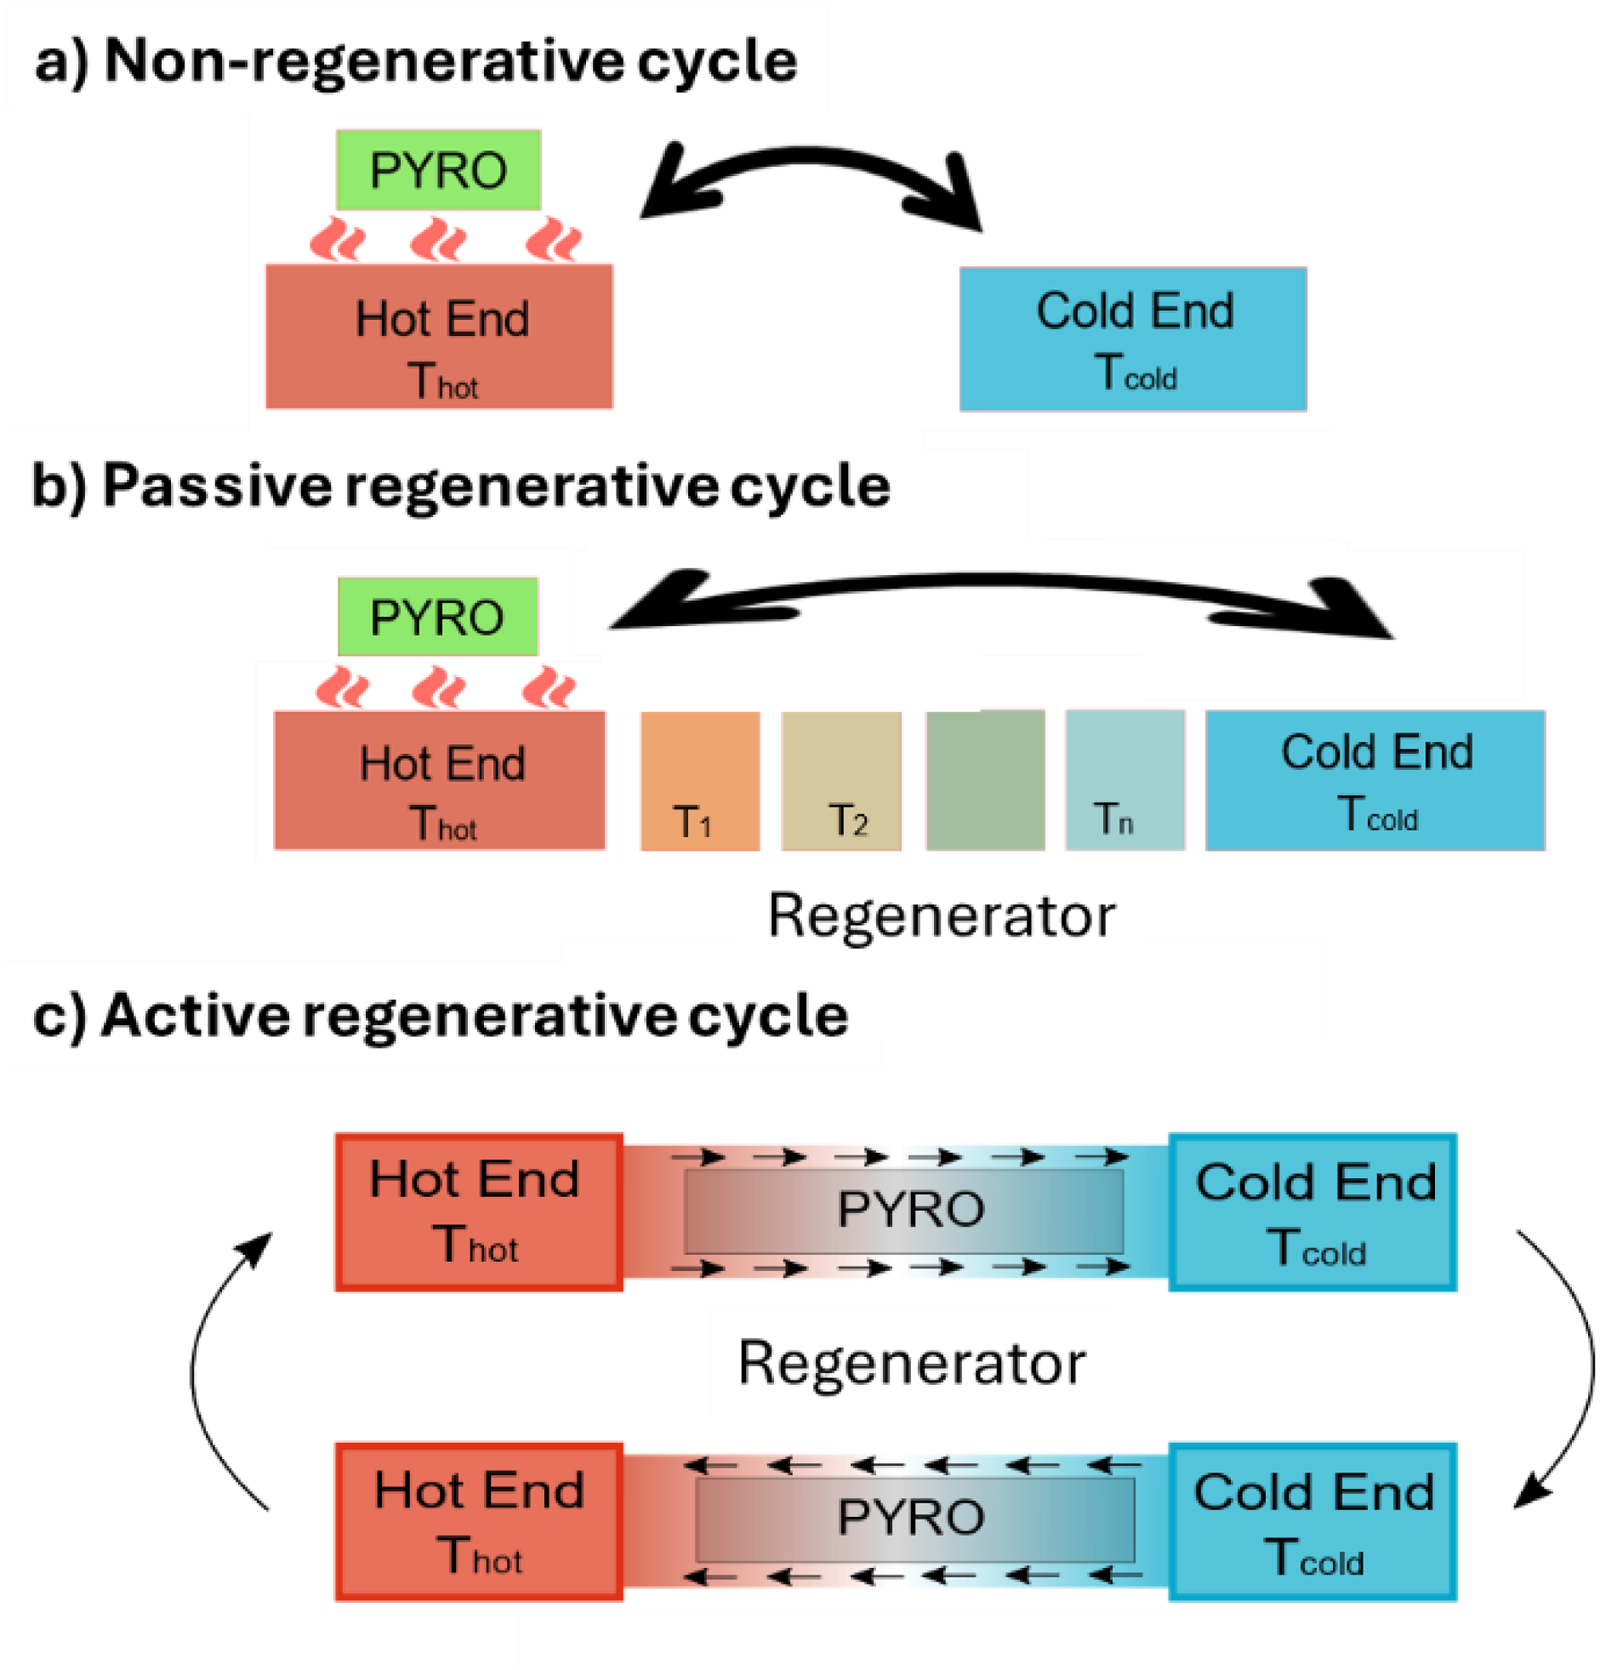
Illustration depicting a) non-regenerative, b) passive regenerative and c) active regenerative cycles pyroelectric energy harvesting. In the non-regenerative (a) and passive regenerative cycles (b), the arrow signifies that the green pyroelectric element is moved from one end to the other. In the active regenerative cycle (c), the arrows mean that the two steps are cycled.
Consequently, if we suppose that the amount of electric work produced in one cycle is the same in a non-regenerative and on a passive regenerative cycle (W), the efficiency increases from W / (Cpyro (Thot – Tcold)) to W / (Cpyro (Thot – T1)). This simplified example shows how to decrease the amount of heat needed to cycle, though the eventual limit in efficiency is Carnot's efficiency, if regeneration is perfect.
Heat regeneration can also be obtained by pumping a fluid between the hot and cold reservoirs to exchange heat with the pyroelectric samples. This type of regeneration is known as active regeneration (see Figure 11(c)). As the heat travels from the hot end to the cold end via the heat exchanger, a temperature gradient is established. Here, the oscillating fluid induces a cyclic temperature variation on the samples. Through slow cycling and proper thermal insulation of the device, Carnot efficiency could in theory be achieved. 54 However, it is practically very difficult as the heat capacity is also dependent on the field and the material is cycled at different electric fields along the regenerator resulting in some heat leakage. Moreover, controlling a thermal gradient in a fluid is very challenging to achieve.
To further enhance efficiency, Gonzalo 26 and Drummond et al. 27 put forward the concept of using multistage converters. Here, the pyroelectric materials with varying transition temperatures are thermally connected in series to enlarge the temperature window of the device (shown in Figure 12). In other words, the heat rejected by the material in the first stage will serve as the input heat for the material in the second stage. By implementing a proper heat regeneration technique, either using a fluid or a thermal control device (detailed in the next section), the heat can be recycled efficiently between the stages, thus reducing the overall heat input. This will increase the overall efficiency of the device.
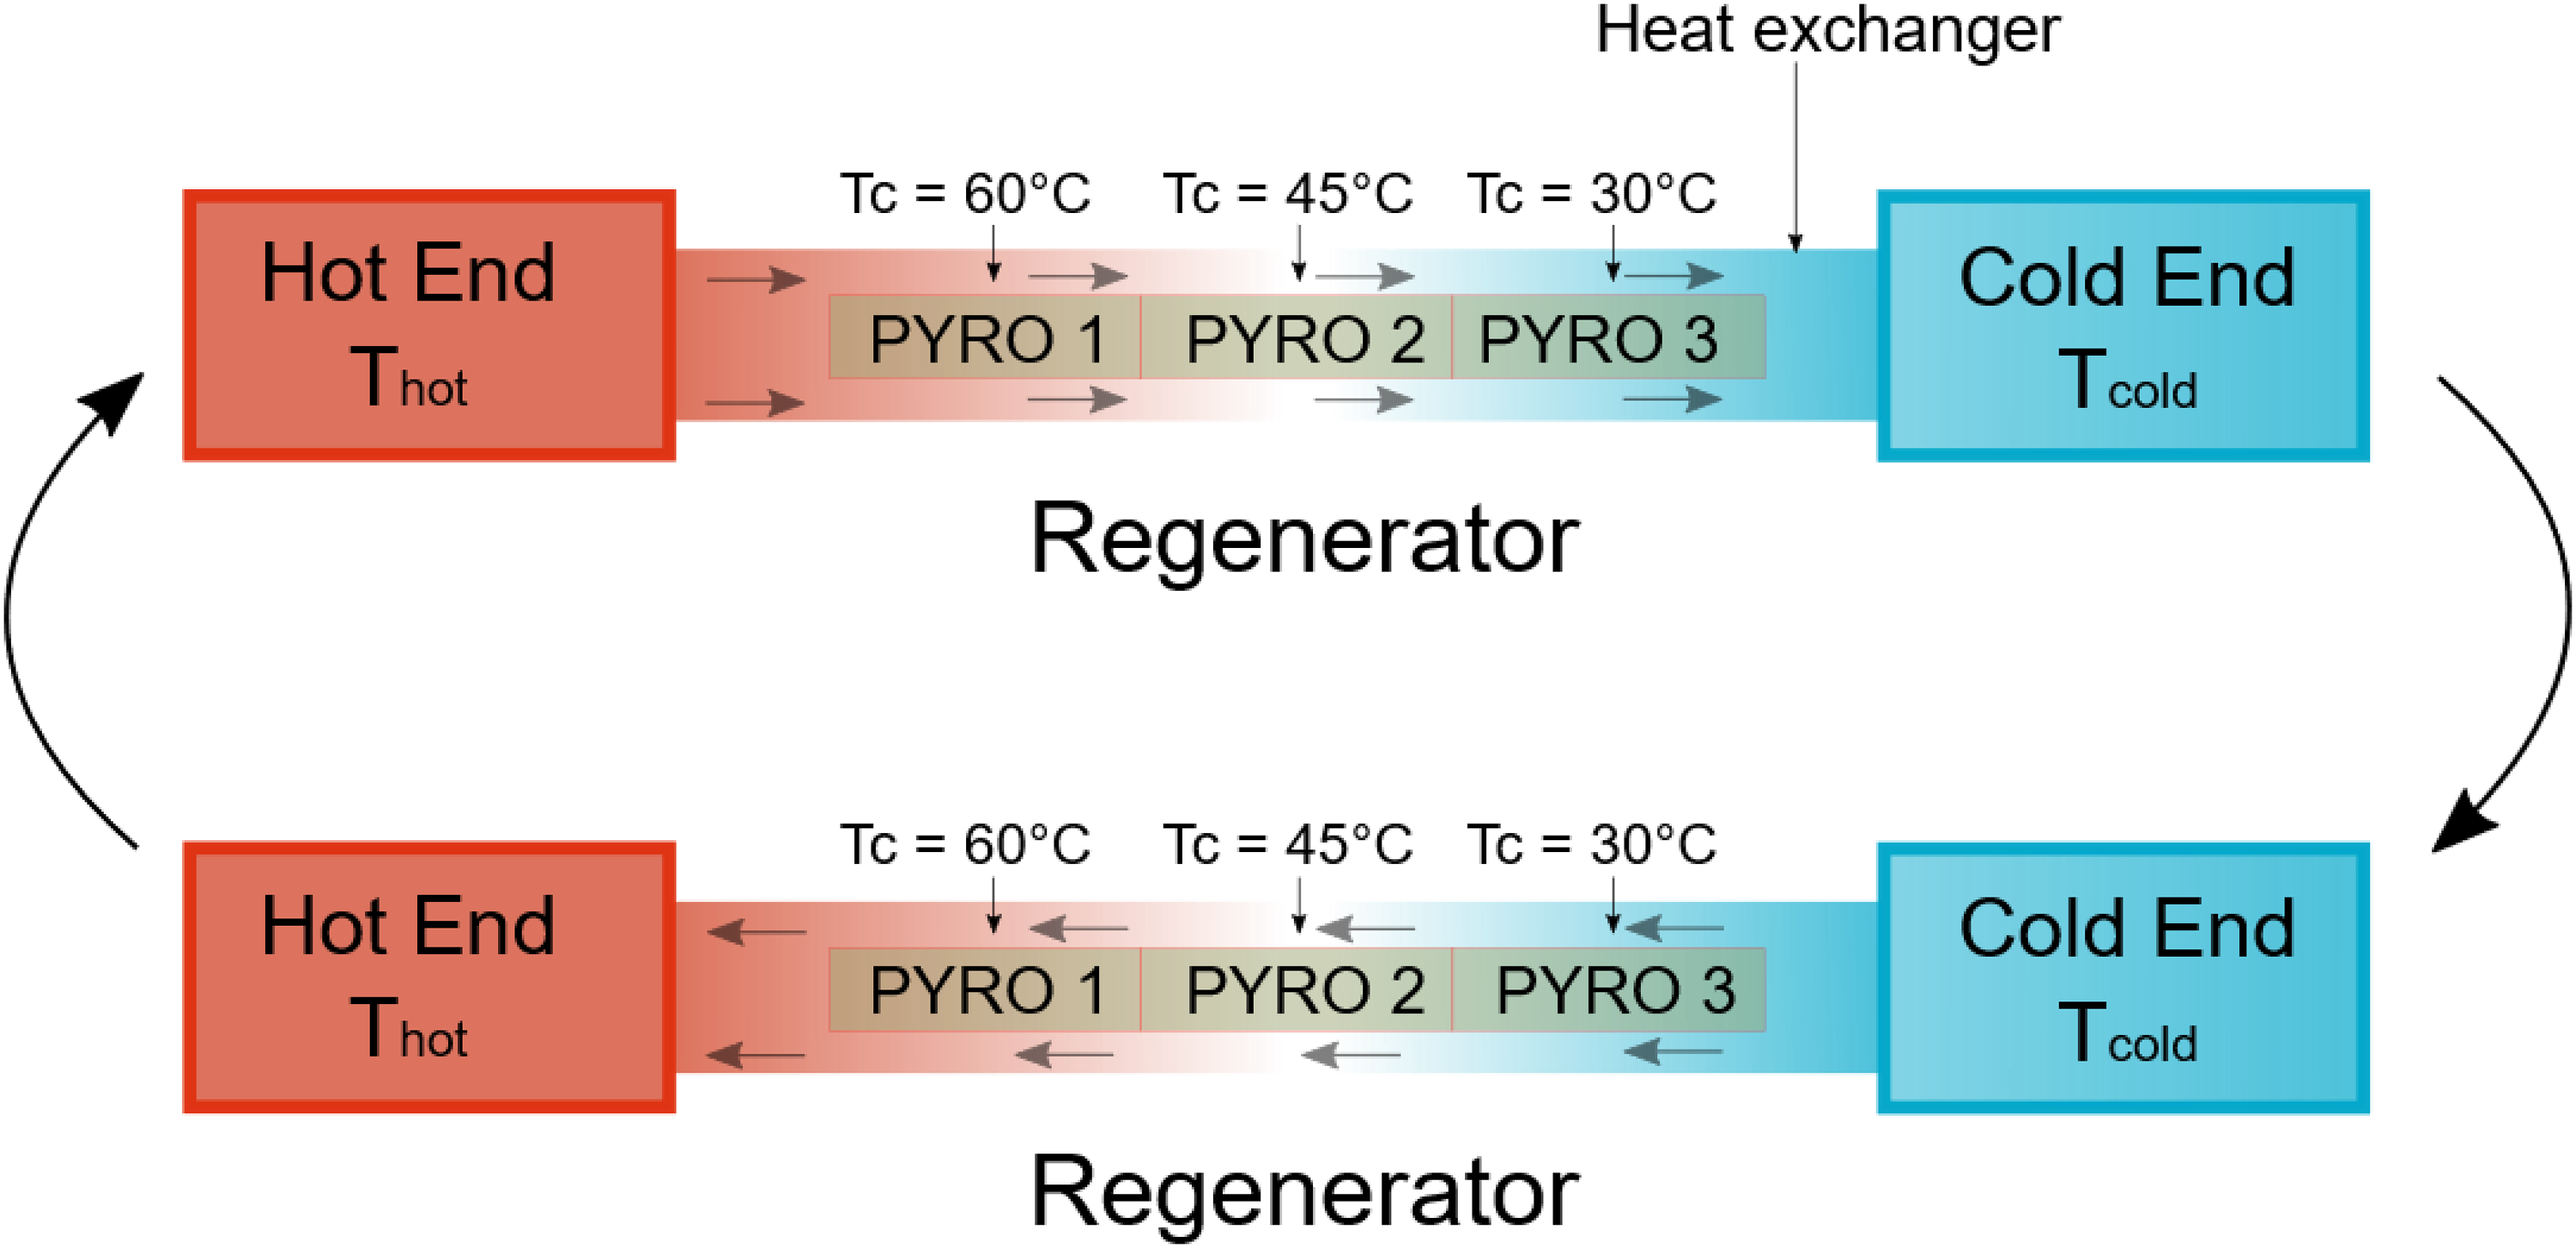
Schematic representation of cascaded or multistage pyroelectric energy harvester. The arrows means that the process is cycled.
Despite the concept's age, there is only one report on the experimental demonstration of heat regeneration with cascading for non-linear PEC in the literature, proposed by Olsen et al. 84 The energy generation has already been discussed earlier. Besides, the authors reported the efficiency by measuring heat flow via the electrical energy provided to a heater band and by measuring the electric power generated in the pyroelectric modules. They achieved a maximum absolute efficiency of 0.50%. This stands for 7.4% of the corresponding Carnot efficiency (=31 K/454 K = 6.8%). They reported a 20% improvement in the efficiency of the cascaded device compared to the single stage device.
Which non-linear materials for pyroelectric energy harvesting?
A natural link between electrocaloric and pyroelectric materials
As first anticipated by Olsen
54
in the 1980s and underlined later by Sebald et al.,
44
good pyroelectric materials are also good electrocaloric materials. Both effects are strongly enhanced close to phase transitions where the variation of polarization
Another way of viewing it is the following: a good electrocaloric material exhibits a large variation of temperature when an external electric field is applied quickly (to preserve adiabatic conditions). This variation of temperature (ΔTad) can be deduced from the Maxwell thermodynamic relation, which yields
Figures of merit for pyroelectric non-linear energy harvesting
The concept of a “figure-of-merit” (FOM) as a combination of materials properties that will give a direct measure of potential device performance is a widely used approach in materials science. An appropriate FOM offers a direct way to assess and compare pyroelectric materials for various applications. While many pyroelectric FOMs exist, they have generally been derived for pyroelectric detectors or linear pyroelectric energy harvesting applications. 87 In this paper, we will review the existing FOMs and introduce two specific FOMs tailored for nonlinear pyroelectric energy conversion, based on energy and power harvested per cycle. The key criteria are the energy or power generated and the conversion efficiency of the material.
For pyroelectric detectors and thermal imaging sensors, there are two figures of merit which focus on the generation of maximum current or voltage for a given input power.
32
The figure of merit based on the current responsivity 
Similarly, the figure of merit based on the voltage responsivity 
The FOM for pyroelectric IR detector applications have been widely discussed. 87 They should not be used in the context of pyroelectric energy harvesting. For energy harvesting, the key criteria are the energy or power generated and the conversion efficiency of the material, usually referred to the unit mass or the volume used.
Sebald et al.12,88 proposed two FOMs for pyroelectric energy harvesting in a manner similar to that for piezoelectric energy harvesting. They considered a linear behaviour of the material, making these FOMs most applicable for linear pyroelectric energy harvesting. The FOMs for energy harvesting is defined as,
They also proposed an electro-thermal coupling factor,
12
similar to the electromechanical coupling factor, which estimates the overall effectiveness of thermal harvesting. It is given as:
For non-linear pyroelectric energy conversion, simply considering the linear pyroelectric coefficient and low-field permittivity values is inadequate, especially when high fields are applied. These values do not accurately reflect a material's performance under non-linear conditions because the former figures of merit assume linear behaviour. The simplest way to quantify and compare the performances of materials for non-linear pyroelectric energy conversion is by examining their D-E loops measured at different temperatures. Indeed, we saw in the Olsen cycle's description (Figure 6(b)) that the area of the region located between the two PE loops of the same material collected at the two temperatures of the selected cycle is an excellent estimation of the energy that can be collected, whatever the harvester design in use. The size of the cycle in the PE loops increases with the maximum electric field experienced by the material. It also increases when the electric displacement is larger. Hence, for comparing materials, we propose to use FOMe
Schematic representation of the non-linear figure of merit (FOMe) from the D – E loops
Although Childress was the first to discuss the issue of power generation and its relationship to material thermal conductivity,
22
figures of merit are derived based on energy per cycle and do not account for non-linear effects or thermal properties. Furthermore, the power output of the material has rarely been analyzed, and no figure of merit has been specifically proposed for this purpose. A figure of merit for power per cycle FOMp could be obtained by multiplying 
This approach considers both the electrical and thermal characteristics of the material, providing a more comprehensive assessment of its performance. Indeed, according to the heat equation, the characteristic thermal time for a material of thickness d and thermal diffusivity is d²/α. 91 Therefore, for a given thickness, the frequency at which heat can be moved into or evacuated from the material is proportional to α, which justifies this figure of merit.
Impact of material geometry
Ferroelectric materials can be configured into bulk, thin-films, and multi-layer capacitor structures (Figure 14). Using bulk ceramics for electrothermal conversion is attractive thanks to their large volume compared to films. However, breakdown field tends to decrease with thickness, which predisposes bulk ceramics to breakdown at lower electric field. Indeed, in thicker dielectrics, there is a higher probability of having microscopic defects that can act as initiation sites for breakdown. Besides, the thermal relaxation time is longer in bulk ceramics than in thin films, imposing restrictions on heat exchange conditions. To overcome these limitations, ferroelectric thin films92–94 are being investigated as high electric fields can be induced at a relatively low voltage. Moreover, thin films can yield a higher pyroelectric power density due to their fast heat transfer.66,95,96 Yet it is very challenging to directly quantify the performance of thin films as it could lead to the release of trapped charges resulting in spurious signals that are difficult to distinguish from the pyroelectric effect while employing a conventional measurement technique. 97 In the case of pyroelectric and electrocaloric cooling, the overall stored energy of thin films is small due to their low thermal mass. One way to enhance the thermal mass of thin films is to opt for the multi-layer capacitor (MLC) geometry that has been extensively developed by the chip-capacitor industry.98,99 MLCs consists of a plurality of films (each from a few to a few tens of microns thick) stacked on top of each other and co-sintered with working electrodes between them. MLCs strike a balance between bulk and thin film geometry as large electric fields could be applied at a relatively low voltage and they possess a macroscopic volume. The electrodes are alternatively connected to external terminals on opposite sides and all the sub-capacitors are in parallel (see sketch in Figure 14). Typically, their active volume is between 50–80% of the total volume. Moreover, the interdigitated metallic electrodes efficiently conduct the heat from the centre to the edge of the capacitor stack, promoting heat exchange.100,101 MLCs have been widely investigated for electrocaloric (EC) cooling applications. 83 However, there is only one report on directly implementing the Olsen cycle using MLCs for non-linear pyroelectric energy conversion. 29 Kar-Narayan et al. 102 reported that MLCs are the ideal geometry for EC prototypes and predicted a cooling power of 20 kW for a total area of 0.56 m2 via lumped thermal modelling. Crossley et al. 103 modelled the heat flow across the MLCs and investigated the effect of geometry. They reported that the heat exchange could be considerably improved by using Ag electrodes instead of Ni electrodes due to their high thermal diffusivity. Faye et al. 100 modelled the heat flow within the MLCs and reported that by increasing the thickness of the inner electrodes by a factor of 5, the heat flow can be improved by a factor of 2.5. In another study, Faye et al. 104 investigated the heat exchange between the MLCs and the environment using thermometry. Furthermore, they investigated the heat transfer characteristics of MLCs in different configurations and offered insights into reducing the heat leakage while integrating in a prototype. Recently, Li et al. 73 optimised the MLCs geometry in an EC prototype for better heat exchange and obtained 21 K in temperature span and a cooling power of 420 W L−1. Another advantage of using MLC geometry for electro-thermal energy conversion is their high reliability. Recently, it was shown that PST MLCs display stable behaviour after 4.106 field switching cycles. 73 In the future, it would be worthwhile to revisit the influence of electrode materials and their thickness, layer thickness and number of layers, and also the other geometries such as reverse geometry and their characteristics on heat transfer for thermal energy conversion.
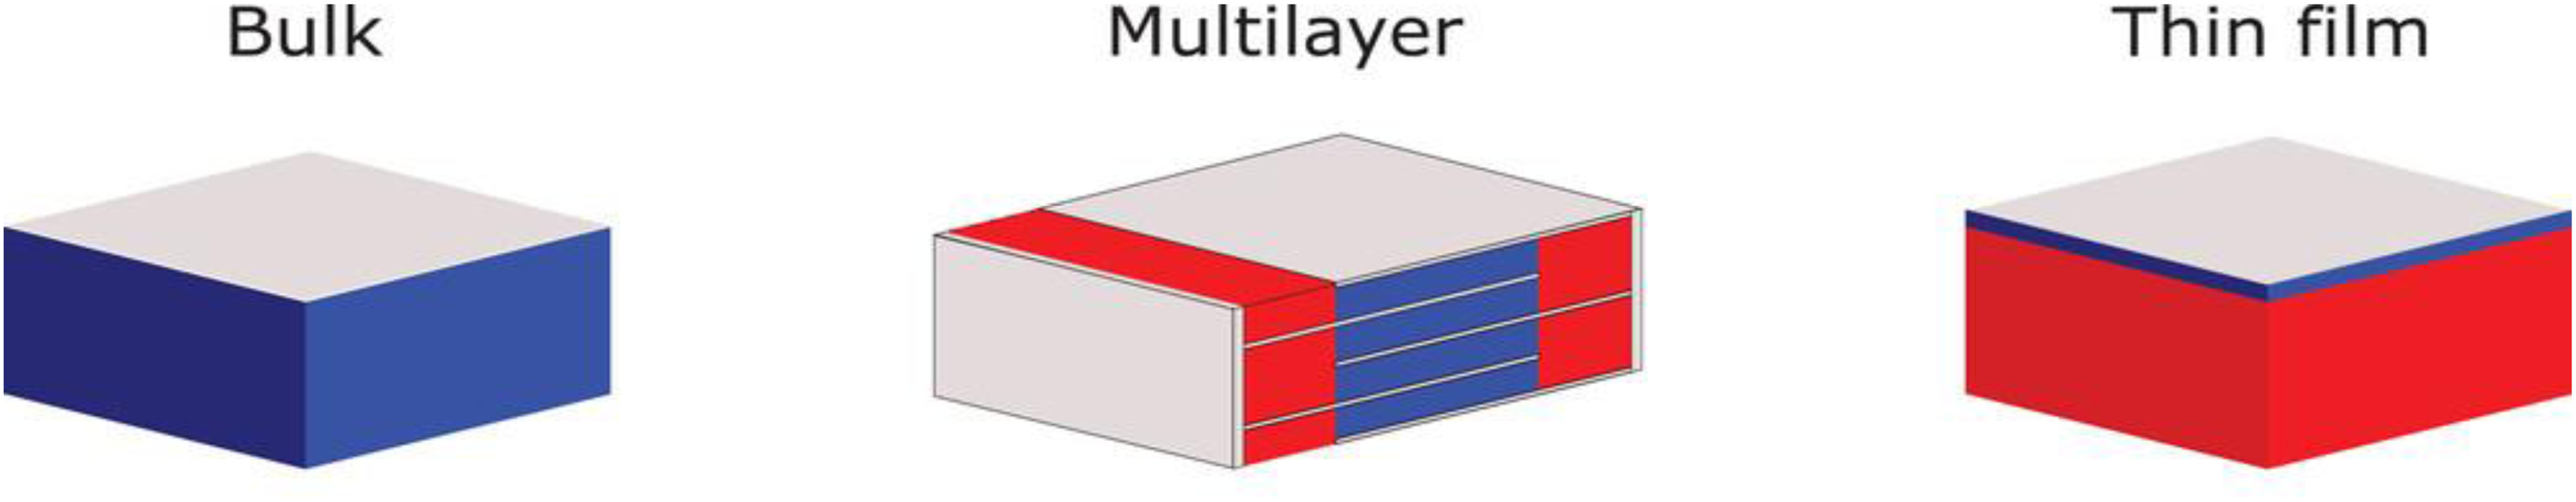
Schematic illustration of bulk ceramics (left), multilayer capacitor (middle) and thin films (right). The red and blue area represents the inactive and active regions respectively. The electrodes are marked with silver. Adapted from. 83
Performance of non-linear pyroelectric materials
Table 1 lists the performance of various non-linear pyroelectric materials subjected to an Olsen cycle under different operating conditions. The materials are categorized into lead-based ceramics, lead-free materials, and polymers. The table provides data on key performance metrics, including energy density, harvested energy per cycle, and power density, as a function of their operating temperature and electric field range.
Energy density is particularly useful for comparing materials directly, as it provides a normalized measure of the energy harvested per unit volume and allows comparisons across different material geometries. On the other hand, absolute energy per cycle reflects the total energy output, making it essential for evaluating the material's suitability for device integration. Power density, another critical metric for practical applications, determines the ability of the material to deliver high power output per unit volume, which is crucial for applications like IoT devices, autonomous sensors, and other systems requiring continuous power. Where power density was not explicitly reported, it was calculated using energy density, active volume, and frequency, and these values are provided in the table.
The table also highlights the zero-field Tc of each material, which is critical for determining the optimal operating range for energy harvesting. Materials with a Tc close to the desired operating range can maximize efficiency in applications such as waste heat recovery and temperature-sensitive systems like automotive devices. For maximum energy density, materials must exhibit a large variation in polarization and high breakdown fields to enlarge the area of the cycles (see Figure 13), while high operational frequencies are essential to achieve enhanced power density. These performance indicators, which can be inferred from Table 1, provide key insights into the feasibility of non-linear pyroelectric materials for thermal energy harvesting applications.
We will start the discussion of the materials listed in Table 1 with Pb(Sc1/2Ta1/2)O3 (PST) because it yields the highest energy density (4.4 J.cm−3). It also has a Tc close to room temperature (25°C at zero applied field) and it exhibits a large breakdown field exceeding 200 kV/cm when fabricated in multi-layer capacitor (MLC) format. 29 Additionally, PST has not been detailed in previous reviews, and we want to focus on its structure-property relationship because it also exhibits a high electrocaloric effect due a large variation in entropy at Tc.
Following PST, Sn4+ doped PZT samples are of particular interest as they can be AFE at room temperature and display a large change in polarization between AFE and FE phases. By tuning the composition and external parameters such as temperature, pressure and field, it is possible to field-enforce an AFE to FE transition. PNZST samples yield significant energy output in a narrow temperature span close to their Tc. Due to this promising characteristic, Olsen extensively studied the PNZST system and built prototypes using this material, which is discussed in the later part of the review.
Next, La-doped PZT materials deserve attention because increasing La doping can bring the Tc down to room temperature, making these materials suitable for room temperature applications. PMN-PT is also a notable material for its exceptional piezo- and pyroelectric properties. 88 Moreover, the highest power output has been recorded using this material in thin film form, encouraging a closer examination of its characteristics.
Finally, the lead-free materials based on Sr-doped BaTiO3 (BST) and PVDF-TrFE based polymers are discussed for their unique advantages. BST is particularly noteworthy due to its room temperature Tc and significant energy density. Moreover, BST is a lead-free ceramic and the basis for most commercial multilayer capacitors (MLCs), thanks to its well-developed and advanced fabrication technology. This makes it highly practical and promising for future applications.
Similarly, PVDF-TrFE based polymers garner attention thanks to their low Tc, high dielectric strength, significant entropy variation, flexibility, and their low densities can potentially improve the power-to-weight ratio in future device prototypes.
Lead scandium tantalate (PST)
Pb(Sc0.5,Ta0.5)O3 (PST) possesses the perovskite crystal structure (AB’B’’O3) with the A-site occupied by Pb2+ ions and the octahedral B-site occupied by Sc3+ and Ta5+ ions.105,106 Depending on the arrangement of B-site cations, PST can be represented as disordered (left) or ordered (right), as shown in Figure 15. In the ordered PST, Sc3+ and Ta5+ ions alternate perfectly in adjacent B-sites (1:1 ordering), leading to an effective doubling of unit cells. In the case of disordered PST, Sc3+ and Ta5+ ions randomly occupy the B-site resulting in the absence of supercell reflections. This ordering plays a paramount role on the nature of the phase transition that can be either diffuse (disordered) or sharp (first order phase transition, ordered). Additionally, the transition temperature of PST varies based on the degree of ordering. Typically, the Curie temperature (Tc) of an ordered PST is around 25 to 30°C. 107 The presence of B-site ordering can be identified by the superstructure lines in the x-ray diffraction pattern.75,81
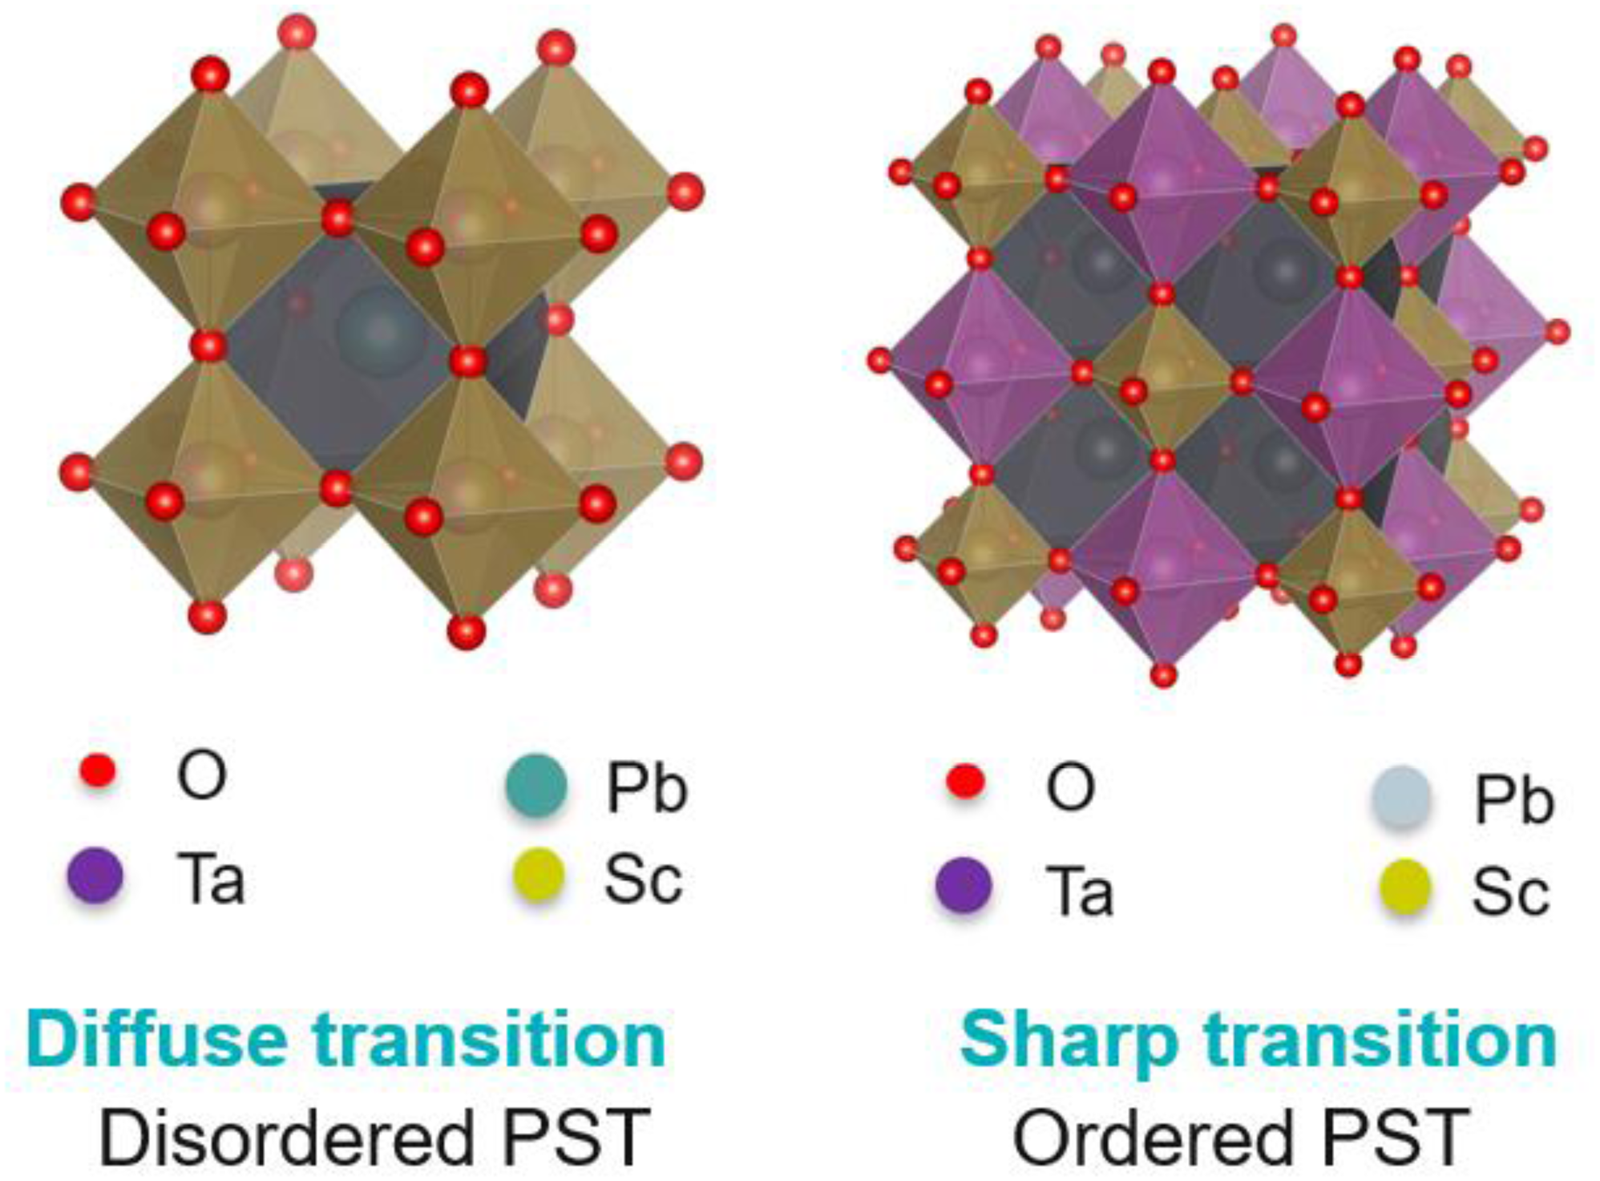
Schematic of lead scandium tantalate PST (AB’B”O3) perovskite compounds (drawn using VESTA software 108 ).
Shebanov et al. 109 reported that a highly ordered PST exhibits high electrocaloric effect (ECE) near the transition temperature due to the significant change in unit cell volume (ΔV = 0.08 Å). Furthermore, they also mentioned that the field induced transition was the most important contribution to the large electrocaloric response (∼2.3 K) in the ordered PST, causing a large entropy change. In another study, 110 they also investigated the influence of dopants for shifting the transition of PST and conducted a preliminary study on using PST multilayer capacitors for electrocaloric cooling. Recently, it was shown that macroscopic PST multilayer capacitors with high ordering can display an intrinsic temperature variation of 5.5 K. 111 Moreover, it was reported that the electrocaloric temperature variation increases with the increase in ordering as shown in Figure 16. 70
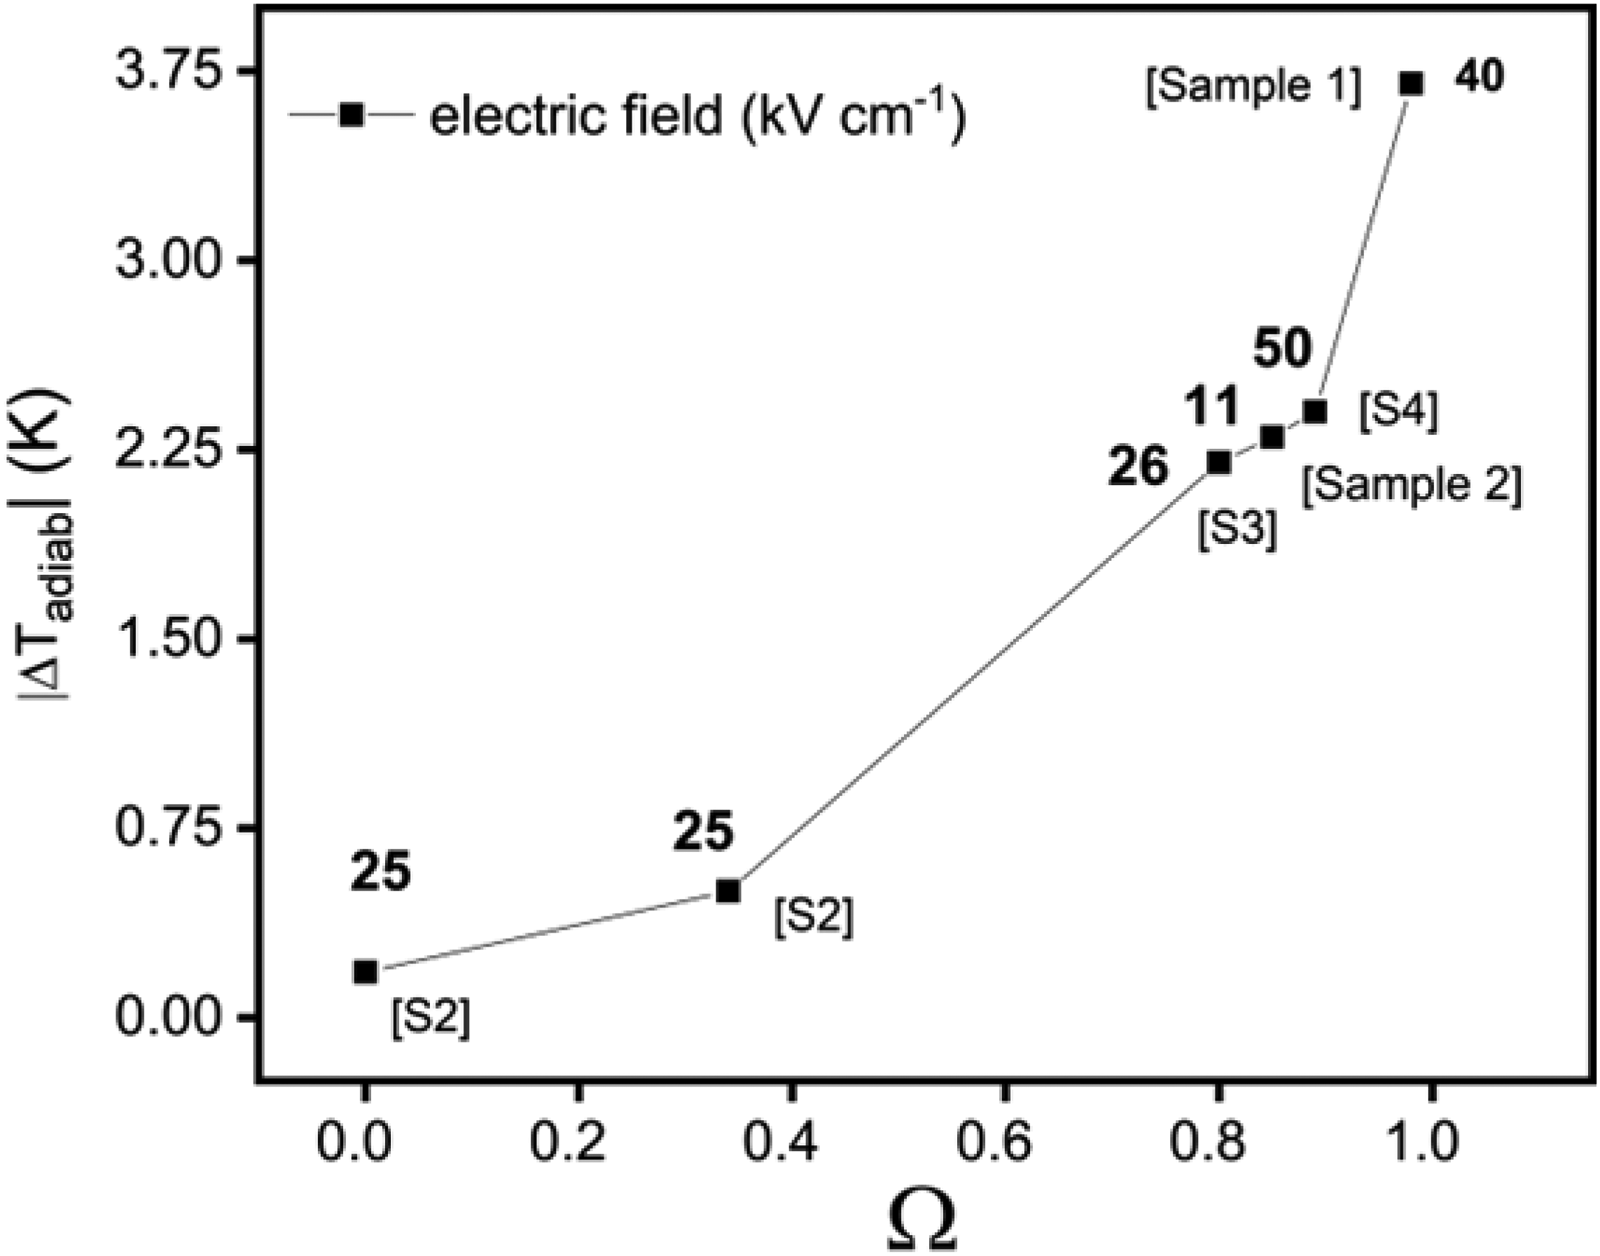
Adiabatic temperature change of bulk ceramics PST with different B-site cation order Ω (Supplementary Figure 7 in 70 ).
This is correlated with the larger d
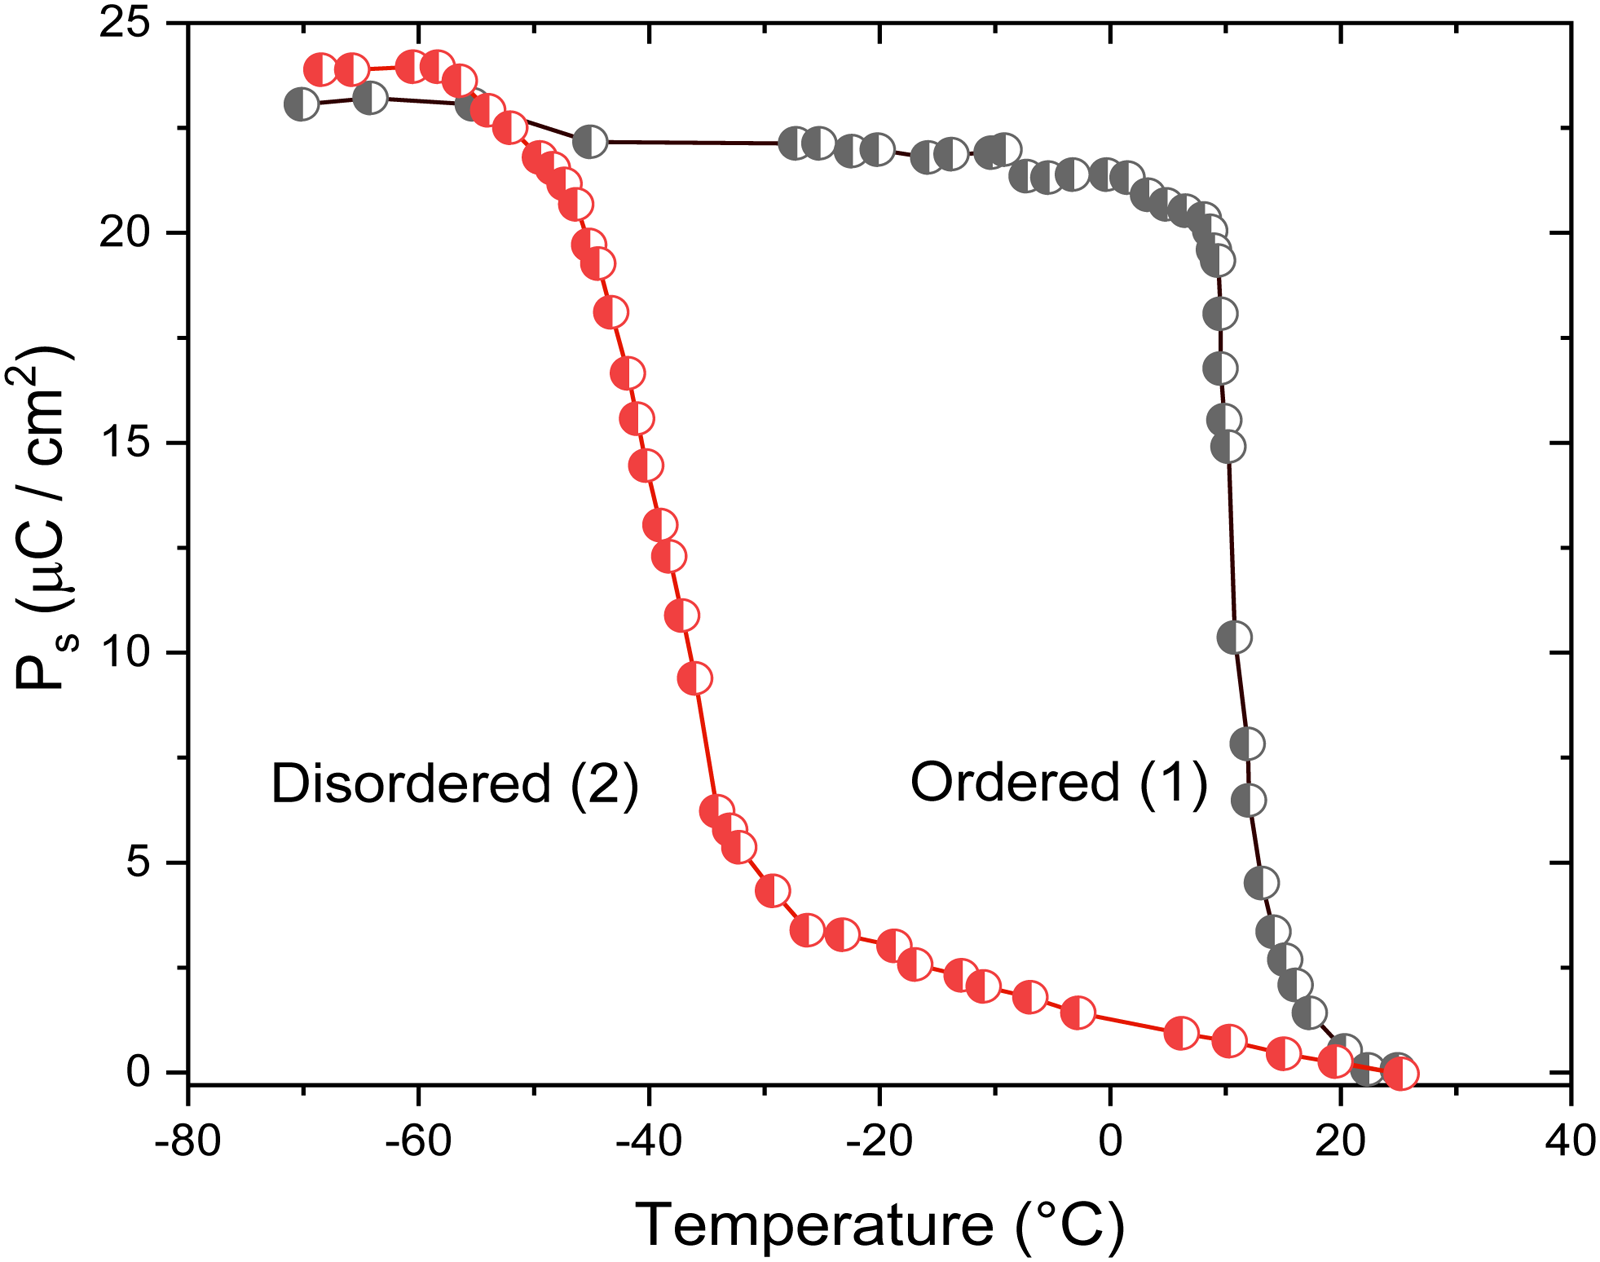
Polarization versus temperature on disordered and ordered lead scandium tantalate samples (graph replotted from 112 ).
Other lead-based perovskite materials
Lead zirconate titanate (PbZr1−xTixO3) PZT is a solid solution of PbTiO3 (PT) and PbZrO3 (PZ), whose properties and phase transitions can be tailored by adjusting its composition. For x ≈ 0.45–0.5, PZT exhibits a morphotropic phase boundary (MPB)113,114 separating the Zr-rich rhombohedral phase from a Ti-rich tetragonal phase. This composition near the MPB is preferred exclusively for piezoelectric applications because the piezoelectric constant and electromechanical coupling coefficient reach their maximum values at this phase boundary. 45
For pyroelectric applications, compositions close to PT (Ti-rich phase) or PZ (Zr-rich phase) are preferred due to their high pyroelectric coefficients115,116 and reduced dielectric constant and losses. 117 Additionally, doping plays a key role in enhancing the pyroelectric response and adjusting the Tc of PZT for specific applications. For instance, Zhang et al. 106 enhanced the pyroelectric coefficient of PZT 30/70 thin film from 2.1 × 10⁻⁴ C m−2 K−1 to 3 × 10⁻⁴ C m−2 K−1 by doping with 1% Mn for uncooled IR detector applications. Similarly, using Sn4+ doped PZT ceramics [Pb0.99 Nb0.02(Zr0.68,Sn0.25,Ti0.07)0.98O3] for non-linear pyroelectric energy harvesting, Olsen et al. 55 achieved an energy density of 0.3 J·cm−3 per cycle (Table 1). This is due to the field induced transition between the FE and AFE phase, resulting in the rapid release of charges and significant volume contraction.118,119
Moreover, it is possible to induce a transition from FE to a relaxor system in PZT system by means of doping with La3+ ions (7 to 9 mol.%), as the excess La3+ ions will break the long-range ferroelectric clusters into nano-polar regions. 120 Substituting Pb2+ with La3+ enhances electrical resistivities, reduces leakage currents,121,122 and lowers Tc, making the PLZT system suitable for pyroelectric energy harvesting. Lee et al. 123 investigated various La-doped PZT compositions and reported a maximum energy density of 1.01 J·cm−3 using 7/65/35 PLZT, which is indicated in Table 1.
Another interesting material for pyroelectric energy harvesting is Pb(Mg1/2Nb2/3)O3 – PbTiO3 (PMN-PT). PMN – PT undergoes a transition from rhombohedral FE phase to cubic PE phase when the PT concentration is below 20%.65,124 Additionally, PMN-PT exhibits a morphotropic phase boundary (MPB) for PT concentrations between 27–33%, characterized by a transition from the rhombohedral FE phase to the tetragonal FE phase, where large piezoelectric coupling coefficients have been reported. 125 It is important to note that PMN-PT can be fabricated as single crystals, ceramics, or thin films, and the material form significantly influences its functional properties. 126 PMN-PT single crystals near the MPB composition are of particular interest for piezoelectric applications due to their superior electromechanical properties.126,127 Furthermore, very high pyroelectric coefficients of 1070 μC m−2 K−1 have been observed for 109 oriented rhombohedral PMN-28PT and PMN-33PT single crystals.
Kandilian et al. 65 utilized PMN-32PT single crystals for non-linear pyroelectric energy harvesting and reported a harvestable energy density of 100 mJ·cm−3 per cycle for a 90°C temperature swing by taking advantage of the MPB region. However, the performance was limited by the low breakdown strength of the material. Recently, Pandya et al. 66 achieved a maximum energy and power density of 1.06 J·cm−3 and 526 W·cm−3 respectively, using PMN-32PT thin films (see Table 1).
Another prospective material for non-linear pyro-harvesting is Pb(Mg0.5W0.5)O3 (PMW), which undergoes a transition from AFE – PE phase at 36°C. The ionic radii and electronegativity values of Mg2+ and W6+ ions are similar to Sc3+ and Ta5+ ions in PST. 128 Furthermore, the large difference in the valence states results in an increase in electrostatic force between Mg2+ and W6+ ions, thus enhancing the ionic ordering. Li et al. 128 reported a large enthalpy change of 3.9 J g−1 at the Tc, which is nearly four times higher than that of PST 111 They attributed it to the large structural change between the orthorhombic AFE to the cubic PE phase at Tc.
Lead-free perovskite materials
BaTiO3 (BTO) ceramics are notable possibilities for electrocaloric and pyroelectric energy harvesting due to their strong first order transition, non-toxicity, and low cost. Li et al. 129 investigated the electrocaloric effect in BTO multilayer capacitors and reported a temperature variation of 0.9 K due to the FE – FE transition and 2.4 K at the FE – PE transition respectively. Interestingly, the latent heat of BTO at FE – PE transition is similar to that of PST (∼ 1 J g−1). 111 However, due to its high specific heat and the lower variation in polarization at higher fields, BTO exhibits a reduced electrocaloric effect compared to PST. BTO ceramics have a low pyroelectric coefficient (∼ 200 μC m−2 K−1) at room temperature and certain dopants such as Zr4+ and Sr2+ display an improvement in pyroelectric properties.130,131
Jian et al. 132 thoroughly investigated Ba(ZrxTi1−x)O3 (BZT) ceramics with different doping concentrations and stated that high entropy variation can be expected for x = 15 mol.% at the multiphase point. It was later confirmed by Qian et al. 130 that operating near the invariant critical point (ICP), where all the phases coexist, in BZT with x = 0.2 results in an increased number of available polar states (26 polar states), leading to a significant variation in entropy (8 J·kg−1·K−1), fulfilling a key requirement for pyroelectric energy conversion.130,133 Similarly, Ba1−xSrxTiO3 (BST) ceramics show a high pyroelectric coefficient 134 and significant electrocaloric effect of 1.8 K. 135 Sr2+ shifts the Tc to lower temperatures and at higher concentrations (x > 30 mol.%) the material becomes a relaxor. 136
Polyvinylidene difluoride based polymers
Apart from perovskite structures, ferroelectric polymers based on polyvinylidene fluoride (PVDF) are interesting for electro-thermal energy conversion due to their large variation in entropy near the transition, high dielectric strength, low density, flexibility, and ease of fabrication. PVDF has five distinct phases, and the polar β- phase 27 is the most desired one for electro-thermal energy conversion. The physical properties of these semi-crystalline polymers are highly dependent upon the internal crystal structure and nano-confinement effects. 137 High crystallinity and excellent ferroelectric properties are observed when PVDF is chemically modified with trifluoroethylene (TrFE) monomer as its chemical structure and size is similar to VDF. Further modification with chlorofluoroethylene CFE or chlorotrifluoroethylene CTFE increases disorder in the created terpolymers, as illustrated in Figure 18 by an increase in the distance between consecutive chains (l3 > l2 > l1). This induces a non-ergodic relaxor ferroelectric (RFE) behaviour. High entropy variation and giant ECE (12 K) has been reported for P(VDF-TrFE) and P(VDF-TrFE-CFE) polymers. 138 Extensive literature is available on PVDF based polymers for EC applications137–145 but there are limited studies for non-linear pyroelectric energy harvesting due to their large leakage currents.146–148 Recently, it was reported that a large variation in entropy (∼ 37.5 J·kg−1·K−1) can be obtained by introducing double bounds in P(VDF-TrFE-CFE). These high entropy polymers can be of interest for thermal energy conversion due to their enhanced crystallinity, high ΔS, very low hysteretic losses, reduced energy barriers for field switching and high breakdown fields. 140 Despite excellent ferroelectric properties, much attention must be paid to enhance the thermal conductivity of these compounds while integrating them into a device.
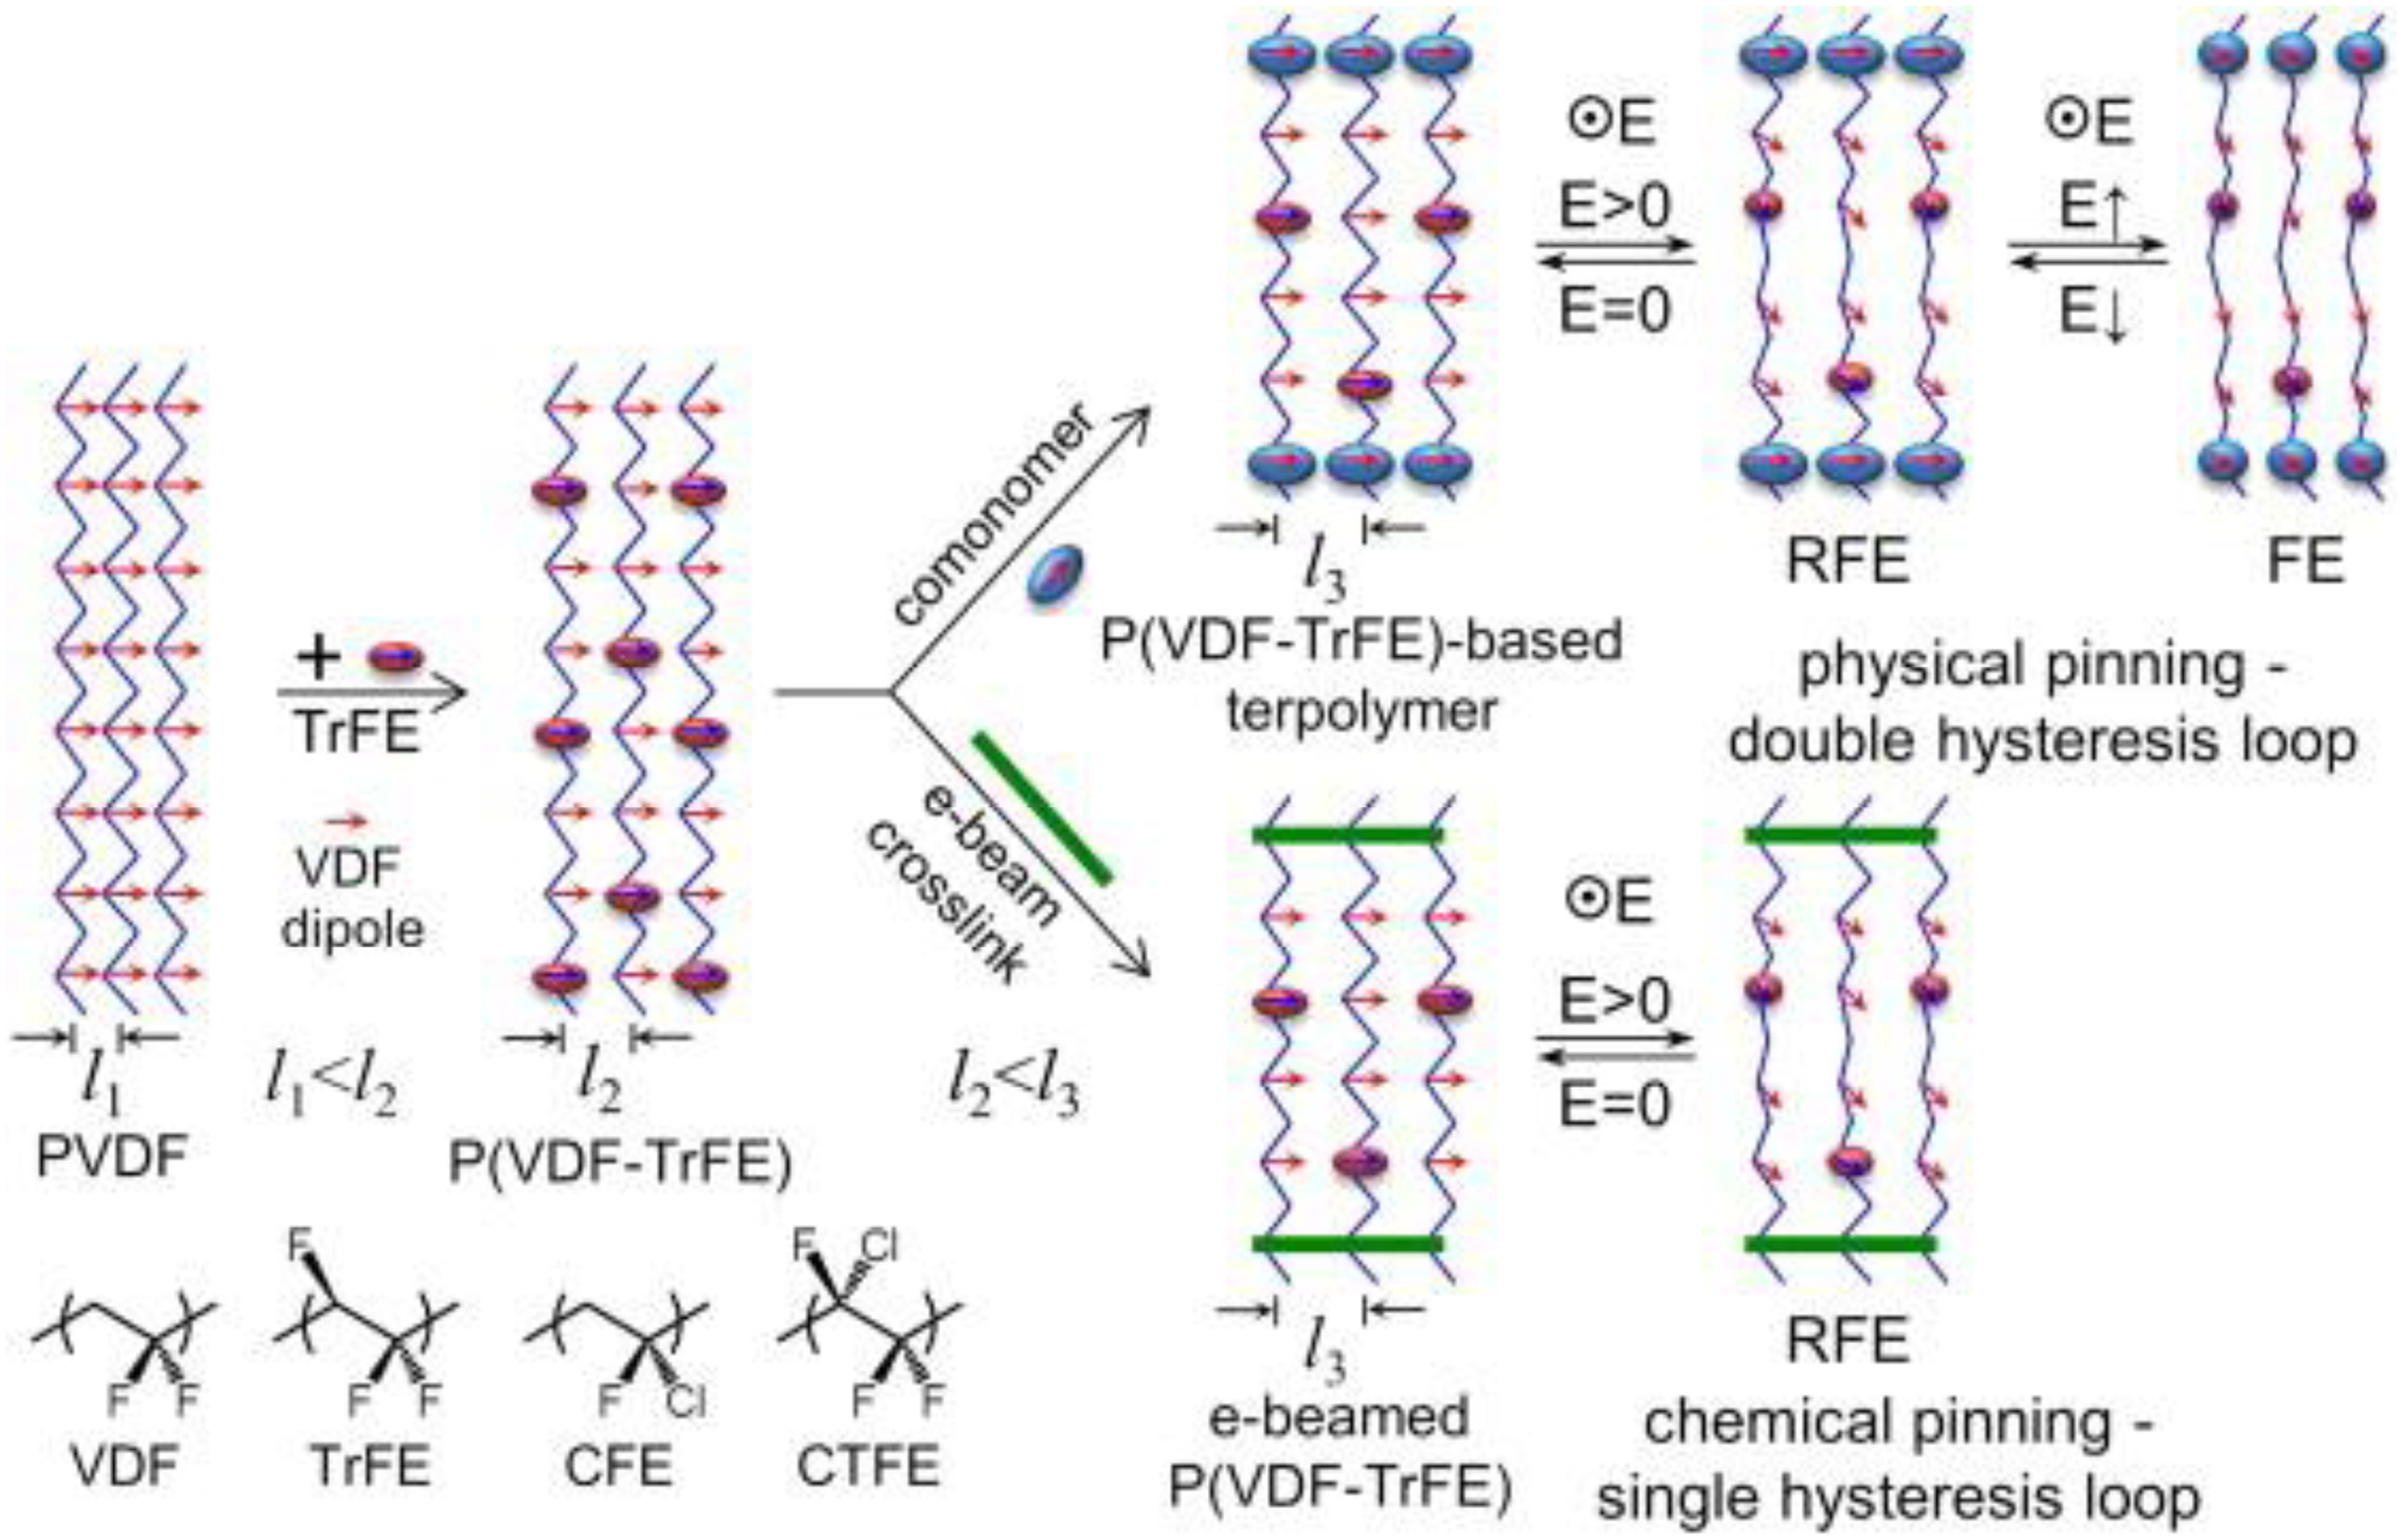
Schematic representation of P(VDF), P(VDF-TrFE) and P(VDF-TrFE) terpolymers. Adapted from. 137
Table 2 summarizes the properties and figures of merits that we disclosed earlier for different materials from the literature. By examining the pyroelectric coefficient of the materials in Table 2, it is evident that PMN – PT, PZT, PST and BST are excellent pyroelectric materials. The pyroelectric coefficient under a bias field is very high for PST (∼ 1165 μC·m−2·K−1) and BST (∼ 708 μC·m−2·K−1) ceramics. For the nonlinear figures of merit based on energy per cycle, Table 2 indicates that PST can yield approximately 2 J.cm−3 due to its high operating field (∼200 kV/cm). Additionally, HfO2 and P(VDF-TrFE) based polymers films can yield very high energy densities due to their large breakdown fields, which are an order of magnitude larger than PST MLCs.
Pyroelectric energy harvesting figures of merits for different materials.
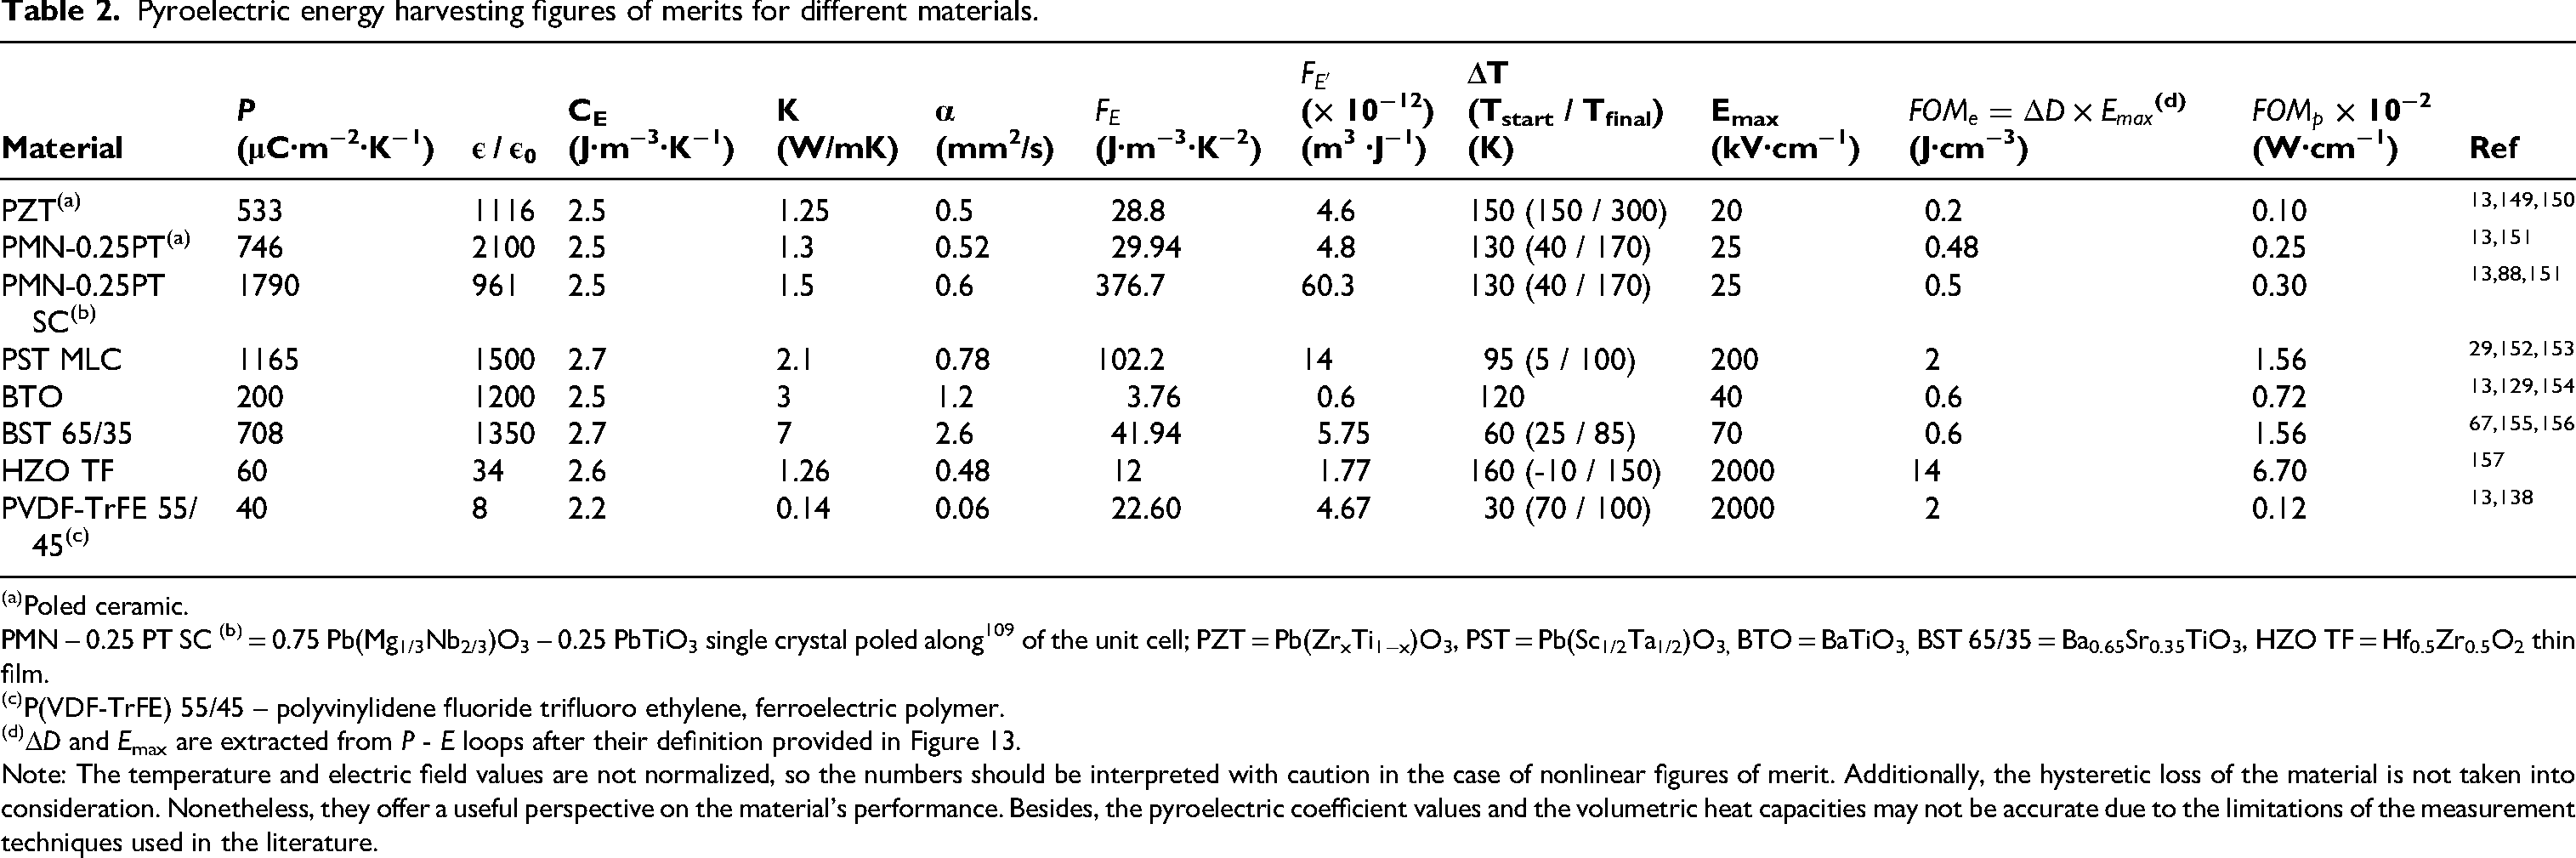
Poled ceramic.
PMN – 0.25 PT SC (b) = 0.75 Pb(Mg1/3Nb2/3)O3 – 0.25 PbTiO3 single crystal poled along 109 of the unit cell; PZT = Pb(ZrxTi1−x)O3, PST = Pb(Sc1/2Ta1/2)O3, BTO = BaTiO3, BST 65/35 = Ba0.65Sr0.35TiO3, HZO TF = Hf0.5Zr0.5O2 thin film.
P(VDF-TrFE) 55/45 – polyvinylidene fluoride trifluoro ethylene, ferroelectric polymer.
ΔD and Emax are extracted from P - E loops after their definition provided in Figure 13.
Note: The temperature and electric field values are not normalized, so the numbers should be interpreted with caution in the case of nonlinear figures of merit. Additionally, the hysteretic loss of the material is not taken into consideration. Nonetheless, they offer a useful perspective on the material's performance. Besides, the pyroelectric coefficient values and the volumetric heat capacities may not be accurate due to the limitations of the measurement techniques used in the literature.
Furthermore, the proposed figure of merit for power per cycle offers insights into a material's performance in a harvesting device. BST ceramics, with their high thermal conductivity (> 7 W/mK), resulting in similar figure of merit values for power per cycle to PST MLCs, despite their lower energy density. Compared to lead based ceramics, lead free ceramics possess a higher thermal diffusivity, which can significantly boost power output.
The very low FOMp of PVDF could be compensated by using very thin layers, considering that the characteristic time to exchange heat is proportional to (thickness)²/diffusivity.
The main conclusions of Table 2 are multiple. First, we see that the linear FOMs FE and FE’ provide numbers that are substantially different from the FOMs specific to non-linear pyroelectric materials, namely FOMe and FOMp. While single crystals of PMN-PT are by far the best materials according to FE and FE’, FOMe and FOMp show there are much better materials. Indeed, moving towards thin films is beneficial, as it allows the application of high electric fields. However, films deposited on a substrate are not ideal, since the absolute values of generated energy and power remain extremely low. Besides, using materials with high thermal conductivity significantly enhances power generation, which makes polymers less suitable for this purpose. Finally, lead-free perovskite ceramics appear particularly promising, as they offer both large polarization variations and higher thermal conductivity compared to their lead-based counterparts.
Influence of material losses
One specific challenge in pyroelectric energy harvesting is to reduce the material losses, particularly the hysteresis and leakage current as they diminish the harvestable energy area. The net electrical energy area is larger in a material with low electrical hysteresis compared to a material with high hysteresis, as it is defined by the shaded area between the two isothermal D-E loops as shown Figure 19. As mentioned earlier, the energy density can be calculated using
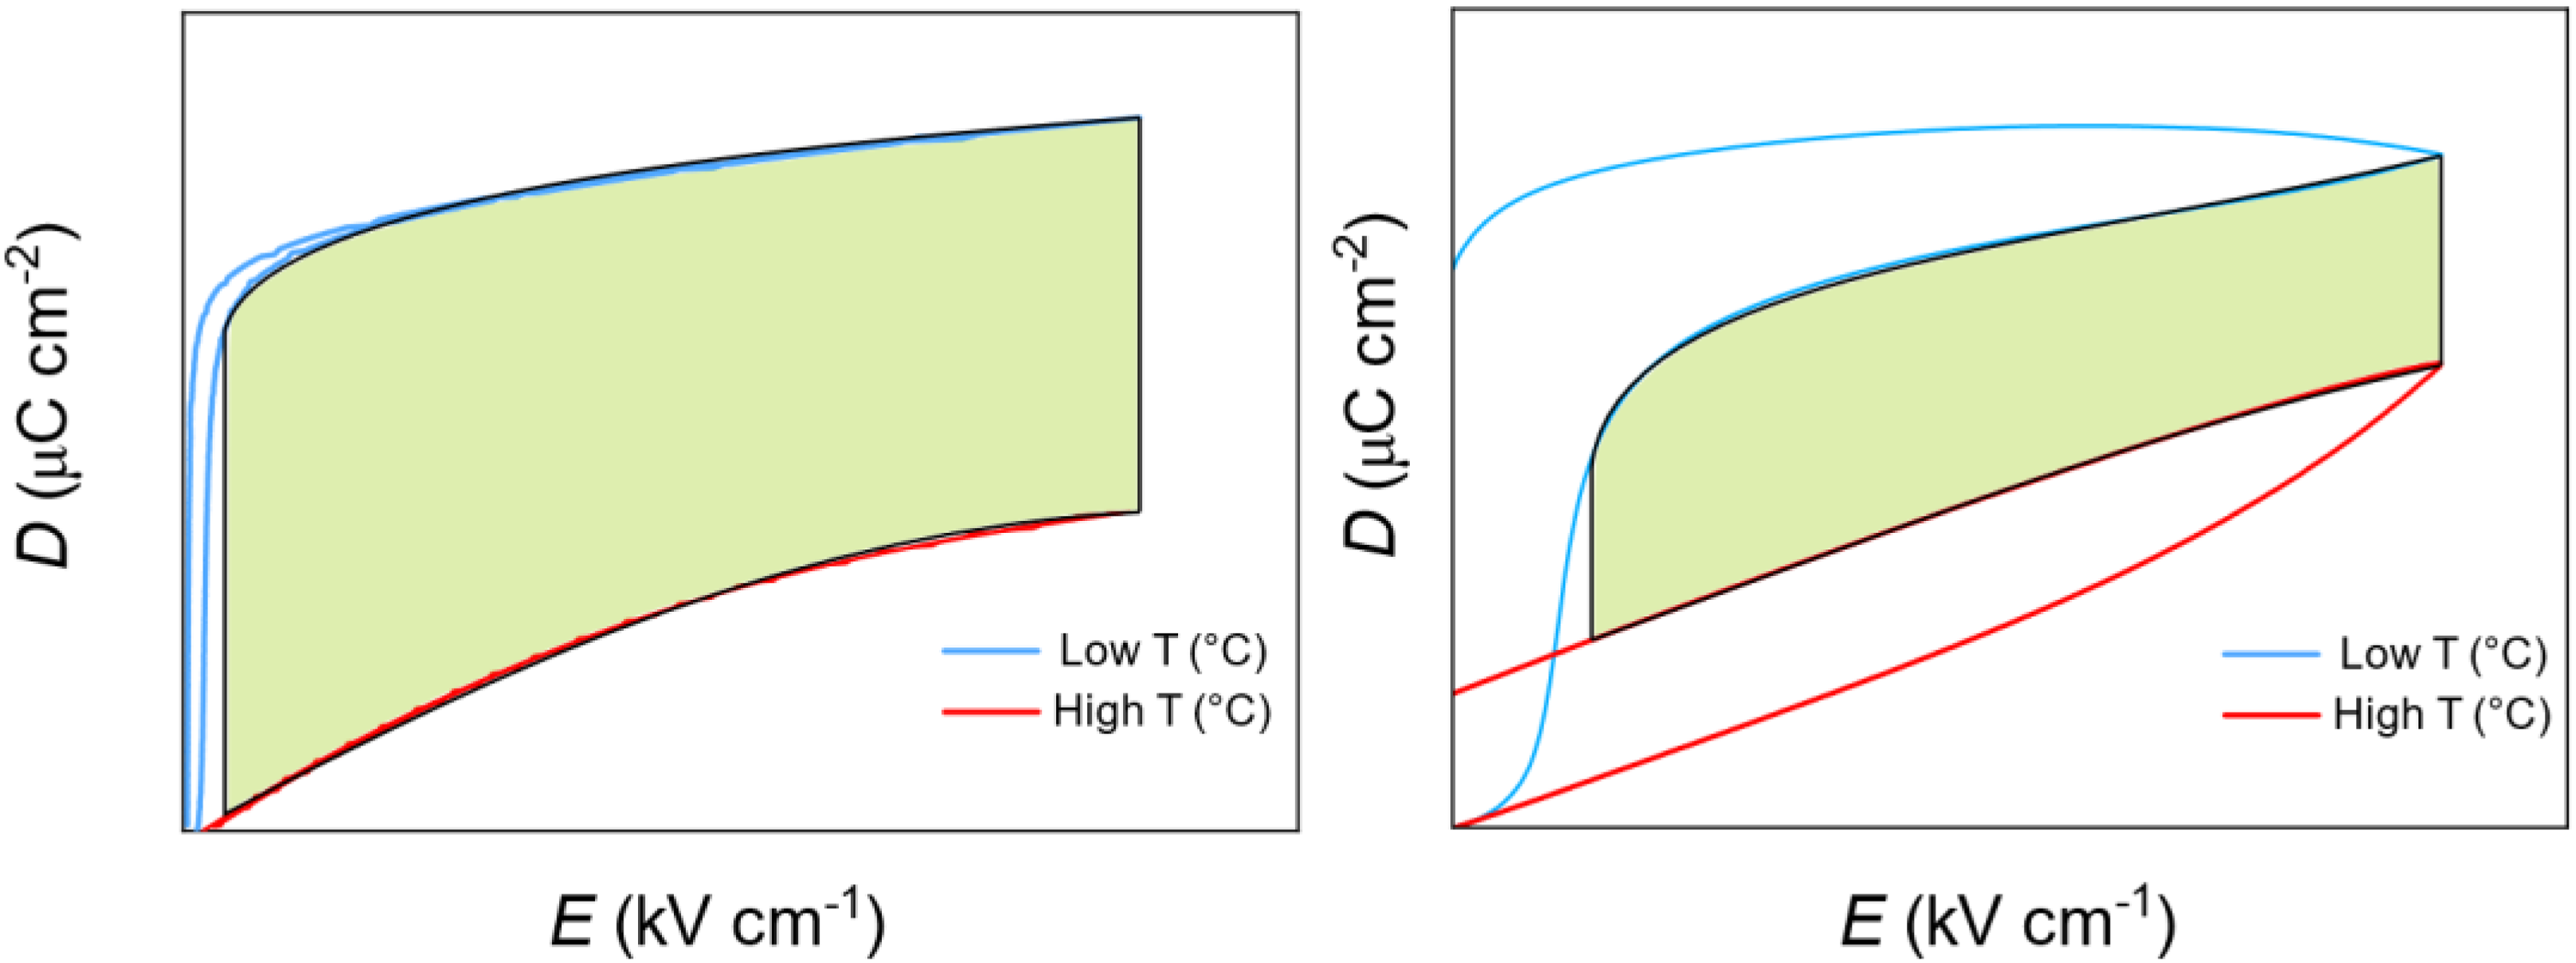
Schematic of a unipolar D-E loop of a ferroelectric with low hysteresis (left) and high hysteresis (right). The shaded area represents the harvested energy
Khodayari et al. 42 simulated an Ericsson cycle at intermediate fields between 25 and 50°C using a PZN - 4.5PT single crystal. They observed that the energy supplied to the system is more than the energy harvested due to the hysteresis induced at the FE – FE transition. This hysteresis caused a crossover between the polarization curves in the limited temperature range, leading to lower energy output. Depending on the electrical and thermal history of the sample, the temperature range, frequency and electric field strength for the cycle must be carefully selected. For instance, if the applied electric field is lower than the minimum field required to induce a reversible phase transition, the ferroelectric material cannot fully cross the hysteresis region, resulting in an irreversible phase transition. This in turn decreases the harvesting potential of the material. 158
Since the resistance of a dielectric material is finite, when the material is electrically and thermally cycled at large fields, some of the charges accumulated on the surface of the material traverse through its body over time, resulting in leakage currents. Due to the latter, the stored charge Q(V,T) cannot reach the initial state of the previous thermodynamic cycle, ultimately diminishing the size of the enclosed area and eventually causing the electricity production to decrease. Olsen 54 demonstrated the effects of conduction and its influence on the charge – voltage characteristics of the sample by placing a resistor in parallel, which leads to the broadening of the loops. Due to the conduction effects, the area between the two loops diminishes. Both the hysteresis and the Joule heating power loss leads to a reduced energy producing gap. To obtain a high energy output, the material must have low hysteresis and leakage current. Lheritier et al. 29 achieved a high energy density of 4.4 J/cm3 using PST MLCs due to their low hysteresis and very low leakage currents (< 10−7 A at 195 kV/cm up to 180°C, corresponding to a current density < 2.2 10−8 A/cm²), as shown in Figure 20 (a) and (b) respectively.
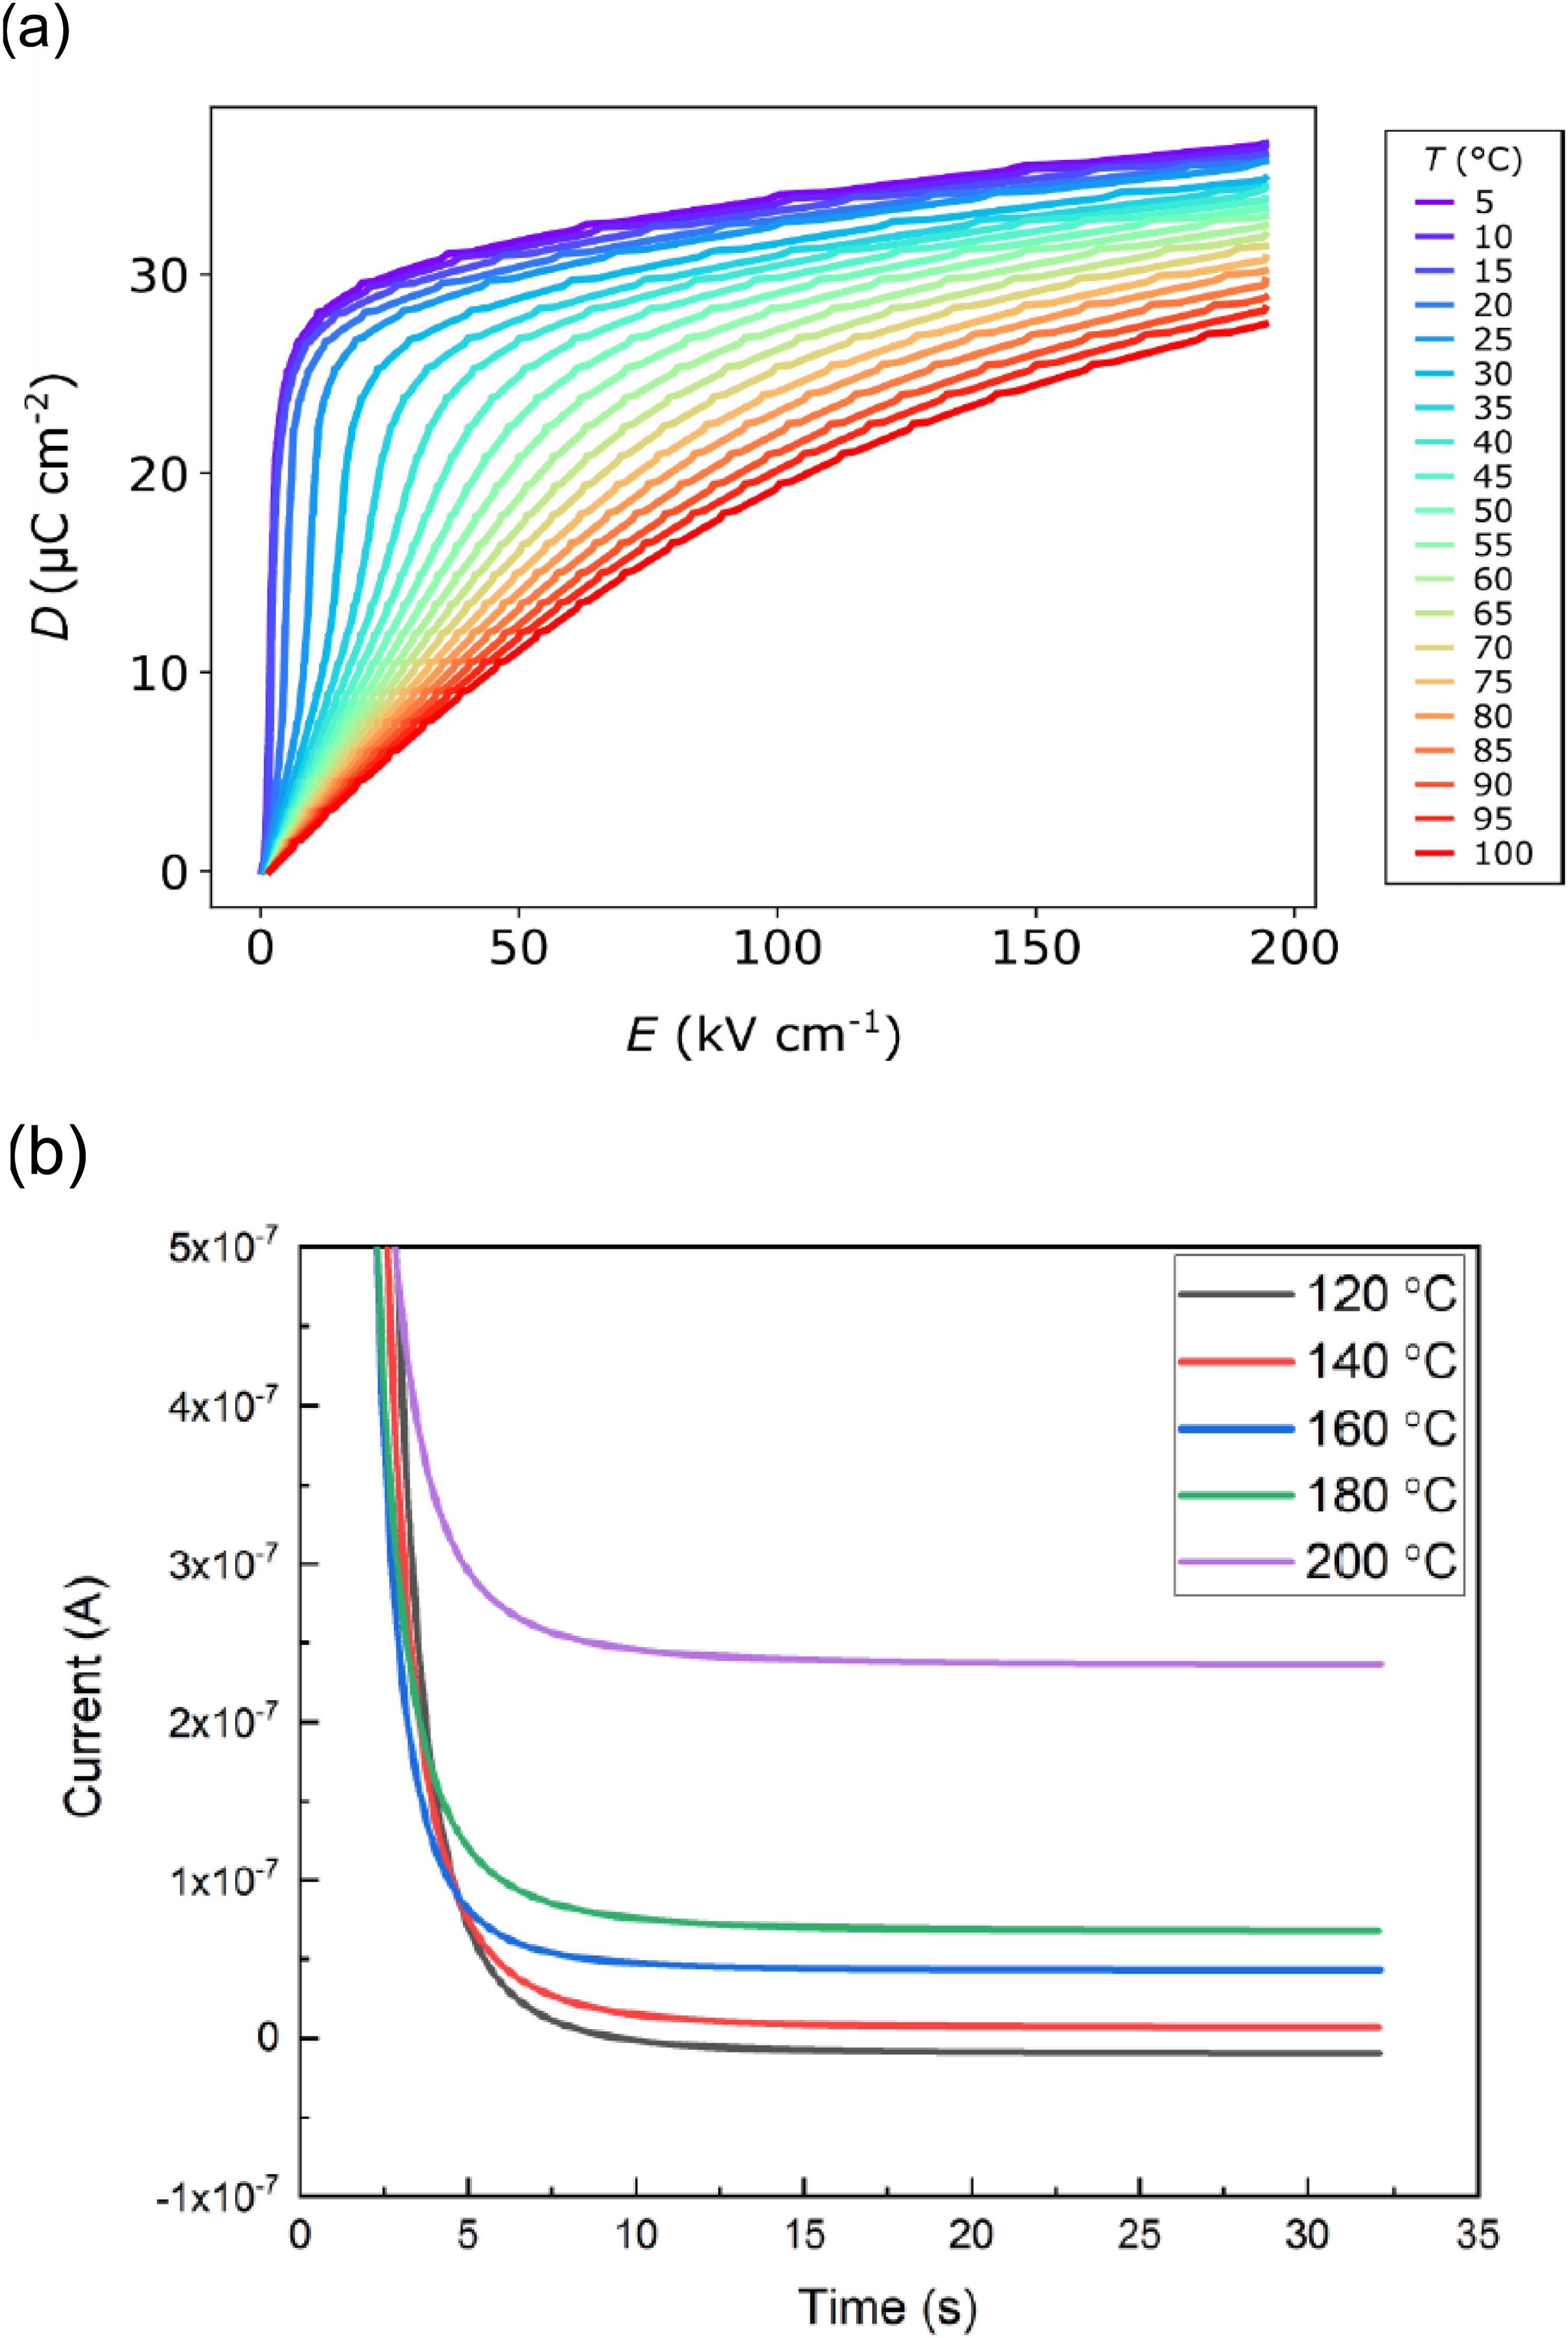
(a) unipolar D-E loops of PST multilayer capacitors at different temperatures at 195 kV cm−1. (b) Leakage current time evolution data of PST multilayer capacitors under an electric field of 195 kV/cm after fitting with Curie-von Schweidler empirical law. Adapted from. 29
Influence of material aging on electrothermal energy harvesting
The lifetime of a pyroelectric material for energy harvesting is determined by its aging and fatigue behaviour. The characteristic hysteresis loop of fatigued and aged sample is illustrated in Figure 21. The aging phenomena results in the degradation of properties over time when no external mechanical or electrical load is applied. In the specific case of ferroelectric pyroelectric materials (which stands for the vast majority of cases), it can be evidenced from the deformation of the hysteresis loops as well as decrease of maximum polarization, strain, and permittivity. 159 The most common reason for aging in ferroelectrics is attributed to the rearrangement of charged defects and their interaction with the polarization in bulk and at domain walls. On the other hand, fatigue stems from the repetitive application of external loads resulting in the reduction of switchable polarization of the material. It predominantly depends on the external boundary conditions. The common cause of fatigue is attributed to the agglomeration of point defects such as oxygen vacancies at the grain boundaries. Nevertheless, it is possible to partially or completely recover the initial properties by reannealing the sample at temperature above activation temperature of charge mobility or above Tc. 159 Despite various proposed mechanisms, the microscopic origin of aging and fatigue is still under debate.160,161 Besides it also depends on various factors such as microstructure, doping levels, crystallographic structure, and external parameters including temperature, mechanical pressure, and the bias field. 159
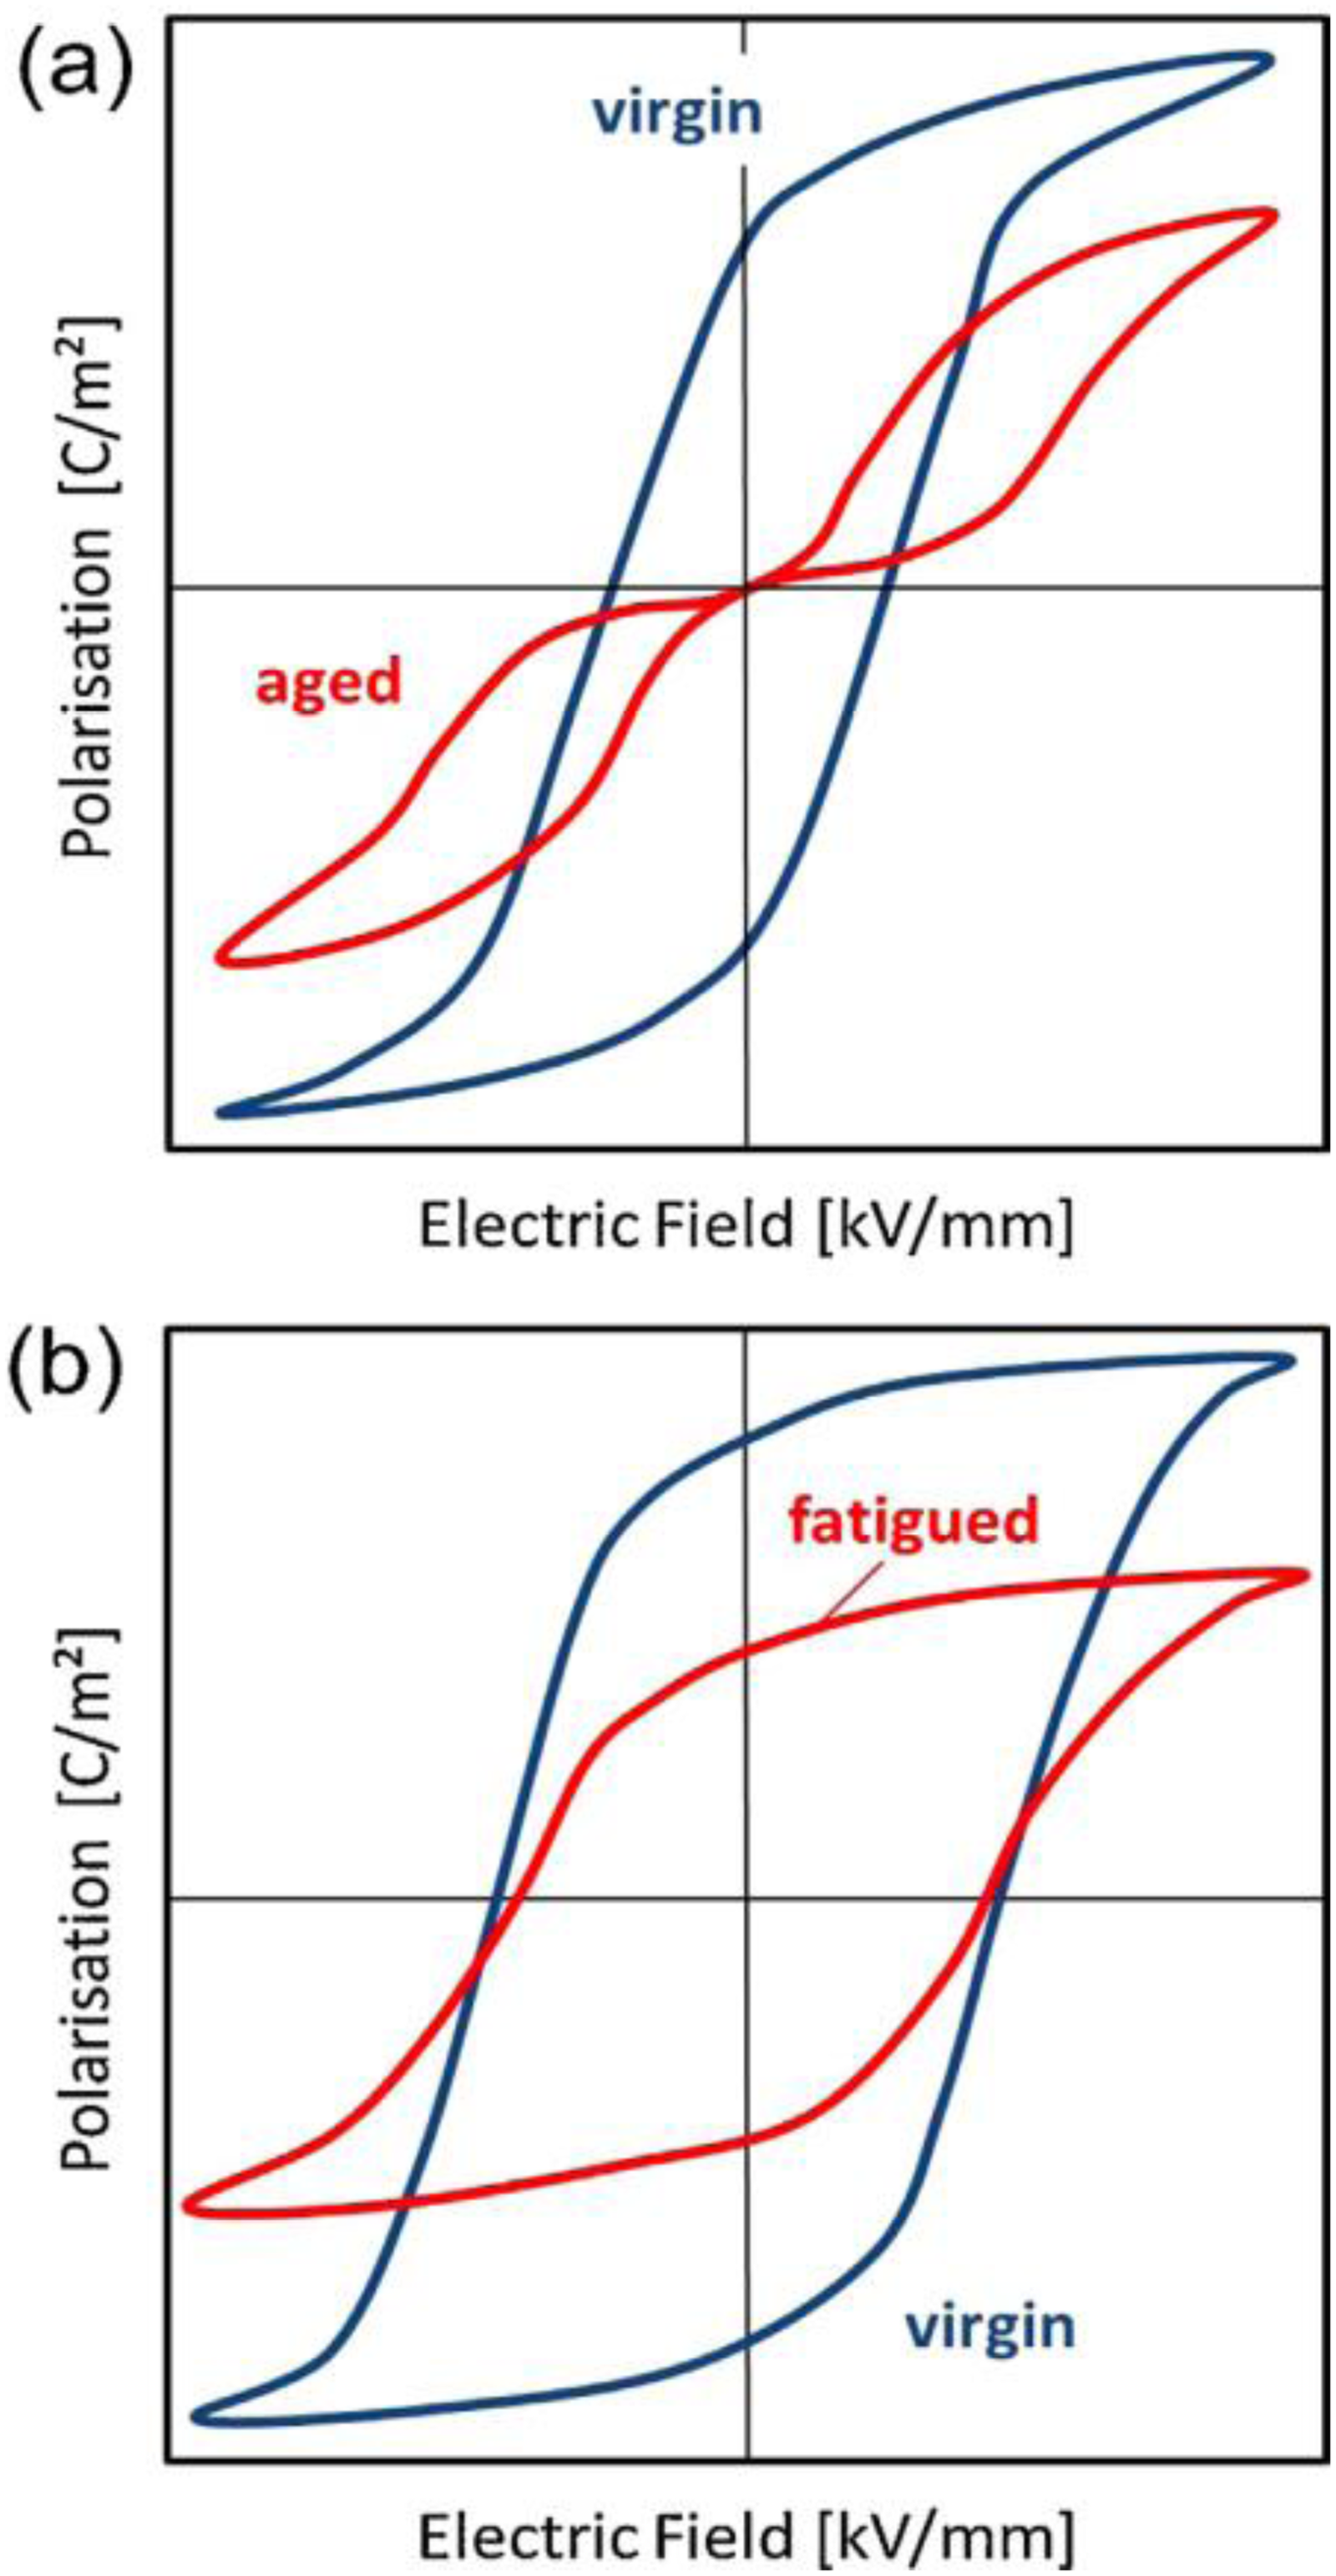
Schematic of macroscopic degradation in ferroelectrics due to (a) aging - typical of acceptor doped materials (b) fatigue – predominant in donor doped materials. Adapted from. 159
However, literature addressing material reliability during non-linear pyroelectric energy conversion remains limited. For instance, Chin et al. 122 observed a slight decrease in energy (from 300 to 250 J/L/cycle) and power densities (from 43 to 40 W/L) in PLZT 9.5/65/35 samples following 72 successive Olsen cycles at 0.15 Hz between 23 and 140°C (see Figure 22(a)). The low and high fields were EL = 0.2 MV·m−1 and EH = 5 MV·m−1. This was attributed to the onset of stress-induced cracking. They observed a decrease in electric displacement span at lower fields and postulated that the polarization loss directly correlates with the crack volume (see Figure 22(b)). Though it is true that electrical fatigue induces microcracking due to internal stresses between grains, thermal expansion anisotropy or stress due to large electric fields, a comprehensive microstructural analysis was missing in their study. It would be interesting in the future to correlate the microstructural changes and the fatigue behaviour of the material due to the electrical and thermal cycling. To date, there are no reports on the fatigue/aging phenomena of macroscopic pyroelectric harvesters. Note that the pioneering work of Olsen on his large energy harvester showed that this prototype could only be run over 21 cycles, and only then by adjusting the conditions between each cycle. 84 Therefore, reliability was not good enough in this work to assess any aging/fatigue. We can also gain some insights into the fatigue behaviour of ferroelectric materials and their impact on thermal energy harvesting by reviewing the literature on electrocaloric fatigue characteristics.
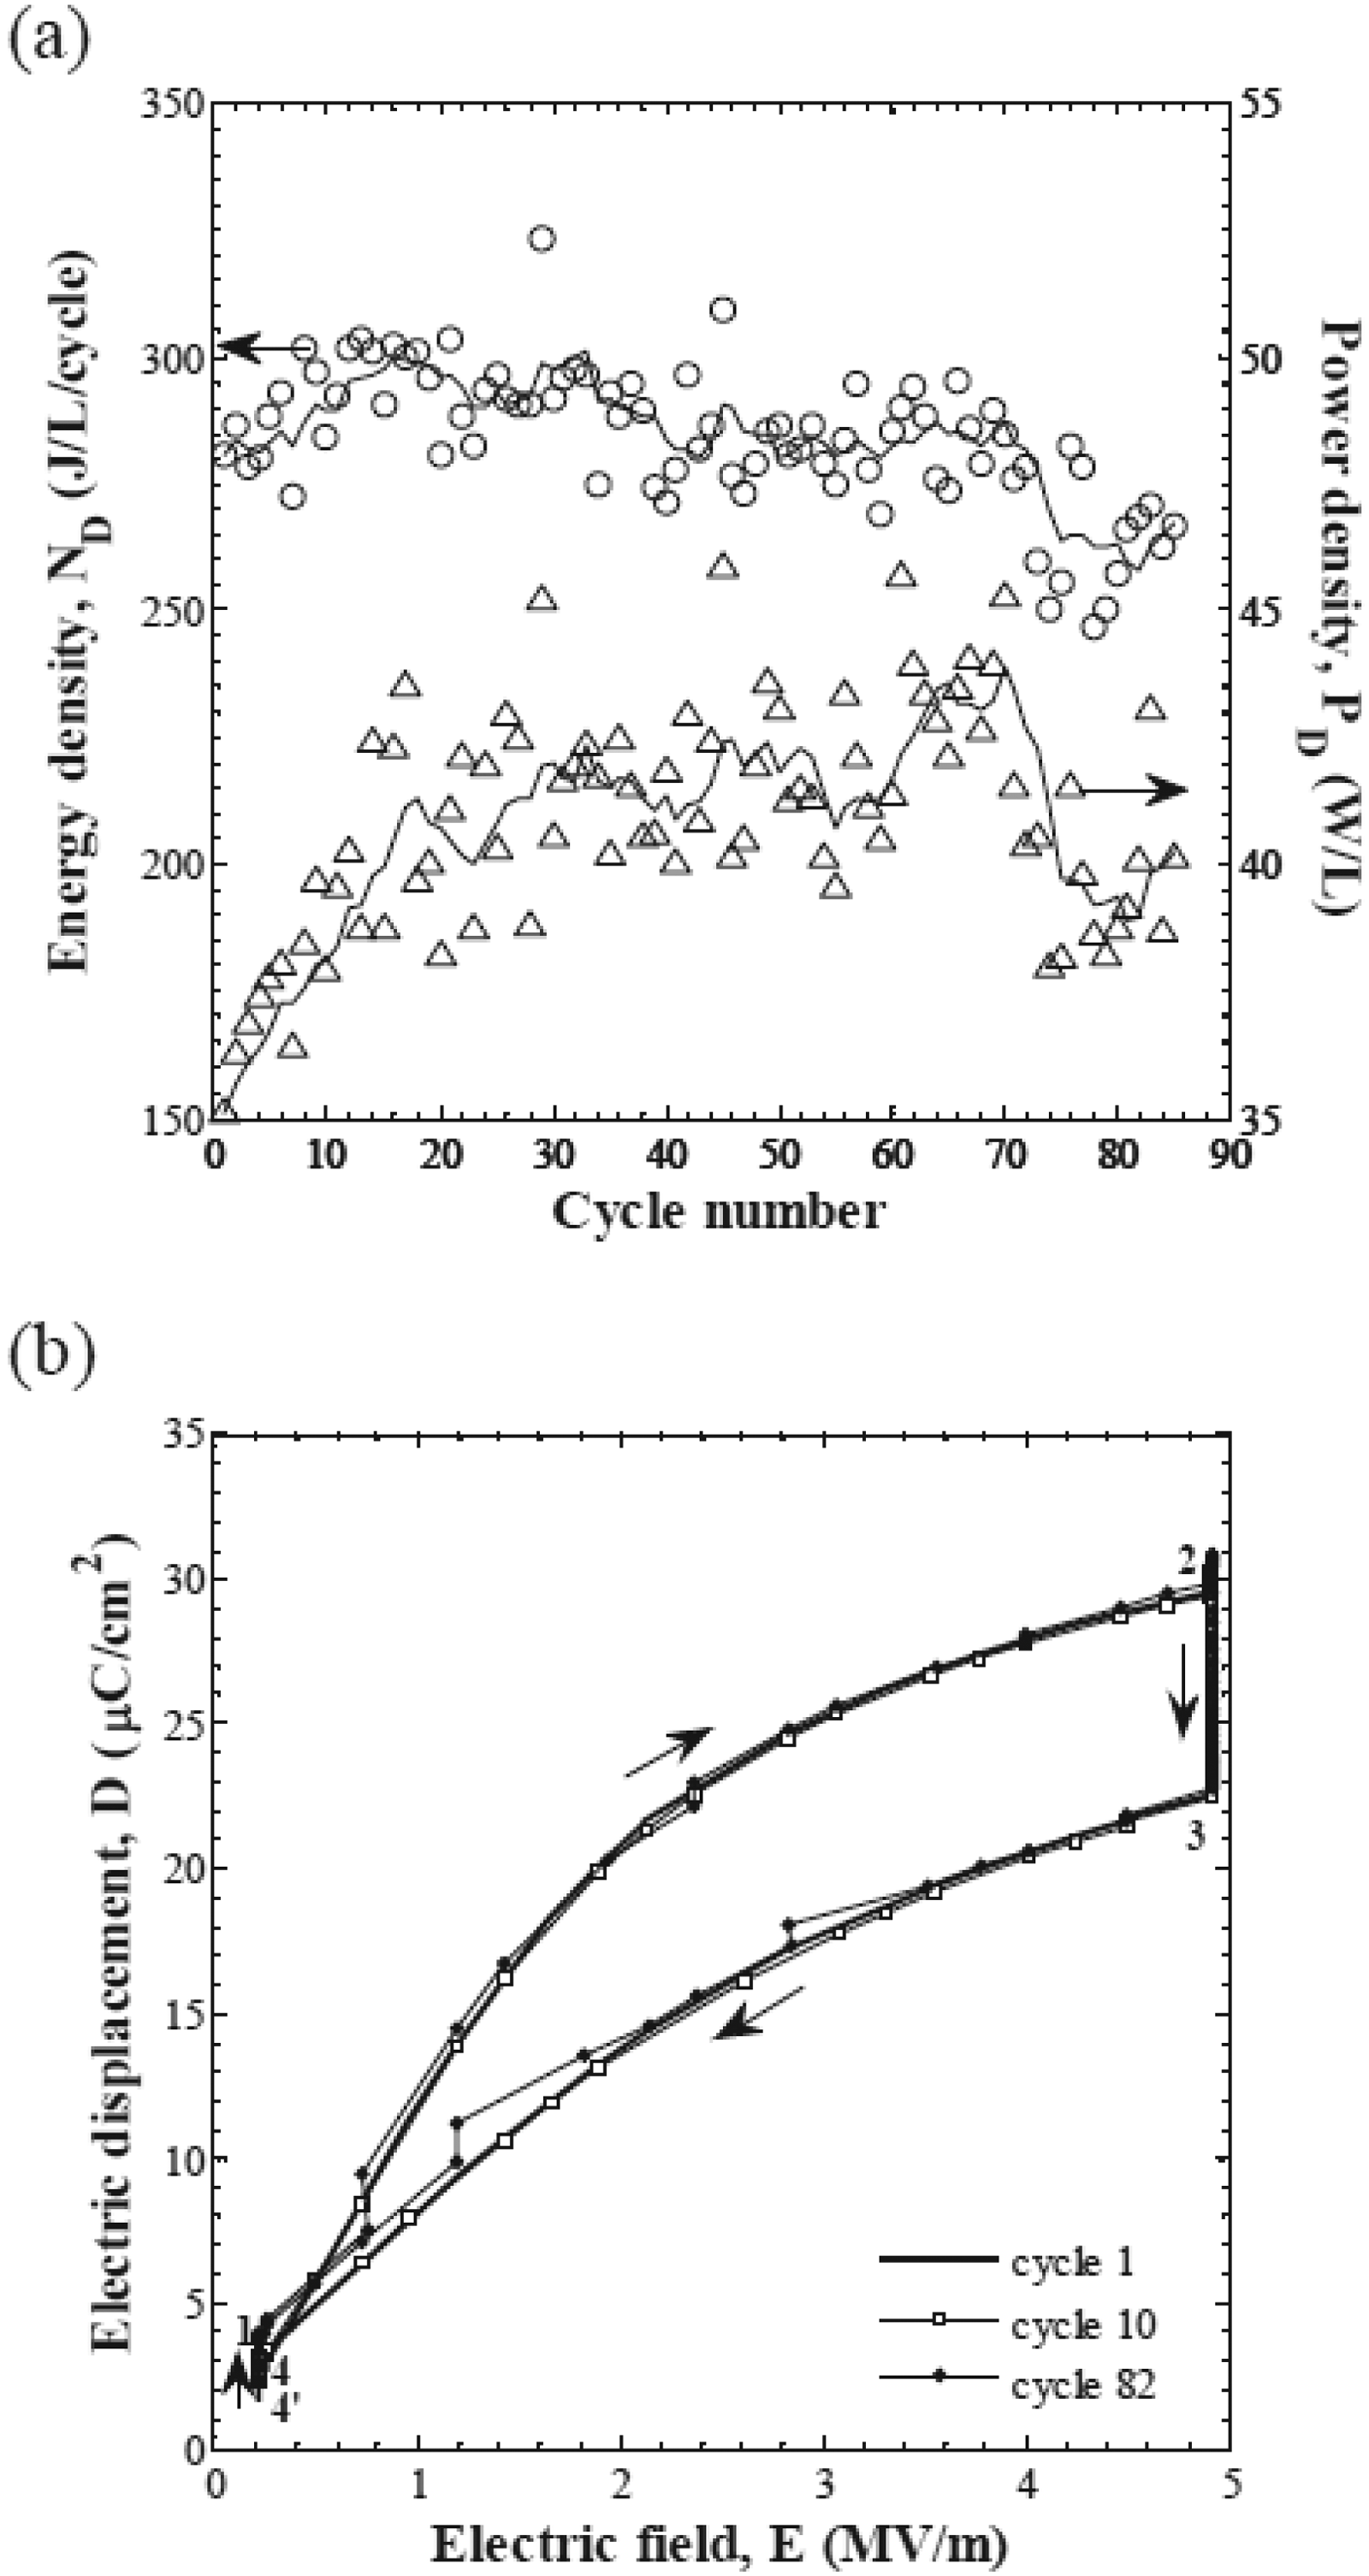
(a) energy and power densities generated by 9.5/65/35 PLZT as a function of cycle number. (b) D-E loops of Olsen cycles collected after different numbers of cycles. 122
Recently, Bradeško et al. 162 investigated the electrocaloric fatigue mechanism of PMN under unipolar square waveforms (70 kV·cm−2, 2 Hz) at room temperature. Beyond 2.8 × 10⁴ cycles, significant Joule heating increased the sample temperature, and specific resistivity decreased by three orders of magnitude. This was attributed to enhanced grain boundary conductivity driven by the field-induced rhombohedral FE phase, which facilitates charge drift. Such leakage current is highly detrimental to electrocaloric and PEC applications.
In another study, Fulanović et al. 163 studied the reliability of PMN MLCs. The electrocaloric effect decreased by 1% after 106 cycles at 110 kV·cm−1. Besides no microcracks were observed at the tip of the electrodes which is typically expected due to the strain incompatibility. 161 The fatigue of PST MLCs against cyclic loading has recently been studied by Li et al. 73 using unipolar rectangular electric pulses with an amplitude of 400 V at 10 Hz and a 50% duty cycle. They observed less than 2% decrease in EC response after 4 × 10⁶ cycles.
These studies highlight the importance of understanding the effects of cyclic loading and fatigue in ferroelectric materials, especially under the large electric fields and temperature swings encountered in non-linear pyroelectric energy harvesting. When a ferroelectric is subjected to such conditions, it will experience both electric field and thermally induced fatigue after a certain number of cycles. Electric field induced fatigue cracking growth mechanism has been studied using PZT and PLZT ceramics. 164 By subjecting the materials to alternating electric fields above coercive field, crack propagation was observed normal to the field because of strain mismatch placing the crack front under tension. Detailed crack propagation models and fatigue studies, especially using multilayer capacitor geometry, are crucial to better understand the long-term reliability of these materials under cyclic loading. Another aspect overlooked in the literature is the material's thermal fatigue. It was pointed out by Hoh 23 that the ferroelectric must possess a high thermal shock resistance 165 for a long operation lifetime. It would be worthwhile in the future to investigate the thermal shock resistance of these materials and develop new models for multilayer capacitors to correlate their behaviour when subjected to electro-thermal cycling.
Macroscopic prototypes for electrothermal energy harvesting
In the 1980's, Olsen et al. built several regenerative macroscopic prototypes. The first prototype consisted of twenty-four Sn-doped Pb(Zr,Ti)O3 ceramic wafers (24 × 24 × 0.25 mm thick) in a stack with 0.25 mm spacing. 51 Heat was transferred from the heater to the aluminium heat sink via silicone oil, and to prevent heat leakage, the prototype was sealed inside a teflon block. While true energy breakeven was not achieved, an energy output of 130 mJ.cm−3 per cycle and a power output of 40 mW were obtained with ΔTspan of 33 K and a frequency of 0.13 Hz. The detailed experimental conditions can be found in Table 3. Additionally, the regenerative approach showed a two-thirds increase in efficiency compared to the non-regenerative case.
Performance of pyroelectric energy harvesting devices when subjected to olsen cycle
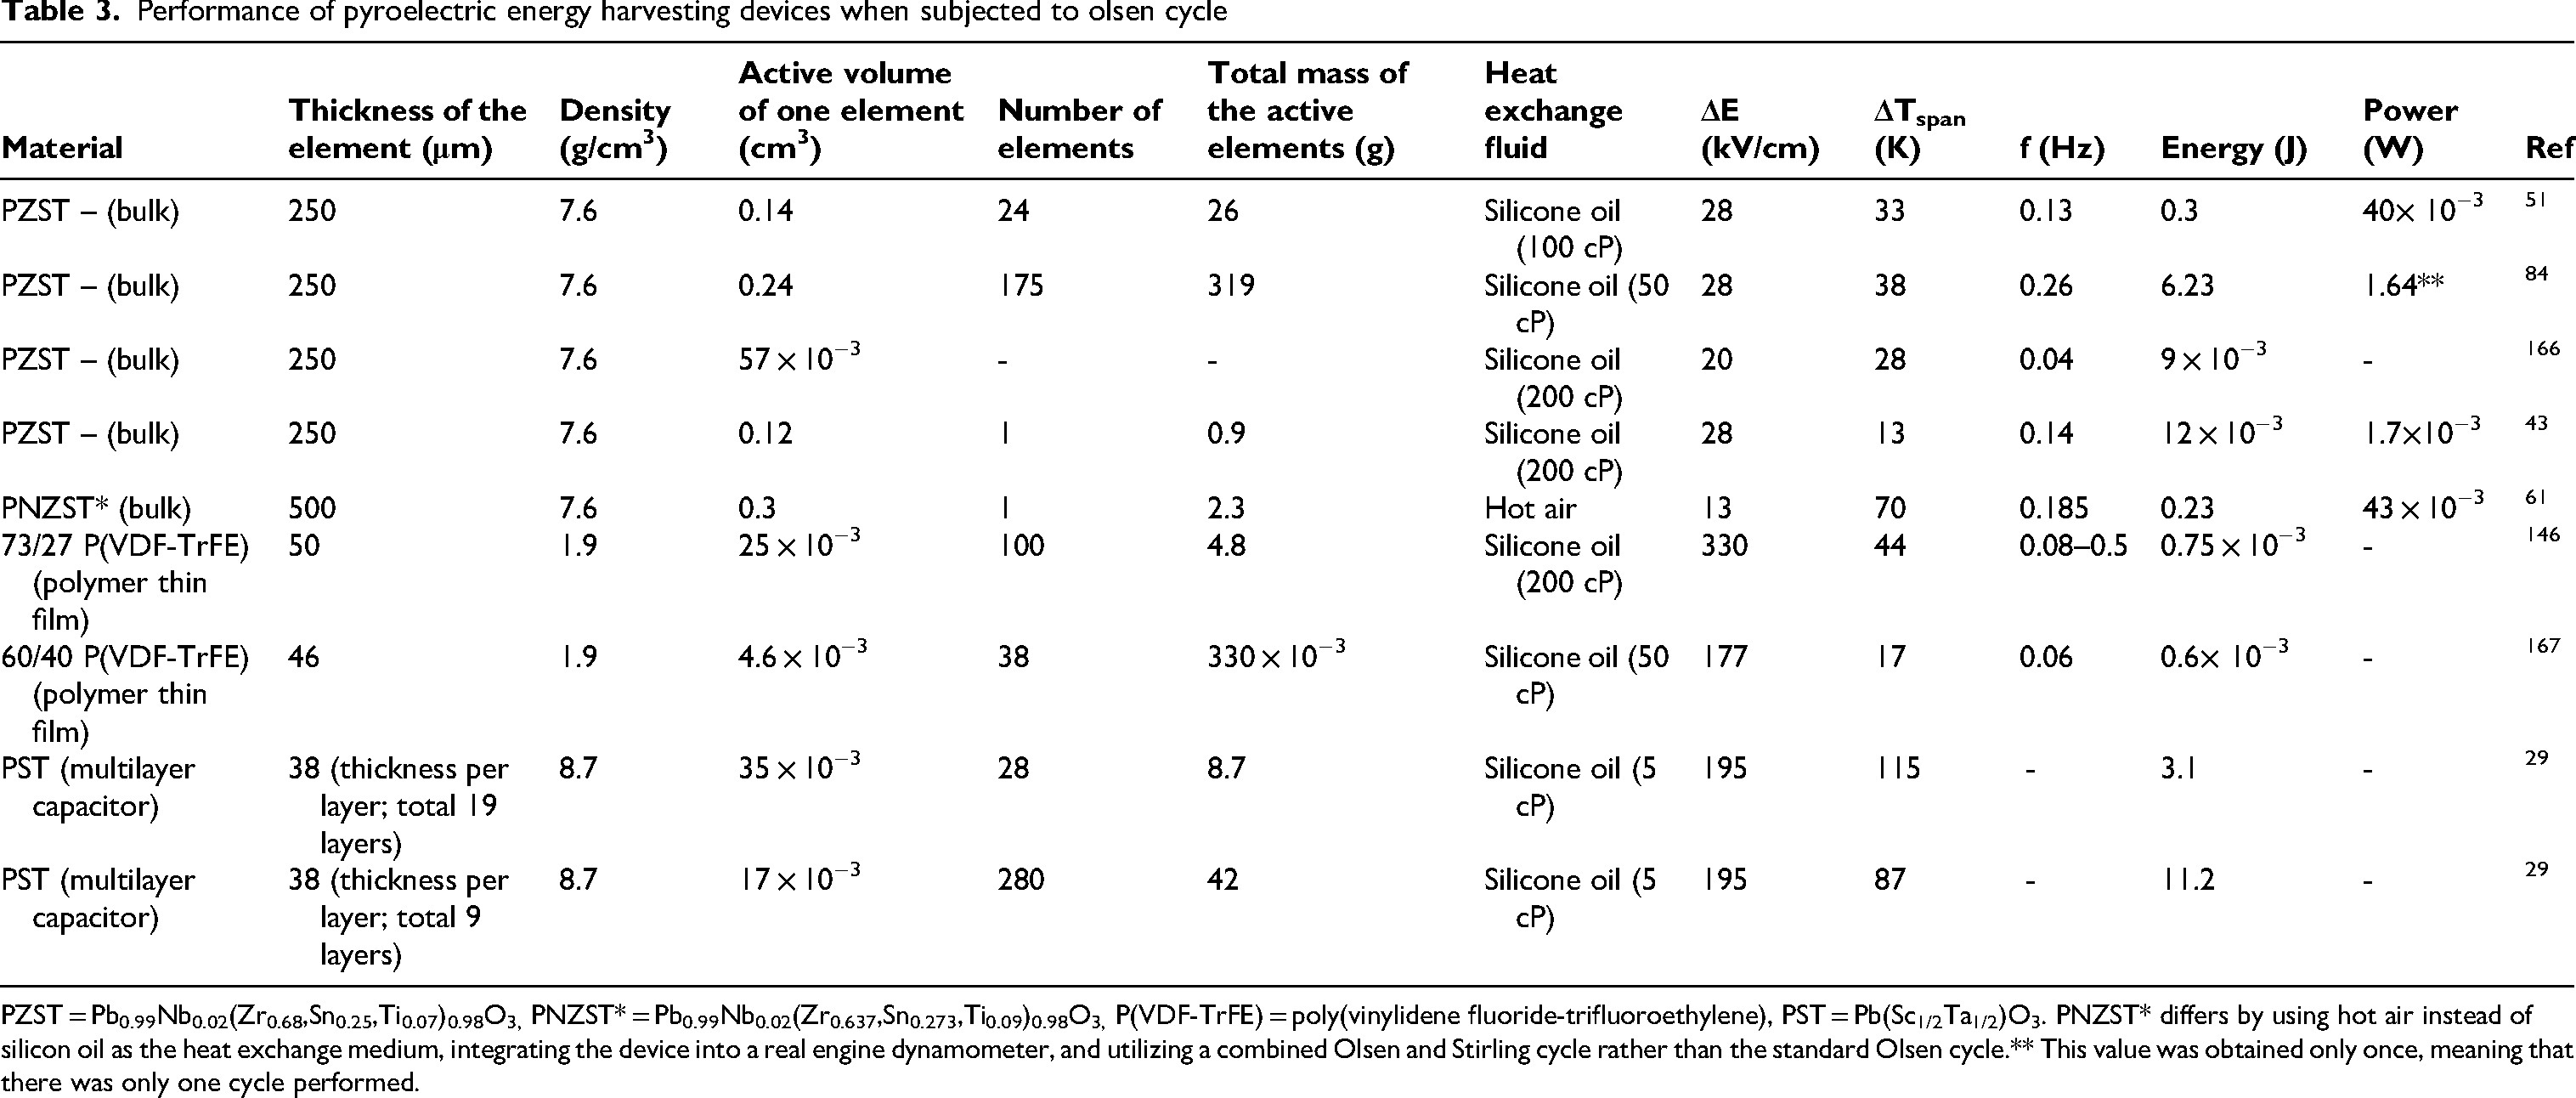
PZST = Pb0.99Nb0.02(Zr0.68,Sn0.25,Ti0.07)0.98O3, PNZST* = Pb0.99Nb0.02(Zr0.637,Sn0.273,Ti0.09)0.98O3, P(VDF-TrFE) = poly(vinylidene fluoride-trifluoroethylene), PST = Pb(Sc1/2Ta1/2)O3. PNZST* differs by using hot air instead of silicon oil as the heat exchange medium, integrating the device into a real engine dynamometer, and utilizing a combined Olsen and Stirling cycle rather than the standard Olsen cycle.** This value was obtained only once, meaning that there was only one cycle performed.
In 1984, Olsen et al. 84 built a multistage device by tailoring the Tc of Sn-doped Pb(Zr,Ti)O3 ceramics through doping with different concentrations of Sn (see Figure 23). Four sections with different Tc were used, corresponding to the concept of cascading. To improve the performance of their previous device, 51 subtle changes in the prototype design were implemented. The spacing between the stacks was increased to 0.38 mm, and the viscosity of the silicone oil was reduced to 50 cP. Additionally, the stacks were held together using Kapton tape, and thermally inactive mass was reduced compared to their first regenerative device. The harvester contained 317 g of Sn-doped Pb(Zr,Ti)O3 divided into eight sections that could be separately disconnected. In this experiment, Olsen activated 21 successive cycles, though some sections of the harvester were successively inactive, preventing the extraction of repeatable data for power generation. Nonetheless, it generated 6.23 J of electricity during the second cycle with seven active sections. As this second cycle lasted for 3.8 s, Olsen reported a maximum power output of 1.64 W, although this result could not be repeated. The schematic of this experimental device, one of the most remarkable to date, is shown in Figure 23.
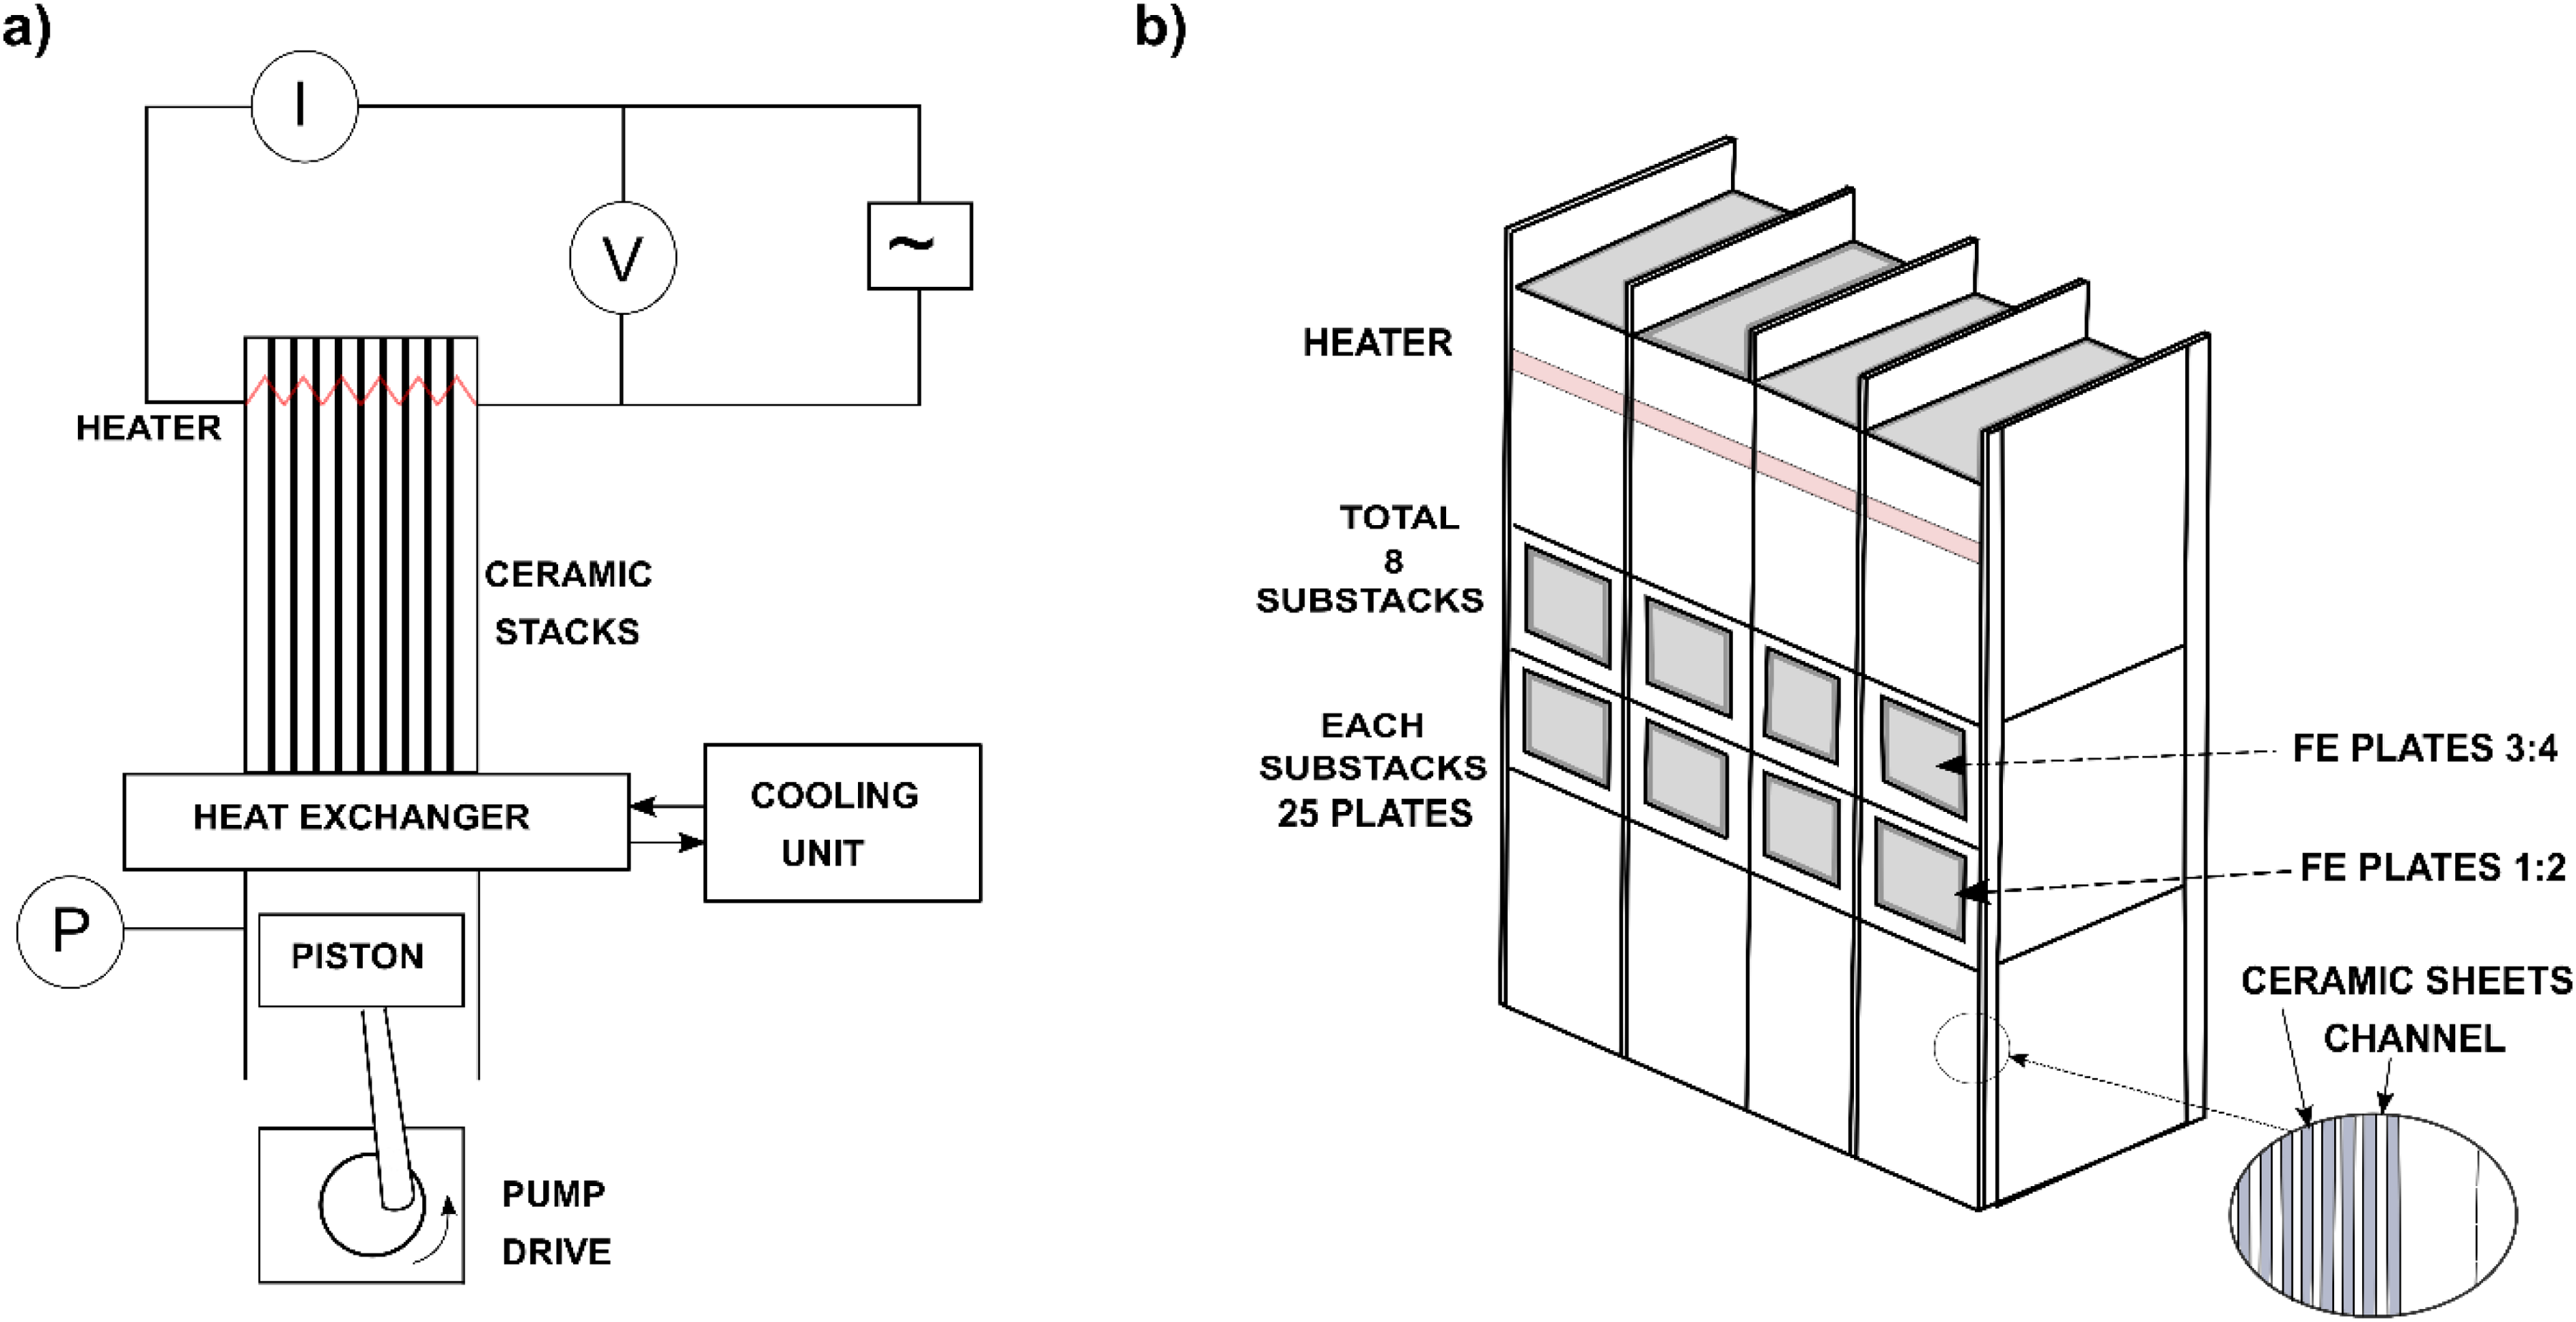
Later, Olsen et al. 146 developed a device utilizing P(VDF-TrFE) 73/27 co-polymer with the aim of improving the power to weight ratio. In this device, the co-polymer was wound spirally around a rod and nylon spacers were used to create the channels for the silicone oil to exchange heat with the polymer. Due to conduction effects, the output energy density was merely 30 mJ.cm−3 (∼0.75 mJ) between 20 and 90°C for a ΔE of 300 kV·cm−1. For many years, the focus was on reducing the conduction losses in PVDF copolymers.147,148 Recently, Nguyen et al. 167 built a prototype using P(VDF-TrFE) 60/40 copolymer (see Figure 24) and obtained a maximum energy output of 130 J/L/cycle. The detailed experimental conditions and results are presented in Table 3.
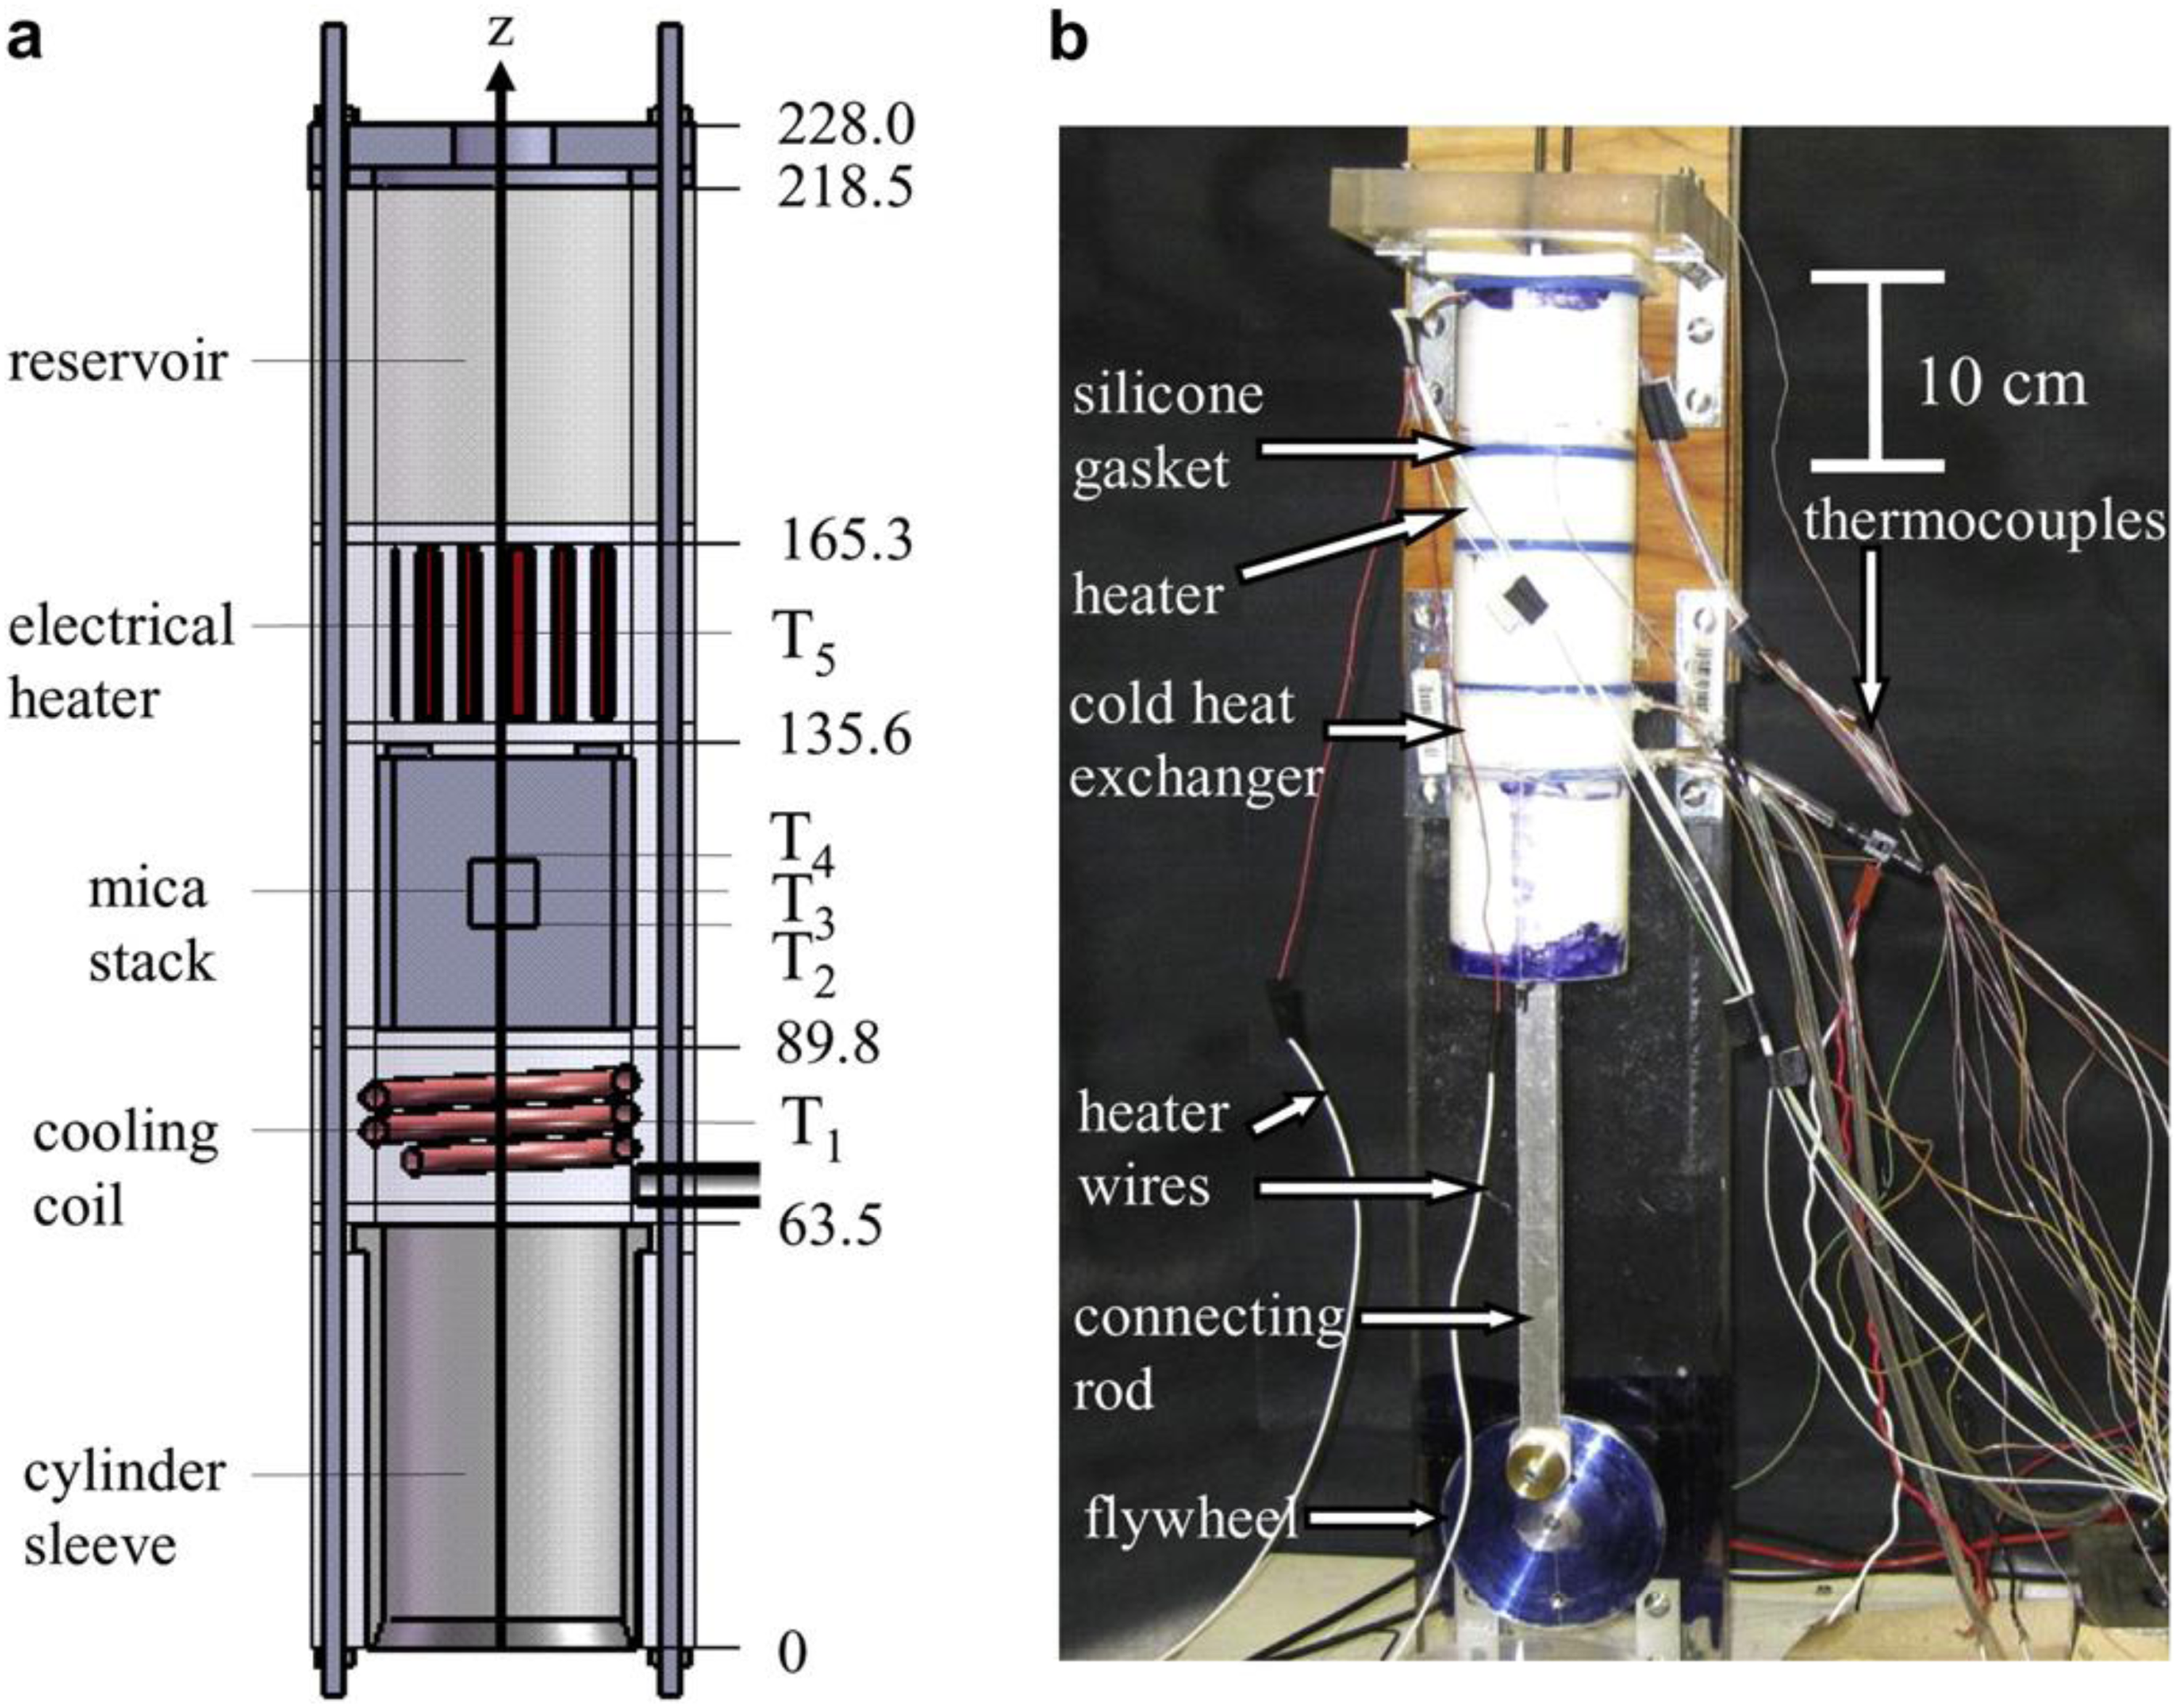
Schematic of the device cross section (left) and actual device (right) built using P(VDF-TrFE) copolymer by Nguyen et.al. 167
Not long ago, Navid et al. 168 reassessed the macroscopic device built by Olsen et al.51,84 and performed a detailed numerical simulation.They focused on the design aspects of the device. It was reported that by reducing the device length and the viscosity of the working fluid, the efficiency could be improved due to the reduction in the pumping power of the fluid, larger temperature swings experienced by the material and the lower heat input for maintain the hot source while using a less viscous fluid. The report indicated that nearly 55% Carnot efficiency and 38.4 W/L of power density may be achieved respectively using the same device built by Olsen et al. 84
In 2022, Lheritier et al. 29 developed two macroscopic pyroelectric energy harvesters consisting of Pb(Sc,Ta)O3 multilayer capacitors assembled together in a stack enabling a heat transfer fluid to circulate through, as depicted in Figure 25. This fluid, a silicone oil with a viscosity of 5 cP permitted the application of voltage on the capacitors and was alternatively hot and cold by circulating between a hot and a cold reservoir, like Olsen did in the eighties. One of the key aspects of this study is that this prototype was sealed with a polyolefin hose shrunk with a thermal gun. This enables using as little as possible matter to seal the device, which in turn drastically decreased the inactive mass in the heat exchanger. This strategy was already successfully applied by the same team in the close topic of electrocaloric cooling.72,73 In, 29 the aim was to generate as much energy as possible. In their first prototype, consisting of 28 multilayer capacitors (10.4 × 7.2 × 1 mm³), they reported a maximum output energy of 3.1 J using an Olsen cycle at 750 V (see Table 3). The experimental set-up is illustrated in Figure 26. (a). Figure 26. (b) displays the energy generated by this prototype for various Olsen cycles with different voltages and temperature spans. The capacitors were assembled in a 4 row × 7 column parallel plate structure with a slit distance of 0.75 mm between each row. Spacers made of double tape were used. The electrical contacts were provided by waxed copper wires connected to the capacitors by using silver epoxy.
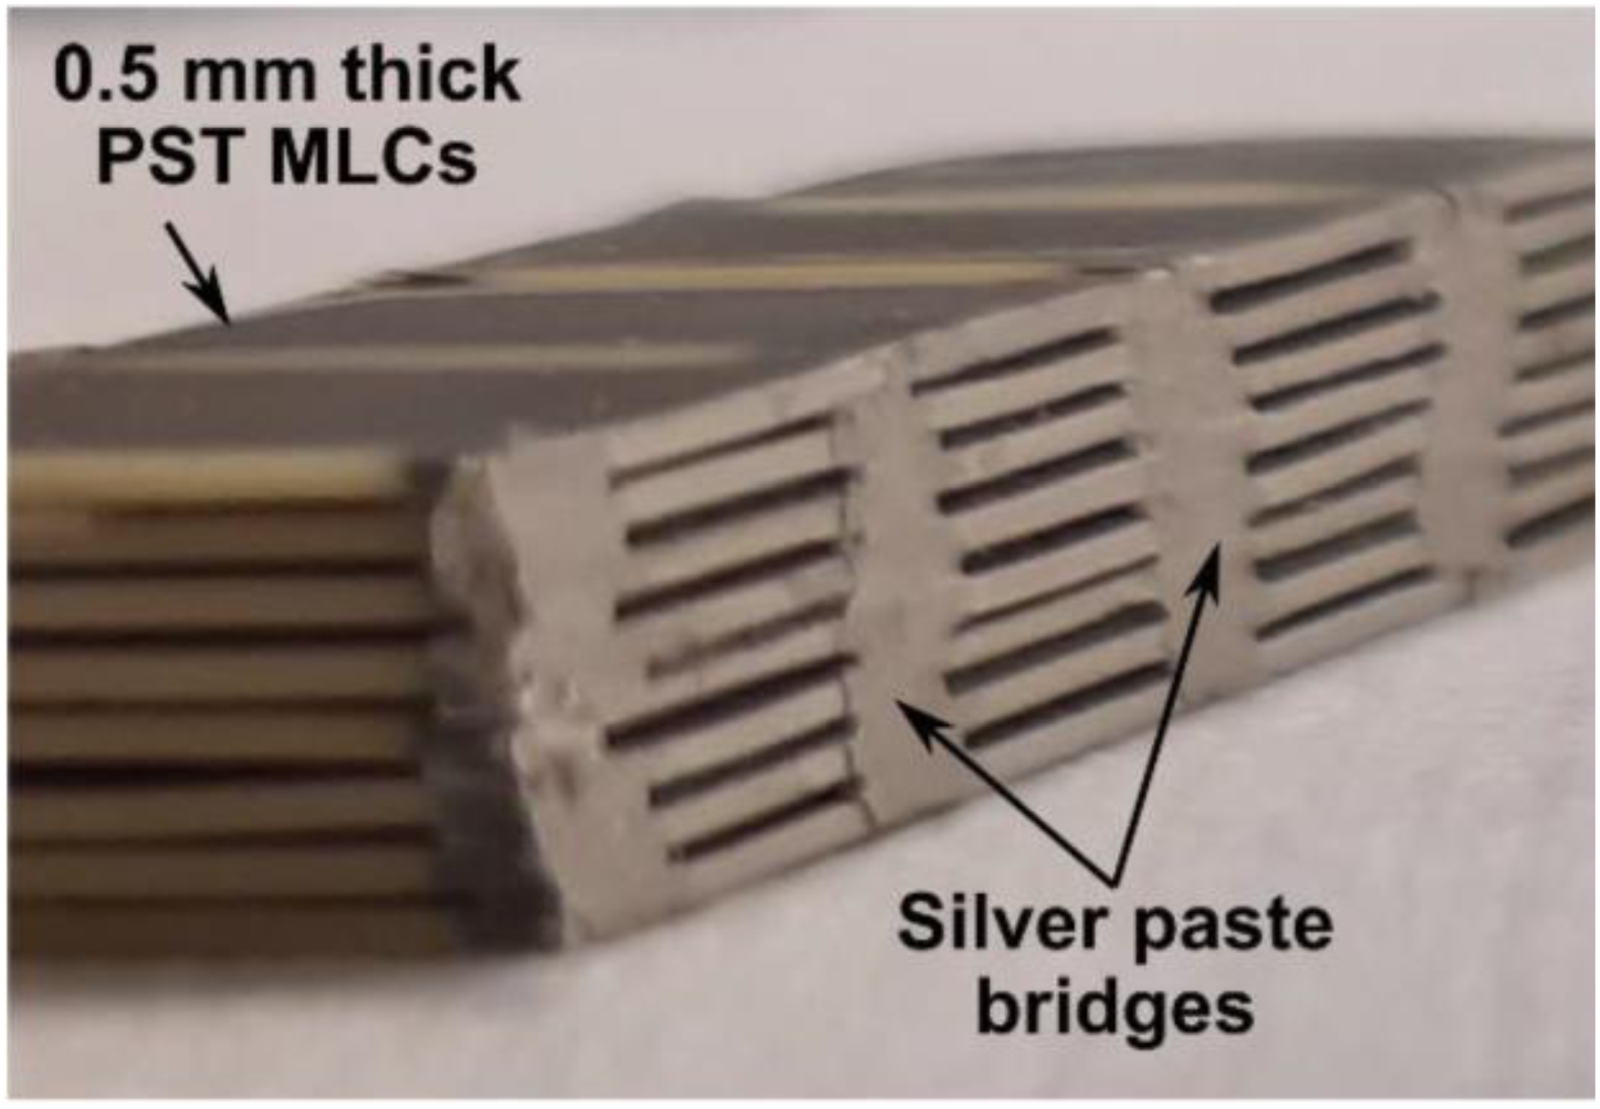
Image of stacked pyroelectric multilayer capacitors, as they are assembled in the heat exchanger, before being sealed. 72
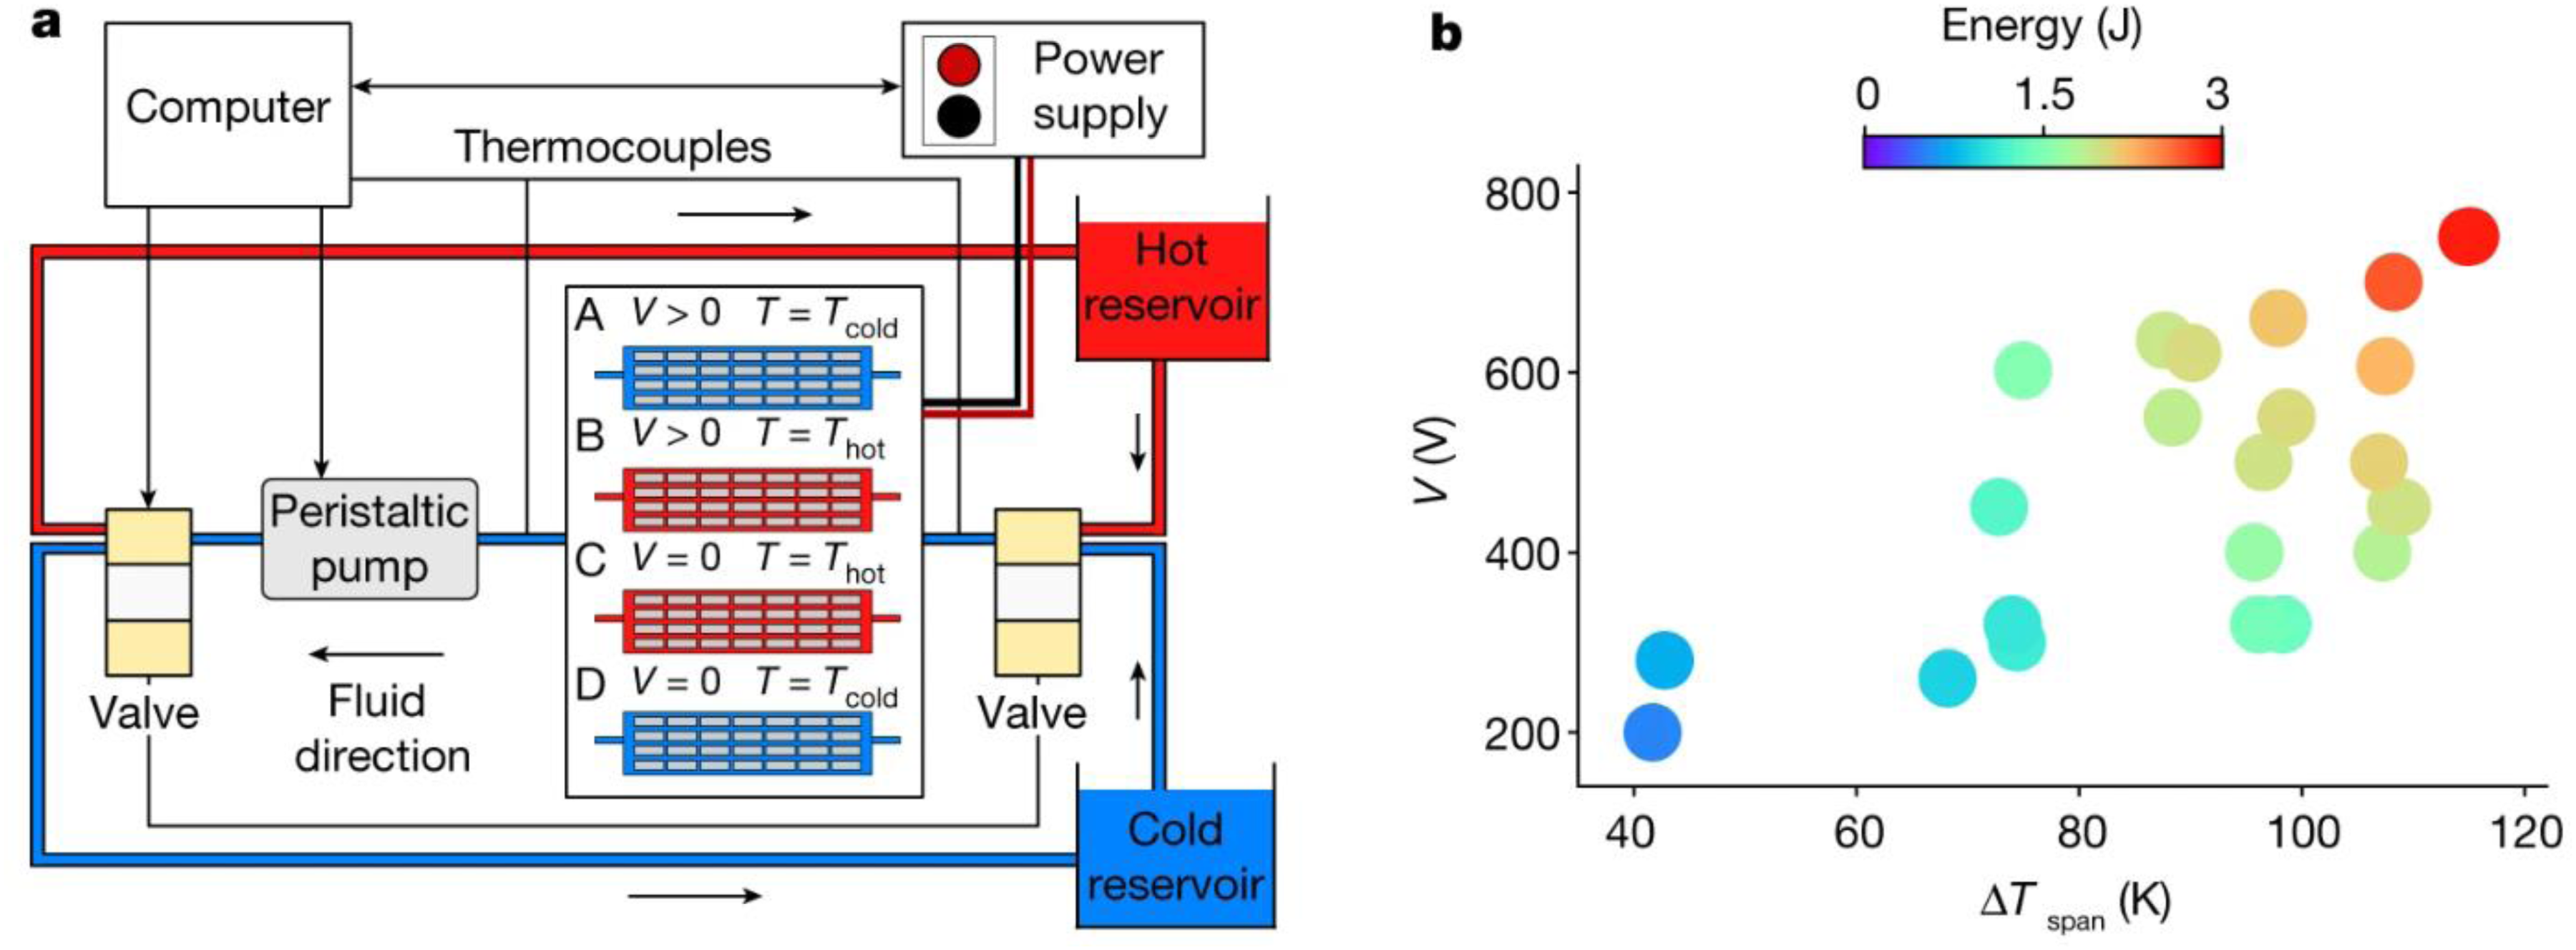
(a) experimental set-up of pyroelectric energy harvester based on 28 1-mm thick PST MLCs (4 rows × 7 columns). (b) Energy harvested by the prototype for different temperature spans and input voltages. Adapted from. 29
In the same paper, the authors built a larger version of the device with eight heat exchangers made of PST multilayer capacitors. These heat exchangers were connected in parallel, and they consisted of 42 g of active pyroelectric materials. The eight prototypes were electrically connected in parallel, and thermocouples were added on all the prototypes to monitor the temperature. By running a single Olsen cycle, they reported a maximum energy output per cycle of 11.2 J, achieved by varying the temperature between 11°C and 98°C and the voltage between 0 and 500 V. This is nearly twice the maximum value obtained by Olsen et al. 84 with seven times less mass. This advancement, along with more details about the experimental conditions and results, can be found in Table 3, which provides a comprehensive summary of all macroscopic pyroelectric harvesters tested under the Olsen cycle. In this summary, the harvested energy is the primary reported metric, and where power is not directly provided, it is calculated using the absolute energy and cycle frequency.
Table 3 reveals that only three materials — PZST, PST, and PVDF—have been studied, all in fluid-based devices, leaving much unexplored. Ceramics are widely used because they fit well into parallel plate heat exchanger geometries. The main limitation is that ceramics are difficult to insulate electrically, requiring a dielectric fluid like silicone oil, which has poor thermal conductivity, limiting heat transfer efficiency.
The table highlights the significant impact of heat exchange medium choice, such as silicone oil viscosity, on performance. Olsen et al. 84 and Lheritier et al. 29 achieved better results with less viscous silicone oil, aligning with theoretical predictions. 106 Several observations can be made from Table 3. Olsen et al. 84 achieved high energy output by simply cycling the material in the vicinity of its Curie temperature. Additionally, we can infer that to achieve high energy output, the material must withstand large electric field variations without breaking down. Despite the low energy output of PVDF-based devices, their key advantages lie in their large dielectric strength, low density and ease of fabrication into thin film stacks.
To advance further, there are two main challenges to address: 1) enhancing efficiency, which can be achieved through regeneration (discussed in the next section), and 2) improving power generation rather than just energy generation. The latter necessitates further advancements in heat exchange techniques, with strategies for accelerating heat exchange covered in the subsequent chapters.
How to go from joules to watts?
Hitherto, the focus has been predominantly on energy output, while giving relatively little consideration to the power output. Here, we shall shed some light on how to enhance the power output of pyroelectric energy harvesters by discussing strategies to optimize heat exchange conditions.
Until now, only fluid-based regenerators have been explored for pyroelectric energy conversion. In these prototypes, the pyroelectric materials are arranged in a parallel plate configuration, allowing heat transfer fluid to flow through channels between the plates for heat exchange. This design is preferred due to its low flow resistance and large heat transfer coefficients. Moreover, it provides access to the electrical contacts that are mandatory to collect the electric energy generated. It is difficult to imagine other designs, considering that large and flat pyroelectric capacitors are manufacturable and exchange heat efficiently with fluids. However, one disadvantage of fluid-based prototypes is the volume of inactive heat transfer fluid, which lowers performance and requires additional pumping work input. Additionally, it is challenging to implement a high cycle frequency in a fluidic device due to the challenges associated with the large flow rates. Hence, most works focus only on energy output at very low cycle frequencies, with very little attention paid to power output.
The best way to increase the harvested power from pyroelectric thermodynamic cycles is 1) to subject the active material to a large temperature change (as it increases the area of the cycle) and 2) to increase the cycle frequency as much as possible. This optimization is thermodynamically not compatible with increasing efficiency, for which large and abrupt temperature variations drastically increase irreversibility and therefore decrease efficiency. But it is nonetheless interesting to envision how much power could be generated from such an approach fully dedicated to power generation. Indeed, some specific applications could take advantage of this approach.
We will now review the largest absolute values published in the literature. Olsen et al. 84 claimed that they obtained 1.63 W, which is highlighted in Table 3. 84 However, this value corresponds to the calculation of energy harvested during one single cycle and cannot be considered as proper power generation. Besides, although Lheritier et al. 29 mentioned that they generated 11.2 J of electricity from their lead scandium tantalate multilayer capacitor-based prototype, it was also a one-time experiment that took place over 200 s. This stands for a generated power of only 50 mW.
In their paper, the authors ran numerical modelling to forecast how much power could be generated from flat pyroelectric capacitors. 29 The two key parameters are the thickness of the multilayer capacitors and the nature of the fluid. If lead scandium tantalate capacitors could be as thin as 200 µm and water could be used in the heat exchanger (thus requiring electrical insulation of all capacitors), 1 W of power could be generated when cycles are implemented between 10°C and 115°C and voltage between 0 and 750 V. According to the data provided in this paper, this gives approximately 2 W of electric power per cm3 of active material. This is very promising, though it requires 1) decreasing the thickness of the pyroelectric modules (200 µm is very thin, but feasible) and 2) addressing the challenge of using water. Note that this numerical analysis was initially performed to explain experimental results. Other designs specifically thought to increasing heat exchange are certainly feasible, which would increase further the generated power. Consequently, these three parameters (thinner devices, using water, design favouring heat exchange) are the essential pillars of the pyroelectric power generation road map.
Another promising approach to increase cycle frequency is the usage of thermal control devices.169–176 These devices exhibit anisotropic thermal conductivity, resulting in the variation of heat flux in the forward and reverse directions. This is achieved by varying the thermal resistance between pyroelectric element and heat source/sink. Through this approach, the device can be operated at higher frequencies, thus enhancing the power output. Thermal control devices can be classified into fluidic, mechanical, and solid-state. 169 Some thermal elements such as thermal diodes and regulators can operate passively whereas thermal switches require an external stimulus such as pressure, electric or magnetic fields to change their thermal resistance. The operation of thermal control elements is defined by their characteristic transfer function connecting the heat flow (Q) to the driving temperature difference (ΔT). Here, the discussion will be limited to thermal diodes and switches for electro-thermal energy harvesting. The working mechanism of thermal switches/diodes for pyroelectric energy conversion is as follows: Suppose we implement an Olsen cycle on a pyroelectric material, with two thermal control elements TD1 and TD2 serving as interfaces between the cold and hot source respectively, as shown in Figure 27. (a). To achieve isothermal charging at low temperature, TD2 is switched on while TD1, connecting the hot source, is turned off. After reaching the cold source temperature, Tcold, the pyroelectric material is charged. In the next step, TD2 is turned off, and the TD1, connecting the hot source, is switched on to realize the isoelectric heating step. This prevents heat flow from the hot source to the cold source. After reaching the hot source temperature, Thot, the material is discharged electrically. Finally, TD1 is switched off and TD2 is turned on to return to the initial temperature and to execute the next cycle.
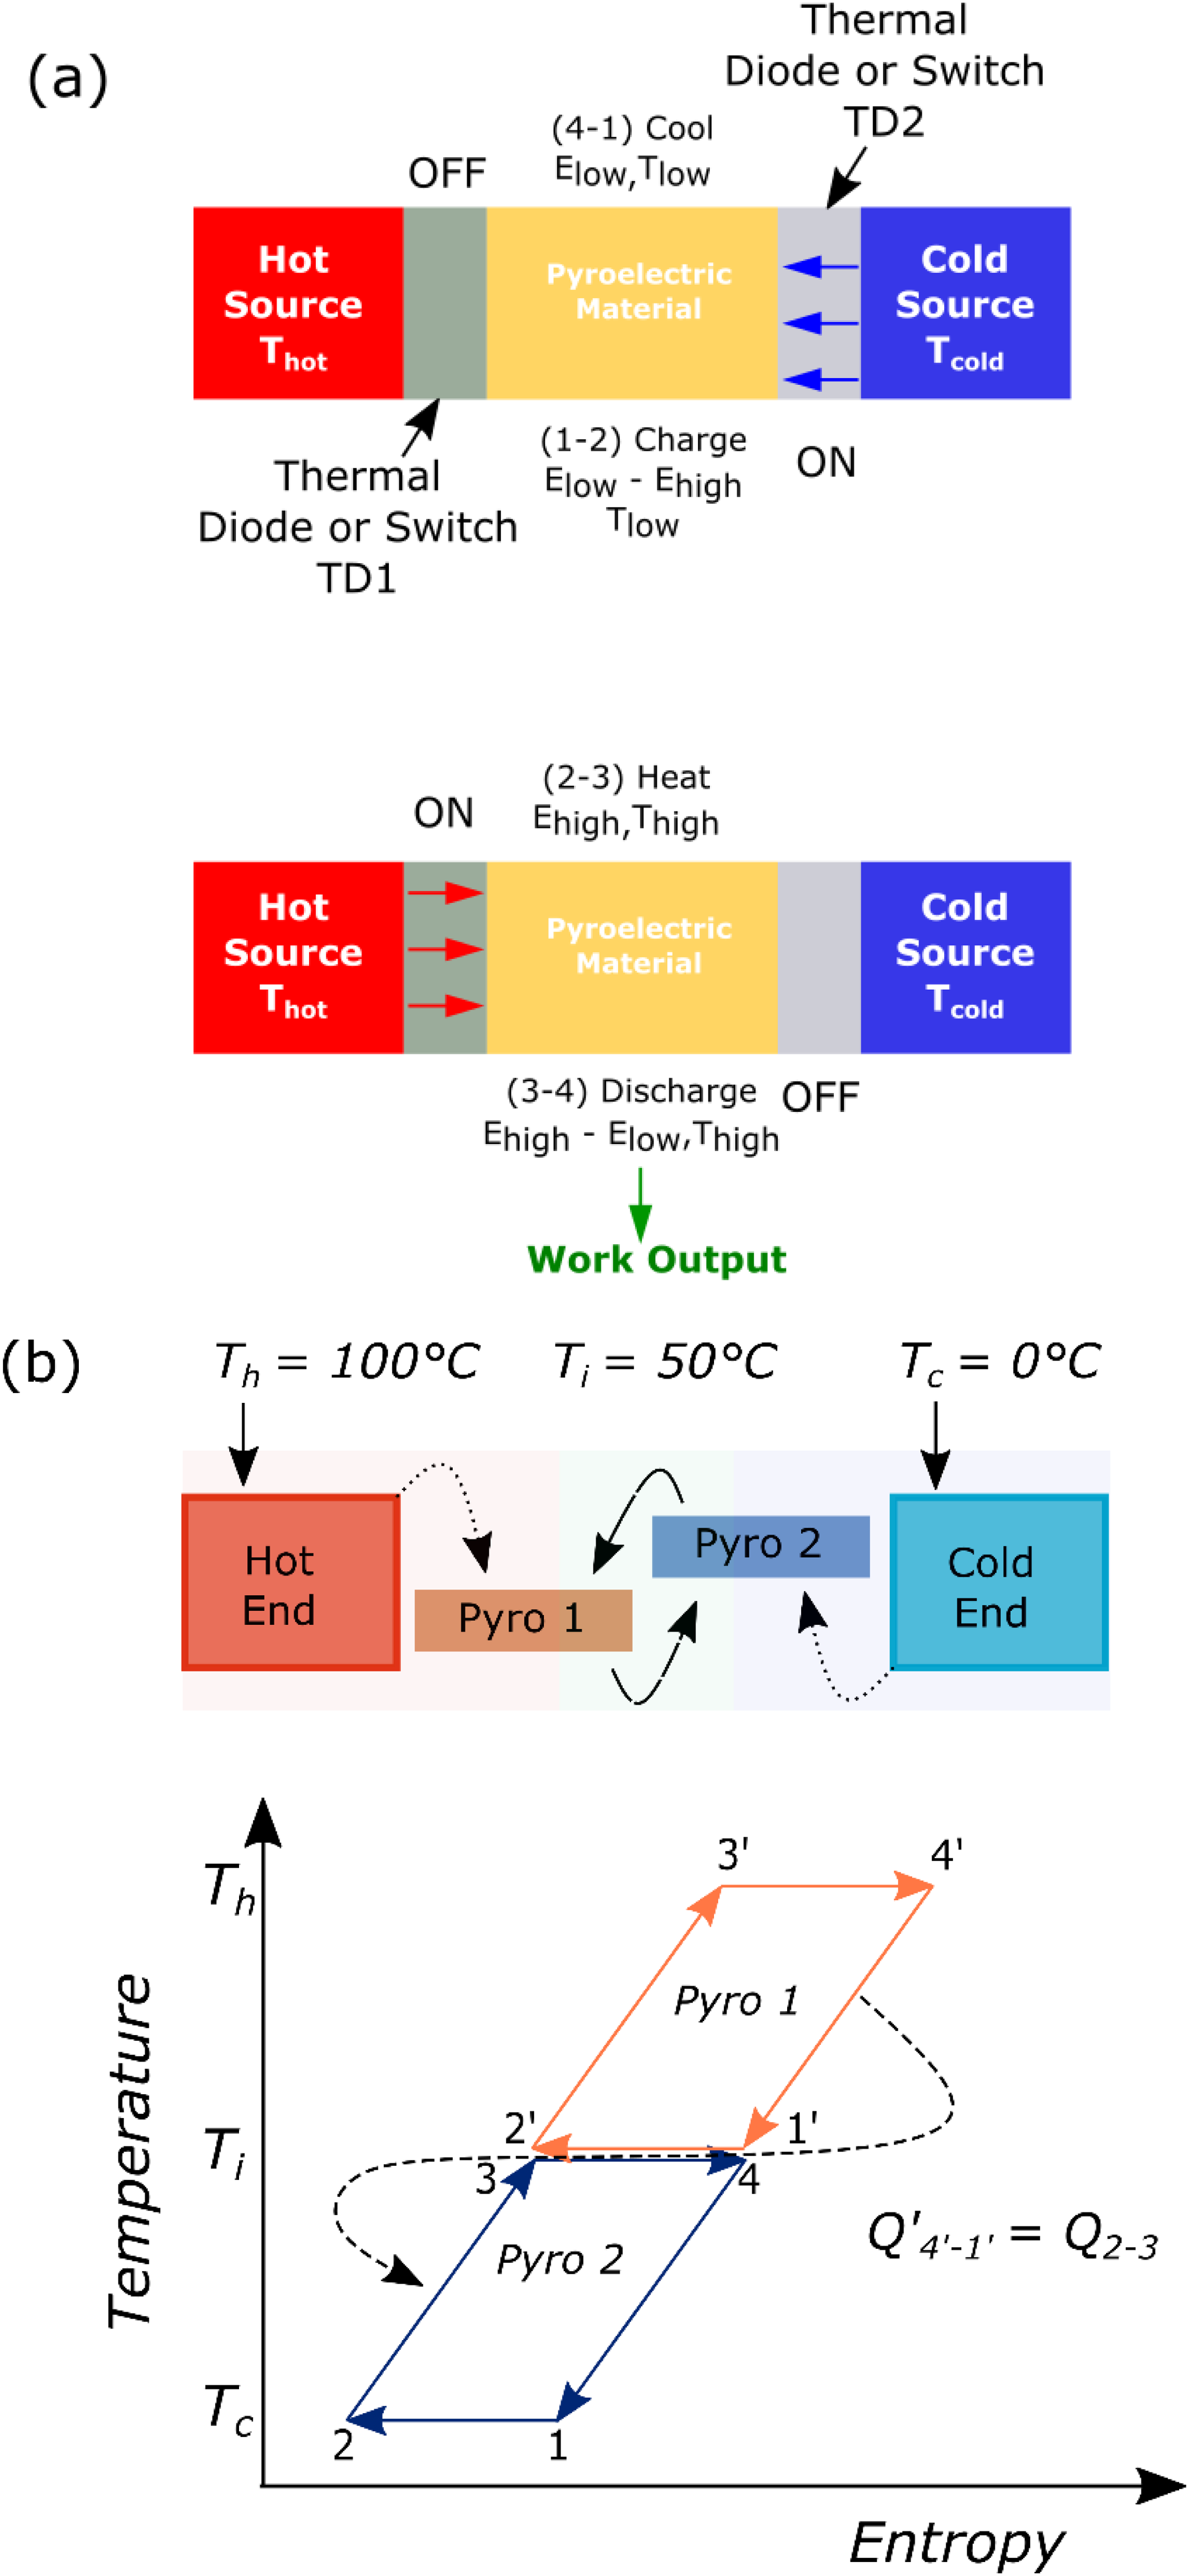
(A) working principle of thermal diode/switch for non-linear pyroelectric energy conversion (b) active medium regenerator.
The performance of a thermal diode is determined by its ability to rectify heat and the rectification ratio 
Similarly, thermal switches can be used to vary the thermal conductivity across the device. The figure of merit to determine the performance of thermal switch is its switching ratio, which is the ability of the device to go from low (OFF) to high (ON) thermal conductivity. It is given as follows: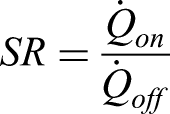
For high frequency operations, a high switching ratio and a short switching times are desired.169,170,172 Epstein and Malloy 177 investigated thin film heat switches based on liquid crystals for caloric refrigeration and thermal energy harvesting. They reported that the switching time scales can be of the order of few milliseconds and efficiencies as high as 66% Carnot efficiency could be obtained using heat switches with large contrast in thermal conductivities. In another study, Jia and Ju 178 investigated the feasibility of liquid based switchable thermal interfaces for caloric cooling using BTO multilayer capacitors. With a switching ratio of more than 100 at an operating frequency of 0.3 Hz, they obtained a specific cooling power of 500 W·m2. Not long ago, Cha et al. 179 investigated P(VDF-TrFE) for non-linear pyroelectric energy conversion using a liquid based thermal interface. With operating frequencies close to 1 Hz, they achieved a power density of 110 mW·cm−3 between 40 and 100°C for a ΔE of 300 kV. cm−1.
Another approach to enhance the power output and to reduce the system size is by using an electrically active thermodynamic medium instead of the inactive heat transfer fluid.
54
Here, alternate layers of pyroelectric materials with varying Tc slide past one another, with each stage acting as the second thermodynamic medium for the other. Figure 27. (b) illustrates a two-stage pyroelectric energy converter consisting of Pyro 1 and Pyro 2 as active mediums. Pyro 1 has a transition temperature close to the hot end (Th), while the transition temperature of Pyro 2 is near the cold end (Tc). In this two-stage device, Pyro 1 and Pyro 2 operate in anti-phase; the heat rejected by Pyro 1 serves as input heat for Pyro 2, as shown in the entropy (S) vs. temperature (T) graph. The working principle of a two-stage active medium harvester subjected to an Olsen cycle is detailed here:
Step (a) : Pyro 1 and Pyro 2 are placed near the hot (Th = 100°C) and cold (Tc = 0°C) ends respectively, with no bias field applied to either material. Step (b) : Pyro 2 is subjected to isothermal charging (1–2) at Tc, while Pyro 1 remains at Th without a bias field. Step (c) : Pyro 1 and Pyro 2 are brought into contact, enabling heat transfer between the two materials. As a result of this heat exchange, Pyro 2's temperature increases from Tc to the intermediate temperature Ti, while Pyro 1's temperature falls to Ti from Th. This corresponds to the isoelectric heating stage (2–3) for Pyro 2, which can be inferred from the S vs. T graph. Step (d) : Once both materials reach the intermediate temperature (Ti = 50°C), Pyro 2 is discharged (3–4), and Pyro 1 is charged (1’-2’) while they remain in contact, as shown in the S vs. T graph Step (e) : Pyro 1 is moved to the hot end (Th), corresponding to the isoelectric heating leg (2’-3’), while Pyro 2 returns to the cold end (Tc) for its isoelectric cooling process (4–1). Finally, Pyro 1 is discharged (3’-4’) at Th, and its isoelectric cooling (4’-1’) is completed during Step (c) of the next cycle, when it comes into contact with Pyro 2.
This active medium approach could significantly reduce the system size and could result in 50% improvement in energy producing capability as mentioned by Olsen. 54
High-performance power electronics for electro-thermal energy harvesting
Despite significant advancements in materials and thermal engineering, the system-level performance of non-linear pyroelectric devices remains low due to external electronic power losses. While the majority of power electronic circuits for energy recovery have been developed for electrocaloric devices, these circuits can be adapted for thermal energy harvesting.
The most commonly used charge recovery system for electrocaloric application is based on resonant circuits, where the charge is transferred between two capacitors via an inductor.144,180 Defay et al. 180 showed that by using a resonant circuit, 80% of the energy can be recovered by inducing an antiphase electrocaloric effect between two barium titanate multilayer capacitors. However, this circuit is constrained by the charge transfer time constant through the inductor. 181 Furthermore, the conduction losses from the diodes and inductors at high charging currents also limit the efficiency of this circuit, ultimately reducing the recovered energy and efficiency. Mönch et al. reported that to obtain 50% Carnot efficiency at the system level, the material and external charging losses must be minimized. 182 One potential solution to avoid the limitations of resonant circuit for energy recovery and to enhance the efficiency of the system is to use a switched-mode power converter.29,183,184
Guyomar et al.
57
analysed the effectiveness of thermal energy conversion using synchronized switch harvesting on inductor (SSHI), a non-linear technique widely used for piezoelectric energy harvesting. In this circuit, the pyroelectric element is connected to a switched inductor in parallel to the ac side of the rectifier bridge and a storage capacitor is connected to the dc side of the rectifier bridge as shown in Figure 28. The switch remains open most of the time and is only closed at the extremum temperatures, constituting a resonant circuit. The switch is closed for a time of
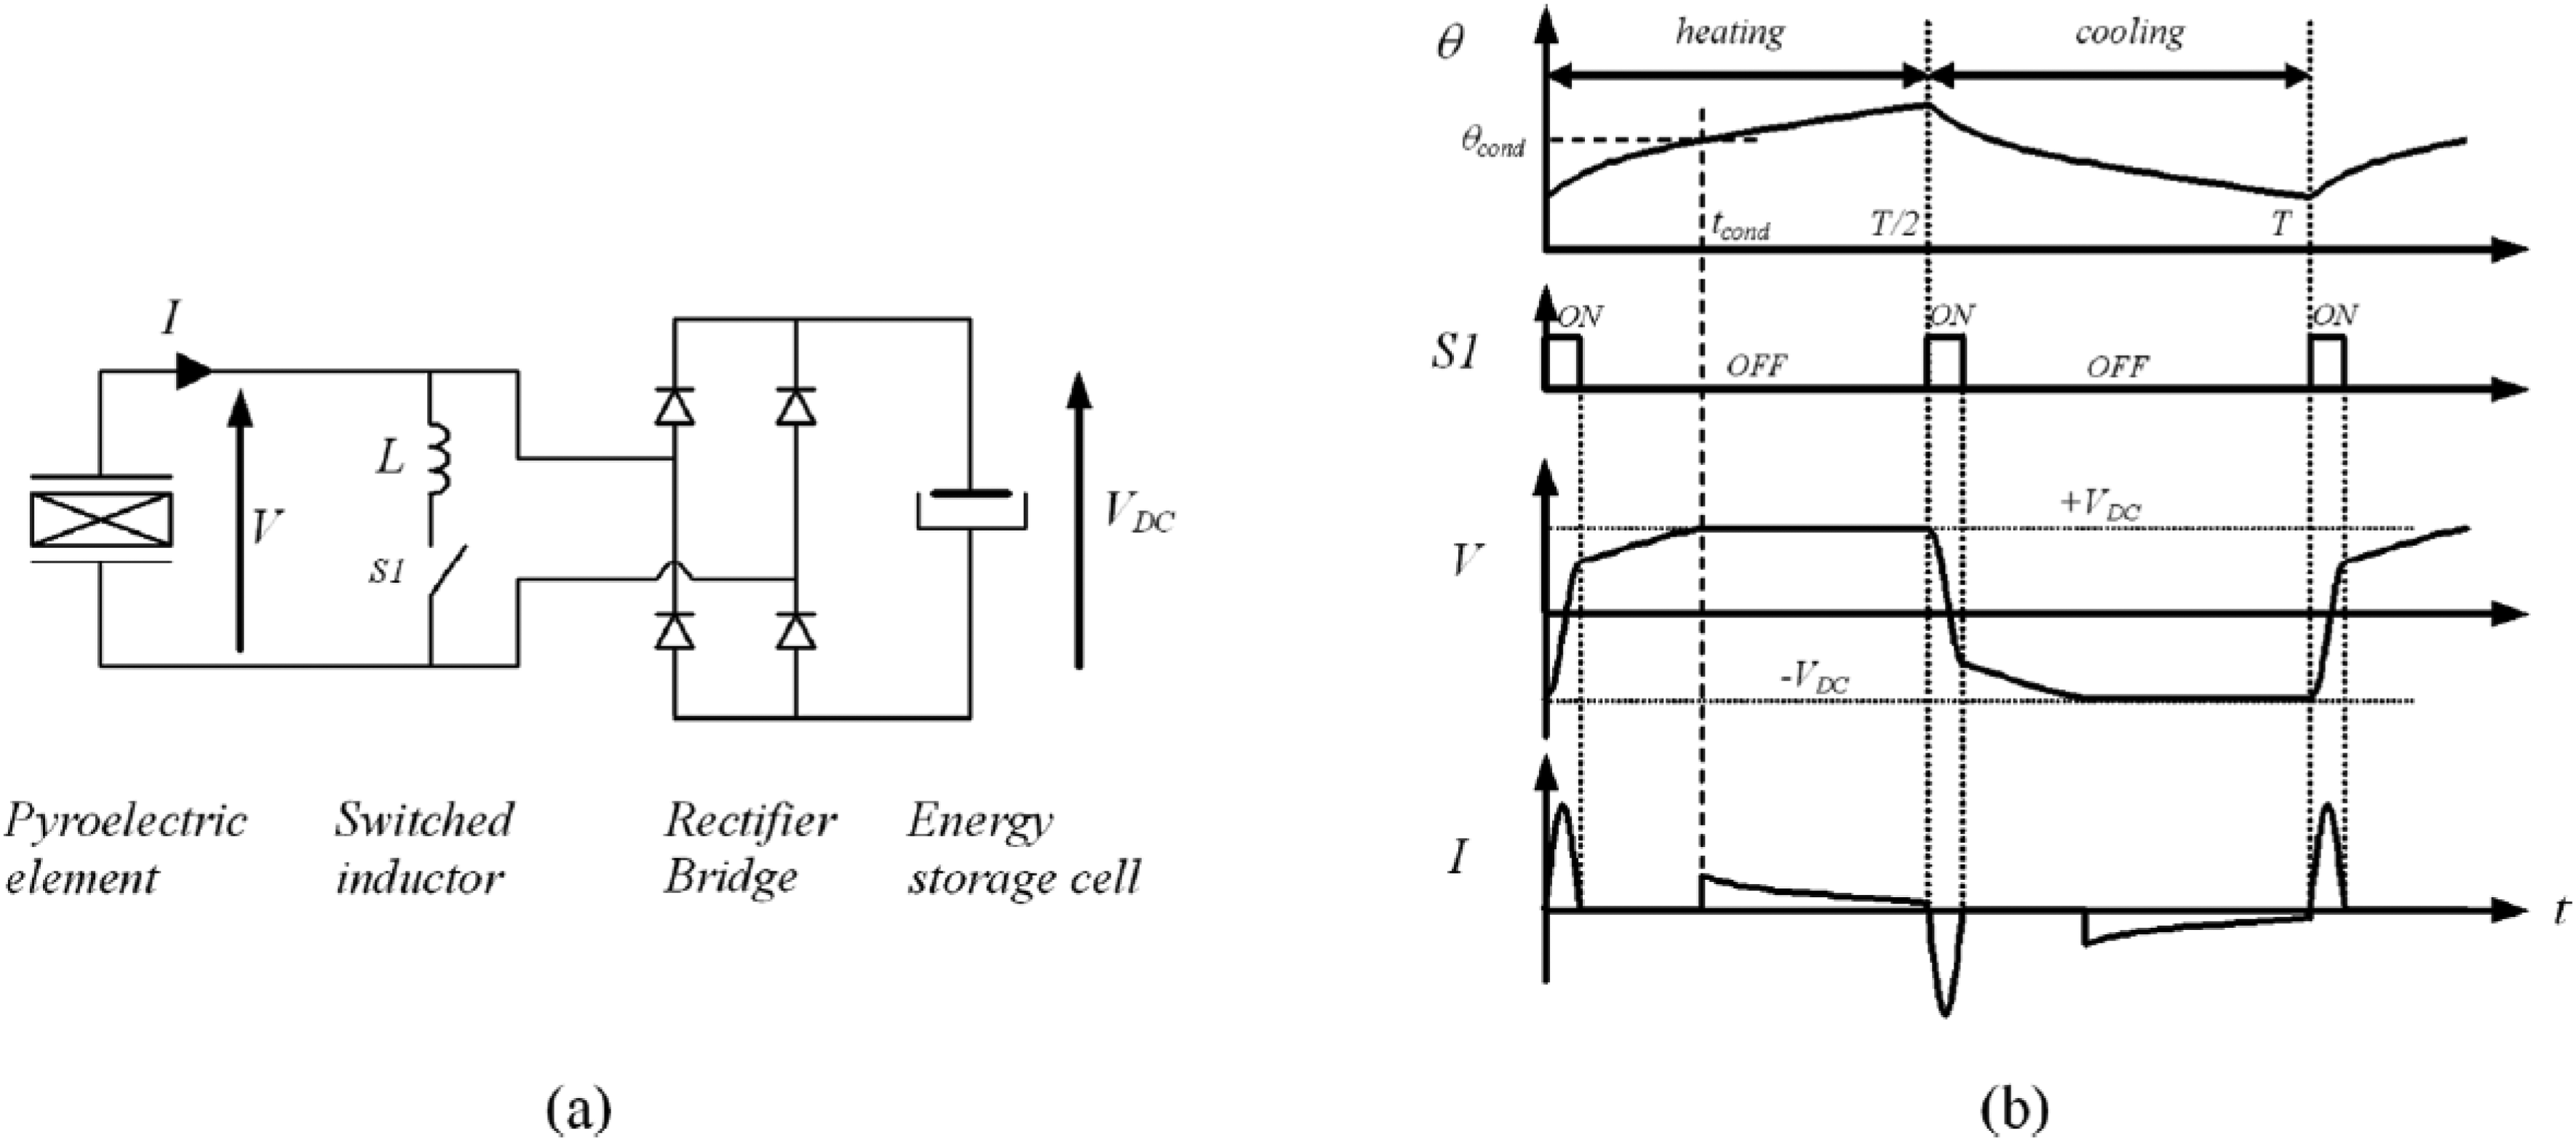
(a) circuit diagram of parallel SSHI device and (b) typical waveform. 8
Most recently, Lheritier et al. 29 developed a self-powered switched-mode converter for non-linear pyroelectric energy conversion. To implement an autonomous energy harvester, two lead scandium tantalate multilayer capacitors in parallel were subjected to a Stirling cycle. The Stirling cycle was chosen over the Olsen cycle as the material can be charged at a very low voltage, and the voltage can be significantly amplified during the open circuit heating step. In contrast, the Olsen cycle requires high fields to be applied and maintained during the cycle, which makes the circuit implementation more complex. The energy harvested from the material during each cycle is efficiently recovered using a low voltage converter, with part of that energy used to run subsequent Stirling cycles while the rest is stored in a capacitor.
The autonomous harvester consists of three blocks: (1) the harvester block made of the pyroelectric elements undergoing a Stirling cycle; (2) the converter part consisting of reed relays, low voltage converter and storage capacitors; (3) the controller block, which is the heart of the system embedding microcontrollers, the temperature sensor, a DC/DC converter (LTC 3588-1) and a boost converter as shown in Figure 29. Initially, the storage capacitor must be charged only once such that it has enough energy to initiate the electronic components in the device.
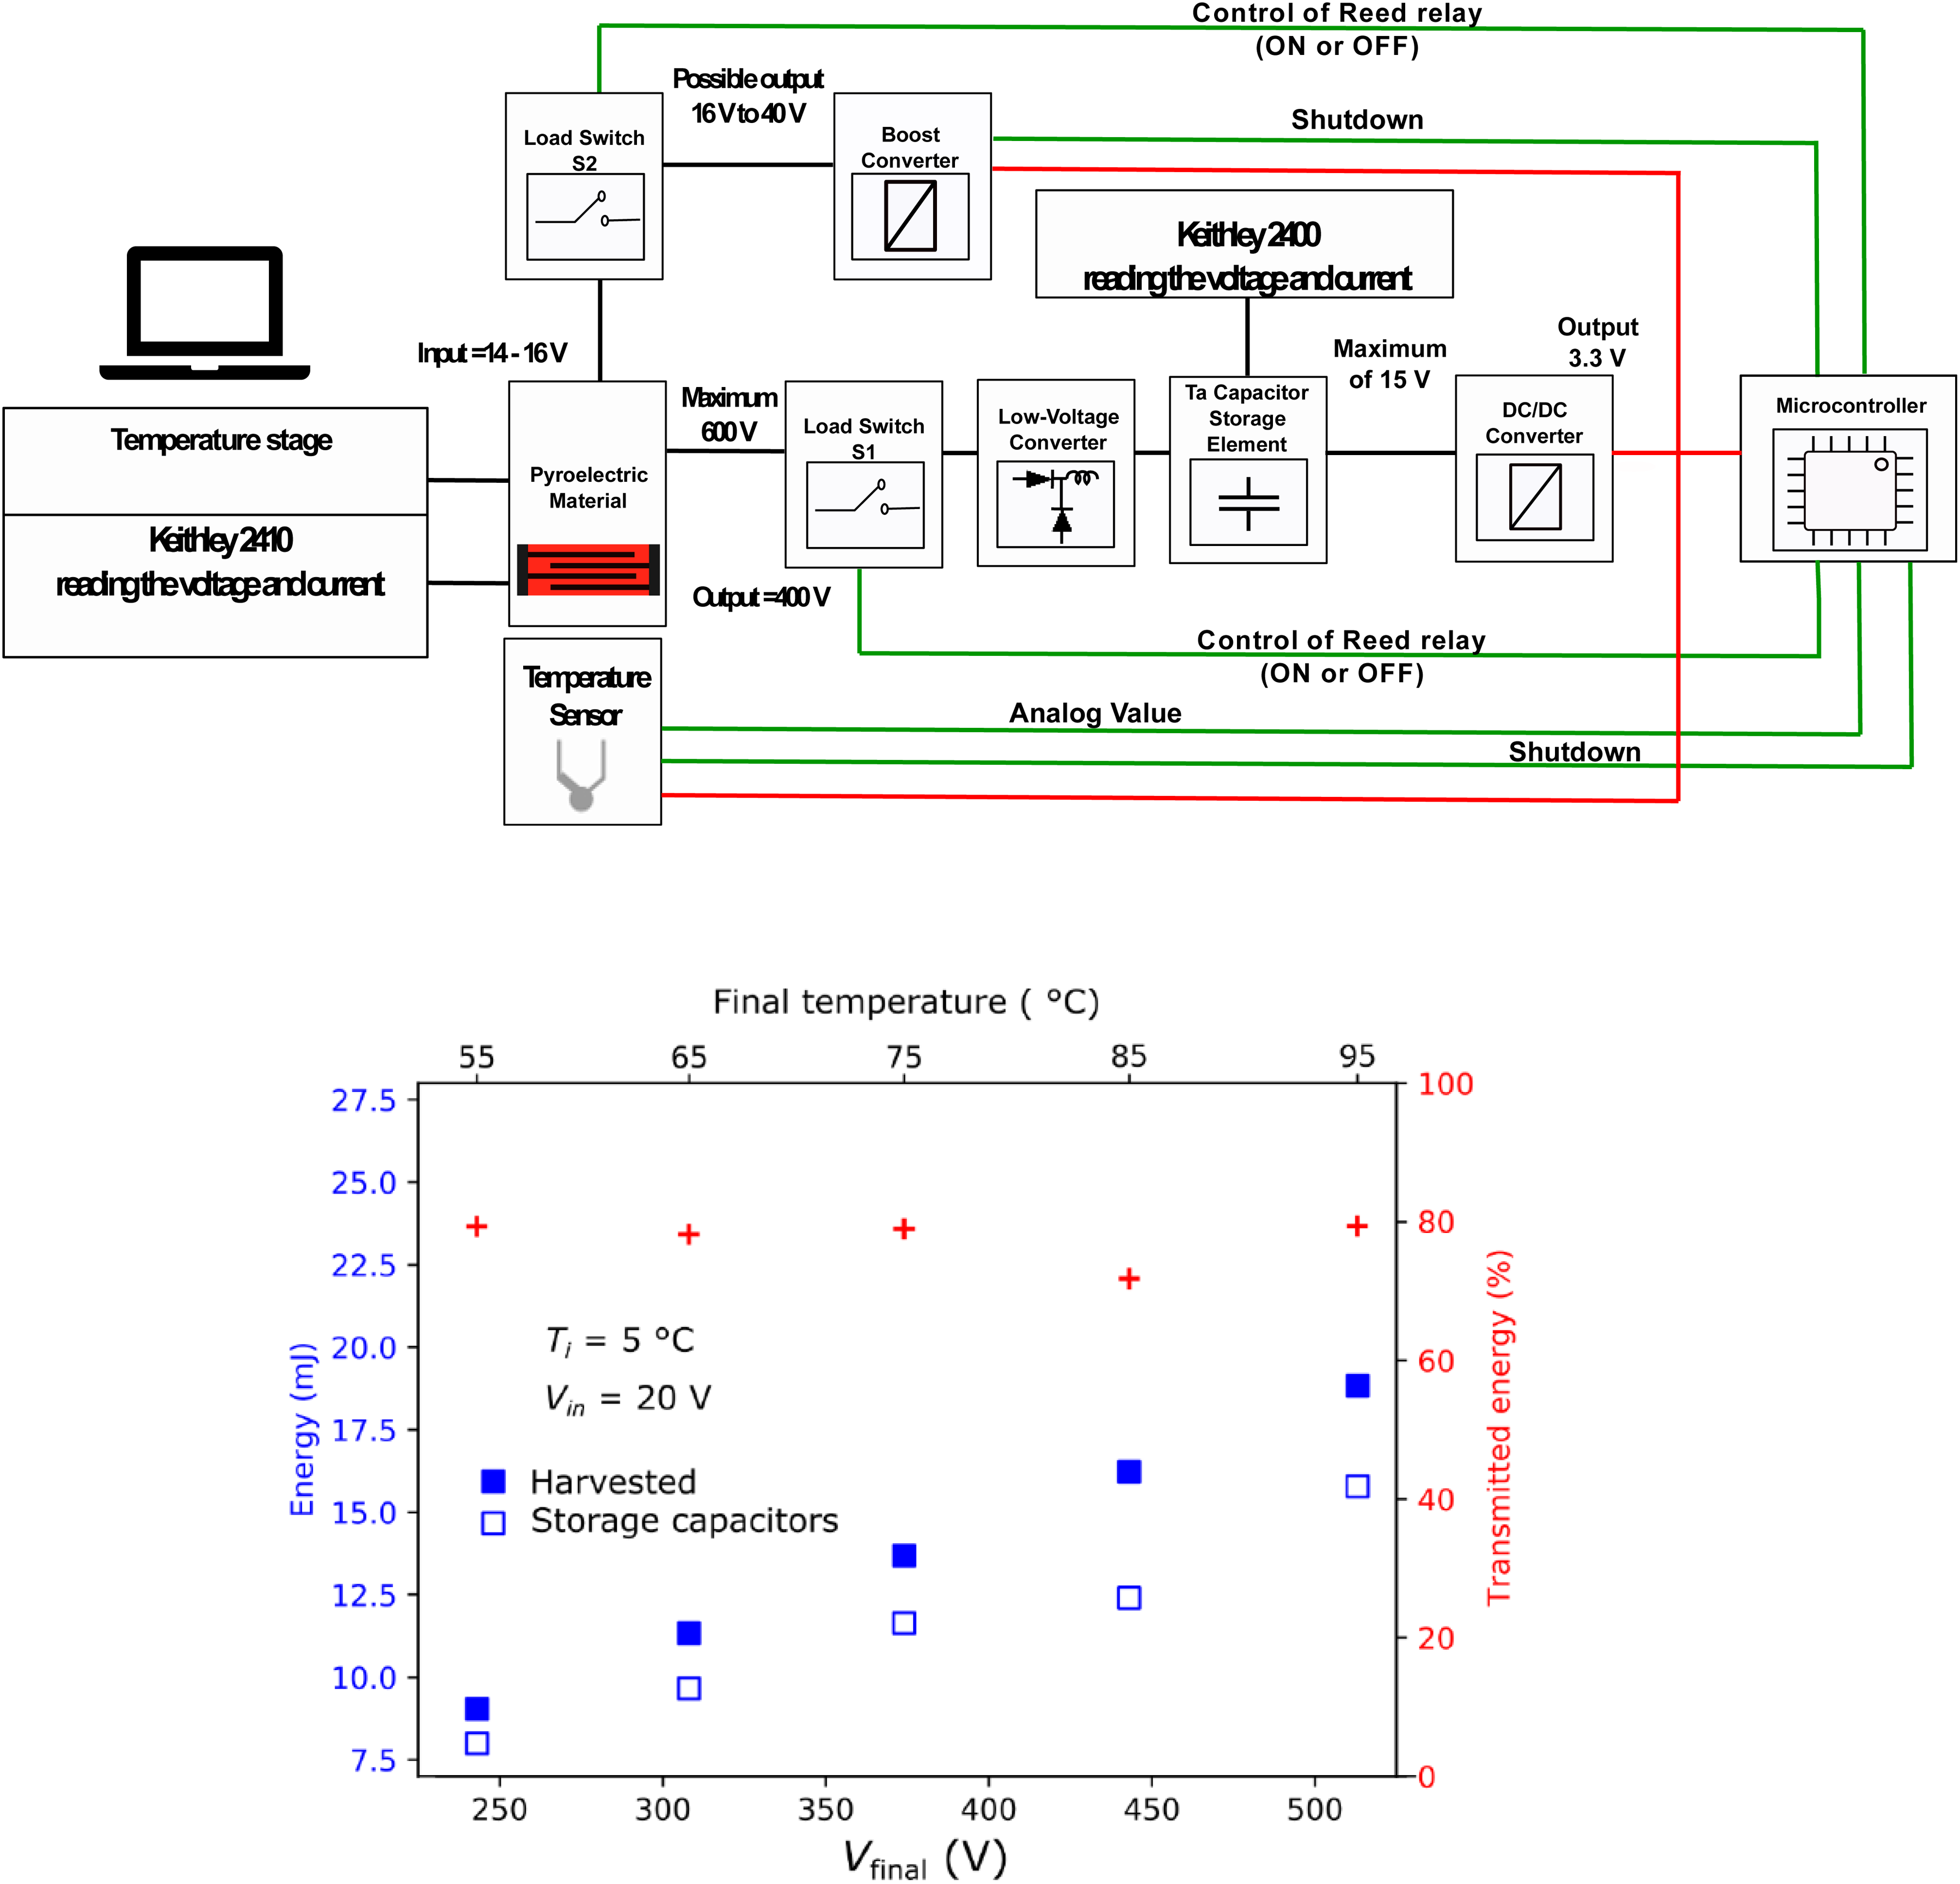
(top) experimental set-up scheme of the autonomous energy harvester. (Bottom) Energy harvested (full blue box) and stored in the capacitor (open blue box) for different temperature spans of the Stirling cycle. The Y-axis in the right shows the transmitted energy in percentage (red cross). The bottom and top X-axis display the final amplified voltage and end temperature of the Stirling cycle respectively. Adapted from. 29
The main challenge with the Stirling cycle is the significant voltage amplification during the open circuit heating step. Hence, the voltage must be effectively stepped down as the upper voltage limit of the DC/DC converter (LTC 3588-1) is around 20 V. For this reason, a low voltage converter similar to a buck converter consisting of reed relay switches, diodes and an inductor was implemented in the device. The low voltage converter was able to step down 400 V to 16 V with 80% efficiency (Figure 29). The overall voltage evolution in the storage capacitor and the lead scandium tantalate multilayer capacitors is shown in Figure 30. After four consecutive Striling cycles, the voltage in the storage capacitor increased in a step-wise manner to 13 V, which is 40% more than the starting voltage. Furthermore, an energy gain of 22 mJ was achieved just after four Stirling cycles proving the autonomy of this self-powered non-linear pyroelectric energy harvester.
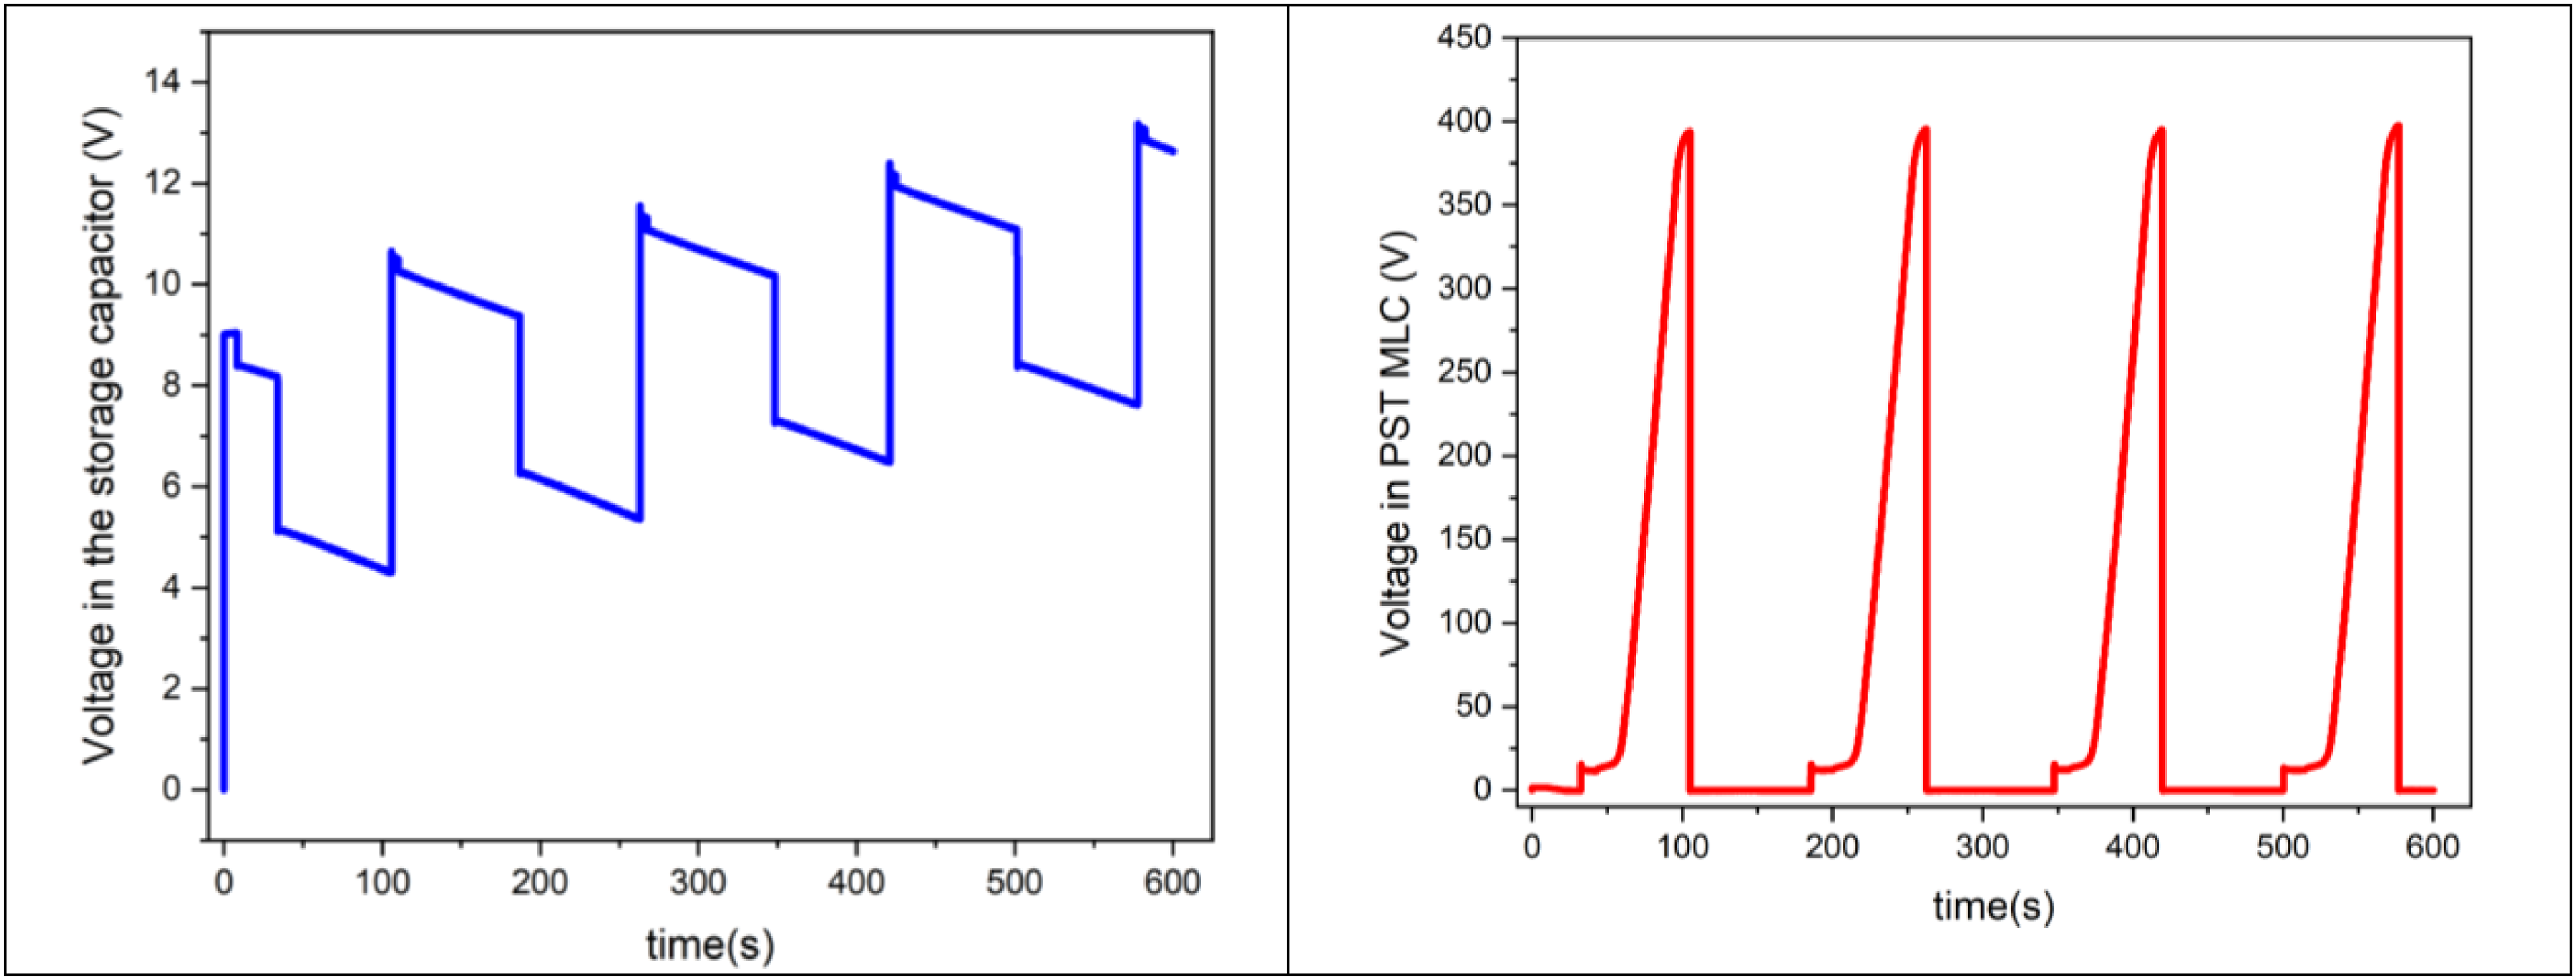
Voltage time evolution in the storage capacitor (left) and in the two lead scandium tantalate multilayer capacitors in parallel (right)
Conclusion
In conclusion, this review highlights the current state of the art in non-linear pyroelectric energy conversion. Although this technology is still in its early stages compared to thermoelectric energy conversion, it has demonstrated potential for higher efficiency in specific applications, particularly when harnessing low-grade heat. This review comprehensively covers all aspects of non-linear pyroelectric energy conversion, including materials for electro-thermal energy conversion, the thermodynamics of conversion cycles, the role of phase transitions, and heat exchange principles crucial for achieving higher power output. It also discusses strategies to enhance device efficiency and the role of power electronics in optimizing system-level performance.
Advancements in novel ferroelectric materials, primarily developed for electrocaloric applications, can be leveraged to improve pyroelectric energy conversion systems. Future research should focus on investigating the reliability of these materials under a large number of electro-thermodynamic cycles. Understanding how these materials behave under repeated electrical and thermal stresses is crucial for developing durable and efficient macroscopic energy converters. Researchers must also focus on integrating thermal control elements, currently used in electrocaloric devices, to enhance the power output of devices rather than just focusing on harvestable energy.
Moreover, one of the key advantages of non-linear pyroelectric energy conversion is its superior power-to-weight ratio compared to other technologies, making it an attractive option for various applications. Further analysis is needed to fully understand this benefit and its potential impact. Additionally, transitioning from fluid-based to solid-to-solid devices could further enhance the power-to-weight ratio and improve overall performance.
Generating several joules of electricity with a few tens of grams of active materials is already possible. No doubt that soon, it will be possible to generate watts. The most important driving parameter of such materials is ΔT/Δt, meaning that one has to find fast and large variations of temperature. Therefore, using hot and cold reservoirs is certainly a much more favourable experimental set-up than considering natural variations of temperatures. Besides, in theory, pyroelectric cycles can be extremely efficient, approaching the ultimate efficiency of Carnot cycles. However, to do so, it is mandatory to use heat regeneration in the most perfect way. The latter has never been implemented yet and promises to be a great challenge ahead of us.
Footnotes
Funding
This work was supported by the European Research Council (ERC Advanced ELEC-FROM-HEAT, grant agreement N° 101141445) and the Fonds National de la Recherche (FNR) of Luxembourg (Project THERMODIMAT C20/MS/14718071/Defay). Views and opinions expressed are those of the authors only and do not necessarily reflect those of the European Union or the European Research Council. Neither the European Union nor the granting authority can be held responsible for them.
Declaration of conflicting interests
The authors declared no potential conflicts of interest with respect to the research, authorship, and/or publication of this article.