
Abstract
Rising self-employment may indicate growing precarity. This article investigates poverty in self-employment in the UK using a large-scale official household survey for 2010 to 2019 through a focus on material deprivation. The principal finding is that, after controlling for the selective nature of self-employment, self-employed households may experience higher levels of material deprivation than employed ones. This is particularly so for those without children and access to welfare and other support that children may bring. This finding is consistent with previous research on the reliability of self-employment earnings data. It also may highlight the impact of precarious self-employment on low earning households. This is apparent in detailed analysis of earnings and material deprivation gaps at different points of the distribution, where self-employed households rely more on the income of one self-employed earner.
Introduction
The self-employed account for a significant proportion of the workforce in many contemporary economies. In the UK, self-employment has grown significantly over the past two decades (Office for National Statistics (ONS), 2018). Growth may be indicative of the impact of labour flexibilization, the rise of precarious employment and the growth of ‘gig-working’ (Kalleberg, 2011; Vallas and Schor, 2019; Wall, 2015; Wieteke and Schippers, 2019; Williams and Horodnic, 2019). This raises questions on the extent to which rising self-employment may expose workers to higher risk of poverty (Danson et al., 2021).
The rise in self-employment connects to various themes within the sociology of work – work flexibility and polarization, the role of technology and the regulation of worker effort, gendered work, and issues of worker identity. Self-employment is heterogeneous in form – it spans non-salaried business owners and employers, through a wide range of sole-trading activity in which individuals ‘work for themselves’ to the ‘dependent self-employed’ (Williams and Horodnic, 2019). These latter comprise freelancers and contractors working mainly for one employing organization because it suits the worker, the employer or both to contract for tasks or activities rather than for agreed hours of work (Moore and Newsome, 2018). Such hybrid forms of work may arise from the flexibilization strategies of large organizations (Keep and Mayhew, 2010; Murgia et al., 2020). Self-employed workers have become a substitute for employed workers, allowing employers to limit the costs of recruiting, retaining and firing the latter (Moore and Newsome, 2018; Smith, 2006). The dependent self-employed form part of the precarious labour force polarized by poor pay, job security, and lack of access to full social protection and employment rights experienced by those in contracted jobs (Román et al., 2011; Taylor, 2017). Although the self-employed may report longer average hours of work than the employed, for the dependent self-employed the hours of work can be highly flexible and unpredictable, as reflected in lower weekly earnings and higher part-time working (ONS, 2018). The growth of the ‘gig-economy’ has facilitated greater managerial control of work process and worker performance (Vallas and Schor, 2019), using digital service platforms such as Uber and Deliveroo. This may have exacerbated the ‘commoditization’ of labour (Gandini, 2019).
An important counter-narrative views self-employment as a proxy indicator for those engaged in ‘entrepreneurial’ activity (Parker, 2018). While self-employment is concentrated in sectors such as skilled trades, transport services, food, drink and accommodation services, there are growing numbers of high earning self-employed graduates in so-called ‘knowledge economy’ activity. This narrative may extend to other intrinsic motivators such as sense of autonomy and well-being (Warr and Inceloglu, 2018) or management of work–family balance (Johansson Sevä and Öun, 2015). A minority of recorded self-employment activity takes the form of second job activity, supplementing earnings from primary paid employment.
Patterns of self-employed working may be highly gendered (Craig et al., 2012), with women concentrated in low-wage sectors, such as in child-minding and other care-providing activity (Patrick et al., 2016; Saridakis et al., 2014). The self-employed are on average older than the employed, although the self-identity of older self-employed may be contested and unclear (Mallett and Wapshott, 2015). Self-employment is more prevalent among ethnic minority and immigrant groups, perhaps for ‘push’ reasons (Abada et al., 2014; Clark and Drinkwater, 2000). These patterns all have implications for poverty and deprivation. Qualitative research suggests that rising self-employment and sole-trader business formation has contributed to a rise in in-work poverty (Galloway et al., 2016), while policy commentary highlights the risks of long-term financial insecurity (D’Arcy and Gardiner, 2014).
In this article, we examine prior-validated indicators of household and child material deprivation to describe levels of poverty in self-employed households from 2010 to 2018. We show that these households report lower levels of earnings, although this is not necessarily reflected in higher household material and child deprivation. We compare earnings disadvantage with material deprivation because reported earnings in self-employment may be subject to measurement error. This allows us to assess whether material deprivation in self-employment is consonant with low reported earnings. We then discuss the extent to which the poverty gap between employed and self-employed households reflects the precarious nature of the self-employed workforce or reflects divergence in the composition and characteristics of the self-employed compared with the employed. We use matching methods to construct comparisons of households containing self-employed workers with counterfactual households of solely employed workers. This permits robust comparisons of their reported levels of material and child deprivation. We then compare these with reported earnings. Household material deprivation comparisons show that the poverty gap between the two groups, while significant, is narrower than that suggested by matched earnings comparisons. This suggests that the self-employed are exposed to risk of poverty because of both compositional factors (age, education levels, occupation, household characteristics, etc.) and the precarious nature of self-employment. We show that at the lower end of the earnings distribution, where risk of material and child deprivation is much higher, households with self-employed earners are much more likely to rely solely on self-employed earnings from a single worker.
Background
Self-employment in the UK
Prior to the COVID-19 pandemic, numbers of self-employed in the UK peaked at almost 5 million, or 15.3% of those working, according to UK official survey data. Numbers had increased by a million over the previous decade. The proportion is high in comparison to most OECD economies. Although men remain over-represented among the self-employed, female self-employment particularly in part-time work has grown (Meager, 2019; ONS, 2018). There is above average self-employment among some ethnic groups (ONS, 2020). As noted in the introduction, the self-employed are heterogeneous across a wider range of sectors and occupations and span the full range of skill levels. Self-employment is also more prevalent in rural areas where wages are particularly low, although numbers have grown rapidly in London and southeast England (ONS, 2020), where opportunities for freelancing and ‘gig-working’ have developed faster. As also noted, self-employment also encompasses a range of forms. Over two-thirds of the UK self-employed work for themselves (ONS, 2020). The remainder are either employers or are in dependent self-employment – subcontracting or freelancing. Numbers of dependent or ‘gig-working’ self-employed have grown (Williams and Horodnic, 2019). Because many forms of self-employment may be associated with low earnings and precarious work, this leads to concern about the relationship between self-employment and poverty.
Income poverty and self-employment
Earnings data can provide important information on poverty. The stronger left-skew in official survey data on self-employed earnings, prima facie, suggests higher levels of income poverty among the self-employed (ONS, 2018). However, income poverty estimates for households with self-employed workers depend on reliable and comparable earnings data. Conceptually, the earnings of the employed arise from labour. For business-owning self-employed, earnings are business profits. The recording of the former in advanced economies is through administrative tax systems, in which employers deduct income tax and social insurance payments and apply tax credits at source (in the UK ‘pay-as-you-earn’). The recording of the latter is through self-reported business accounts and subsequent assessment of income tax and social insurance payments. Profit earnings depend on the permissiveness of accounting conventions governing the treatment of business expenses, investment expenditure and depreciation charges. For example, the home-based self-employed might book household or professional expenditures as business expenses in a manner not permitted to paid employees.
Regardless of questions of equivalence, a second issue is that the recording of self-employment income might be subject to greater non-deliberate measurement error, as well as deliberate under-recording of income; for example, where additional informal economy work is possible (Williams and Nadin, 2012). This will induce measurement bias, with implications for income poverty comparisons.
Approaches for assessing the extent of income under-recording have been proposed (Lyssiotou et al., 2004; Pissarides and Weber, 1989). Estimates appear sensitive to the choice of methodology and to the nature and completeness of data (Åstebro and Chen, 2014), and are conditional on the cultural acceptability of tax evasion. Parker (2018) documents other measurement issues, including survey question design, non-response and the difficulty of separating the return to capital in entrepreneurial income from the reward for labour input (Henrekson and Sanandaji, 2011). An important conclusion is that such attempts at correcting self-employment earnings might provide for adjustments for comparisons of means. They are unlikely to be sufficiently sophisticated to provide correction at other points in the distribution. We therefore conclude that statements about poverty in self-employment will be problematic if based solely on income poverty measures.
Measuring poverty as material deprivation
Measuring income is an indirect approach to measuring poverty, since it subsumes a relationship between spending power and standard of living (Halleröd, 1995; Ringen, 1988), and therefore focuses on ‘income-deficiency’. Alternative direct methods of measuring poverty can not only avoid income mismeasurement but also address individual or household capabilities for achieving a particular standard of living (Sen, 2009). For example, the EU, in support of its social inclusion agenda, has developed direct indicators to enhance international comparisons and tracking of poverty incidence (Atkinson et al., 2002). Direct methods, such as the use of multidimensional deprivation scores, may reflect preferences rather than genuine inability to meet need. Notwithstanding this objection, material deprivation indicators developed from well-established applied poverty research may provide a more robust avenue for assessing the impact of poverty in self-employment. We are aware of no previous analysis of this issue from the perspective of material deprivation. This is surprising given the problems of measuring income from self-employment.
The use of non-monetary material deprivation indicators to understand poverty was developed in Peter Townsend’s pioneering work. This conceptualized two core elements of poverty: inadequate resources and inability to participate (Nolan and Whelan, 2010; Townsend, 1979). Material deprivation measurement asks individuals or households whether they can access items indicative of ability to sustain a basic standard of living or well-being. Questionnaire items elicit information about sufficiency of resources to buy representative basic household items as well as ability to enjoy non-monetary goods such as leisure activity. They also typically elicit information on the ability to provide these goods for children if present in the household. Such domains might be particularly significant when comparing the employed and self-employed. For example, the self-employed typically report long hours of work. Long working hours might indicate a high level of personal commitment to the development of a business enterprise or a desire to take advantage of available business opportunities. So monetary earnings might appear reasonable but being ‘time-poor’ may leave the self-employed individual, their household or children materially deprived in terms of ability to participate. A key distinction is between ‘enforced lack’ and ‘unenforced lack’ (Mack and Lansley, 1985).
Taking its lead from Townsend’s conceptual thinking, research addresses how to capture material deprivation using survey instruments. This research agenda has not, of course, escaped critique – especially as early approaches used ‘expert selection’ to define deprivation, rather than asking populations to state what they deem necessary for a basic standard of living (Platt, 2019). Needs for domestic items such as consumable durables may be socially constructed, may reflect changing relative prices or obsolescence of old technologies. For example, items about microwave, VCR player or dishwasher ownership might reveal different information today than 30 years ago. Or social interaction with family or friends might now depend on access to broadband or smartphones in a way not possible in 1990. How quickly norms about consumption needs change is a moot point. Selection of deprivation items needs to be robust to changing patterns of behaviour and technologies, as well as collectively capturing all aspects of the underlying poverty concept (content validity). Item selection should permit the construction of an analysable continuous variable and provide poverty indicators which are easy to understand (Berthoud et al., 2004). So, survey instruments tend to avoid items on consumer durables ownership or aspects of food expenditure (Willitts, 2006).
Research questions
Since the global financial crisis, economic austerity has impacted lower earners hard in many countries, including in the UK. While average earnings may have kept pace with average consumer prices (inflation), austerity policies have impacted lower earners more, both because their earnings have not kept sufficient pace with price changes (Bourquin et al., 2019) and because of heavier reliance on provision of public services to support standards of living and well-being (Stuckler et al., 2017). The COVID-19 pandemic is likely to have exacerbated these trends. For low-income households reliant on self-employment in the UK, earnings may not have grown at the same pace as for the employed because they have not benefitted from the protection provided by uprating of the National Minimum (now Living) Wage. The growth in self-employment in the UK over the period since the 2008 crisis may reflect changing employment patterns and aspirations among less skilled and low earning workers. Indeed, unscrupulous employers seeking to remove minimum wage and social protection coverage through changes to contracting may provide an explanation for growth in ‘dependent-contractor’ self-employment (Katz and Krueger, 2019; Román et al., 2011).
Our interest here is therefore on material deprivation among households with self-employed workers, and on the experience of these households compared with those with employed workers. We face the issue that the unit of analysis for poverty research is typically the household or family. However, households comprise groups of adults, not all of whom are economically active. Where they are economically active, there may be a mix of employment and self-employment. Our specific attention, therefore, is on deprivation within households which contain self-employed workers (hereafter ‘self-employed households’) as distinct from households with only employed workers (hereafter ‘employed households’). Within this first group, we include multiple earner households where at least one worker is self-employed. This raises questions about household structure and self-employment, particularly in multiple earner households, on which we will reflect later.
As noted, our focus on deprivation arises from a concern to provide reliable poverty comparisons between employed and self-employed households. Our primary focus is also on deprivation rather than inequality. Inequality comparisons, while of interest, will reflect our concerns about earnings definition and measurement. They may also be insufficiently revealing about the struggle of the lowest earners to achieve a decent standard of living. Our data source, described below, allows us to address both household material deprivation, and, for households with dependent children, child material deprivation. Understanding patterns of material deprivation among households where self-employment plays a significant part in patterns of economic activity is reflected in three specific research questions:
RQ1: To what extent do earnings data suggest that self-employed households are exposed to greater poverty, when compared with employed households?
RQ2: Do self-employed households experience different patterns of household and child material deprivation to employed households, and do such differences reflect patterns of difference in earnings data?
RQ3: Do differences in household and child material deprivation experienced by self-employed households reflect differences in the characteristics of self-employed individuals, or their different exposure to poverty when undertaking otherwise equivalent forms of work?
Addressing RQ1 and RQ2 will inform reflection on the poverty experience of households which rely on self-employed work. Using methods explained in the next section, addressing RQ3 provides a more robust means of comparing the poverty experience of self-employed and employed households. We reflect on two issues. The first is the extent to which the different experience of the two may reflect self-selection decisions based on characteristics and circumstance. The second, derived from earlier discussion on measurement, is the extent to which reported earnings of self-employed households can be treated as a reliable indicator of poverty risk.
Data and method
The data source for our analysis is the UK Family Resources Survey (FRS). The FRS is a nationally representative annual household survey administered since 1994 by the Office for National Statistics for the UK Government, Department for Work and Pensions. It informs policy on income, financial and housing resources, family circumstances and living conditions, and employment. To provide robust findings we consider nine fiscal years from 2010/2011 to 2018/2019. The survey covers between 19,000 and 21,000 households annually. The set of household material deprivation items remains unchanged from 2010/2011. At the time of analysis, 2018–2019 was the most recent survey released. Information is collected on the employment activity and earnings of all adult household members, as well as demographic and educational characteristics and information on household circumstances. We focus on households whose ‘reference person’ was aged between 18 and 59 years of age to avoid a further confounding issue of part-time working in later years and pension earnings. 1
The FRS collects annual information on household material deprivation, using a set of nine questionnaire items which are standard to other UK surveys. The items asked are as follows:
Are you able to keep your home warm enough?
Do you have a holiday for at least one week a year, which is not staying with relatives?
Do you have enough money to keep your home in a decent state of decoration?
Do you have household contents insurance?
Do you make regular savings of £10 a month or more for ‘rainy days’ or retirement?
Do you replace any worn out furniture?
Do you replace or repair major electrical goods such as a refrigerator or a washing machine, when broken?
Do you have a small amount of money to spend each on yourself (not on your family)?
Do you keep up with bills and any regular debt repayments?
From these a material deprivation score is computed, ranging from 0 to 9, by counting the number of items that the household is unable but would like to achieve. Table 1 summarizes the distribution of scores for 2010/2011 and 2018/2019. Just over half report zero material deprivation in 2010/2011, with the proportion slightly higher for the self-employed. However, reported material deprivation is lower in 2018/2019, with 59% of employed households and 62% of the self-employed households reporting a zero score. Figure 1 shows that average household material deprivation scores are slightly lower for self-employed households. The deprivation score rises for both groups until 2012/2013 and then falls steadily, although this may reflect slow change in norms of consumption needs. In all years, the difference in the average score is statistically significant, using paired-sample t-tests.
Material deprivation incidence in employment and self-employment.
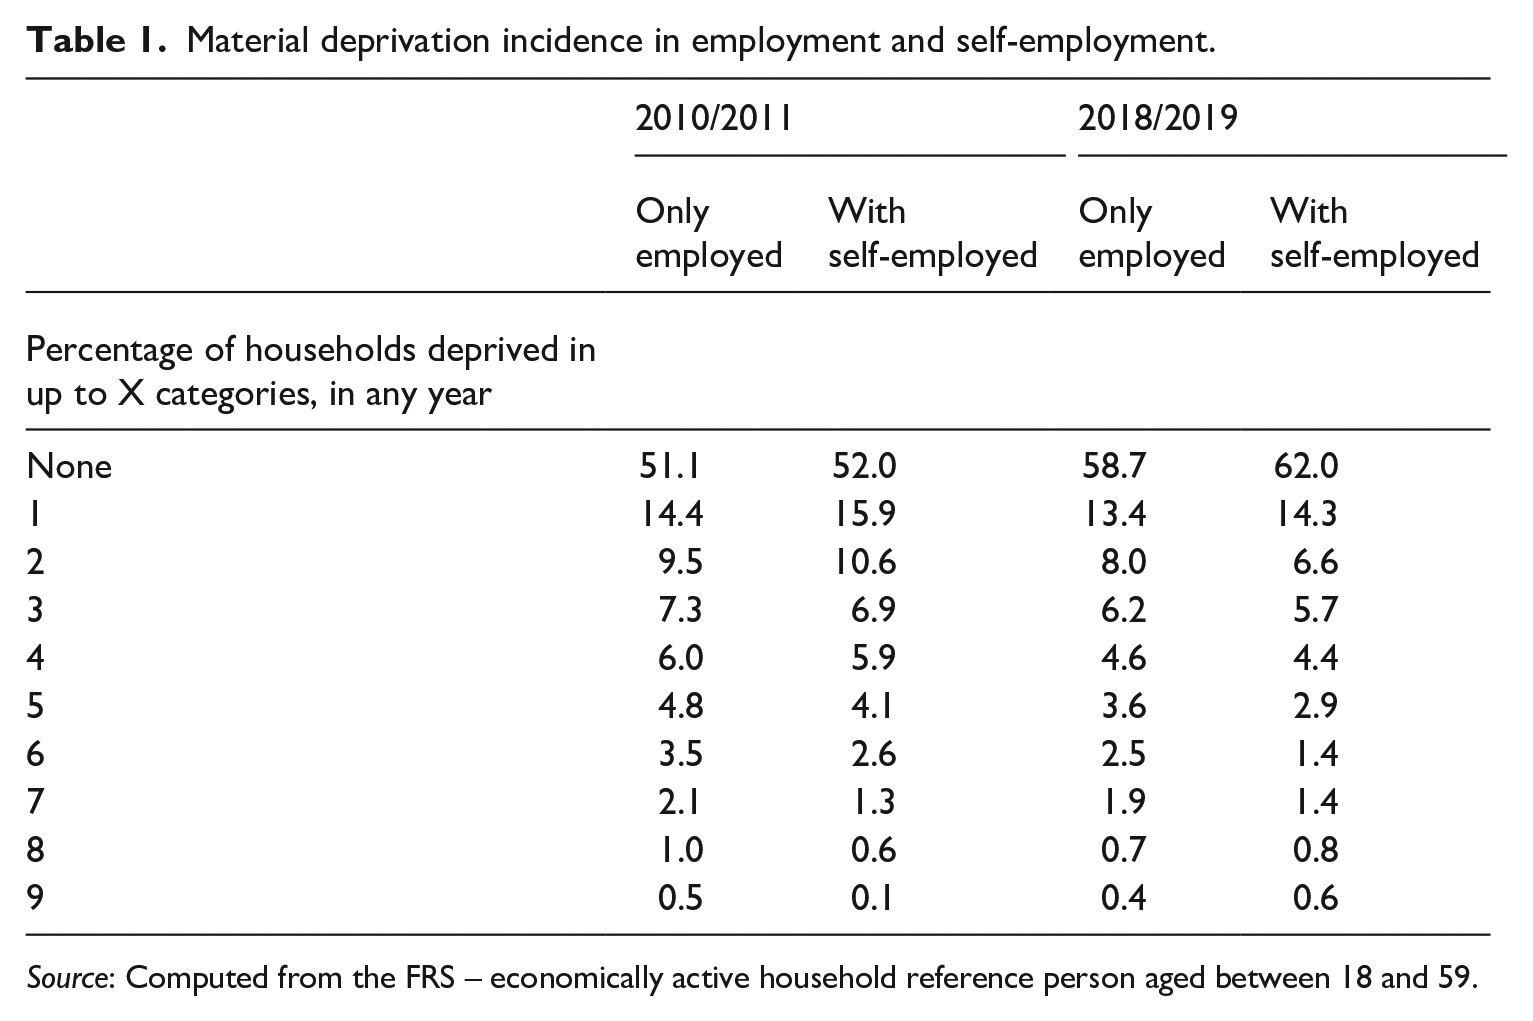
Source: Computed from the FRS – economically active household reference person aged between 18 and 59.
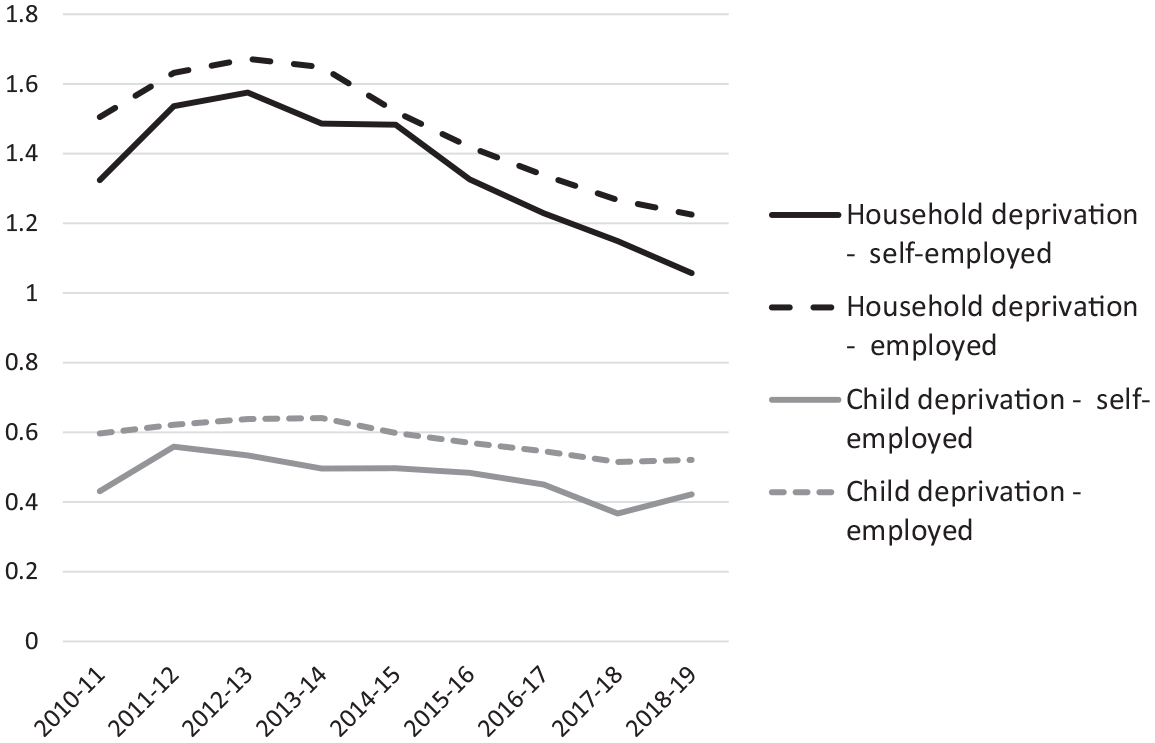
Average material deprivation scores for self-employed and employees.
A further set of 11 items ask about child material deprivation in households with dependent children:
Does your child have a family holiday away from home for at least one week a year?
Are there enough bedrooms for every child of 10 or over of a different sex to have their own bedroom?
Does your child have leisure equipment such as sports equipment or a bicycle?
Does your child have celebrations on special occasions such as birthdays, Christmas or other religious festivals?
Does your child do a hobby or leisure activity?
Does your child have friends round for tea or a snack once a fortnight?
Does your child attend at least one regular organized activity a week outside school, such as sport or a youth group?
Does your child eat fresh fruit and/or vegetables every day?
Does your child have a warm winter coat?
Does your child go on school trips?
Does your child have an outdoor space or facilities nearby where they can play safely?
From these, a child material deprivation score, ranging from 0 to 11, is computed. Table 2 reports the distribution of these scores. A zero child deprivation count is reported for 65% and 71% of employed and self-employed households in 2010/2011. These rise to 70% and 76% in 2018/2019. Figure 1 suggests little movement in average child material deprivation scores. In most years, the difference between the two groups is statistically significant if quantitatively small. However, the small household and child material deprivation gaps between employed and self-employed households paint a different picture from that seen in reported headline differences in earnings (ONS, 2018).
Child material deprivation incidence in employment and self-employment.
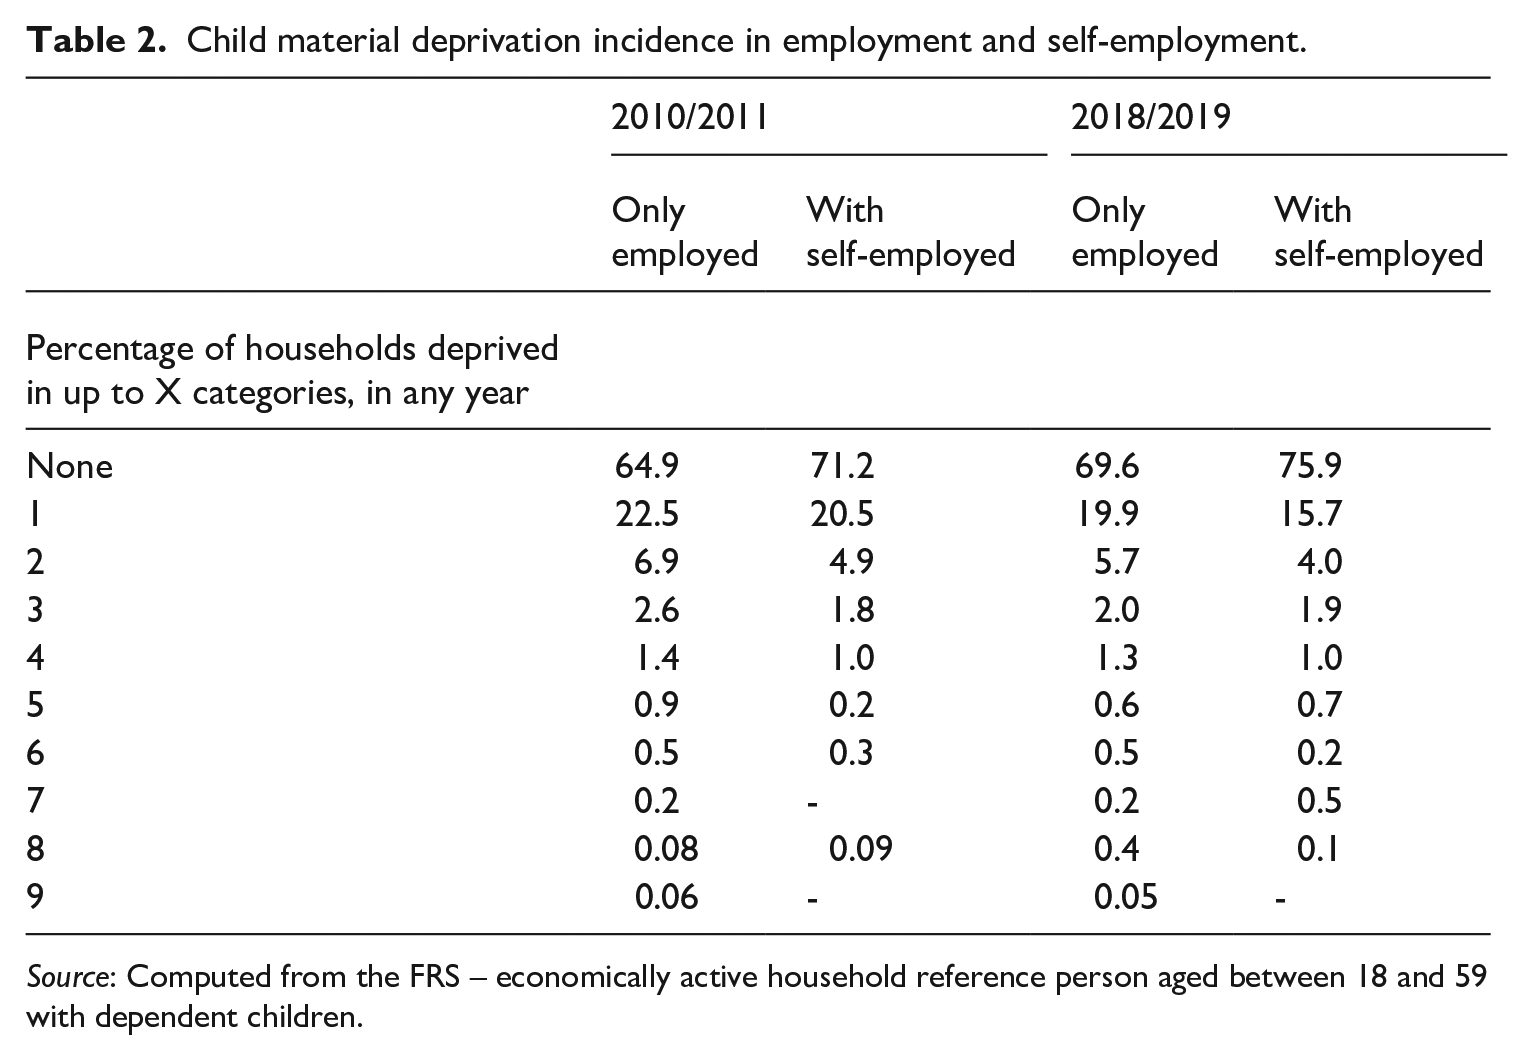
Source: Computed from the FRS – economically active household reference person aged between 18 and 59 with dependent children.
The FRS collects detailed information on earnings. For employed individuals, earnings data are collected from most recent pay slips. For the self-employed, the collection of earnings information is more complex, depending on whether interviewers could consult recent annual business accounts. For the majority who prepare accounts for tax reporting purposes, self-employment earnings are recorded as a monthly apportionment of previous tax year annual business profits, reflecting the share of the business owned if a business partnership. 2 For the minority without accounts, either because they are recently self-employed or are dependent contractors paid regularly by an employer, an estimate of regular self-reported earnings is recorded. Post-tax (net) earnings are calculated after deducting a monthly apportionment of income tax and social security payments (the latter paid at a lower rate in the case of the self-employed). For the purposes of analysis, we trim earnings for the self-employed at the 2nd and 98th percentiles, before computing household earnings. This removes households reporting zero or negative business profits in the most recent year, and households with very high levels of profits which are top-coded by the FRS. 3 Earnings are also adjusted for inflation using the UK consumer price index.
There is evidence of a higher skew in the self-employed earnings distribution, and this is reflected in summary measures of inequality. For example, in 2018/2019 the Gini coefficient for the individual self-employed monthly earnings distribution is 0.506 compared with 0.347 for the employed. Despite the self-employed reporting longer weekly hours of work, a wider inequality gap is apparent in the distributions of individual hourly net earnings. Gini coefficients are 0.508 and 0.304 for the self-employed and employed in 2018/2019. This is consistent with greater dispersion in working hours as well as earnings. Adjusting for inflation there is no significant growth in earnings for either group over the period. However, self-employed earnings are substantially and consistently lower. The difference in each year, amounting typically to just under £500 per month, is highly statistically significant using paired-sample t-tests. Household net labour earnings are computed by totalling post-tax earnings from employment or self-employment of all economically active within the household.
Comparisons between employed households and self-employed households are of considerable value, but do not reflect the extent to which individuals may intentionally be selected into one or other form of employment. Thus, comparisons may not be between two groups who are otherwise randomly sampled. Extensive quantitative research has sought to identify factors which distinguish the self-employed from the employed (Parker, 2018; Simoes et al., 2016), and demonstrates differences in terms of demographics, education, cognitive and non-cognitive skills, industrial, occupation and spatial context. This literature provides a good basis for choosing control factors for statistical matching methods (Guo and Fraser, 2015; Li, 2012). Our purpose here is to understand whether differences in material deprivation between households arise from the self-employed being at greater (or lower) risk of experiencing deprivation when undertaking equivalent work, holding other characteristics constant, which might be associated with the capacity of the household to earn.
Using such methods and with good statistical matching, it is possible to compare poverty levels between matched samples of self-employed and employed. A range of different matching methods are available to researchers – we use propensity score matching (PSM), although our findings are robust to alternative methods, such as nearest-neighbour matching. These methods address selection bias by eliminating systematic differences between the treated and control group. Self-employed status is modelled as a ‘treatment’. 4 After conditioning on appropriate control variables and with a high quality of sample matching, the difference in the poverty outcomes between self-employed households and matched control groups should be unrelated to being in self-employment. The matching method imputes missing selection-corrected outcomes for the self-employed group in the sample.
The mean difference of the observable outcome and counterfactual outcome of, in this case, the self-employed group is known as the average treatment effect on the treated (ATET). Formally this can be expressed as:
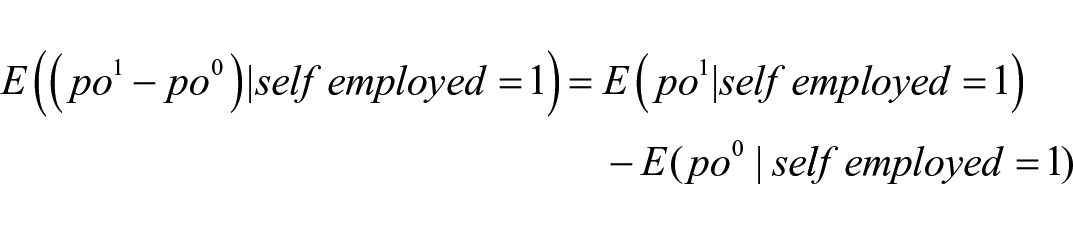
where E is the expectation operator, po1 is an observable poverty outcome and po0 is the unobservable counterfactual poverty outcome. A logit model is used to estimate propensity scores for the probability that individual i is self-employed in any year:

where Xi is the set of individual i’s prior characteristics which affect both being self-employed and the poverty outcome, and h are estimated coefficients which weight the importance of each characteristic in the calculation of the propensity score. Estimation is performed using the ‘teffects’ command in the Stata software package, version 16. 5
Findings
Figure 2 charts average household material deprivation score for the self-employed against their counterfactual score computed from the propensity score matched sample of the employed for each year. It also shows the gap between actual and counterfactual (deprivation ATET). In all years but one, self-employed households have a worse mean material deprivation score than they would in the counterfactual employed case. In 2018/2019 only, there is no positive gap between the two. In earlier years, the estimated gap is generally small, ranging from 0.07 to 0.19 deprivation count points, and amounting to between 2.5% and 14.1% of the average deprivation count for the self-employed sample. The gap is statistically significant at 5% or better in three of the nine years and at 10% or better in a further two.
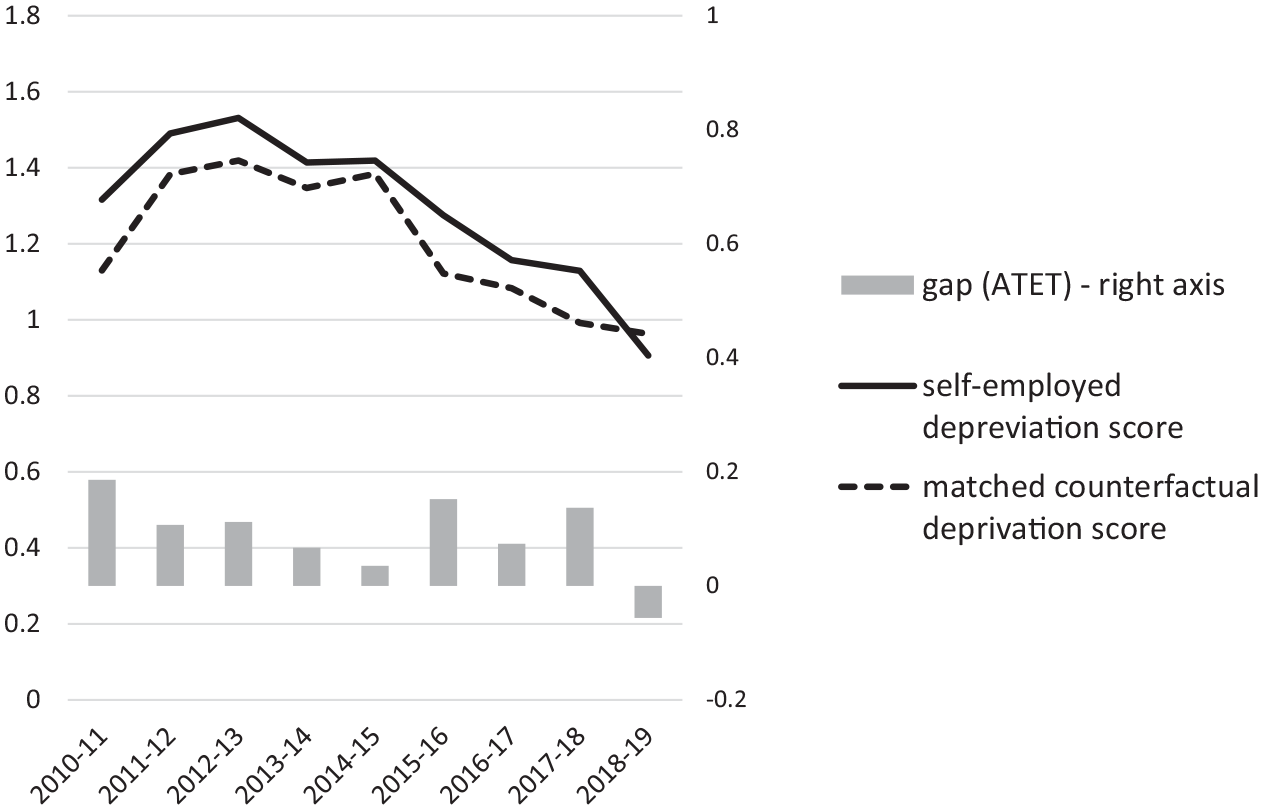
Matched sample differences in average household deprivation.
How does this gap compare with that in earnings? Figure 3 plots the difference between average post-tax monthly household labour earnings of self-employed households and the matched counterfactual sample (earnings ATET). The estimated gap between actual and counterfactual earnings is quantitatively large; the self-employed on average earn between £223 and £537 less per month than the matched counterfactual sample of employees, depending on survey year. This amounts to between 7% and 16% of the average of the self-employed sample. The gap is also strongly statistically significant in every year, and, although it is highest in the earliest year, there is no discernible trend over time. This gap is also consistently negative whereas the difference in raw average earnings for the two groups fluctuates between +£132 and –£120 over the period of analysis.
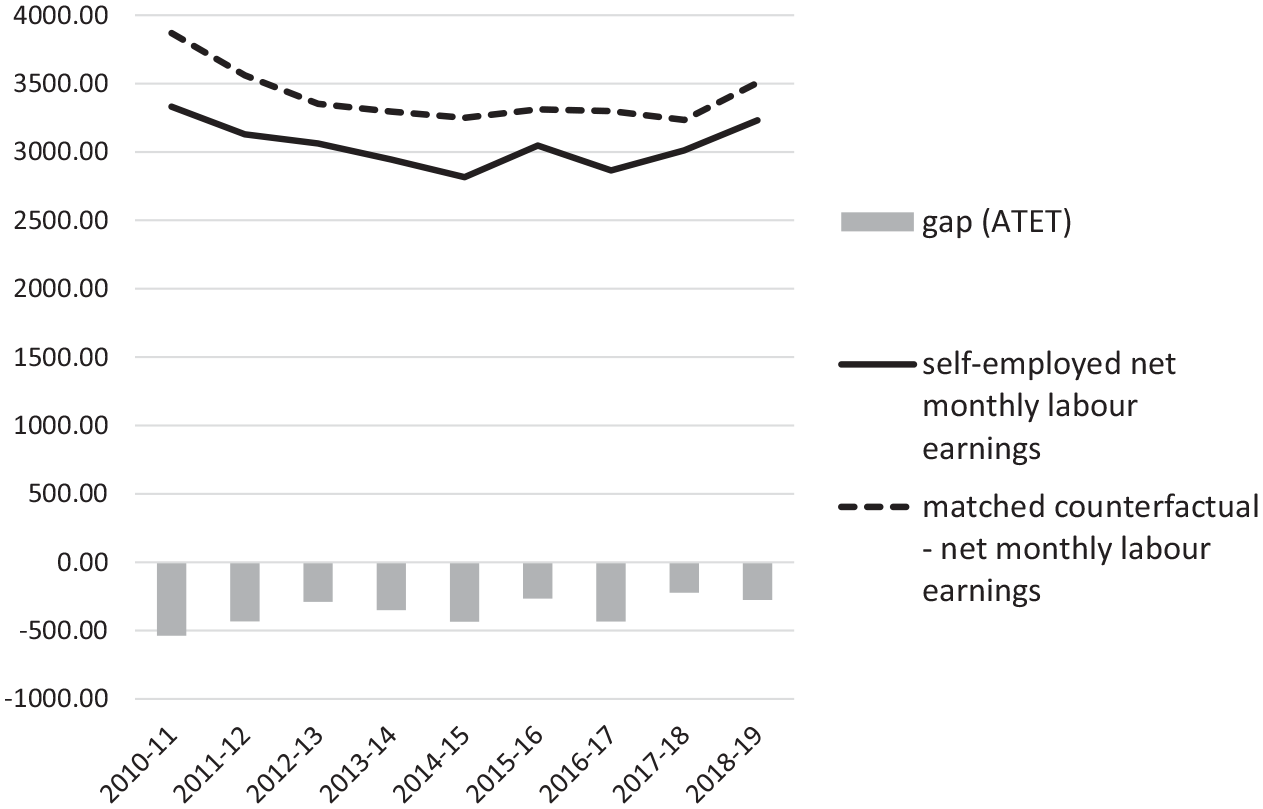
Matched sample differences in average monthly net household labour earnings.
These findings suggest that, holding control factors constant, a self-employed household might at the average expect to report an improvement in post-tax monthly earnings of up to one-sixth more in paid employment, but may see little or no significant improvement in their material deprivation count. Modest differences in the levels of household material deprivation between self-employed and employed do not appear consistent with the large gaps in measured household earnings.
Differences in monthly earnings may reflect hours of work differences between the self-employed and employed. However, the self-employed on average report longer working hours. Assuming hours are measured accurately, this suggests that the self-employed can mitigate the potential impact of household material deprivation by working longer hours (and taking shorter vacations) to boost monthly earnings. Further analysis, available on request, undertaken using an individual worker sample base, reveals that the self-employed earn significantly less after tax per hour than a matched counterfactual sample of the employed.
In Figure 4, we turn to child deprivation for self-employed households with one or more dependent children. The child deprivation score is highly correlated with the material deprivation score of households with dependent children (e.g. a correlation coefficient of 0.67 in 2018/2019). Actual and matched sample child deprivation scores for self-employed households mirror each other closely, and the gap (ATET) is statistically significant, indicating worse child deprivation in self-employed households, in only two of the nine years. Figure 5 confirms the explanation for this. It shows that for those households with children (shown in black) there is no consistent gap (deprivation ATET) between actual and matched samples, despite average household deprivation counts being higher. On the other hand, for self-employed households without children (shown in grey) there is a wide, and statistically significant, gap between their actual household deprivation and the lower level they might experience if they switched to paid employment. The small, estimated gap in household material deprivation, seen in Figure 2, is an average of a narrow or non-existent gap for those with children and a wide and significant gap for those without children. In further analysis, we find that these deprived self-employed with no children (relative to their matched employees) are more likely to be female and older, less educated, and more concentrated in the skilled trades occupational group. 6
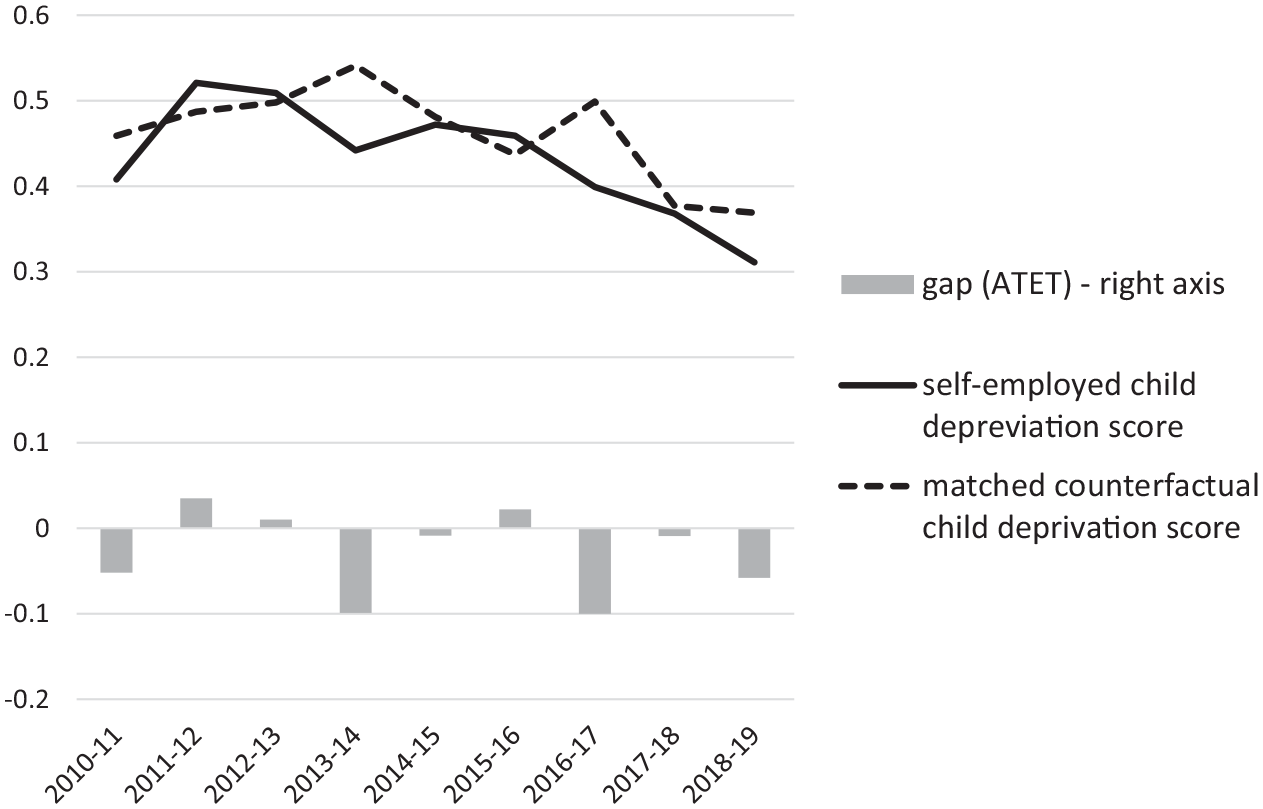
Matched sample differences in average household child deprivation.
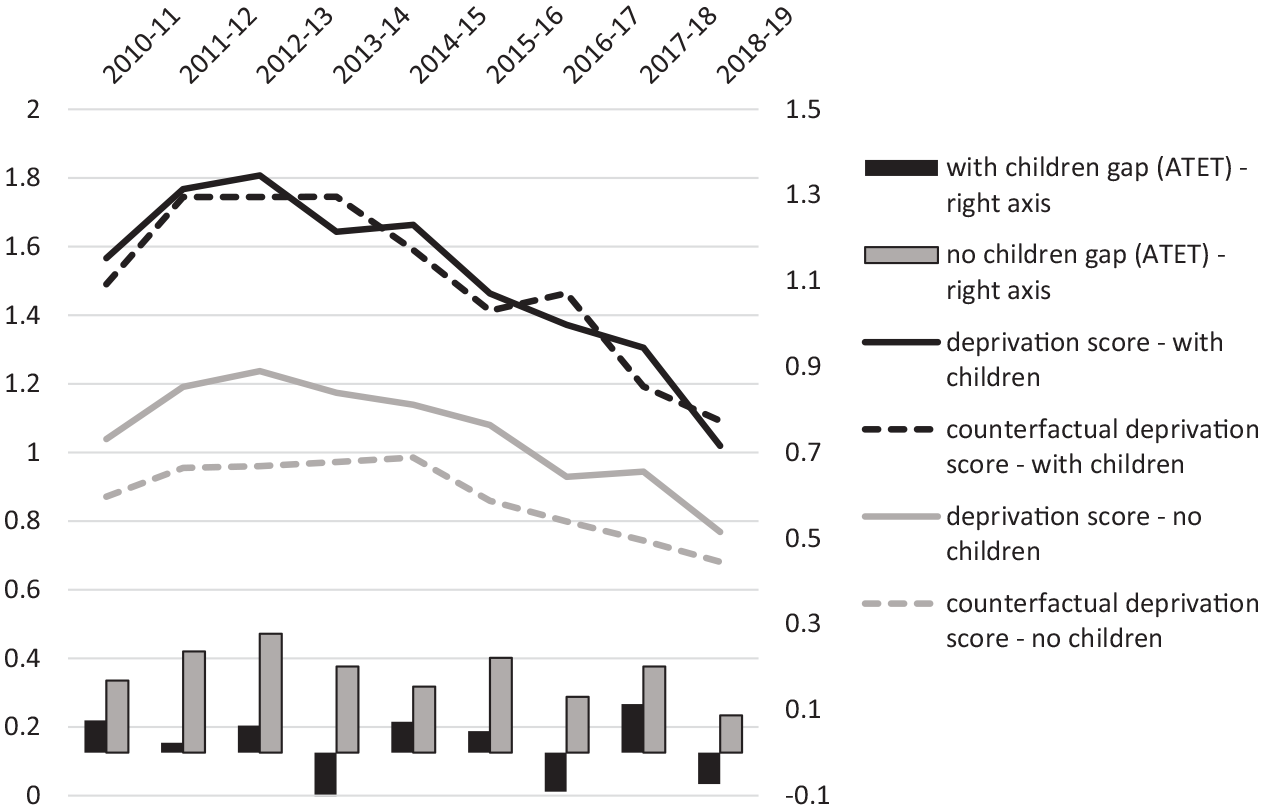
Matched sample differences in average household material deprivation – households with and without children.
Estimates of gaps in earnings and deprivation at the average of the distribution may be informative about the incidence of poverty. So, in Figure 6, we report further analysis across the distribution of household earnings. In panel (a), we show net monthly labour earnings of self-employed households at the mid-point in each decile (i.e. 5th, 15th, 25th, etc. percentiles) and compare these with matched employed household sample points. Here matching samples and ATETs are computed using the method set out in Firpo (2007) and implemented for the Stata software program by Frölich and Melly (2010). The estimated earnings gap (earnings ATET) is proportionately much larger in the lowest deciles. Self-employed households are more disadvantaged relative to equivalent employed households at the lower end of the distribution. Self-employed households in the highest decile only report earnings which are higher than those in the matched employer household sample (i.e. a positive ATET). These gap estimates are statistically significant for every decile.
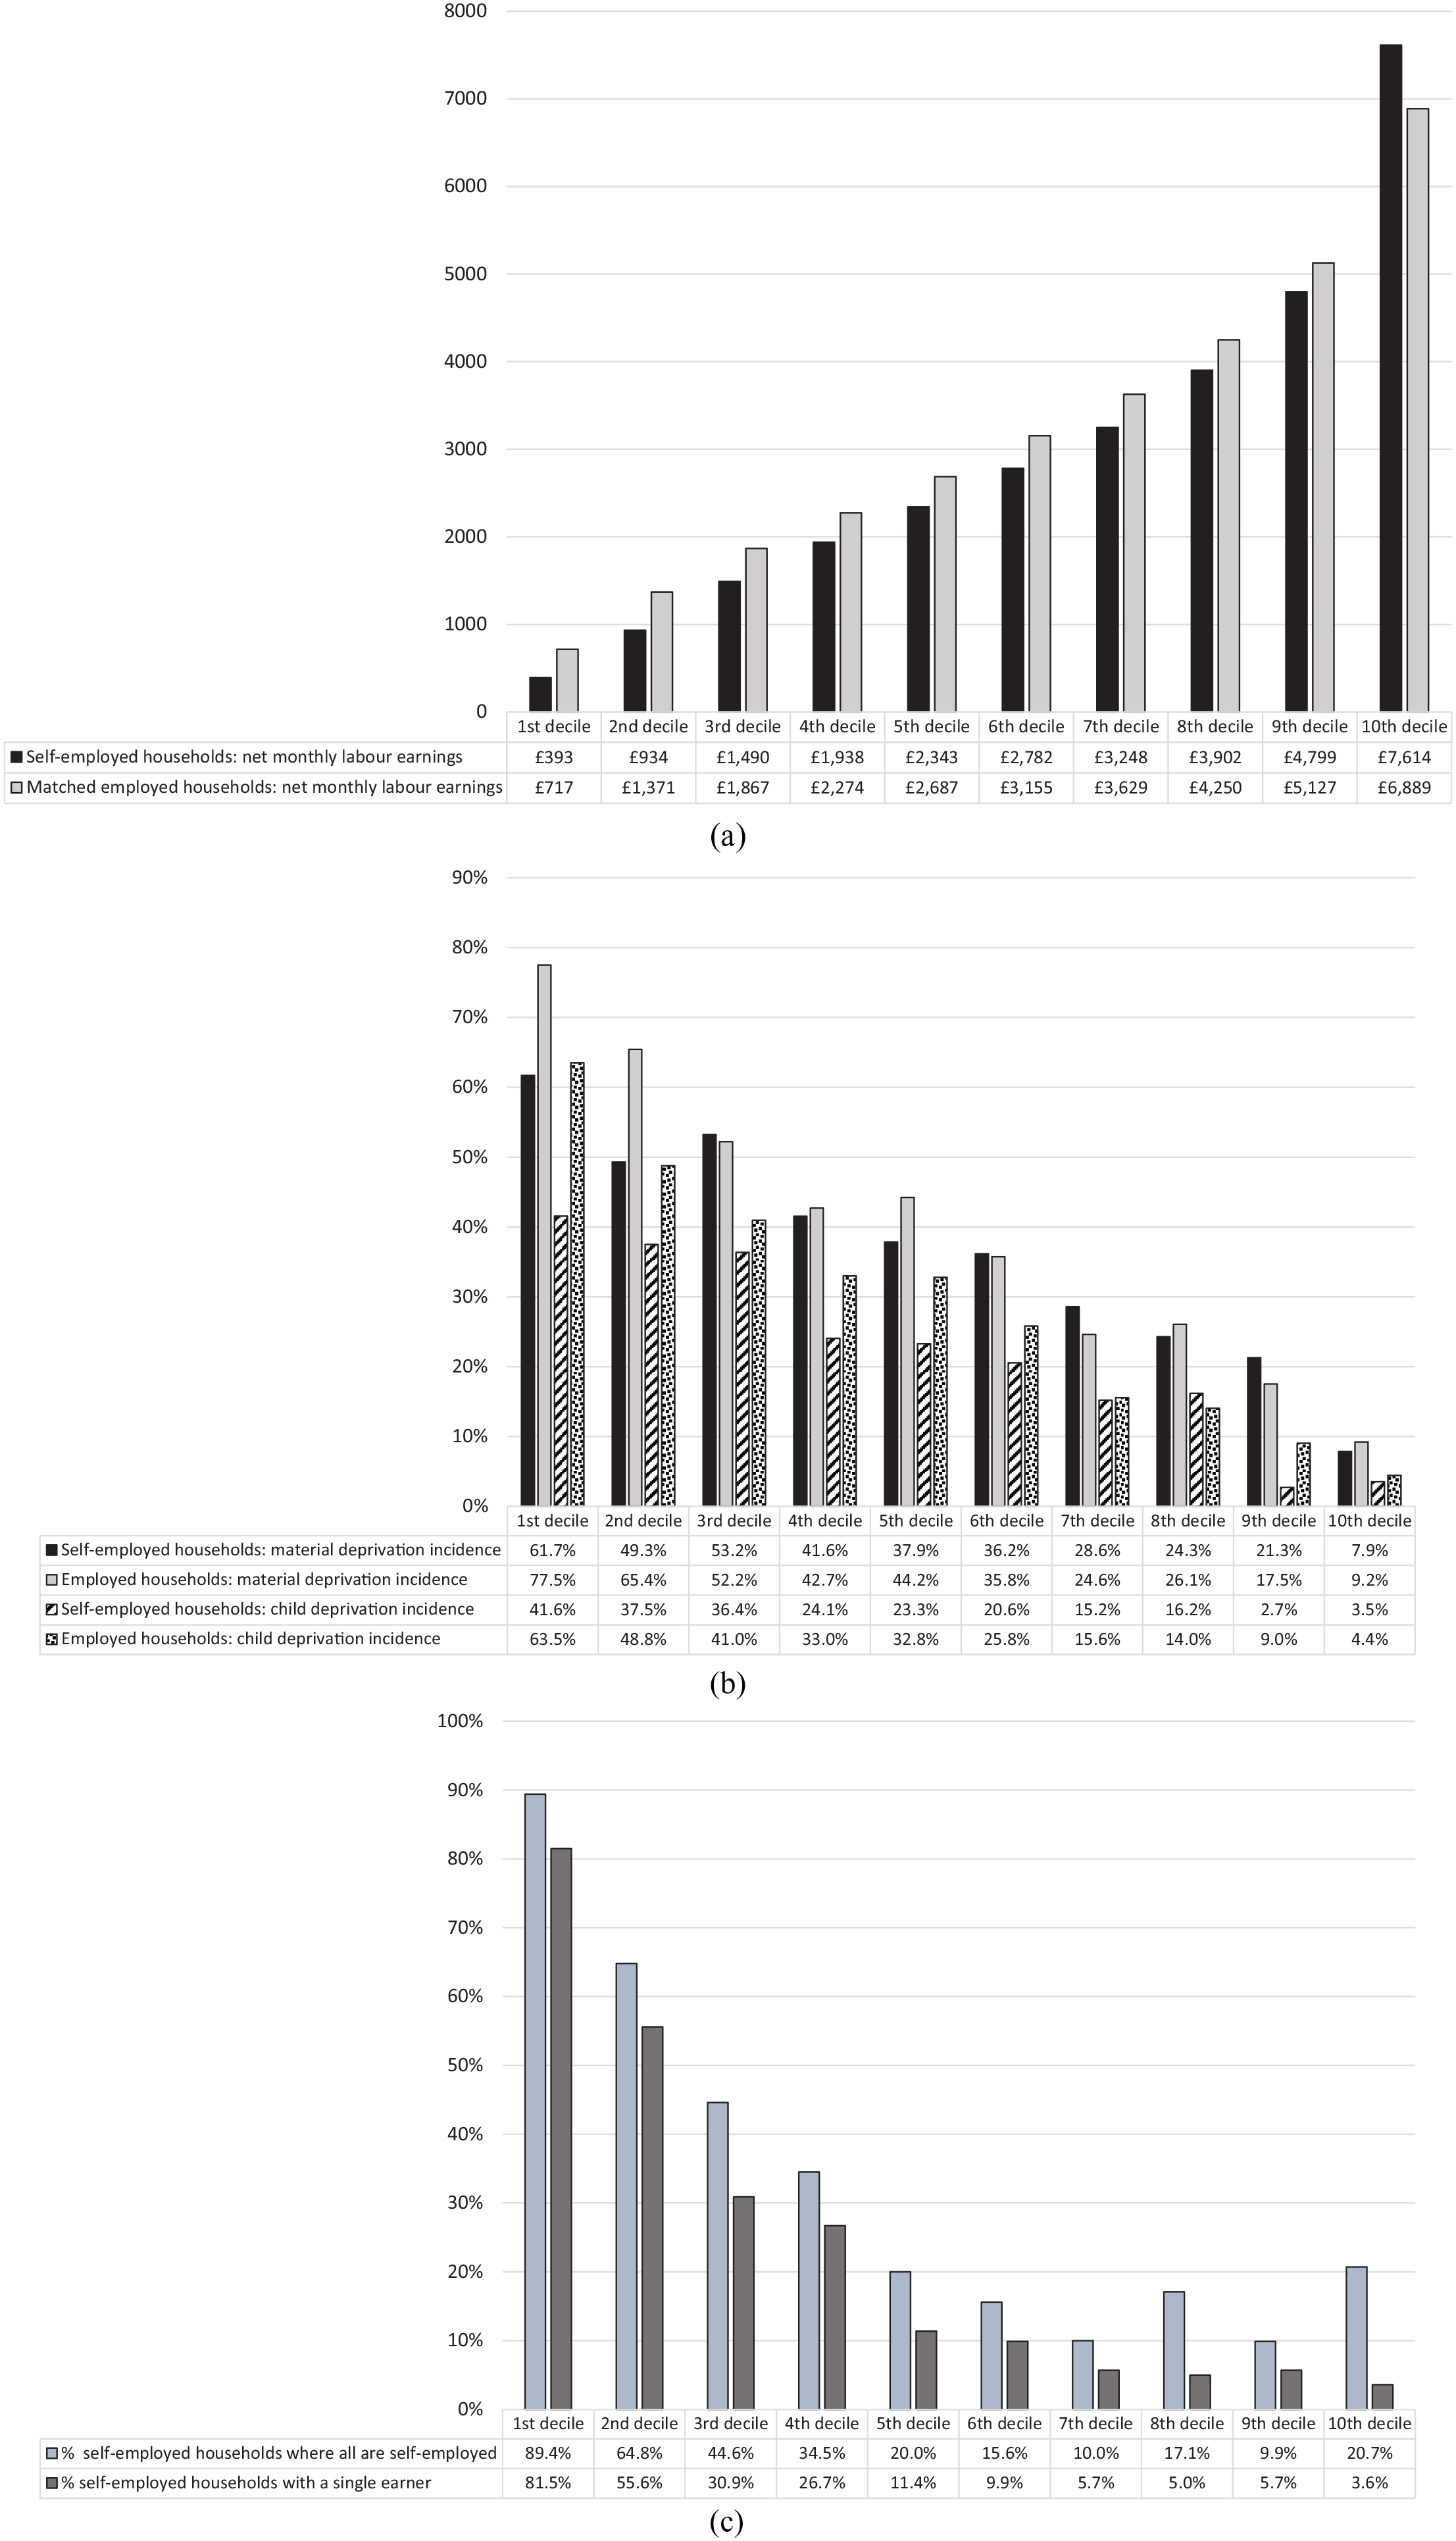
Analysis by household income decile, 2018/2019. (a) Self-employed household labour income and matched employed household labour income. (b) Incidence of deprivation (% of households reporting at least one item of deprivation). (c) Composition of self-employed households.
In panel (b), we compare this measured earnings disadvantage with household material and child deprivation for the households in each decile. We show here the percentage of households (self-employed and employed) in each decile of the household earnings distribution who report one or more items of material or child deprivation. 7 So, for example, 61.7% of self-employed households in the first earnings decile report at least one item of deprivation. Incidence of deprivation is, unsurprisingly, concentrated in the lower deciles. Particularly in the lowest two deciles, self-employed households report a lower incidence of material deprivation than comparable employed households, despite their high relative earnings disadvantage. This same feature is also seen in the incidence of child deprivation for households with children. Lower reported child deprivation in self-employed households extends further from the first to the sixth decile. There are several possible explanations for this clear finding of higher deprivation among the lowest employed households. Under-recording of self-employed earnings (working for cash) may be more prevalent in the lower deciles. Low earning employed households may be ‘underemployed’ and may not be less able to increase hours of work to desired levels to boost earnings. This might be a consequence of the growth in ‘zero-hours’ contracting. There may also be reasons why poorer self-employed are less likely to report a lack of certain items; for example, because they have ‘trade’ skills which better enable them to keep the home and its contents in a good state of repair, because they can self-adjust work hours around children’s needs, or because greater earnings volatility demands a more ‘active’ approach to regular savings.
A final issue concerns whether measured household earnings in self-employed households in the low end of the distribution are associated with heavy household reliance on self-employed work. In panel (c), we show, for each decile of the household earnings distribution, the percentage of households who rely solely on self-employed earnings. Sole reliance arises because either all earners in the household are self-employed or because the household has a single self-employed earner. The chart shows that households in the lowest deciles are more likely to rely solely on self-employment income. In the first and second decile of the household earnings distribution, self-employed households are 89% and 65% comprised solely of self-employed earners, respectively. Above the median, only between 10% and 21% of these households rely solely on self-employed earnings. The higher figure in the tenth decile reflects households with multiple self-employed professionals. Further analysis, not in the figure, also reveals that the single earner self-employed households in the lower deciles are much more likely to comprise a sole female earner. In the lowest decile, 38% of self-employed households have a sole female earner, compared with less than 5% above the fourth decile. In a similar vein, 82% and 56% of self-employed households in the first and second deciles respectively have a single self-employed earner. These data suggest the extent to which lower earning self-employed households are at greater risk because of their sole reliance on potentially more volatile self-employed earnings.
Discussion
The research questions concern whether self-employed households are exposed to higher levels of poverty. The context is rising UK self-employment over the past decade or more (until the onset of the COVID-19 pandemic). This is consistent with growing levels of precarious work (Kalleberg, 2011), and the increased use of dependent self-employment and ‘gig-work’ as a means of increasing labour flexibility (Wall, 2015; Wieteke and Schippers, 2019; Williams and Horodnic, 2019). On average, self-employed households report higher earnings (RQ1) and lower material deprivation (RQ2). Our findings also show that comparisons with statistically matched employed households reveal a different picture (RQ3). Both on average and at most points along the earnings distribution, self-employed households earn significantly less than comparable employed households. Relative disadvantage is greater within the lowest deciles. Raw differences reflect characteristics and circumstance and may arise because of self-selection decisions.
We also find a similar reversal in the pattern of household material deprivation. Self-employed households experience slightly higher deprivation than matched employed households. This gap is not as wide, consistent with previous research on measurement of self-employed earnings (Åstebro and Chen, 2014; Parker, 2018). The self-employed may not deliberately conceal earnings; differences could be due to tax treatment of expenses. Lower social security (national insurance) contributions may offer a partial explanation but also signal the value of higher social protection (Román et al., 2011).
There is little difference in average levels of child deprivation reported by self-employed households. So, despite lower reported earnings, self-employed households at risk of poverty may prioritize access to resources and support for children. It is among those self-employed households without children where access to other forms of support appears restricted. Younger households without children may be more exposed to precarious forms of self-employment with volatile and insecure earnings. These are the self-employed households at most risk of material deprivation relative to comparable employed households. UK social protection policy needs to give renewed attention to the risk of poverty among this group (Danson et al., 2021).
In our data, neither employed nor self-employed households have seen a real terms increase in reported post-tax earnings until the very end of the period of analysis. This suggests similarity of experience for the employed and self-employed following the global financial crisis. However, average reported levels of material deprivation in both groups have been falling, and at broadly similar rates. Our analysis largely pre-dates reform of the UK welfare system (Universal Credit) and coincides with policy which emphasized in-work social security payments, especially for families with children. However, norms about material needs may not remain constant. Items such as insurance and consumer durables may have become cheaper for poorer households to obtain. Wider access to the internet and digital technologies may have changed norms about social contact with family and friends. The paradox of stagnant earnings and falling deprivation has been noted (Bourquin et al., 2019), but needs further investigation.
Household composition is important, confirming previous research on division of work within self-employed households (Craig et al., 2012; Johansson Sevä and Öun, 2015). Self-employed households in the lowest earnings decile are at greatest risk of experiencing both household and child deprivation, although less so than employed households. These households are more likely to rely solely on earnings from self-employed work, and on the earnings of one individual self-employed worker, and more likely to be female. Further analysis should address issues of household composition and the heterogeneity of self-employment in greater detail, as well as the extent to which certain deprivation items are appropriate for capturing the experience of self-employed households. This could lead to a refined conceptual understanding of poverty in households which rely on self-employment.
Material deprivation in self-employment may have been alleviated by unreported or even informal economy earnings through the ‘austerity decade’. This is an issue which is not readily addressed using official survey data (ONS, 2018). The possibility that self-employed households engage more than employed households in informal activity may also indicate their greater exposure to earnings volatility. This speaks to the wider debate on the drivers behind the rise of precarious, dependent self-employment. These include globalization, technological change, weakening of collective representation and labour market deregulation (Kalleberg, 2011; Wieteke and Schippers, 2019; Williams and Horodnic, 2018, 2019). In traditional narratives of ‘entrepreneurial’ self-employment, a desire for autonomy has been seen as an important driver (Croson and Minniti, 2012). Paradoxically, the growth of dependent self-employment and gig-working points not only to income insecurity but also to a loss of agency, identity and control (Gandini, 2019; Vallas and Schor, 2019). In turn, this highlights the urgency of policy reform (Danson et al., 2021; D’Arcy and Gardiner, 2014; Taylor, 2017).
At the time of writing, the self-employed in the UK have been severely affected by the economic impact of the COVID-19 pandemic. Early evidence from other data sources suggests that many self-employed experienced significant falls in earnings, only partially mitigated by the UK Government’s self-employment income support scheme (Reuschke et al., 2020). Given time lags in the release of FRS data, it remains to be seen how the crisis has impacted further on the risk of poverty for low-income, self-employed households.
Conclusion
This article has addressed poverty in self-employment in the UK – an issue of growing salience given the rising scale of self-employment. Given questions about the reliability of self-employed earnings data, we have sought to focus on material and child deprivation, using information from an official UK annual household survey. Our principal finding is that, controlling for the selective nature of self-employment, self-employed households experience higher levels of material deprivation. At the lower end of the earnings distribution where risk of material deprivation is higher, self-employed households are exposed to greater risk of poverty because of greater reliance on the earnings of a sole, probably precarious, worker. However, there are qualifications. First, the deprivation gap between the self-employed and the employed is proportionately much smaller than the gap in earnings. This is consistent with greater measurement error in self-employed earnings. Second, although average levels of deprivation are higher among self-employed households with children, there is no appreciable deprivation gap when compared with matched employees. The gap is widest for self-employed households without children. Low earning self-employed households with children may adopt strategies such as working longer, relying on wider family or community support, or accessing welfare benefits not available to childless workers to protect children. Third, despite economic austerity and stagnant real incomes over the past decade, there is no evidence for rising material deprivation among the self-employed, at least prior to the COVID-19 crisis. This paradox has been previously noted but may indicate the extent to which deprivation norms are not stable, even over a relatively short period of time.
Supplemental Material
sj-docx-1-wes-10.1177_09500170221092640 – Supplemental material for Is Rising Self-Employment Associated with Material Deprivation in the UK?
Supplemental material, sj-docx-1-wes-10.1177_09500170221092640 for Is Rising Self-Employment Associated with Material Deprivation in the UK? by Andrew Henley in Work, Employment and Society
Footnotes
Acknowledgements
The author would like to thank the editor and three anonymous referees for their helpful comments and suggestions.
Funding
The author received no financial support for the research, authorship, and/or publication of this article.
Supplemental material
The supplementary material is available online with the article.
Notes
References
Supplementary Material
Please find the following supplemental material available below.
For Open Access articles published under a Creative Commons License, all supplemental material carries the same license as the article it is associated with.
For non-Open Access articles published, all supplemental material carries a non-exclusive license, and permission requests for re-use of supplemental material or any part of supplemental material shall be sent directly to the copyright owner as specified in the copyright notice associated with the article.