
Abstract
Using a correspondence field experiment, the study reported in this article has investigated if immigrant job applicants with equivalent qualifications are treated differently in the Finnish labour market. The study consists of 5000 job applications that were sent out to 1000 advertised positions by five applicants of Finnish, English, Iraqi, Russian and Somali backgrounds, who differed only in their names. The findings show that applicants of immigrant origin receive significantly fewer invitations for a job interview than the native candidate, even if they possess identical language proficiency, education and vocational diplomas. However, the extent of discrimination is not equally distributed among the immigrant groups. Rather, job applicants from non-European backgrounds seem to suffer a significantly greater labour-market penalty. The findings clearly suggest that, despite anti-discrimination legislation and measures aimed at promoting equal employment opportunities, discrimination continues to remain a serious barrier to immigrants’ labour-market integration in a Nordic welfare society.
Introduction
A large body of research conducted in various countries has highlighted discrimination for its role in depressing immigrants’ effective integration into the labour market (e.g. Carlsson, 2010; Drydakis and Vlassis, 2010; Fibbi et al., 2006; Heath and Cheung, 2007; Kaas and Manger, 2011; McGinnity and Lunn, 2011; Midtbøen, 2015; Weichselbaumer, 2015). Immigrants’ disadvantaged status has been reported not only with regard to career advancement, job prestige and periods of employment and unemployment but also in terms of wage levels and permanent or short-term employment contracts (e.g. Andriessen et al., 2012; Brekke and Mastekaasa, 2008; Uhlendorff and Zimmermann, 2014). Immigrants of non-European backgrounds especially are said to suffer greater employment disparities (Branker, 2017; Pendakur and Pendakur, 2011). The differences in labour-market indicators still persist when factors related to human capital are held constant. However, it is not only first-generation immigrants who confront barriers in the labour market, but also second-generation immigrants with domestic qualifications face greater unemployment risks and low occupational attainment compared with their native counterparts (Birkelund et al., 2017; Rydgren, 2004; Verkuyten and Zaremba, 2005).
While discrimination has been commonly reported as one of the significant factors for dampening immigrants’ employment prospects, theoretical explanations of why there is discrimination vary with respect to different disciplinary approaches. In sociology, these explanations are often derived from conflict theory (Tilly, 1998; Tomaskovic-Devey, 1993), which regards discrimination as an attempt by the dominant group to protect and maintain its privileged access to scarce resources, such as jobs, by excluding members of the subordinate groups. Through strategic and self-interested actions, the members of the dominant group are said to strive to sustain a system of inequality in order to preserve their exclusive privileges (Reskin, 2000). Social psychological explanations for ethnic inequality in employment are generally rooted in social cognitive theory. According to this perspective, people have a tendency to automatically categorise others into in-groups and out-groups (e.g. Fiske et al., 1999). On the one hand, automatic categorisation may help people to process the vast amount of incoming information in a complex world (Fiske, 1998). On the other hand, social categorisation can potentially create biases in our understanding and evaluations of others.
In labour economics, two main theoretical explanations have often been put forward: pure discrimination and statistical discrimination models. The pure discrimination model assumes that certain employers, co-workers, or consumers belonging to the majority group have a ‘taste’ for discrimination and they will pay a premium to avoid members of some group that they dislike in order to cater to their prejudices (Becker, 1957; Kirschenman and Neckerman, 1991). In contrast, the statistical discrimination model claims that it is not prejudice that encourages employers to discriminate against immigrant workers, but, rather, it is imperfect information about these workers’ true productivity that compels them to engage in discriminatory practices. When faced with uncertain situations, employers are claimed to rely on their stereotypes or generalisations and they may use race, skin colour or group membership as a proxy for aspects of productivity that are relatively expensive or impossible to measure (Kirschenman and Neckerman, 1991; Phelps, 1972). The article will test some of the assumptions of these models in the light of the empirical data gathered for this study.
In addition to these conceptual explanations, a more recent theoretical framework, often called aesthetic labour, shifts attention to another form of labour-market discrimination. Stemming from the classic work on emotional labour, it suggests that the hireability of job applicants in interactive service work can also be affected by their physical appearance and attributes, and other corporeal dispositions (see Nickson et al., 2001; Warhurst et al., 2000). Employers prefer to hire workers who look good and sound right and who, in their perception, would more favourably appeal to their clients’ sensibilities (Nickson et al., 2012). These embodied attributes are then further mobilised, developed and commodified by organisations. Some studies suggest that even the accent of immigrant jobseekers can result in disparate outcomes. For example, Timming (2017) reports that while applicants with British-accented English received the most favourable response in telephone-based job interviews, managers actively discriminated against applicants speaking English with a Chinese, Mexican and Indian accent in jobs requiring face-to-face contact with customers.
While these theoretical explanations allow us to understand the phenomenon of discrimination from multiple perspectives, it is challenging to measure labour-market discrimination itself in terms of how much of it is a result of employers’ discriminatory practices and how much of it is an outcome of immigrants’ inadequate human capital. In this regard, one of the methods commonly employed to measure discrimination is called correspondence technique (e.g. Rich, 2014). In this approach, pairs of fictitious job applicants send out substantively similar CVs and job letters to the advertised job vacancies. The pairs of applicants are equivalent across all respects except for the basis of discrimination, namely ethnicity. Applicants’ ethnic background in CVs is signalled via carefully chosen popular names that provide a strong clue about a candidate’s ethnic affiliation. As all the important variables can be controlled in fictitious CVs, the correspondence method is considered as one of the best methodological tools by which discrimination can be measured objectively.
Over the past two decades, a number of studies using this technique have been carried out in various Western countries to study labour-market discrimination (e.g. Andriessen et al. (2012) in the Netherlands, Baert et al. (2017) in Belgium, Bertrand and Mullainathan (2004) in USA, Carlsson (2010) in Sweden, Drydakis and Vlassis (2010) in Greece, Fibbi et al. (2006) in Swizerland, Kaas and Manger (2011) in Germany, McGinnity and Lunn (2011) in Ireland, Midtbøen (2015) in Norway, Oreopoulos (2011) in Canada, and Wood et al. (2009) in Britain). It is because of their strong methodological advantage in collecting factual evidence that correspondence experiments have also been employed for testing biases in a variety of other contexts, such as house rental (Carlsson and Eriksson, 2014), mortgage lending (Hanson et al., 2016), business loans from financial institutions (Palia, 2016) and political interactions (Butler and Broockman, 2011).
Study objectives and hypotheses
The article addresses a number of questions with attendant hypotheses. First, do Finnish employers discriminate against immigrant job seekers of English, Iraqi, Russian and Somali backgrounds at the callback stage, even if they possess the required credentials for the job applied for? Previous scholarship on labour-market inequality has frequently reported the presence of discrimination towards minority candidates in hiring. Thus, hypothesis 1a is that the same trend will be found in Finland as well, and immigrant applicants will receive fewer callbacks than the Finnish candidate. Also, is the ethnic penalty greater for applicants of European than non-European origin? Ethnicity research suggests that immigrants who are more distinct from the mainstream group across multiple dimensions will encounter a more hostile reception from the mainstream population (Ford, 2011; Sides and Citrin, 2007; Sniderman et al., 2004). In accordance with these findings, hypothesis 1b is that we will find more discrimination to be occurring against Iraqi and Somali applicants, who are less proximate to the majority population in terms of colour, culture, religion and economic level of the country of origin than English and Russian candidates.
Second, do immigrant men face more discrimination than immigrant women in their job search? In this regard, relevant research has often put forward two hypotheses: double burden hypothesis (DBH) versus subordinate male target hypothesis (SMTH). The former claims that immigrant women will potentially confront more discrimination because of their being both immigrant and women. In contrast, the latter postulates that male immigrants will suffer greater ethnic penalty because they are perceived as more threatening (e.g. Berdahl and Moore, 2006; Sidanius and Veniegas, 2000; see also Bendick et al., 1991). Inclining towards the SMTH thesis, hypothesis 2 is that we will find male immigrant applicants facing more discrimination than female immigrant applicants, since they may not only be perceived as more threatening but also as job takers who compete with native workers, especially in low-paid occupations.
Third, is the level of employer discrimination greater in customer-contact jobs? According to the pure discrimination model, employers may be more discriminatory in these jobs as they may perceive that customers do not want to engage in transactions with immigrants. By recruiting people from the majority group, especially in front-office jobs, employers may think that they are in fact serving the firm against customers’ negative reactions towards immigrant workers, as ethnicity is often regarded as a proxy for interpersonal proximity (Elsass and Graves, 1997). Thus, if discrimination is greater in jobs where contact with customers is required, it would give support to the pure discrimination model (hypothesis 3a). Also, is there more discrimination in occupations in which fluent Finnish language is required? According to the statistical discrimination model (Phelps, 1972), employers would be more averse to hiring immigrants in jobs necessitating greater language skills, as they may perceive them as having less language proficiency. In selection procedures, they may view such criteria as skin colour or group membership as a proxy for language competency. Thus, hypothesis 3b is that if there is more discrimination in jobs requiring fluent proficiency, it would provide support for the statistical discrimination model. However, if discrimination is evenly spread across all types of jobs, this may be regarded as a support for the pure discrimination model.
The study reported in this article makes contribution to the relevant literature on a number of levels. First, many correspondence studies have been conducted in various countries including the United Kingdom, Ireland, Germany, France, the Netherlands, Italy, and the USA. However, there has previously been no such study carried out in Finland. Therefore, apart from being a timely addition to the literature, it also sets a benchmark for future correspondence studies in Finland for monitoring whether or not the trends in discrimination have changed over the years. Second, it is important to replicate correspondence tests in different cultural and institutional contexts to observe whether and to what extent discriminatory practices against job seekers of immigrant origin vary with respect to different ethnic groups. Third, the present study has been conducted among second-generation immigrants. The focus on this group is important: as has often been argued, the success and failure of the children of immigrants who are brought up and who have attained their entire education and work experience in the new society is the ultimate benchmark of their integration. The present study thus contributes to the literature in this regard, as less research has concentrated on this group. Also, with a few exceptions (such as Booth et al., 2012; McGinnity and Lunn, 2011), most of the studies using the correspondence tests have focused on groups from developing countries that may not be favourably perceived by the majority population. The present study comprises both European as well as non-European groups. It is important to include both these groups, since attitudes toward immigrants’ recruitment, among others, may vary substantially based on their country of origin. Last, several attitudinal surveys (such as Jaakkola, 2005, 2009) conducted in Finland suggest that immigrants from Western countries, such as Britain and Norway, occupy a high place on the ethnic hierarchy, whereas immigrants from developing countries may be viewed rather negatively. This study provides empirical evidence of whether and to what extent these attitudes are translated into the labour market in terms of a distinct set of opportunities for these groups.
The Finnish context
Along with Ireland and some southern European countries, Finland has experienced rapid immigration over the past two decades. Previously, its particularly restrictive immigration policy as well as peripheral location had permitted only very limited immigration to the country. The rapid expansion in immigrant population is reflected by the fact that, while the proportion of people with a foreign background stood at 0.8% in 1990, it has risen to around 7% of the total population in 2017. However, the number of immigrants in Finland is still numerically modest and is among the lowest in the Nordic countries. The composition of the foreign population is diverse, with family reunions, return migration of people with Finnish ancestry from the former Soviet Union, studies and work commonly constituting the reasons for migrating to Finland. Included among the foreign population are also refugees who fled war and ethnic strife in Somalia, Iraq, Afghanistan and the Balkans. In 2017, the major countries of origin for immigrants included the former Soviet Union (75,801), Estonia (49,424), Iraq (19,932), Somalia (19,807) and the former Yugoslavia (12,229). Demographically, the age structure of the immigrants is dominated by rather younger cohorts. In 2016, 76% of people with a foreign background were of working age (between 25 and 64 years), whereas this figure was 62% for the native Finnish population (Ministry of the Interior, 2018).
Although several important measures and initiatives, such as the Government Integration Programme, have been adopted by the different concerned departments to improve immigrants’ position in the labour market and society at large, the disparities in various labour-market indicators persist. For example, the unemployment rate of men and women with a foreign background stood at 14.4% and 17% in 2014, whereas these figures were 8.4% and 6.3% for native Finnish men and women, respectively. These unemployment figures are exclusive of immigrants that were employed under subsidised or labour-training measures with temporary contracts. Within the immigrant population, the employment rates of immigrants of European background are higher than that of those originating from Asia or Africa. People of African and Middle-Eastern origin have been reported to encounter the greatest problems in finding employment. Immigrant workers are also often employed in short-term and part-time jobs with less favourable working conditions than the native Finnish workers (Saukkonen, 2017). These jobs, as a general rule, are also exposed to a greater level of employment volatility in times of economic recession. In addition, immigrants also work more frequently in jobs incommensurate with their qualifications compared with the native Finns (Myrskylä and Pyykkönen, 2014).
As regards the sectoral distribution of immigrants in Finland, the retail trade and service sectors have been the main areas of their employment, especially for immigrants from non-Western countries (e.g. Sutela, 2015). The health care sector has also experienced a growth in immigrant presence during recent years. However, their higher representation in these sectors may also be due to reduced competency requirements and labour shortages. With respect to the immigrant groups focused on in this study, in 2013 immigrants from Iraq, Russia and Somalia living in the capital Helsinki were generally employed in jobs in hotel and catering, health and social services, the retail trade, and administrative and support services (Saukkonen, 2017).
Design of the experiment
This field experiment was conducted between June 2016 and March 2017 by responding to 1000 job postings that were listed on te-palvelut.fi, the website of the Finnish national employment service. Five fictitious job applicants of Finnish, English, Iraqi, Russian and Somali backgrounds sent substantively similar job applications to each of these openings. This meant sending out 5000 applications to various firms located in major cities in Finland. Half of the jobs were answered with male and half with female names in all the five groups, but the men and women did not apply for the same position. The ethnicity of the job applicant was indicated to the employer in two ways: by carefully chosen ethnically distinguishable names and by explicitly mentioning the mother tongue of the applicant in the CV. Both first and last names were used. The names were first selected from different websites that listed the most common/popular English, Iraqi, Russian and Somali names during the period 2016–2017. These names were then consulted with immigrants of the respective groups, and the final names chosen were those that they thought were most representative of their groups.
The job application consisted of a letter of application and a CV. The five letters sent for any job were equivalent in terms of content. The letters conveyed a strong impression that the job candidate was a motivated, ambitious and pleasant person. The style and grammar of the letters clearly reflected that the immigrant applicant possessed an excellent proficiency in the Finnish language. The order of assigning letters to the five candidates was changed each time they responded to a certain vacancy. All the ethnic applicants stated that they had received their entire schooling, vocational diplomas and work experience in Finland. The objective was to ensure that employers did not discriminate against immigrant applicants because they had obtained education and work experience abroad. The age of the applicants varied between 24 and 28 years. When they responded to the same vacancy, the age difference among them varied between five months to one-and-a-half years. These slight variations were introduced in order to avoid risk of detection.
The CVs were randomly created by using a CV generator software. This software is similar in functionality to the one described by Lahey and Beasley (2009). The CV generator created five different but equivalent CVs across all attributes for the five candidates answering the same job opening. The CVs contained information on applicants’ age, gender, education, previous work experience, professional diploma, skills in Finnish and English language, names of educational and professional institutions at which they had obtained their education and diplomas, mother tongue, hobbies, and postal address and phone number. All the CVs were identical in terms of education, previous experience and vocational diplomas. All the ethnic applicants reported excellent proficiency in the Finnish language. Thus, in effect, the only respect in which the five applicants differed was in their name. The job openings tested were located in five occupational sectors, namely restaurant and catering, the retail trade, cleaning, clerical and customer service, and included from unskilled and medium-skilled to high-skilled occupations. Both men and women applied for jobs in the restaurant and catering, retail trade and cleaning sectors, but only women responded to jobs in the clerical and customer service sectors. The aim behind this choice was to avoid gender bias in selection procedures, since women often dominate office and customer service jobs in Finland, as elsewhere.
As is the common practice in Finland, all the positions tested in this study were applied for through email. The employers could reach the applicant either by email or telephone. The employers’ calls were not attended directly. Instead, the employer was requested to leave his/her message in the voicemail box, which was separately set up for each of the candidates. The employer responses to a job application were classified into three categories: the cases in which the applicants received a callback, when they were formally rejected and when they received no response from the employer at all. A response was categorised as positive when the employer invited the applicant to attend an interview. In contrast, a response was considered as negative if the applicant was formally rejected or received no response from the employer.
Methods of analysis
In the present article, logistic regression analyses are used to describe the effect of the independent variables on the odds of receiving a callback from the employer. Each category of an independent variable gets a parameter. The greater the parameter is, the greater the odds are of receiving a callback for the group members in comparison with the reference group (the last category of the independent variable). The logistic regression model is a standard tool to analyse connections between a binary dependent variable and a number of independent variables. In the case of a binary dependent variable, linear regression could, for example, lead to problems of producing negative expected odds or probabilities greater than one, and these can be avoided with logistic regression. The coefficients of the model obtained by logistic regression express expected change in the dependent variable when we move from one category to another on the independent variable when other independent variables are held constant. If we compare the odds for two values of an independent variable, we get the odds ratio showing the expected change in the odds due to the change on the independent variable. The coefficients of the model give an estimate of the change in odds when random variation and the influence of the other independent variables have been removed from the observed values of the independent variable. The odds ratios are given both in logarithmic form (B) and in the exponential form (Exp(B)). The change is always given in relation to a reference category, which is given in the tables. The statistical significance of the parameters (the probability of obtaining the odds ratio given by the model, if the null hypothesis were true) is also given in the tables.
The study data consist of responses to the five applications submitted for each job. It is possible that each employer has a slightly different response pattern compared with other employers. The effect could be producing intra-employer correlations that would contradict the basic assumption of regression analysis (i.e. the independence of cases in the data). This might have an influence on the standard error estimates of the parameters, and thus the tests of significance. In order to exclude the possible inaccuracy that could follow from this phenomenon (sometimes called clustering effect), a modified version of the logistic regression model fitting was used. This can be done in SPSS in a couple of ways. In this case, a complex sample design was used. This requires defining a complex analysis plan, where each case is given a weight of 1, and a clustering variable is given. In this analysis, clustering was determined by the variable identifying responses by each employer as a cluster (job number). Then, SPSS (IBM SPSS Statistics version 25) will run an analysis of weighted data taking into consideration the possible clustering effect.
Results
Does discrimination vary by job applicant name?
Table 1 summarises the main results of the field experiment by presenting a description of employer responses to the 5000 job applications sent by the five equally qualified candidates. In addition to the callback rates, the table includes two models. Model 1 tests whether the differences in the distributions of responses were statistically significant by fitting a logistic regression model. The null hypothesis assumed that none of the immigrant groups are different from the Finnish group. Model 2 tests whether there were gender differences in responses and whether the gender effects varied between the Finnish and immigrant applicants, as stated in hypothesis 2.
Callback rates by job applicant name and gender, with logistic regression models testing odds ratios by gender and applicant groups.
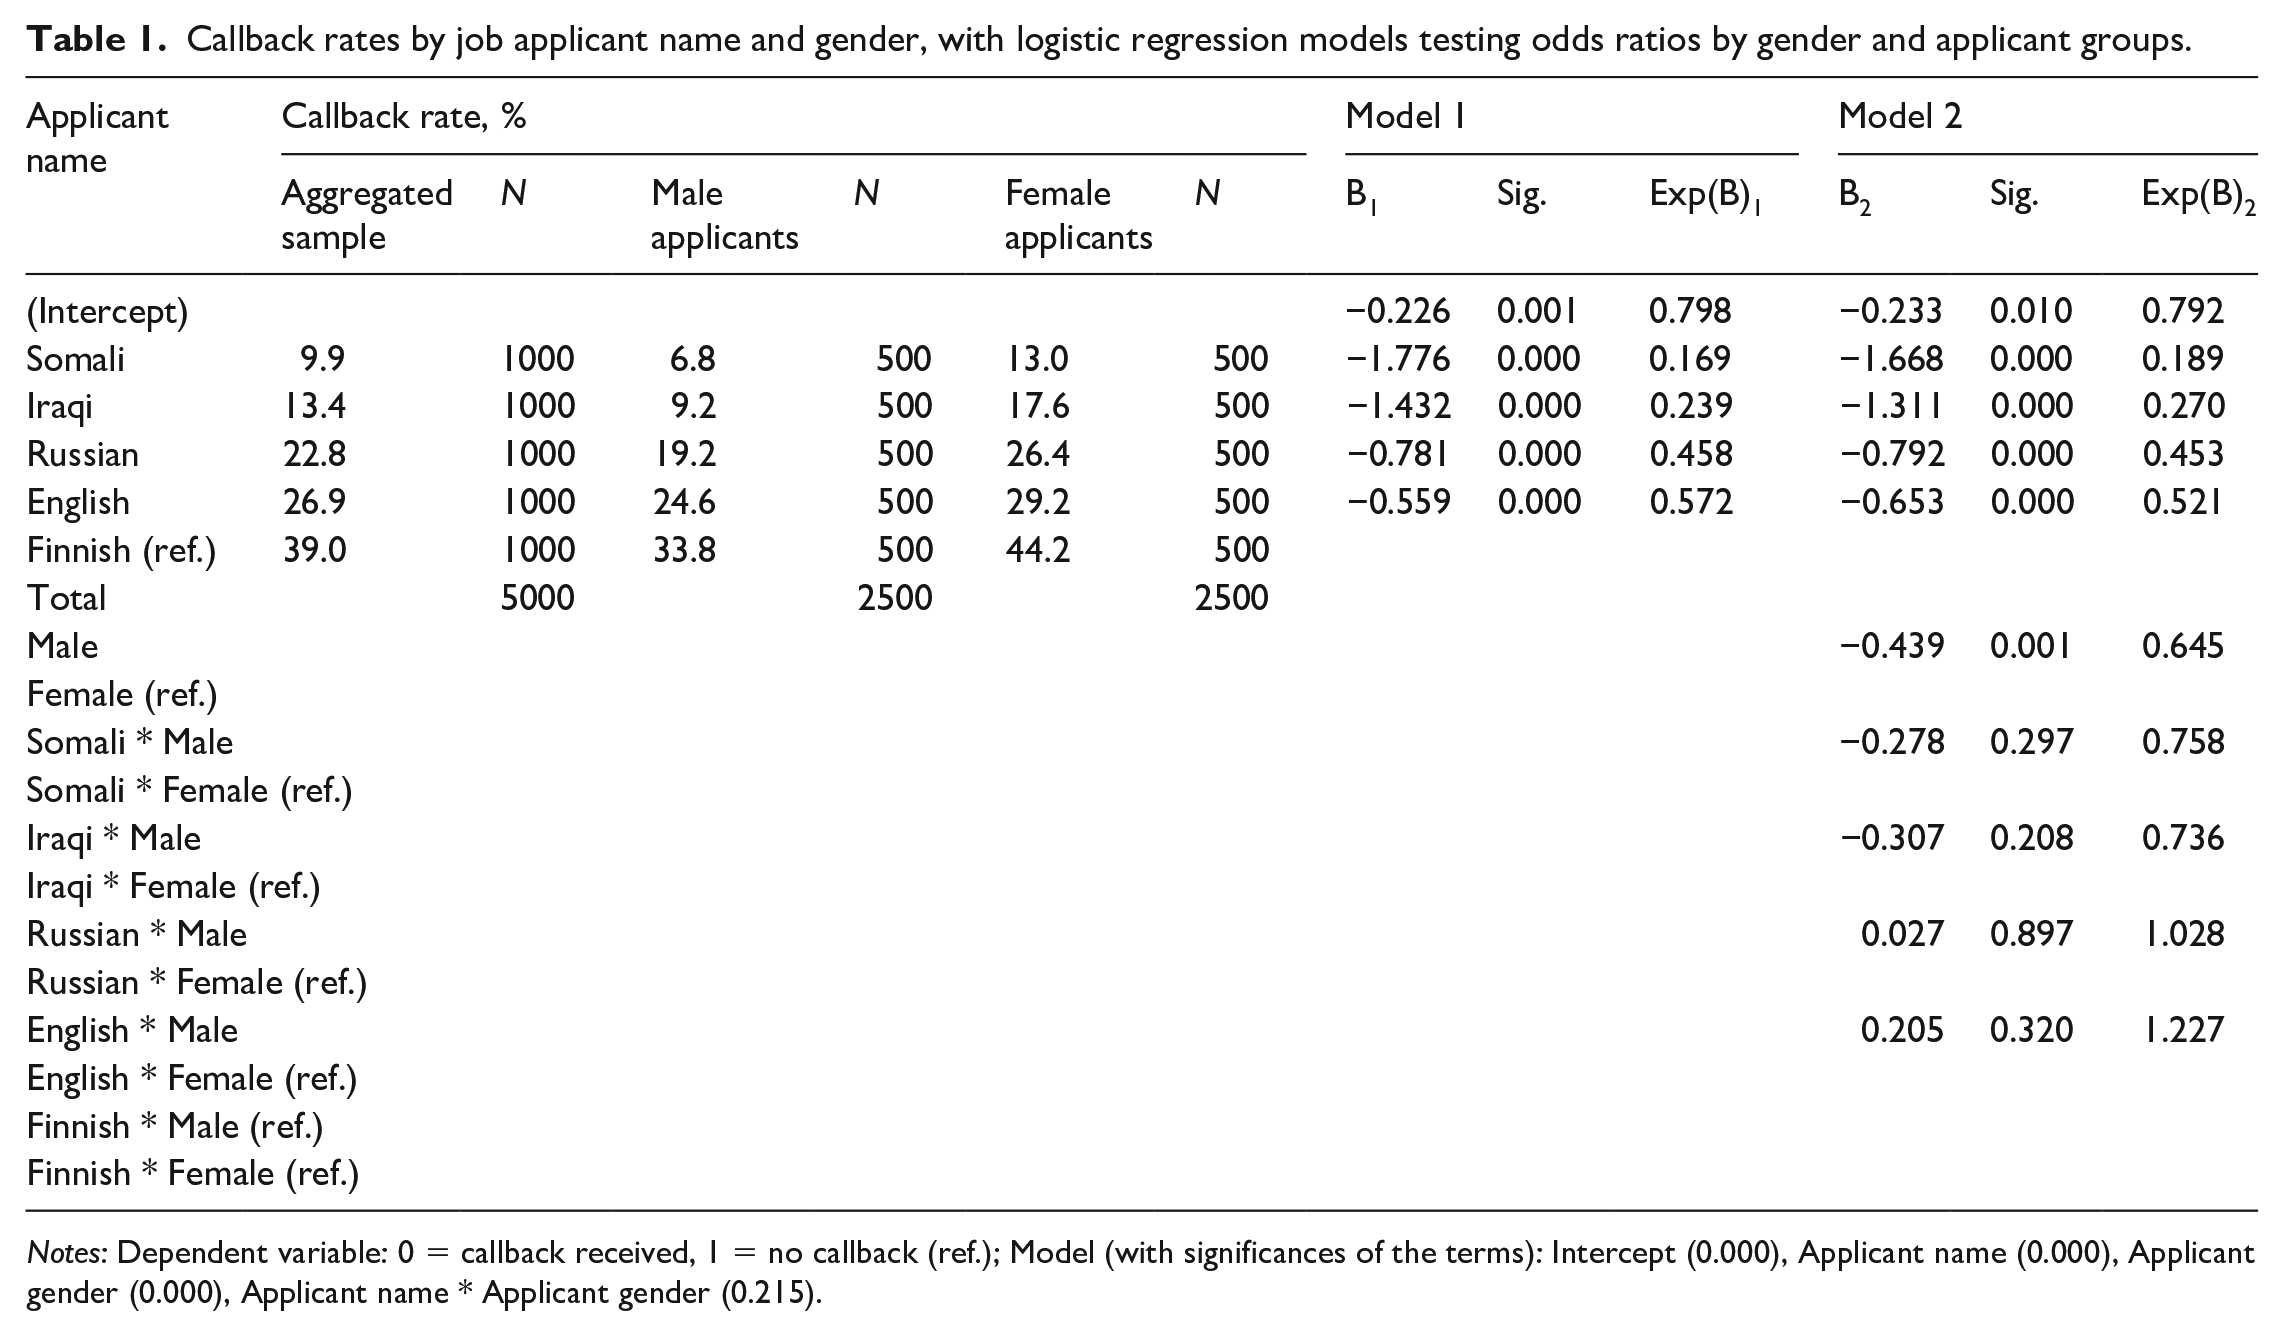
Notes: Dependent variable: 0 = callback received, 1 = no callback (ref.); Model (with significances of the terms): Intercept (0.000), Applicant name (0.000), Applicant gender (0.000), Applicant name * Applicant gender (0.215).
The empirical observations from model 1 amply confirm hypothesis 1a, which stated that consistent with the trends evidenced in other countries, job applicants of immigrant background would face greater levels of reluctance in the Finnish labour market. As we can see, the null hypothesis of model 1 can be rejected. Despite possessing identical human-capital credentials, immigrant candidates encountered substantial discrimination when striving for the same positions as their Finnish counterparts. The applicant name had a strong statistically significant relationship (p = 0.000) with the chances of being invited to a job interview, with a Finnish name receiving a considerably greater number of callbacks (39%) than applicants with an immigrant name. However, the extent of disadvantage was not equally distributed among the different immigrant groups. Applicants with a non-European name obtained significantly fewer job interview offers than those with a European name; while candidates with an English and a Russian name achieved callback rates of 26.9% and 22.8%, the figures for those with an Iraqi and a Somali name stood at only 13.4% and 9.9%, respectively. Putting it differently, while the callback rate for the English and Russian applicants was 31% and 41% less than the Finnish candidate, for the Iraqi and Somali applicants it stood at 66% and 75% less, respectively.
During this experiment, several instances of unfavourable employer attitudes towards the Iraqi and Somali candidates were noted. For example, in some cases, when they were informed that they were not successful this time, the Finnish applicant was told that he/she had excellent work experience and was asked what would be a convenient time for a job interview. In a few other cases in which the particular immigrant applicants were rejected, the Finnish applicant was offered a job even without a formal interview and was asked how early the applicant could start work. Discrimination towards the non-European applicants was observable in other forms as well: these applicants often had to wait for a longer time to receive a callback than their European counterparts. The results, thus, clearly highlight the inequality of opportunity especially for Iraqi and Somali job seekers in the Finnish labour market. These findings are a particular cause for serious concern when considering that all the applicants in this study were raised in Finland and possessed identical locally gained schooling, work experience and vocational diplomas.
The findings of model 1 also appear to corroborate hypothesis 1b, according to which the Iraqi and Somali applicants would be more likely to suffer a greater labour-market penalty, since they are less proximate to the majority population in terms of colour, culture, religion as well as economic level of the country of origin. However, to see whether it is also statistically significant, we turn to test the hypothesis in Table 2 by fitting a logistic regression model in which the non-European immigrants are compared with the European immigrants. As we can see, the parameter for the non-European immigrant group (–0.757) is significant, which clearly shows that it is more difficult for the non-European immigrant applicants to receive a callback than immigrant candidates of European background. The European applicants were invited to an interview in 25% of the cases, as compared to 12% of non-Europeans (not shown in the table). Accordingly, the results give support to hypothesis 1b.
Callbacks by gender and immigrant group. A logistic regression model.
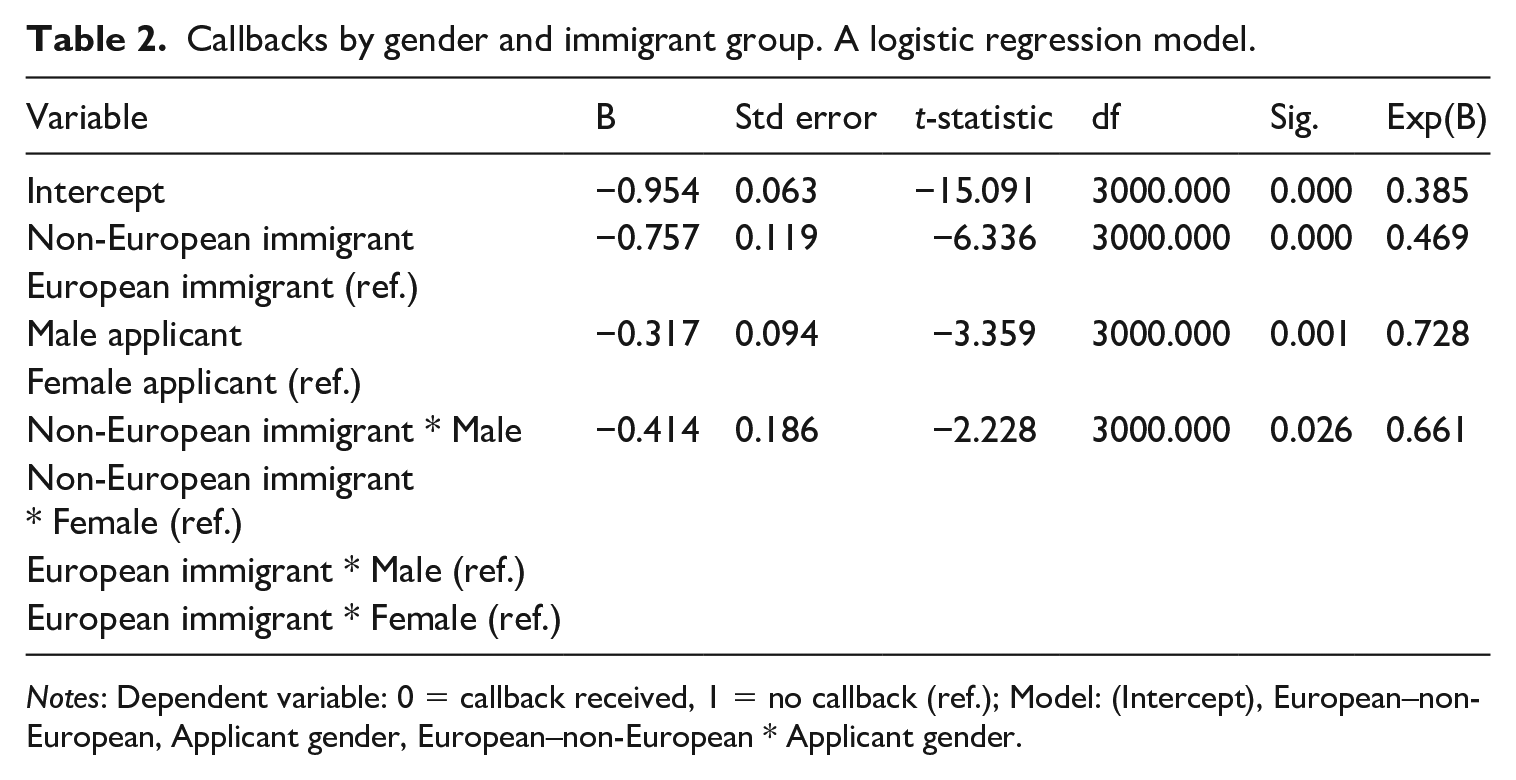
Notes: Dependent variable: 0 = callback received, 1 = no callback (ref.); Model: (Intercept), European–non-European, Applicant gender, European–non-European * Applicant gender.
Does discrimination vary by gender and immigrant group?
Next, we turn to test hypothesis 2, which stated that male immigrant applicants would incur more discriminatory treatment than female candidates because they are perceived as more threatening (SMTH). For this purpose, we turn to model 2 in Table 1. As we can see, the data do not provide any clear confirmation or rejection of either the DBH or the SMTH hypothesis because the interaction term is not significant (p = 0.215). However, we can calculate that 15% of the men and approximately 22% of the women in immigrant groups were invited to an interview (not shown in Table 2). For Finnish applicants, the corresponding figures are 34% and 44%, respectively. The difference between male Finnish and male immigrant applicants is 19 percentage points and between female Finnish and female immigrant applicants it is 22 percentage points. Thus, for female applicants, the difference is about four percentage points greater than for male candidates, which is in the direction of the DBH hypothesis. However, as no interaction term in Table 1 is significant, the results do not sufficiently confirm or reject the DBH or SMTH argument in the context of the present study.
It would also be worth investigating if the difference in callback rates between non-European men and European men is greater than the difference between non-European women and European women when we compare the two immigrant groups separately. Table 2 provides an opportunity to test this by adding the interaction term to the model. Although the term is statistically significant (p = 0.026), the substantial significance of this difference appears to be rather small. For male applicants, the difference between European and non-European applicants is 14 percentage points (22% – 8%) and for female applicants 13 percentage point (28% – 15%). Looking at the observed percentages, the difference is much smaller than when comparing the non-significant percentage differences between the individual immigrant groups. This apparent contradiction disappears, however, if instead of the observed percentages we look at the odds predicted by the models. By calculating the odds ratios using the parameters of the models, we can see that, in Table 2, the odds for European men versus non-European men are five times greater than for European men versus non-European women. In Table 1, the differences in the odds for men versus women varies between 0.74 (Iraqi vs Finnish) and 1.23 (English vs Finnish). The difference between European and non-European immigrants is the only comparison where the difference between the groups is significantly greater for men than women, which is in favour of the SMTH hypothesis. If the Finnish applicants are compared with the combined immigrant group or with the European immigrant group or the non-European immigrant group, the difference is greater for women than for men, which is in the direction of the DBH hypothesis. The differences, however, remain too small to gain any statistical significance.
Is discrimination greater in jobs requiring customer contact and fluent Finnish?
This section intends to test two hypotheses relating to the pure discrimination and statistical discrimination theoretical frameworks. In accordance with the statistical discrimination model, hypothesis 3a regarded that the level of discrimination would be greater in jobs necessitating direct contact with customers, such as front-office positions, as employers may perceive that their clients do not want to engage in transactions with minority workers. In line with the statistical discrimination model, hypothesis 3b stated that employers would be less willing to recruit immigrants in jobs requiring fluent language proficiency, since they may employ such criteria as skin colour or group membership as a proxy for language competency.
In order to test hypotheses 3a and 3b, two models (1 and 2) were fitted in Table 3. Both hypotheses could, in principle, be tested in one model. However, the combining of models 1 and 2 gives us a model that becomes too large for the data, since the cases are not evenly distributed between the categories of different variables. As a result, a separate model was adopted for each hypothesis. In model 1, the term required for testing hypothesis 3a is the interaction term ‘Applicant name by Customer contact’ (low, high, or no). As Table 3 reflects, although the main effects are significant (p=0.000), the interaction term ‘Applicant name by Customer contact’ is not. The odds in jobs with low or high customer contact vary between 74% (Russian, high customer contact) and 132% (Iraqi, low customer contact) compared with the reference categories, and these are not sufficient to be statistically significant. Accordingly, we do not find support for hypothesis 3a.
Does discrimination vary by jobs requiring customer contact and fluent language proficiency? A logistic regression model.
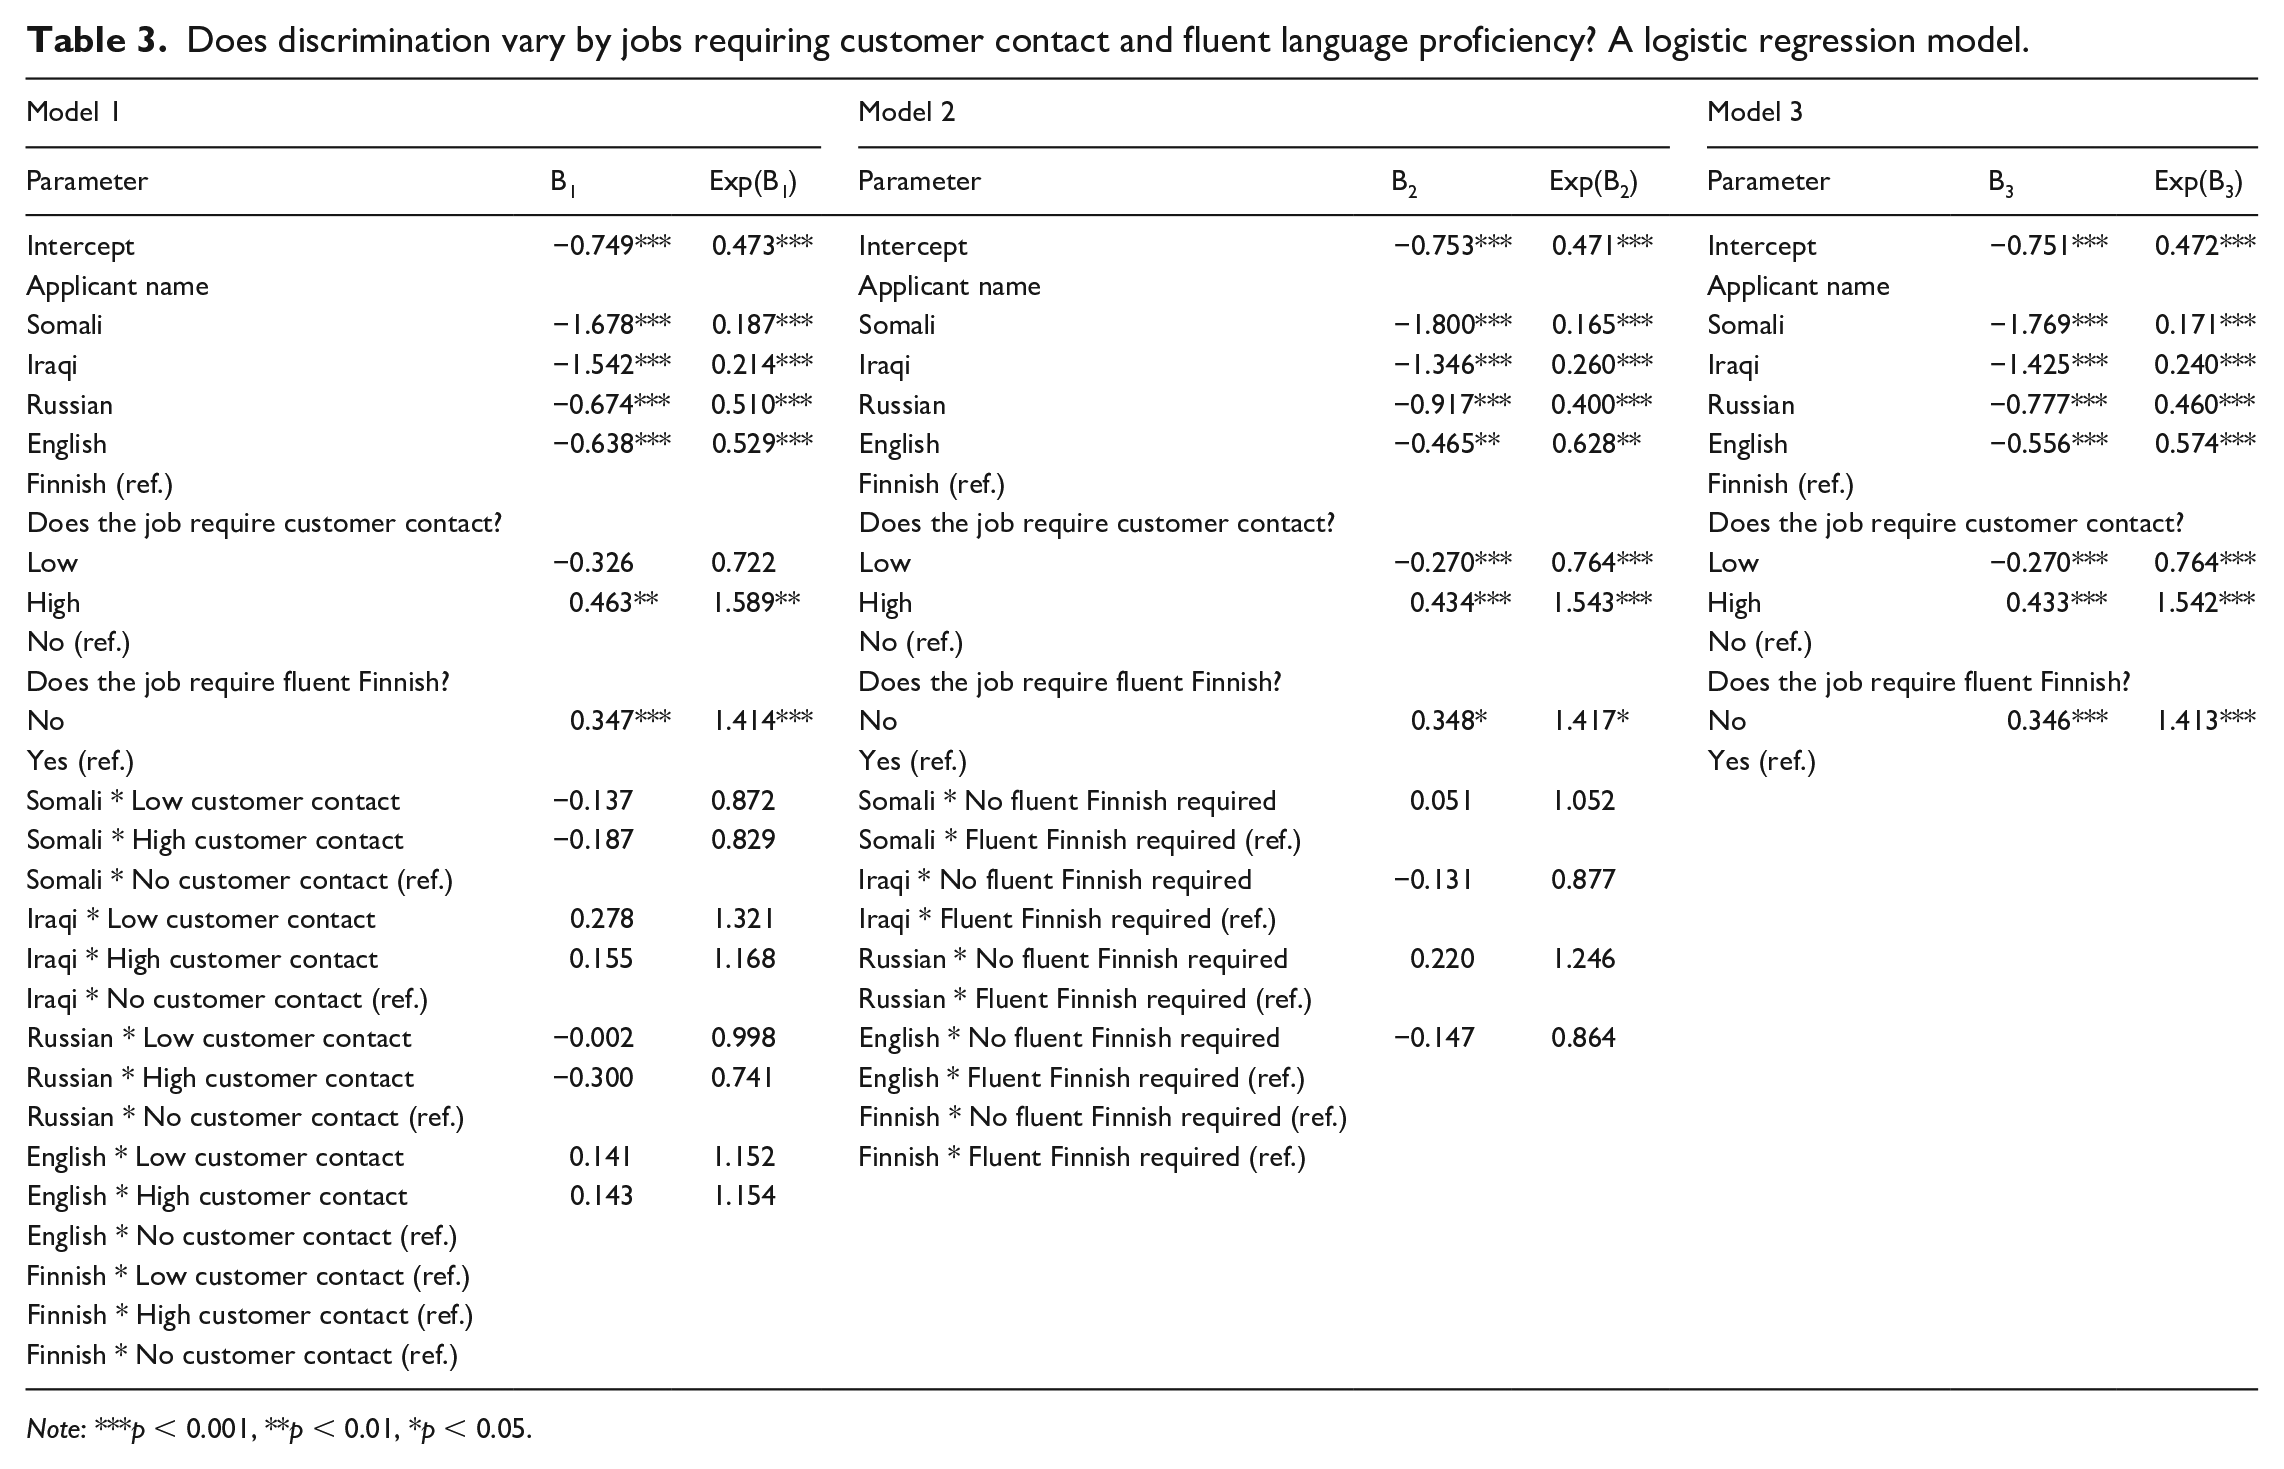
Note: ***p < 0.001, **p < 0.01, *p < 0.05.
As regards hypothesis 3b, the results of model 2 do not appear to be different from model 1. The effect of the Finnish-language fluency required is significant as a main effect. However, it is similar across all the applicant groups, and the interaction ‘Applicant name by Fluent Finnish required’ is not significant. The odds indicated by the interaction parameters of model 2 vary between 86% (English, no fluent Finnish required) and 125% (Russian, no fluent Finnish required) of the odds of the reference groups, but the parameters are not significant. In other words, the observations from model 2 do not seem to confirm hypothesis 3b; not validating one of the assumptions of the statistical discrimination model that employers would be more discriminatory in filling positions requiring fluent language proficiency. Rather, they may lend more support to the pure discrimination model in that discrimination is pervasive across all kinds of jobs, and employers do not want to consider non-Finnish applicants even if they possess all the qualifications required for the successful carrying out of the job tasks.
Since the interaction terms are not needed, model 3 is therefore sufficient to explain the effects of the variables in Table 3. As far as the applicant’s name is concerned, the findings are similar to what was already found in Table 1; that is, the name of the applicant has a strong statistically significant relationship with the chances of receiving a callback (p = 0.000). For jobs requiring low contact with customers, the odds are lower than in no-contact jobs, whereas in high-contact jobs they are higher, but there is no significant difference in the effect of required customer contact between the ethnic groups. The same holds true for required Finnish-language fluency: the odds are higher in jobs where language fluency is not required, but the effect is the same across all ethnic groups. In summary, in all models, applicants with an immigrant name had a significant ethnic penalty: they all had lower odds in receiving a callback than candidates with a Finnish name.
Conclusion
This article has addressed a number of questions with attendant hypotheses. A handful of studies on immigrants’ labour-market integration in Finland have shown that they rely heavily on their relational mechanisms in connecting with the world of work (Ahmad, 2011). One of the main reasons cited for this reliance has been attributed to employers’ negative attitudes towards their recruitment. The findings of the current investigation provide empirical support for this argument: there is extensive discrimination against second-generation applicants of immigrant origin, even if they are as qualified as the native candidate when they strive for the same publicly advertised positions. A strong statistically significant association is observed between an applicant’s name and the probability of receiving a callback from an employer (p = 0.000). However, the extent of discrimination is not equally distributed among immigrants. Rather, there seems to prevail an ethnic hierarchy: employers show greater levels of aversion towards immigrant applicants of non-European than European origin. In particular, applicants with a Somali name seem to be the least desirable candidates for the employers, with the lowest callback rate (9.9% vs 39% for the Finnish candidate). These observations are in accordance with hypotheses 1a and 1b, which suggested that immigrant applicants, in line with the trends observed in other countries, are likely to suffer greater disadvantages in the Finnish labour market, and applicants of non-European origin especially will be facing more discrimination, as they are more distinct from the majority population along multiple dimensions.
However, not all the hypotheses find support from the data. Hypothesis 2, which stated that male immigrant candidates will pay a higher ethnic penalty as they are often perceived as more threatening and job takers, is not confirmed in this study. However, the alternative DBH hypothesis does not find sufficient support either in order to be considered statistically significant, even though the results are in the direction of the DBH argument. The article also tested the assumptions of the pure discrimination as well as statistical discrimination models. As regards the former, hypothesis 3a expected discrimination to be more pervasive in jobs where face-to-face contact with customers is required. The results, however, do not provide support for this hypothesis. Similarly, with regard to the latter, hypothesis 3b is not confirmed either, which expected employers to be more reluctant in considering immigrants in jobs that necessitate greater language proficiency. Instead, overall, the findings may give more support to the pure discrimination framework, since discrimination is spread across all kinds of jobs and employers are far less willing to consider applicants of immigrant origin even if they possess identical personal attributes as the Finnish candidate. In any case, whether or not discrimination originates in sociological, social psychological or economic mechanisms and considerations, the findings provide empirical evidence to support the assertion that immigrants’ underperformance in the labour market is not the outcome of inadequate human capital as such, but it can also stem from employers’ hidden preferences that exclude a certain category of workers from consideration for employment.
It is naturally conceivable that immigrants will confront several barriers in entering the labour market in their new country. These may include lack of host-language proficiency and local work experience, unfamiliarity with the workings of the new job market and lack of effective social networks in the new sociocultural reality. However, in the present case, these barriers should not exist as all the applicants were raised in the new country and their CVs matched that of the Finnish applicant. Thus, it should have been easy for employers to gain a detailed view of their personal credentials including education, work experience, vocational diplomas and language proficiency. In this way, they did not have to fall back on some stereotypes or job seekers’ group membership to judge their true productivity and to make informed choices. However, despite all the information at hand, it seems that it often did not prevent employers from exercising their hidden preferences. The more distinct the immigrant applicants were from the mainstream group in terms of skin colour, culture and religion, the less preferable treatment they received. In this regard, the findings are consistent with previous surveys conducted in Finland, which placed immigrants from Western countries on the top and those from developing and Islamic countries at the bottom of the ethnic preference ladder. The empirical findings also clearly highlight that the anti-discrimination laws do not necessarily prevent employers from discriminating against equally qualified applicants if they do not belong to the preferable ethnic groups.
In this study, the relative callback rates varied from 1.45 for English and 1.71 for Russian applicants to 2.91 for Iraqi and 3.94 for Somali candidates. Comparing the results with similar correspondence studies conducted in other institutional contexts may not be an easy exercise due to a number of reasons – such as the inclusion of different target immigrant groups and economic sectors and occupations. Also, how different immigrant groups are ranked on the ethnic preference ladder in a particular country as well as the economic situation prevailing in that country at the time of the study could bring further difficulties in making the comparisons. Despite these limitations, however, when the results are compared with other Nordic countries, in a correspondence study by Carlsson and Rooth (2007) in Sweden, the relative callback rate for an applicant with a Middle-Eastern name was 1.50. In another Swedish study by Bursell (2007), the relative callback rate for an applicant with an African or Arabic name was 1.80. A study by Midtbøen (2015) in Norway found that an applicant with a Norwegian name was 1.34 times more likely to receive an invitation for a job interview compared with an applicant with a Pakistani name. In Australia, in Booth et al.’s (2012) study, the relative callback rates varied from 1.12 for an Italian applicant to 1.64 for an applicant with a Middle-Eastern name. In an Irish study by McGinnity and Lunn (2011), job applicants with an Irish name were 2.05 times more likely to get invited to an interview than applicants with an African, Asian or German name.
The field experiment method employed in this study is useful in multiple ways. It can offer an effective tool to investigate objectively whether the discriminatory trends observed towards certain immigrant groups have remained stable, increased or declined over the years. This would necessitate conducting such studies periodically to assess changes in these trends over time. As Andriessen et al. (2012) point out, this would also help to see if and to what extent changes in jurisdiction, law enforcement, welfare state arrangements or prevailing political climate affect the level of labour-market discrimination. Moreover, as McGinnity and Lunn (2011) suggest, the main strength of correspondence experiments is that not only can they effectively measure discrimination on the grounds of group membership, but they also shed light on the role of employer discrimination in job allocation and social stratification more generally.
Footnotes
Funding
The author disclosed receipt of the following financial support for the research, authorship, and/or publication of this article: this research was funded by Kone Foundation, grant no. 089958.