
Abstract
The pay gap between white British workers and other ethnic groups is largely in favour of whites, which suggests that discrimination might be a factor. However, discrimination can occur at two points, at entry to the job and within the job. In the former case non-whites might find it difficult to work in well-paid occupations; in the latter they obtain the same sorts of jobs as whites but receive less pay. There is therefore predominantly either job or wage discrimination. We use the British Labour Force Survey 1993–2008 to show that much of the pay gap is explained by occupational segregation while within occupations the ethnic pay gap is far less substantial. Occupational segregation therefore has strong negative effects, but if minorities are over-represented in occupations with a positive wage gap, then there is also a ‘protective’ element to segregation.
Introduction
Research repeatedly demonstrates significant ethnic labour market disparities in Britain. While some groups do better than the white British majority, Pakistanis, Bangladeshis and black Africans suffer higher rates of unemployment, lower occupational status and lower earnings (Berthoud, 2000; Heath and Cheung, 2006; Heath and McMahon, 1997; Platt, 2005). Such ethnic penalties remain even after controlling statistically for individual differences, for instance in respect of education.
These employment outcomes are the result of many factors, including the distribution of job opportunities and relative skill levels, but also discrimination. One of the most persistent of differentials is the ethnic pay gap. This can take two forms, which are not commonly distinguished: minorities either enter less well paid occupations (producing a general pay gap across occupations) or they are paid less for doing the same work (producing a within-occupation pay gap). This distinction forms the basis of the discussion and analysis of this article. The implications for employment are important. If minorities are paid less than others for the same type of work then we have pay discrimination, which has to be tackled differently from discrimination (or any other source of difference) that results in occupational segregation, while the latter might mean not only that minorities fail to enter occupations which pay well but that there is also a limit to ethnic integration.
Occupational segregation explains a substantial part of the ethnic wage gap, though this has rarely been analysed explicitly. The focus has been on either the wage gap in general or, alternatively, individual-level (micro) analysis where it is not always easy to incorporate appropriate information at the aggregate level, such as occupational information. We innovate here through a simple and direct method of analysis. We look at the pay gap within occupations and compare this to the general wage gap. We find that while the general pay gap is often negative, possibly indicating some sort of discrimination, the within-occupation pay gap is far more positive for the ethnic minorities, which suggests that direct pay discrimination is rare. This further implies that where a negative pay gap occurs it is because ethnic minorities tend to cluster into low paying occupations.
The importance of occupational segregation
The evidence for ethnically based occupational and industrial segregation is clear (Longhi et al., 2009: 10). For instance, 41 per cent of Caribbean and 47 per cent of black African immigrants work in the health sector (very generally defined), compared to 20 per cent of British-born whites (Dustmann and Fabbri, 2005: 445). This segregation need not be negative. Some groups are over-represented in professional and relatively well paid occupations while some immigrant groups are over-represented in both high paying and low paying occupations (Elliott and Lindley, 2008). However, entry into low-status or poorly paid jobs is more common; for instance, minorities are strongly over- represented in the distribution sector and in hotels and restaurants (Heath and Cheung, 2006: 46).
What is the significance of this? It is a broader problem than that of inequality alone. As will be discussed below, there is a strong relationship between occupational closure and the ethnic pay gap, but this relationship also implies a failure of integration, both social and economic. While the concept of gradual assimilation has received substantial theoretical support, especially in the USA (Gordon, 1964), it is empirically the case that substantial differences remain between the majority and the ethnic minorities (e.g. Borjas et al., 1992; Van Tubergen, 2006). Different groups seem to have quite different trajectories which change only slowly. ‘Segmented’ assimilation theory claims that group differences persist because differential background and experience shape the processes of assimilation (Alba and Nee, 1997; Van Tubergen, 2006; Zhou, 1997), as do differential experiences of discrimination in the host society. For our purposes, an important aspect of segmentation theory in general is the distribution of ethnic groups across occupations. The differential characteristics and experiences of ethnic minorities set these groups on different career paths (Heath and McMahon, 1997; Van Tubergen, 2006). The distribution of welfare among ethnic minorities is partly dependent on the distribution of minorities across occupations.
This can of course be seen in terms of social class, where classes are groupings of occupations, entry into which influences opportunity across the generations (Erikson and Goldthorpe, 1992). However, occupations might more realistically be seen as sui generis, as suggested by Grusky and Sørenson (1998). Each occupation is itself a complex of labour market conditions, varying by difficulty of entry, which determine the long-term welfare of those both included and excluded.
The outcomes are not always negative. Ethnic occupational segregation reflects a process of allocation of people to positions and this process contains both voluntary and involuntary elements. The latter presumably result in some sort of occupational closure whereby entry into the better paid occupations is constrained. For instance, ethnic minorities might find entry into prestigious and well paid occupations difficult through an inability to convince employers of the equivalence of qualifications obtained in the origin country (Liversage, 2009). However, another factor might be the impact of segregation itself. As certain occupations are effectively closed to some minorities despite their qualifications, they tend to be over-represented in other occupations where their credentials might be of less value, with the result that they are over-qualified for the work they do; they will tend to be better paid than those who are not over-qualified (Battu and Sloane, 2004; Hartog, 2000). There is in this case a cost to segregation but it also possibly has positive ‘feedback’ effects. Voluntary clustering into occupations, meanwhile, has many implications. It might for instance reflect self-selection into second best situations which do not pay especially well but at least tolerably well. Traditional networks leading to chain migration might be a part of this.
The ethnic wage gap
Pay discrimination probably occurs mostly in temporary, casual, generally insecure work in which some minorities are known to be over-represented. Otherwise, keeping labour low paid is difficult, at least where alternative work is available (MacKenzie and Forde, 2009). It is true that inequality is often masked, especially in small firms, by formal equal opportunities policies which in reality are ‘empty shells’ (Hoque and Noon, 2004), but it nevertheless remains legally difficult to discriminate on the basis of pay across jobs clearly seen to be equivalent. Therefore, another possible route for an ethnic pay penalty is a sorting process, arising either from self-selection or discrimination, whereby minorities cluster into less well paid occupations – an example might be employment as a classroom assistant rather than as a fully fledged teacher. Where discrimination occurs, this operates through bias against entry into an occupation or against promotion into higher-level occupations.
The arguments over ethnic pay disparities are similar to those discussed in the much more extensive literature on the causes and effects of gender segregation. A major factor in the relatively large gender pay gap in the USA, for instance, occurs because women are generally in less remunerative work (Blau and Kahn, 1996), partly determined by occupations. However, there are important differences between the ethnic and gender stories. First, if women’s family commitments lead them to accept lower paid work (Hakim, 2000) or, seen differently, are a source of constraint in employment opportunity rather than of choice (Scott et al., 2008), these factors do not apply to ethnicity. Second, ethnic segregation in Britain is rarely extreme at the national level by virtue of the small proportion of ethnic minority workers in the labour force. Third, immigration policy can result in high concentrations of minorities in well paid professions while there is no such allocative process in the case of women. Nevertheless, the distinction between pay and occupational discrimination applies to both ethnicity and gender. So far there has been a far less definitive response to the former than to the latter. A key issue is whether segregation is positive or negative. In the case of gender, it is mostly negative because women do not simply work in different jobs from men but in either lower ranking occupations or lower ranking jobs within occupations (Hakim, 1996). However, it has also been argued that gender segregation is partially protective (Blackburn et al., 2000). Does this apply to ethnicity?
Some analysts have argued that the occupations which ethnic minorities enter make relatively little difference. Clark and Drinkwater (2007) regress the wage gap for different ethnic groups both with and without occupational controls and find that ‘the earning differentials are less about the sorting of individuals from specific groups into high- or low-paying occupations but rather about differences within occupations’ (2007: 42). However, although in their analysis occupational controls reduce the wage gap, in some cases the gap remains considerable; for instance, it falls when including these controls from around 26 per cent in the case of black Africans to 16 per cent (2007: 43). Further, Clark and Drinkwater define occupations very broadly, as social classes, yet classes are highly diverse (Grusky and Sørenson, 1998; Güveli et al., 2007). In support of the segregation argument, Elliott and Lindley (2008) find considerable occupational polarization among immigrants, who are over-represented in both high paying and low paying occupations. Longhi et al. (2009) similarly reveal an effect for occupational segregation, and so do Elliott and Lindley (2008: 665–6). We not only analyse at a much greater level of occupational detail than do the above studies but specifically calculate the wage gap within occupations as a part of the overall wage gap.
Our argument, therefore, is that the pay gap has two components, within and across occupations. If there is a gap within occupations in favour of white British workers, this might be the result of straightforward wage discrimination. If there is a gap across occupations then insofar as minorities cluster into lower paid occupations, segregation is the cause of their relatively low pay. This does not produce a simple picture overall. For instance, it is possible that average pay might be high in some occupations where minorities typically work, while the within-occupation pay gap in these might be negative. In this case segregation into these occupations is of limited benefit to the minority in question. Or minorities might work in low paid occupations and yet within these have a pay advantage, but one which, being at a low level, is of limited advantage.
Methods and data
We undertake two types of analysis. First we measure the wage gap. This is usually calculated by subtracting the mean pay of various minorities from that of the white majority. We do this but also calculate mean wages within occupations for all ethnic groups, and then subtract the averages for minorities from the white average. As explained above, we would expect this to produce a different result from the standard procedure. We use the British Standard Occupational Classification SOC90/SOC2000, using two-digit occupations, which remain two-digit even though the coding scheme changed in 2000. This produces nearly 80 categories. Taken across the 16 years of our dataset this results in some small cell sizes. In some of the analysis the years are therefore pooled.
Second, moving away from the distinction between general and occupational wage gaps, we seek to assess the overall impact of occupational clustering on the wage gap through a more causal analysis. This can be done in three ways:
wage regressions within occupations where explanatory variables include the different ethnic groups, so that differentials within occupations can be measured;
analysis of the wage gap without and then with occupation to see if occupations make a difference to the results; or
decomposition analysis with occupation (Elliott and Lindley, 2008). This distinguishes between structural and personal effects but is an indirect method which is often difficult to interpret and therefore has a number of critics (e.g. Olsen and Walby, 2004).
We follow the first two strategies.
Finally, the extent to which minorities cluster into occupations changes, as does the wage gap. In Britain the probability of being in a professional or managerial job has fallen for black Africans and Pakistanis relative to whites but improved for black Caribbeans, Indians and Bangladeshis (Clark and Drinkwater, 2007: 37). Our analysis makes some attempt to look at change over time in ethnic segregation and in its effects.
We use data from the quarterly Labour Force Survey (LFS) for the UK, covering 16 years from winter 1993 to 2008. Each household is interviewed five times but in the earlier years only one annual wave carries wage data. From 1997 wage data appear in the first and fifth waves. Therefore some individuals appear more than once. We use robust standard errors to correct for this.
The analysis is restricted to employees of working age for whom data on hourly wages, education and occupation have been successfully collected. Workers undertaking less than 10 hours a week and those with extreme hourly earnings (under £1 or above £80 per hour) are excluded. Unlike a number of studies we include women. It is certainly the case that in some cultures women’s labour market participation is restricted (Dale et al., 2008). However, it has been argued that education, language ability and local opportunities are more important restrictions than culture (Holdsworth and Dale, 1997). We could of course control for the effects of differential entry into employment in our regression analysis using the Heckman selection procedure, but differential employment also applies to men from some minorities, and for different reasons, so we choose not to. Our analysis is therefore of actual wage differences in employment rather than differences that would occur if more people from ethnic minorities were employed.
Finally, our study is of ethnicity while much other research on the pay gap is of immigrants. Both are important but we are interested in the longevity of any negative wage effects. National immigration controls act as a filter, giving preference to those with greater skills (Kogan, 2007). White immigrants in particular often earn more than white natives (Elliott and Lindley, 2008: 655). It is also generally found that while most immigrants are initially penalized relative to both native white workers and British-born minorities they establish themselves increasingly over time (Elliott and Lindley, 2008: 656). Insofar as a wage gap remains then this is due to ethnicity. Discrimination is perhaps ultimately against people who look and sound different or who appear to behave differently from the ‘host community’ (Bertrand and Mullainathan, 2004; Carlsson and Rooth, 2007; Fryer and Levitt, 2004). We therefore count white immigrants and white British as a single white group, though the former are clearly a very small proportion of this. It is of course possible to distinguish second or later generations from first- generation ethnic minority members. Religion is also an important factor (Johnston et al., 2010; Longhi et al., 2009). Such distinctions, though, severely curtail sample size.
The ethnic groups we analyse are white, black Caribbean, black African, black ‘other’, Indian, Pakistani, Bangladeshi, Chinese, Asian ‘other’ and ‘other’. These categories obscure a great deal of important further variation. We have no reason to think, though, that a more detailed classification would give different results; probably they would just be more detailed.
Results
Descriptive analysis
First of all we give some idea of the extent of occupational clustering and of change in this over time. Although our wage gap analysis is based on specific occupations, for convenience we here use occupational class, namely the British class schema, the NSSEC (Rose et al., 2005), which is itself based on the Erikson and Goldthorpe classification. We only show results for the managerial/professional classes (higher and lower combined) and the semi-routine and routine classes (combined). In Table 1 we compare the beginning and end of our time frame, but grouping years in each period to obtain sufficient numbers.
The class distribution of ethnic groups over time (managerial/professional and semi-routine/routine classes only)
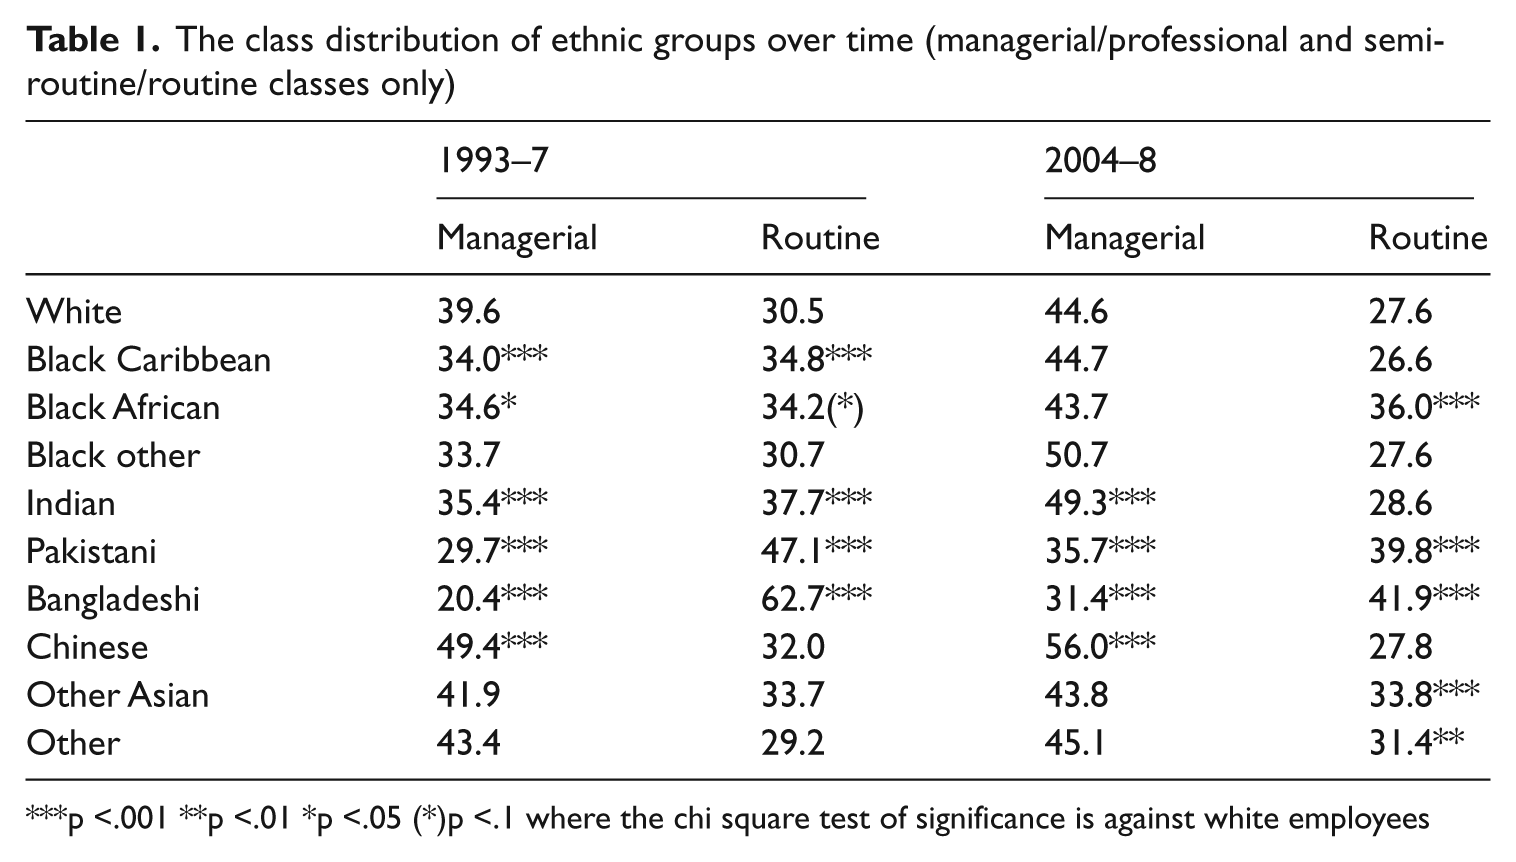
p <.001 **p <.01 *p <.05 (*)p <.1 where the chi square test of significance is against white employees
Looking at the earlier period, most minorities have either lower representation than the white majority in the managerial/professional classes or higher in the routine class. This latter situation especially includes Pakistanis and Bangladeshis. In the case of the Chinese some polarization is discernible. In the later period, which shows a general shift in the class structure, the relative position of the white against several other groups mostly changes little, while there is real improvement for ‘black other’ and those from the Indian subcontinent. Some convergence is therefore visible at this broad level of detail.
One source of convergence might be increasingly equal education. While we do not show these results in a table, in the earlier period five minority groups in fact have a higher proportion of graduates in employment than the white group. At the same time some have high proportions of people with low qualifications, indicating considerable internal polarization. In the later period no single ethnic group has a significantly lower proportion of graduates than the white group but five have a higher percentage with minimal qualifications. While there is a professional core in many groups, there is also considerable inequality within them. It should be borne in mind, though, that this applies only to people in employment. There are substantial ethnic differences in terms of employment itself, to which differential educational achievement is an important contributor.
In Table 2 we turn to our distinction between the general and within-occupation pay gaps (where all years are pooled). The minus sign indicates a loss relative to whites. In the case of the general indicator, which measures the overall pay gap, it can be seen that most groups, especially Bangladeshis and Pakistanis, lose out relatively, but not all. There is a notable gain for the Chinese and a small black Caribbean gain.
General and occupational pay gaps relative to white British employees for nine ethnic groups
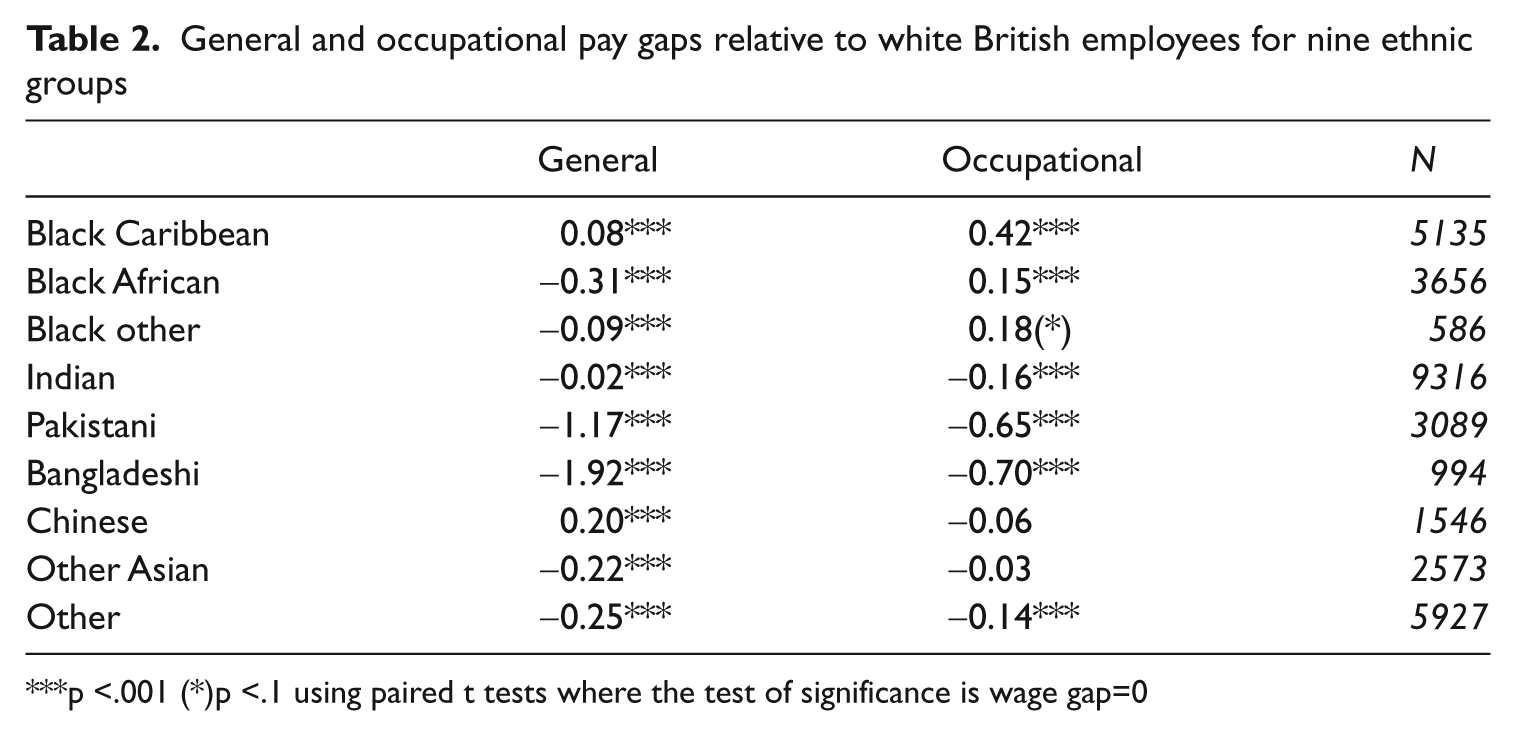
p <.001 (*)p <.1 using paired t tests where the test of significance is wage gap=0
The within-occupational measure is quite different. For most groups there is some improvement: they do less badly within than across occupations.
How do these results change over time? We do not show these changes, but if we take the wage gap between whites and all ethnic minorities combined, and in real terms, in 1993 the general measure was £0.18 in favour of whites but very slightly in favour of the minorities within occupations (£0.03). By 2008 the general deficit had increased to £0.43 while the occupational gap had changed from close to zero to £0.18 in favour of whites. The wage gap has worsened on both measures.
It is also of importance that these results vary by both education and gender. It might be expected that education, which as just shown is improving for minorities in both absolute and relative terms, might reduce the wage gap, but this is not always so. Again we do not show the results, but taking the general measure first, education makes little difference for either men or women. In absolute terms this measure of the pay gap is very similar at any level of education (though any wage gap represents a larger proportion of the wages of those with less education). It is also the case that the gap varies very little between men and women. Women are on average paid less than men but minority women suffer the same wage disadvantage as minority men. There is no multiple deprivation.
The occupationally based measure gives a very different picture. For simplicity we consider only blacks and Asians. The gap is positive at all levels of education for the former, but especially so at low levels of education. Poorly qualified black men and women might do relatively well in their chosen occupation, but here the gain is clearly slight. In all cases, as has been shown in other research, black women do better than black men. In the case of Asians the ethnic wage gap is always negative and even worse at low levels of education, though it is generally smaller for women than for men. Here education serves to reduce the wage gap. Overall, education has complex effects.
Regression analysis
The above descriptive analysis shows not only that the ethnic pay gap varies considerably by ethnic minority but that it is in large measure the result of occupational segregation. Within occupations the pay gap is either very small or even in favour of the minorities, but we still need to know if ethnic segregation has an effect which we can measure. This is attempted through OLS regression of the log of hourly wages with occupational segregation as a key explanatory variable. This is defined as the proportion in occupations at the two-digit level of all ethnic minorities combined. A further occupational-level indicator is included, which is the proportion of women in these occupations. Variables representing the different ethnic groups also appear, of course, as we need to see how they fare when controlling for other factors. Finally, the analysis includes controls for age, age squared, gender, family (whether or not married and having children), education, industry, whether the job is permanent and whether part-time, tenure, region and year of the survey. We also include social class, as indicated in the methods section.
Ethnic segregation generally has a negative effect on wages (Elliott and Lindley, 2008), but has this changed over time? The result we observe in Table 3 (where the effects of the controls are not shown) is one of some decline in this negative effect. Working in an occupation with a relatively high level of ethnic minorities is nevertheless associated with a wage penalty. It should be noted that this effect occurs regardless of the worker’s own ethnicity, and in fact further analysis (not shown) indicates that white people are most affected; the effect is even slightly positive for the minorities themselves.
Dependent variable = log hourly wages (OLS)
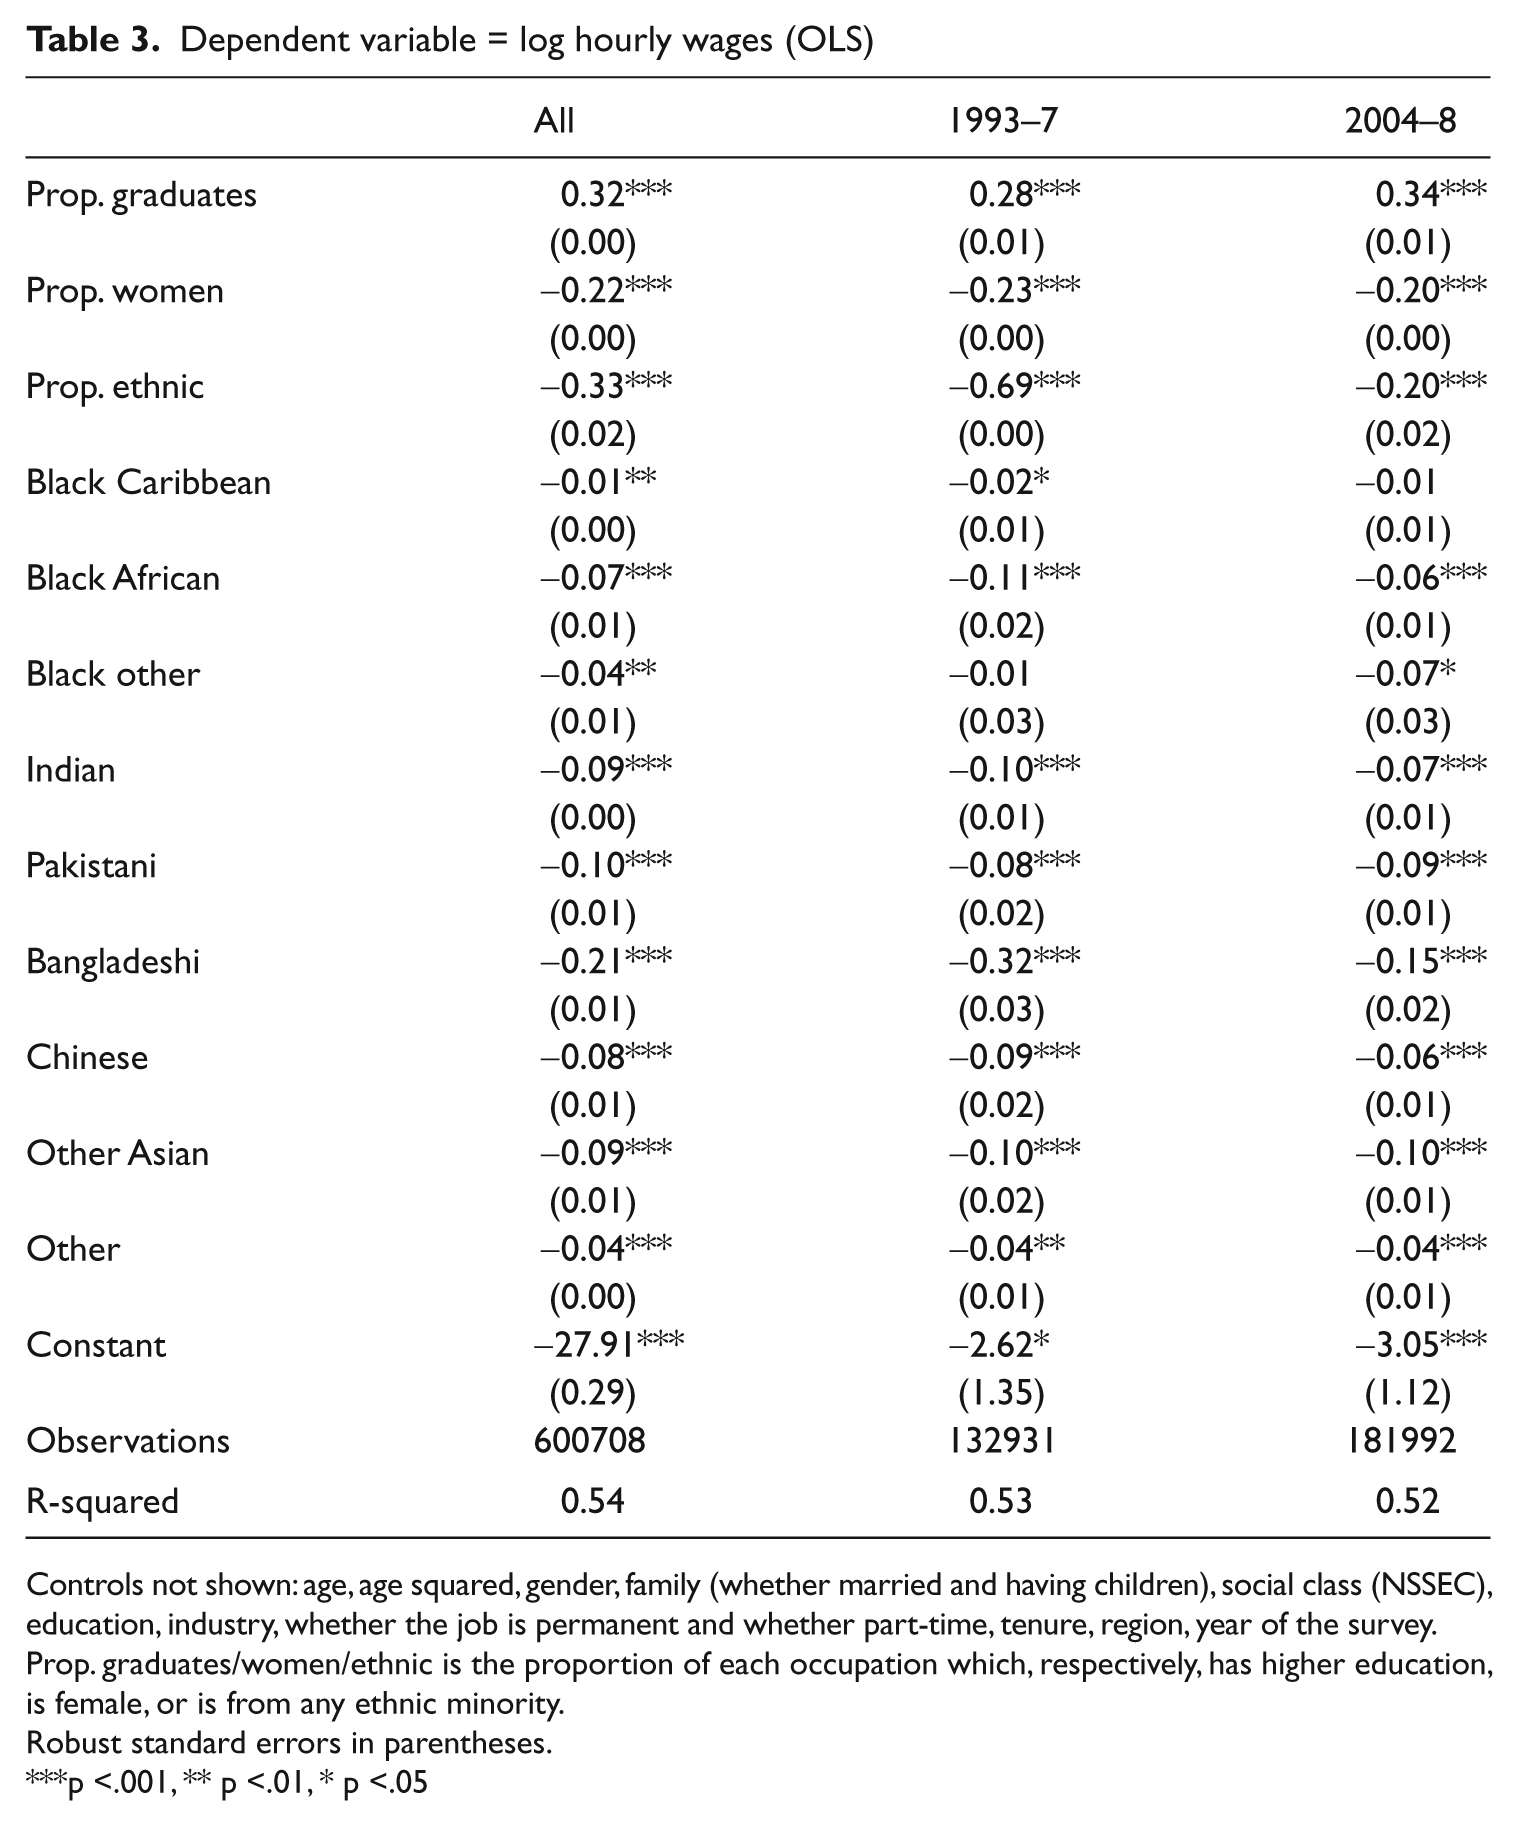
Controls not shown: age, age squared, gender, family (whether married and having children), social class (NSSEC), education, industry, whether the job is permanent and whether part-time, tenure, region, year of the survey.
Prop. graduates/women/ethnic is the proportion of each occupation which, respectively, has higher education, is female, or is from any ethnic minority.
Robust standard errors in parentheses.
p <.001, ** p <.01, * p <.05
As for the results for the different ethnic groups, no minority does better than the white majority. This remains much the same for most groups over the period, though things improve for black Africans, Indians and Bangladeshis. These effects for the ethnic groups are not quite as would be expected from Table 2, where, for instance, the Chinese earn slightly more than white people. They do less well than expected, therefore, given their attributes.
There are also important regional clusters of ethnicity. For instance, 65 per cent of black Caribbeans and 77 per cent of black Africans work in the southeast of England, compared to 32 per cent of whites. We do not show this result, but when the regional variable is left out of the analysis, the position of black Caribbeans and Africans improves considerably. Regional segregation therefore seems to be a problem too.
Having shown the general importance of occupational segregation as well as the different experiences of the various minorities, we now include these variables in further analysis but with more occupational specificity. We test whether the results are the same within two extremes of the occupational distribution, here defined for convenience on the basis of class: higher managerial and professional jobs on the one hand, semi-routine and routine jobs on the other. The results are shown in Table 4.
Dependent variable = log hourly wages (OLS, upper and lower classes)
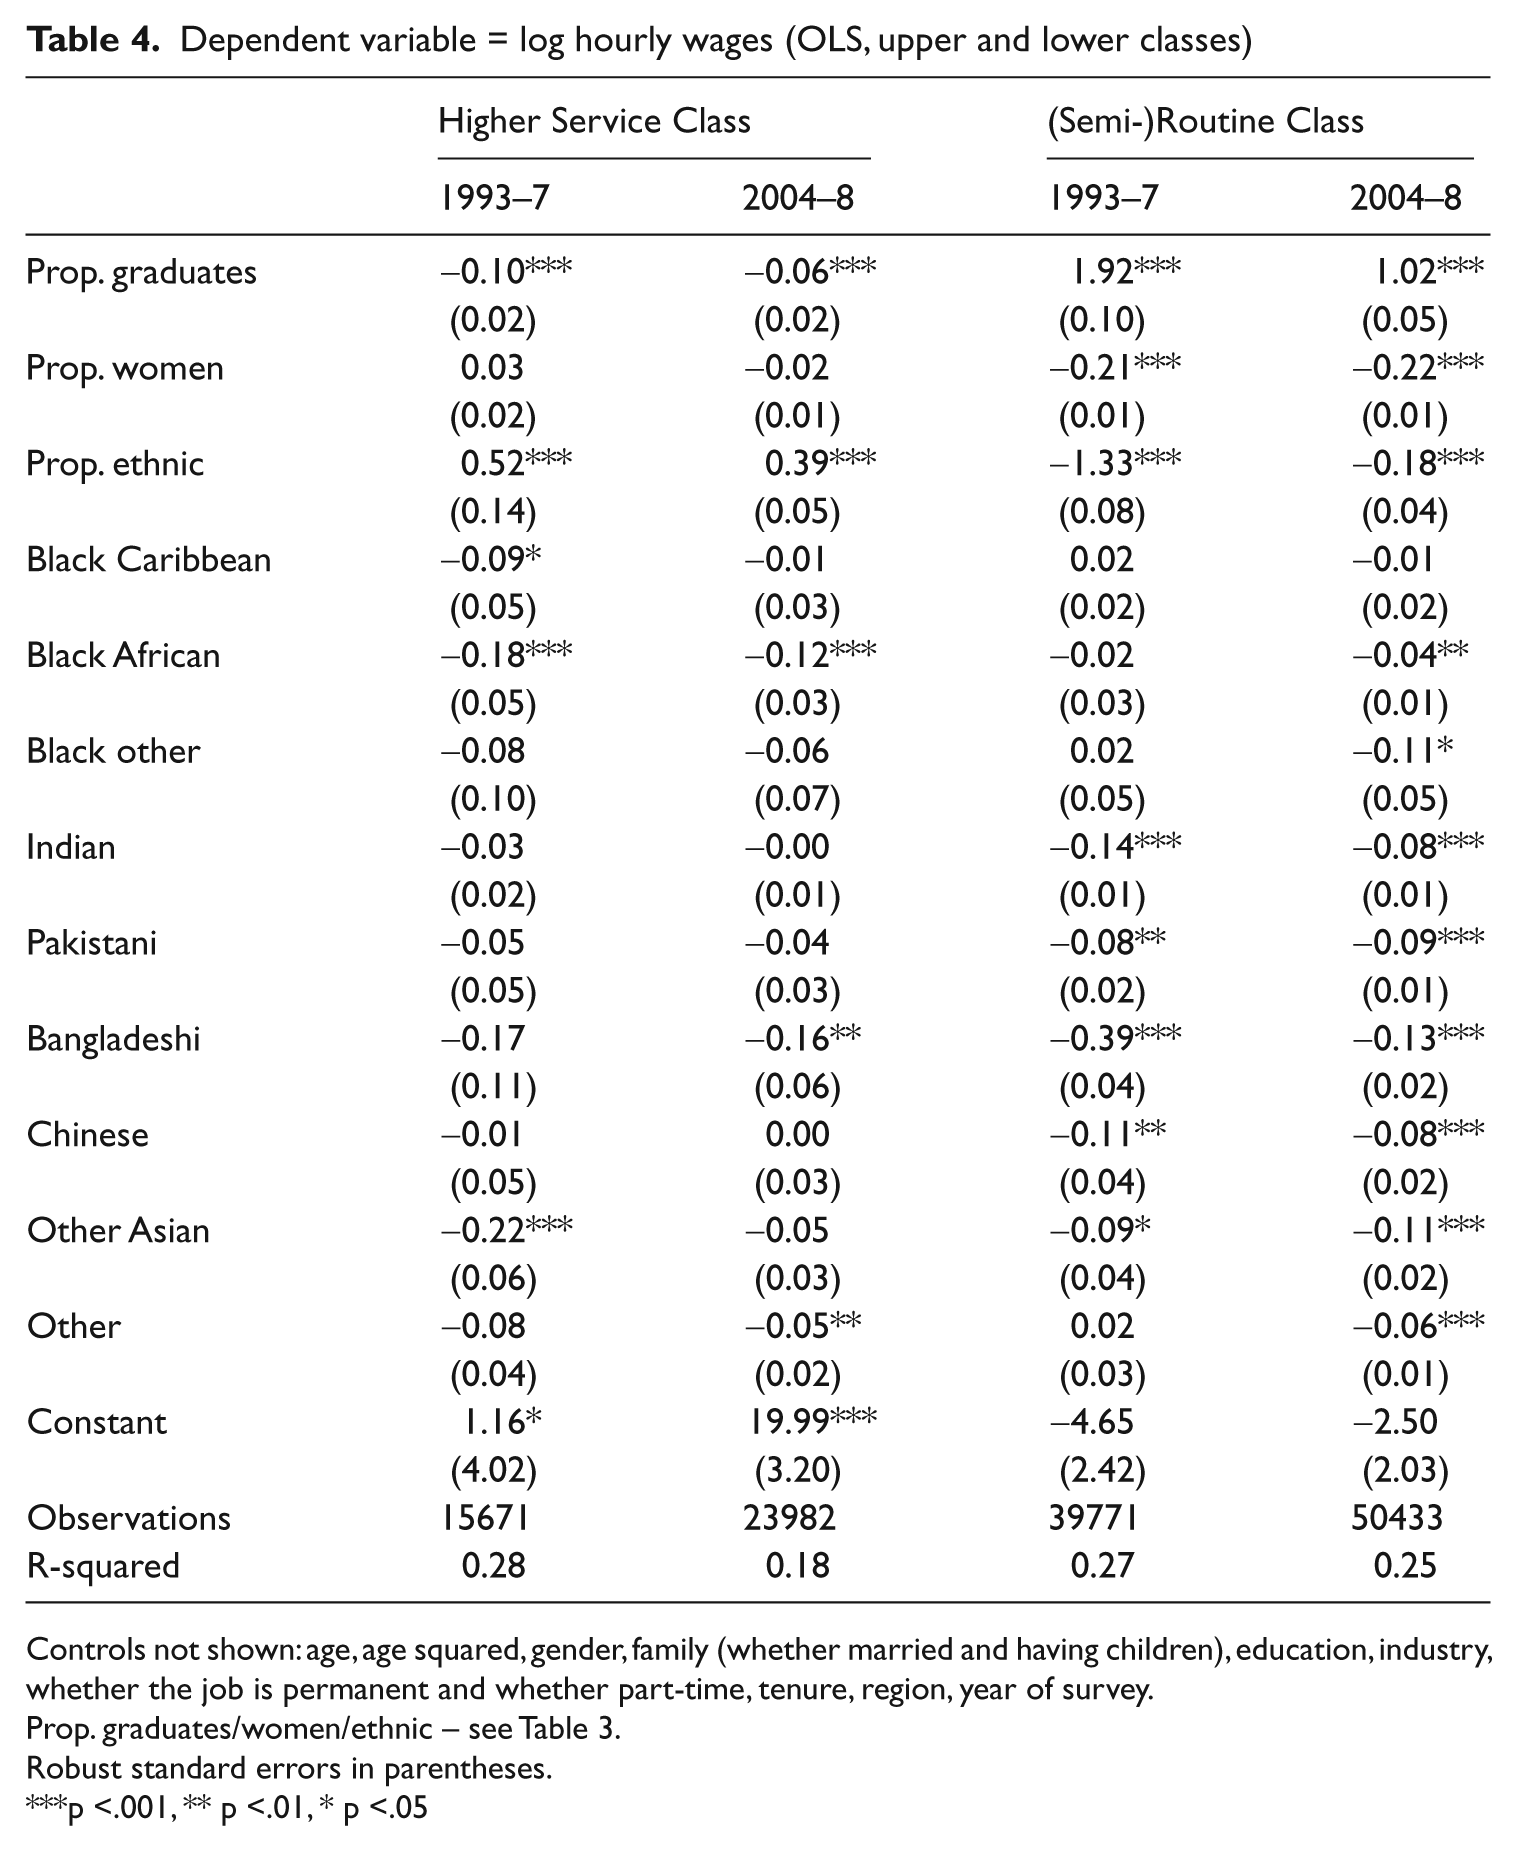
Controls not shown: age, age squared, gender, family (whether married and having children), education, industry, whether the job is permanent and whether part-time, tenure, region, year of survey.
Prop. graduates/women/ethnic – see Table 3.
Robust standard errors in parentheses.
p <.001, ** p <.01, * p <.05
Although we see negative coefficients for all the ethnic minorities in both periods in the managerial and professional class, most of these coefficients are not statistically significant. Further, there is generally some improvement over time in this class. In the routine class, in contrast, most groups do relatively badly. For some the situation gets even worse while for others, especially Bangladeshis, there is an improvement. Minorities in poorly paying work have therefore suffered especially badly.
‘Proportion ethnic’ is different in its effect across the two classes, positive in the higher and negative in the lower. This means that occupational segregation has an effect which varies by the type of job in question. It is negative in manual or routine work but can actually be positive otherwise. The latter suggests that although minorities generally earn less within occupations than white people, they are often attracted into high paying jobs. High ethnic representation is here a ‘marker’ of a good job, which benefits all people in the job, whether white or from an ethnic minority. There is again a clear polarization of results for the ethnic minorities as a whole. Nevertheless, both the positive and negative effects decline over time, suggesting some convergence in this respect.
Conclusions
In Britain white people earn more than people from ethnic minorities on average. However, this gap is generally less when the pay of white people is compared to that of ethnic minorities within occupations. The reverse of this idea is also seen. The Chinese and Indian groups do as well as white people because they tend to work in highly paid occupations but within these they actually do worse, presumably because they fail to reach the most highly paid positions. The wage gap therefore derives in significant measure from occupational segregation: ethnic minorities are sorted more into both low paid and high paid occupations, but especially the former. This sorting is due in part to personal factors such as education or selection (job openings depending on where relatives are working for instance), but some is almost undoubtedly because minorities find it harder to enter better paid occupations.
This process is not inevitable and is probably subject to erosion over time. Even over the fairly short period examined (1993–2008) it would appear that there is some convergence in the distribution of ethnic minorities across occupations as defined by some measure of occupational class. But at the same time the wage gap has in general not declined. This could suggest that occupational clustering is becoming a less important factor in the explanation of the wage gap. However, this segregation is especially important when taking into account gender and also the distribution by education, though the effects are complex and therefore likely future developments are not easy to predict. It is at least probable that segregation will differentially affect men and women, individual ethnic groups and people with different levels of education.
When we try to understand the determinants of wages controlling for a range of factors, it is clear that on this basis most ethnic minorities earn consistently less than white people, if not always by much. One implication, as the descriptive results give a different picture, is that some minorities do not earn as much as their education would warrant.
Especially important for the thesis of this article in particular is that the effect of ethnic segregation, while it has fluctuated, is substantially negative: the more the proportion of people in an occupation who are from ethnic minorities the lower the average wage (for all workers in those occupations, whether or not from ethnic minorities). However, there is also a clear class distinction here. In professional and managerial jobs, the wage differential against white people has been broadly static for most groups, with some improvement for a few others. In routine and semi-routine work we see in contrast a marked deterioration. It would therefore seem that while ethnic segregation is at least to some degree ‘protective’, because some minorities cluster into occupations where the wage gap is either not negative or even positive, this protection is being eroded in less well paying occupations. There is therefore considerable and possibly also increasing polarization of welfare within the ethnic minorities. This is characterized by a professional class growing parallel to a large substratum of poorly paid workers whose relative position is particularly of concern and possibly deteriorating.
Our main contribution has been to show that ethnic segregation has an effect on wages while pay discrimination over and above this appears to be relatively weak. At least within occupations minorities tend to be paid as well as the white majority (though this picture would vary with the precision used to define occupations). This research therefore links into similar research on the gender pay gap. Although the role of segregation is disputed (e.g. Hakim, 1996), there is some evidence that women tend to select into or be selected into low paid jobs but at the same time often receive unequal pay for the same work (Joshi and Paci, 1998: 95). This seems to be contrary to the above findings on ethnicity. Also important, though, is that there is considerable polarization between and within ethnic minorities, with segregation affecting poorer ethnic minority people particularly severely.
Footnotes
Acknowledgements
This work was supported by the Economic and Social Research Council (ESRC) through the Research Centre on Micro-Social Change (MiSoC) (award no. RES-518-28-001).