
Abstract
Public sector organizations frequently face increased demand for their services during economic downturns at the same time that their revenues decline. This problem is particularly acute for nonprofit organizations, who cannot rely on involuntary taxation in the same manner that governments can. In this paper, we document the business cycle risk that nonprofit organizations are exposed to, paying particular attention to the extent that various types of nonprofit revenue covary with economic conditions. We find that aggregate donation revenue is procyclical while program revenue is counter-cyclical. Furthermore, nonprofits that expand their share of revenues from donations will cause their revenue portfolio to become more procyclical, while those that expand their share of revenues from program revenue will experience the opposite. The results highlight a previously unexamined source of risk for nonprofits and emphasize the need for reserve policies that are attentive to organizations’ exposure to economic conditions.
By their very nature, public sector organizations face pressure to maintain and sometimes even bolster service provision during periods of economic decline. As a result, business cycle risk is one of the most fundamental challenges that they face. Governments, in particular, as the architects of the social safety net, have long struggled with how to appropriately manage their revenues and set aside sufficient reserves to meet the fluctuating needs of their public. However, governments also rely on nonprofits to deliver a large share of their social assistance. Despite the fact that nonprofits contributed an estimated $1 trillion to the U.S. economy in 2016 (5.6% of GDP), relatively little is known about the relationship between the nonprofit sector and the business cycle. While there exists significant research about how nonprofits can assemble revenue portfolios that are resilient to disasters such as revenue shocks (Tuckman & Chang, 1991), insolvency or net asset reductions (Keating et al., 2005; Searing, 2018; Trussel, 2002; Trussel & Greenlee, 2004), and other financial misfortune (Cordery et al., 2013; Tevel et al., 2015), this literature has little to say about nonprofit resilience with regard to the business cycle, and more broadly, macroeconomic conditions.
One of the most important factors that determines the ability of nonprofits to manage the business cycle is the type of revenues in their portfolio. Unlike governments, which can raise fees and charges for public goods and can at least in principle raise taxes to increase revenue, nonprofits cannot rely on involuntary taxation and frequently have little power to set prices in the market for their services. And while fiscally prudent nonprofits will establish reserves for market downturns, nonprofits can’t run a structural deficit in perpetuity, unlike the federal government, which funds the lion’s share of the social safety net in the United States. Instead, nonprofits are often reliant on donors or government agencies that may experience their own financial pressures at the same time that nonprofits are seeking funding to expand their service provision. Thus, this paper seeks to shed light on the relationship between nonprofits and the business cycle by striving to answer two research questions related to their revenue portfolios: What is the relationship between different nonprofit revenue types and the business cycle, and how can these revenue types be used to mitigate the exposure of nonprofit organizations to business cycle risk?
The paper proceeds as follows. The second section examines existing literature on the relationship between the nonprofit sector and the business cycle, followed by existing empirical studies on managing risk and volatility. We formulate hypotheses, then discuss the data and empirical approach. Next, we establish various empirical relationships between the nonprofit sector and the U.S. business cycle. Building on these descriptive results, we use regression analysis at the organization-year level to examine the relationship between nonprofit revenue profiles and their exposure to the business cycle. Finally, we draw on these findings to discuss the managerial implications before summarizing our results and concluding.
Literature Review
Nonprofits and the Business Cycle
Public sector organizations face various sources of financial risk, including sector/industry-specific risk—e.g., the risk that the specific cause they are raising funds for loses salience in the eyes of the public—as well as location-specific risk tied to their region or local economy. However, one major risk that all public sector organizations have in common is the risk they face due to swings in the macroeconomy—aka business cycle risk, typically measured by fluctuations in national gross domestic product (GDP). Procyclical means that an indicator is positively correlated with the state of the economy (such as income taxes, which increase during periods of economic growth), while countercyclical means that an indicator is negatively correlated (such as unemployment benefits, which rise during economic downturns).
According to public finance theory, the proper response of governments to fluctuations in macroeconomic conditions is to engage in countercyclical fiscal policy, bolstering demand during periods of economic decline so as to maintain stable prices and levels of employment. This usually incorporates elements of discretionary fiscal policy, such as stimulus spending and tax cuts, as well as automatic stabilizers, such as unemployment insurance, which react to business cycle conditions without active management on the part of the government. In the research literature, these topics have most often been examined in the context of macroeconomic stabilization and development. While automatic government spending in principle should be countercyclical (as in the case of unemployment insurance) to meet increased demand, various researchers have documented a surprising degree of procyclicality in government spending in the developing world. Frankel et al. (2013) and Vegh and Vuletin (2015) point to weak institutions and tax policy respectively as explanatory factors. Lim (2020) stresses the extent to which fiscal rules exacerbate procyclical tendencies.
Fewer studies have examined the relationship specifically between nonprofits and the business cycle. Salamon and Geller (2010) compare the employment growth in nonprofits and for-profits during both recession and nonrecession years using Maryland’s Quarterly Census of Employment and Wages for 2007–2008. They find that nonprofits added jobs during recessions compared with for-profits, though they do not speak to how such spending was funded. In his survey on nonprofits and the macroeconomy, Steinberg (2018) hypothesizes that nonprofit revenues are procyclical and the need for nonprofit goods and services is countercyclical. More recently, Exley et al. (2023) use bivariate regression to begin teasing apart the relationship between nonprofit expenditure growth and income growth, with particular attention to the business cycle. In doing so, the authors highlight the disconnect between nonprofit income growth and the demand for services.
Why would we expect the business cycle to have different impacts on nonprofit revenues and expenses? In the for-profit sector there is typically a direct relationship between sales and expenses. This is true for both retail organizations, in which the cost of goods sold varies proportionally with sales, and in the service sector, where wages vary in proportion to revenues. However, in the nonprofit sector the relationship between revenues and expenses is typically not straightforward, especially in cases where nonprofits receive a large share of their funding from donors who do not expect to see a direct financial or economic benefit from their “investment” in the organization and its mission. This disconnect between revenues and expenses has been fertile ground for nonprofit scholars, touching as it does on the fundamental tension between ensuring the financial stability of a nonprofit organization and meeting its immediate social goals, and has prompted decades-long discussions on the extent to which certain revenue types should be cultivated. Often, these discussions have focused on attributes of the revenue itself (such as volatility, as in Carroll & Stater, 2009) or the costs of cultivating such types (such as overhead minimization, as in Lecy & Searing, 2015). However, though the nonprofit research literature contains a great deal of information on revenue behavior within the portfolio such as crowding out, there is very little on how different revenue types are impacted by macroeconomic factors.
Managing Revenue Risk and Volatility
While financial theory defines risk as the variance of an investment portfolio, the nonprofit literature has frequently discussed risk in broader terms. According to this view, we can think of risk as a measure of the possibility that outcomes diverge from expectation (Herman, 2002). In their landmark book for practitioners, Herman et al. (2004) separate risk into ten categories based on either the activity involved in creating risk (such as transportation of clients or working with vulnerable populations) or the asset being risked (such as income or property). The academic literature tends to reflect these categories, with the risk management literature spanning several different types of risk rather than a unified theory or approach (Chikoto-Schultz, 2023; Domański, 2016). This has resulted in a fragmented and sparse field, with only 22 academic articles published prior to 2017 directly related to risk management in nonprofits (Santos & Laureano, 2021).
This broadens significantly once we expand the concept of financial risk into financial vulnerability. Financial vulnerability encompasses a variety of scenarios whereby financial pressures result in closure (Hager et al., 1996; Searing, 2020), loss of net assets (Trussel, 2002; Trussel & Greenlee, 2004), insolvency (Keating et al., 2005; Searing, 2018), or programmatic disruption (de Andrés-Alonso et al., 2015; Tuckman & Chang, 1991). Although initially relying on a strong accounting focus (Chang & Tuckman, 1994; Greenlee & Trussel, 2000; Tuckman & Chang, 1991), this subfield of the nonprofit literature has also been strongly influenced by interdisciplinary theories such as organizational ecology (Hager, 1999; Hager et al., 2004; Searing, 2015). These theories shifted the emphasis from predictive modeling, the focus of much of the original literature, to complex revenue-specific phenomena, such as the danger that government funding will crowd out donations or the financial risk associated with reimbursement-based contracts.
There are two general recommendations to manage this type of income-related risk exposure. The first is to supplement a particular income type with an alternative, “safer” income stream. In most cases, this involves increasing the role of earned income, which is frequently described using the commercial term “self-sustaining” (Kerlin & Pollak, 2011; Khieng & Dahles, 2015), or more specifically diversifying away from government sources of revenues into donations or earned income (Bennett & Savani, 2011). The logic is that the shortcomings specific to one particular type of revenue (such as the clumping of payments from grantors) can be offset by income sources with different attributes, such as a steady trickle of money from t-shirt sales.
The other recommendation is to focus on the diversification of revenue types rather than any combination of types in particular. This approach regards higher degrees of revenue portfolio diversification as more ideal (Berrett & Holliday, 2018; Chang & Tuckman, 1994; Hung & Hager, 2019; Tuckman & Chang, 1991). Revenue diversification is often measured using a Hirschman-Herfindahl Index (HHI), an index imported from antitrust economics to gauge the competitiveness of a given market space (Chikoto et al., 2016). Unlike the recommendation to replace one type of revenue with a “safer” type, the recommendation to diversify one’s revenue portfolio is almost agnostic as to the mission and character of the organization and has thus drawn criticism that it ignores the practical realities of managing an organization; the ideal revenue portfolio according to this branch of the literature would likely be impossible to manage and could lead to mission drift (Froelich, 1999; Frumkin & Keating, 2011; Young, 2007). Nonetheless, a substantial literature exists that demonstrates diversification’s positive impacts on increasing output (Berrett & Holliday, 2018), stabilizing a nonprofit’s revenue structure (Carroll & Stater, 2009), and decreasing the likelihood of financial vulnerability (Hager, 2001; Tuckman & Chang, 1991).
Hypotheses Development
We form several hypotheses for our two research questions based on prior empirical and theoretical studies. First, we expect that individual donations are procyclical. Individual donors will benefit from wealth effects when the economy (and stock market) are strong, particularly as donors to nonprofits come disproportionately from the upper end of the wealth distribution whereby their wealth and income derive from capital income rather than wages. 1 The deductibility of charitable contributions also gives donors an incentive to give at points in time when the tax deduction is most valuable to them, that is, when their income is high. Second, we expect that earned revenues are acyclical, that is, the correlation with the business cycle is close to zero. The existing theory and evidence do not provide much insight into the cyclicality of earned revenue, as there is substantial heterogeneity in the demand for goods and services across subsectors. Demand for social services increases during an economic downturn (Lin & Wang, 2016), which would suggest that earned revenue is countercyclical; however, ticket sales for orchestras and related discretionary purchases fall when the economy slows (Flanagan, 2012, p. 13). Many services, such as essential medical care, are inelastic, as they remain indispensable irrespective of economic conditions, though there is some evidence to suggest that demand for medical services on the whole is countercyclical (Wood, 2011). Therefore, due to heterogeneity in the sources of earned income, we expect the relationship between aggregate earned revenues and the broader economy to be acyclical:
After establishing the cyclicality of these revenue types, we turn to looking at the role that these revenue types play in mitigating business cycle risk. Although it may seem that increasing exposure to a procyclical revenue source will necessarily increase an organization’s exposure to the business cycle, this is not necessarily the case. An organization’s exposure to the business cycle—by which we mean, the extent to which an organization’s total revenues are procyclical—will depend on the interplay between various revenue types. Even if an organization sees an increase in a procyclical revenue, the overall risk may not decline if these revenues come at the expense of other revenues that are equally procyclical or if the specific nature of the revenue changes at the margin. For example, an organization that seeks to expand its donation revenue may seek out different donors than it has in the past, thus shifting its exposure to the business cycle even as it increases the role of donations. Nevertheless, all else equal we expect that an increase in the revenue share of donations will cause total revenues to become more procyclical and an increase in the revenue share of earned revenue will cause total revenues to become more acyclical. We have no reason to expect that proportional increases in donations will come at the expense of other procyclical types, nor do we have reason to believe that increases in earned revenue will shift the revenue mix in any particular direction:
Beyond specific revenue types, we also test the impact of the most common prescription for managing risk in the revenue portfolio: revenue diversification. Revenue diversification addresses the risk of income disruption by providing alternate revenue options that can fill the gap left by the interrupted revenue (Carroll & Stater, 2009; Froelich, 1999; Hung & Hager, 2019). We expect that diversification also protects against revenue-specific correlations with the business cycle, much as portfolio theory shows how a diversified investment portfolio has a lower variance in its overall performance than a portfolio based on a small number of specific investments:
Data
To test these hypotheses, we rely on the set of Core Files provided by the National Center on Charitable Statistics. We use data from 1990 to 2017. These files provide a consistent source of nonprofit data from the start of active curation by the NCCS through 2017, when the Internal Revenue Service took over the bulk of data provision. Although the NCCS no longer curates the Core Files, it continues to make them available. For researchers with experience and a willingness to engage in cleaning, the files continue to possess significant advantages over other sources of data, including the fact that they do not over-sample larger nonprofits nor do they rely solely on nonprofits who e-file.
Our GDP data come from the Bureau of Economic Analysis (BEA). Our sample period encompasses three recessions—the early 1990s, the bursting of the dot-com bubble in the early 2000s, and the Great Recession of 2007–2009—thereby giving us visibility to multiple economic cycles.
We restrict our analysis to 501(c)(3) operating charities. This allows us to focus on organizations with a consistent tax treatment of donations, a revenue type that plays an important role in our study. Tax exempt entities that are not 501(c)(3)s do not have the ability to grant individual tax deductions on their donations and thus exhibit a different set of dynamics with respect to their donors. We also exclude foundations and focus exclusively on operating charities due to the differences in financial objectives and management between the two groups.
We also conduct rudimentary cleaning necessary for the study. We remove duplicate observations, retaining the most recent observation in case of restatements. We also remove observations that do not include all necessary information, such as the year that tax exempt status was granted, state, or NTEE classification. Due to the inclusion of a Herfindahl–Hirschman index in our regression analysis, we restrict our regression sample (but not our descriptive sample) to those nonprofits with positive net revenues. Also, since our outcome variable is a rate of change, we restrict our regression sample to those organizations with at least two consecutive reporting years.
Figure 1 shows the “average” nonprofit revenue portfolio for the regression sample. 2 We construct the average by first calculating the average percentage of revenues coming from different revenue types for all of the organizations in our sample (e.g., average percent of revenues coming from contributions). We focus on six revenue categories from the Form 990: contributions, program service revenue, investment income, special events, inventory gross profit, and other. After calculating these percentages for every organization, we then tabulate the mean percentages and present them in the figure. (Note that this approach produces different results than tabulating the aggregate revenue from a particular revenue type as a percentage of the aggregate revenue for the sector. However, as our ultimate interest is in the managerial implications of business cycle risk, we focus on the average charity rather than a dollar-weighted average). The average percentage of their revenue that nonprofits in the sample earn from contributions is 50%. Although “contributions” as measured by the Form 990 primarily reflects individual donations (Giving USA Foundation, 2022), the figure also includes revenue generated from federated campaigns, contributions from related organizations such as supporting foundations, and government grants. Program revenue, which includes fees for service, income from merchandise sales, as well as revenue from government contracts, is next largest at 31%. These two primary revenue types are followed by other (6%), special events (6%), investment income (5%), and inventory gross profit (2%). Figure 2 shows how these revenue profiles have changed over time. Despite enormous growth in the nonprofit sector over the last 30 years, the average nonprofit’s revenue profile remains much the same.
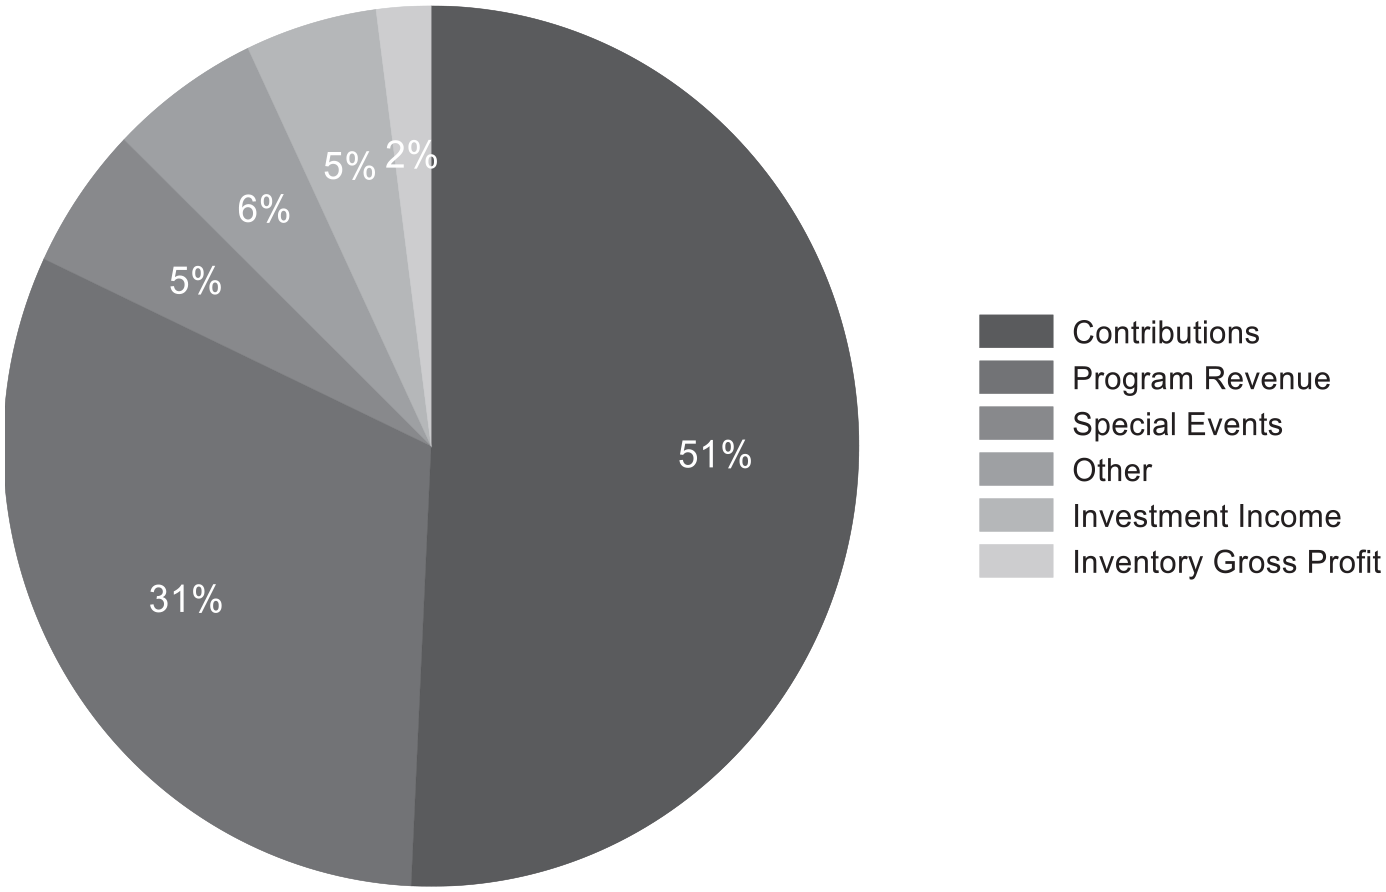
Average Nonprofit Revenue Portfolio.
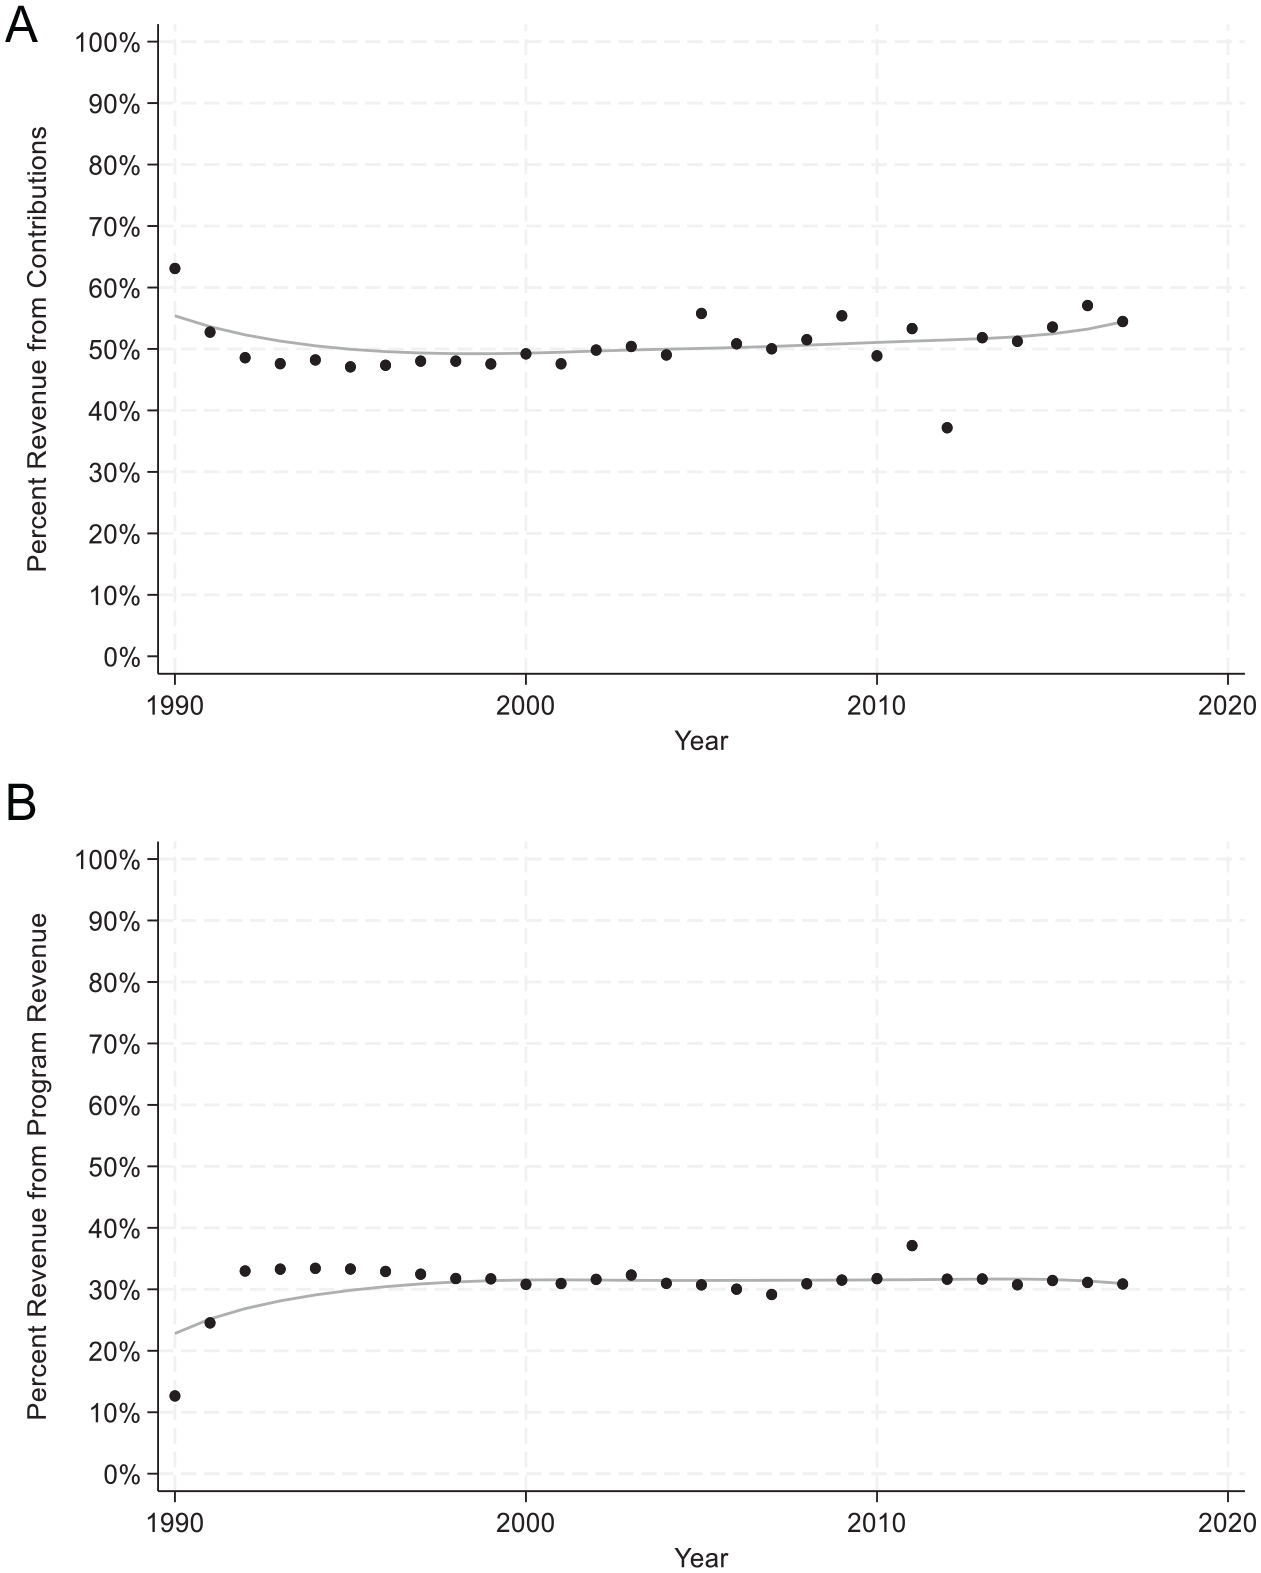
Revenue Portfolios Over Time. (A) Percent Revenue From Contributions. (B) Percent Revenue From Program Revenue.
Method
Measuring Cyclicality
We first concentrate on measuring cyclicality for the nonprofit sector as a whole. To do this, we measure the cyclicality of nonprofit revenues in aggregate as well as by revenue type (e.g., the cyclicality of aggregate contributions). To shed light on the wide range of organizations within the nonprofit sector, we also aggregate revenue to the subsector level and measure the cyclicality of total revenues by subsector.
We measure cyclicality as the correlation between the cyclical component of real revenue and the cyclical component of real GDP over 1990–2017. Estimating the cyclical component of revenues requires us to separate out the “cyclical” component from the “trend” or “structural” component. To do this, we use a time-series filter. Time series filters are used extensively in macroeconomics to estimate the business-cycle component of a macroeconomic variable. For example, Frankel et al. (2013) and Vegh and Vuletin (2015) use a filter to isolate the cyclical component of government revenues so as to determine whether government revenues in developing countries are procyclical or countercyclical, much as we seek to determine here whether revenues in the nonprofit sector are pro- or countercyclical. Although there are a variety of different filters, all share the purpose of “filtering” the deterministic time trend, usually a polynomial function of time, from the stochastic trend, that is, random variation.
We implement the time series filter using the tsfilter command in Stata. Following Frankel et al. (2013) and Vegh and Vuletin (2015), we specifically use the Hodrick-Prescott (hp) filter, which can be applied to data from a wide class of data-generating processes (Hodrick & Prescott, 1997). After using the filter to identify the cyclical component of different time series, we then examine the correlation between those cyclical components. For example, a positive correlation between the cyclical component of aggregate nonprofit revenues and the cyclical component of GDP would indicate that nonprofit revenues are procyclical, while a negative correlation would indicate that they are countercyclical.
Regression Analysis of Revenue Growth
To further understand the relationship between business cycle risk and the revenue portfolios of nonprofit organizations, we employ regression analysis. Unlike the analysis above, which looks at aggregate revenues across various subsectors, here we seek to understand how changes in the revenue portfolios of individual nonprofits affect their exposure to business cycle risk. While the descriptive results above are useful for understanding the sector as a whole, they obscure a considerable amount of heterogeneity and do not shed light on how individual nonprofits can affect their exposure to the business cycle by shifting their revenue portfolios.
Although we might like to incorporate the time series filter in our regression, because the filter uses data from an entire time series it is only appropriate for cross-sectional comparisons and thus not suitable for panel settings in which the unit of analysis varies over time. Thus, to examine the effect of changes to individual nonprofit organizations’ revenue portfolios, we use a regression of the following form:

where %∆Rev represents the year-over-year (real) percent change in total revenues for organization
We again measure cyclicality as the correlation between the cyclical component of revenues and the cyclical component of GDP. However, in this case, because our observations are at the organization-year level, we calculate this correlation in a more straightforward fashion by examining the correlation between the percent change in revenues and the percent change in GDP. Taking the percentage change in the two “macro” variables enables us to at least partially isolate the trend components, which is more difficult in this setting because we require measures of cyclicality that vary at the level of the observation-year. The correlation between the two variables is captured by two coefficients,
One potential pitfall to using percentage changes in our regression analysis is that quirks of the data may yield extreme outliers. For example, if a new organization reports near-zero revenues in its first year, then it may show a 1000-fold increase in its second year. These types of outliers may lead to bias in our estimates. To address this concern, we follow Davis et al. (1996) in calculating percent changes using the following formula, which not only reduces the influence of outliers but also removes the need for winsorizing the data at arbitrary thresholds:

Findings
The Relationship Between Aggregate Nonprofit Revenues and the Business Cycle
Figure 3 shows the relationship between the business cycle and nonprofit revenues in aggregate—both for the sector as a whole (in gray) and by revenue type. Each bar shows the correlation between the cyclical component of revenues and the cyclical component of GDP. 4 We deflate all revenues and GDP using the Bureau of Economic Analysis’ GDP deflator, and thus the correlations are between real revenues and real GDP. Higher correlations indicate that a subsector’s revenues are more procyclical. Negative correlations indicate that a subsector’s revenues are countercyclical, that is, they are negatively correlated with the business cycle.
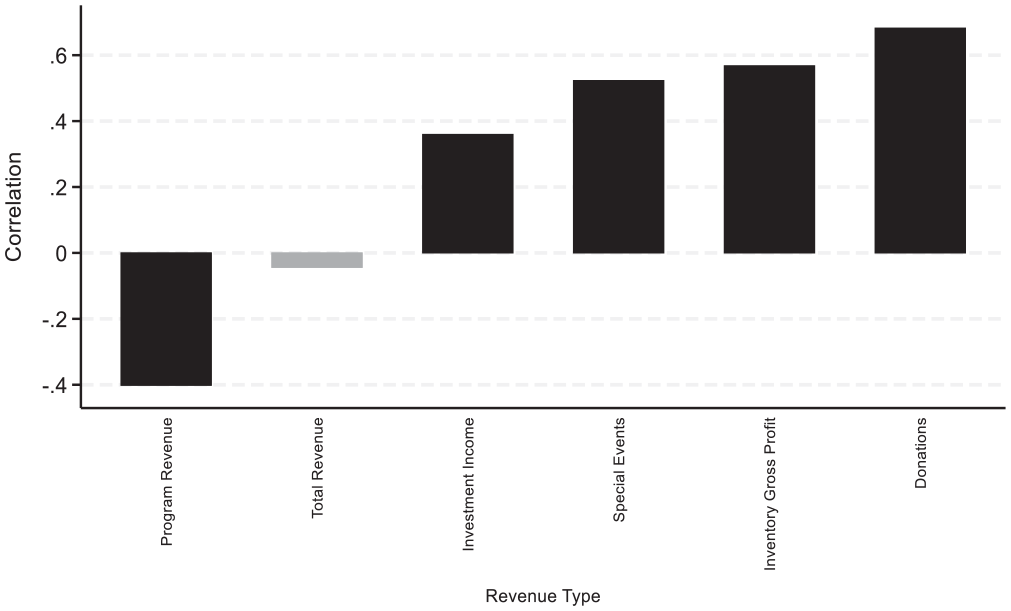
Correlations Between the Cyclical Components of Nonprofit Revenue Types and GDP.
The figure shows that aggregate revenues in the nonprofit sector as a whole are acyclical. The correlation between aggregate revenues in the nonprofit sector and GDP is -.04. Donations are procyclical, with a correlation of 0.68, and program revenue is countercyclical, with a correlation of -0.40. While the focus of this paper is primarily on these two types, as they make up the bulk of revenues for most nonprofits, it is also worth noting that other revenue types are also procyclical, with inventory gross profit showing a correlation of 0.57, special event revenue showing a correlation of 0.52 and investment income a correlation of 0.36. 5
Figure 4 shows the results by subsector. Revenues in the “public and societal benefit” subsector are the most procyclical, with a correlation of 0.61, followed by education at 0.60 and “arts, culture, and humanities” at 0.51. This is likely related to the reliance of these subsectors on donation revenue from individuals and government grants, both of which are highly procyclical. On the other end of the spectrum, mutual benefit organizations and health care organizations demonstrate countercyclicality; the cyclical component of their revenues is negatively correlated with the business cycle. Mutual benefit organizations, such as a worker’s compensation trust, likely see increased revenues from their sponsoring organizations during times of need. Health care organizations see greater patient demand—and consequently greater earned revenues—during recessions, consistent with countercyclicality in health care employment and Medicaid spending (Snyder & Rudowitz, 2016; Wood, 2011). Interestingly, the revenue of religious organizations appears to be largely acyclical, showing a correlation close to zero.
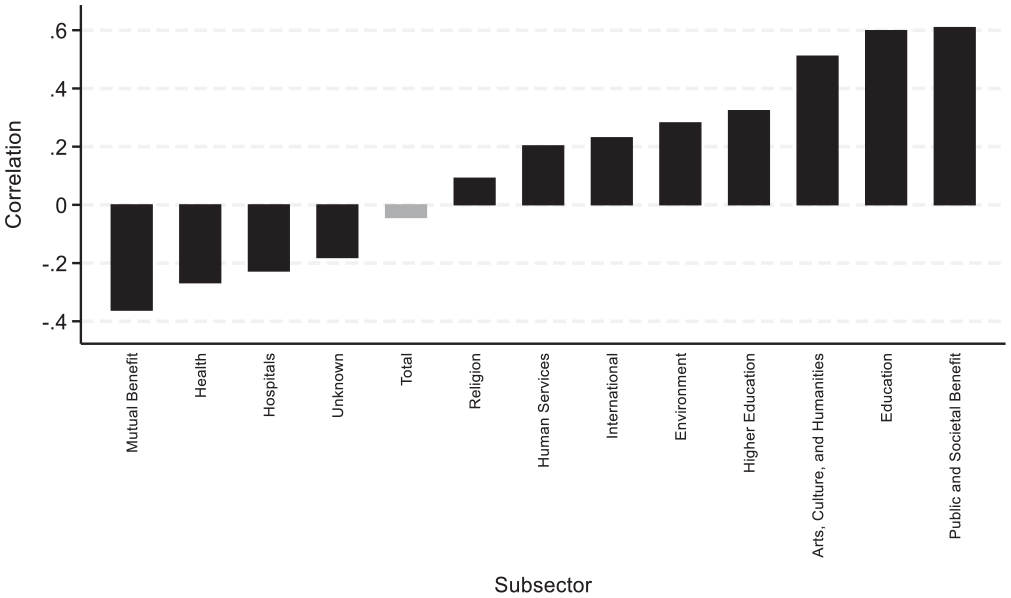
Correlations Between the Cyclical Components of Subsector Revenues and GDP.
These results shed light on the cyclicality of the nonprofit sector as a whole. However, they are less useful as a guide toward the behavior of individual organizations, as the revenue and subsector aggregates are heavily influenced by the largest organizations. Smaller organizations that are more typical of the median nonprofit may exhibit trends that differ substantially from those of nonprofits in aggregate. To the extent that we are concerned with decision-making at the organizational level, it may be more useful to look at changes within individual organizations over time rather than at subsector aggregates. Thus, to further explore the role of different revenue types in mitigating business cycle risk, we turn to regression analysis of individual organizations.
The Role of Business Cycles in Revenue Growth
In Table 1 we display summary statistics from our regression sample. The results from the regression analysis are displayed in Table 2. As noted above, we employ fixed effects regressions at the organization-year level with cluster-robust standard errors. The data set includes 4.3 million observations across roughly 534,000 nonprofits. Unlike the descriptive results above, which aggregate revenues by type and by subsector, this analysis focuses on changes in the revenue portfolio of individual organizations, which is arguably more relevant to the management questions that we seek to answer.
Summary Statistics.
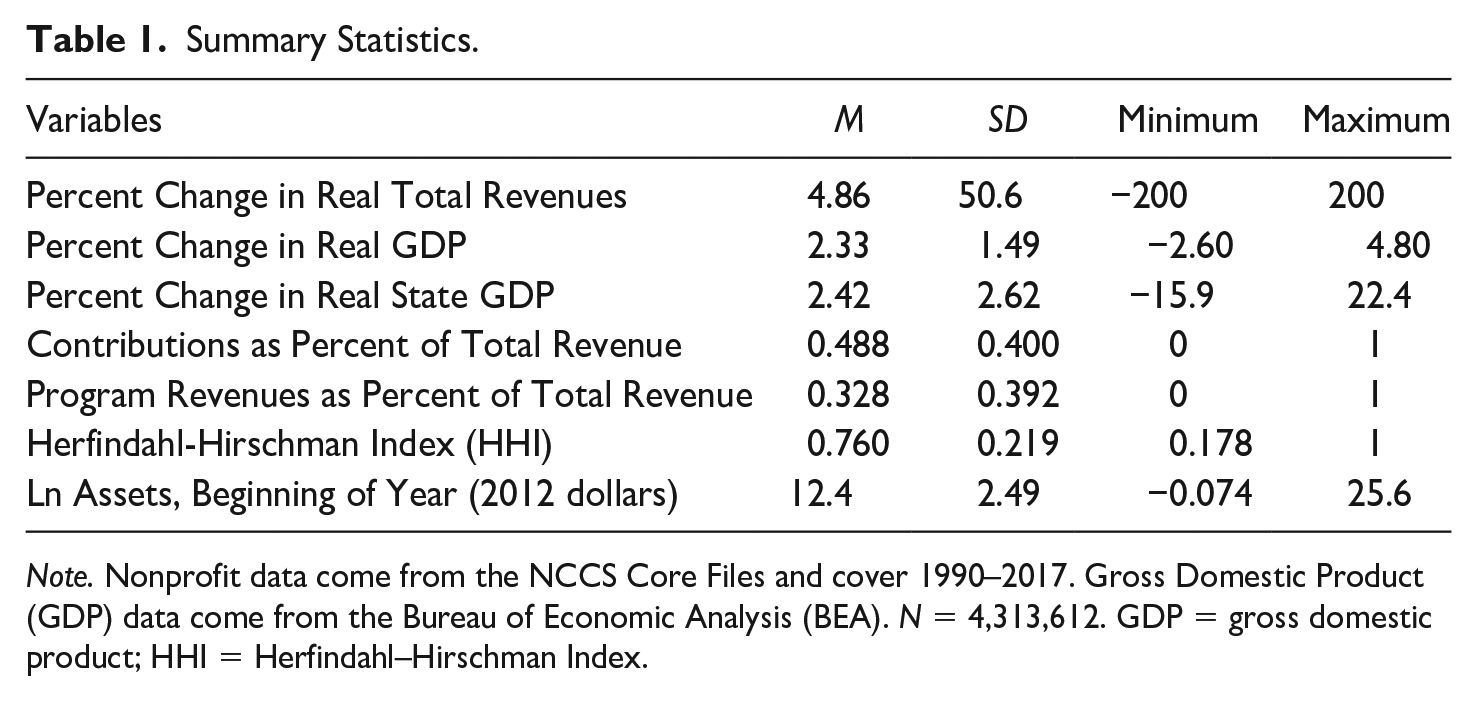
Note. Nonprofit data come from the NCCS Core Files and cover 1990–2017. Gross Domestic Product (GDP) data come from the Bureau of Economic Analysis (BEA). N = 4,313,612. GDP = gross domestic product; HHI = Herfindahl–Hirschman Index.
Baseline Results
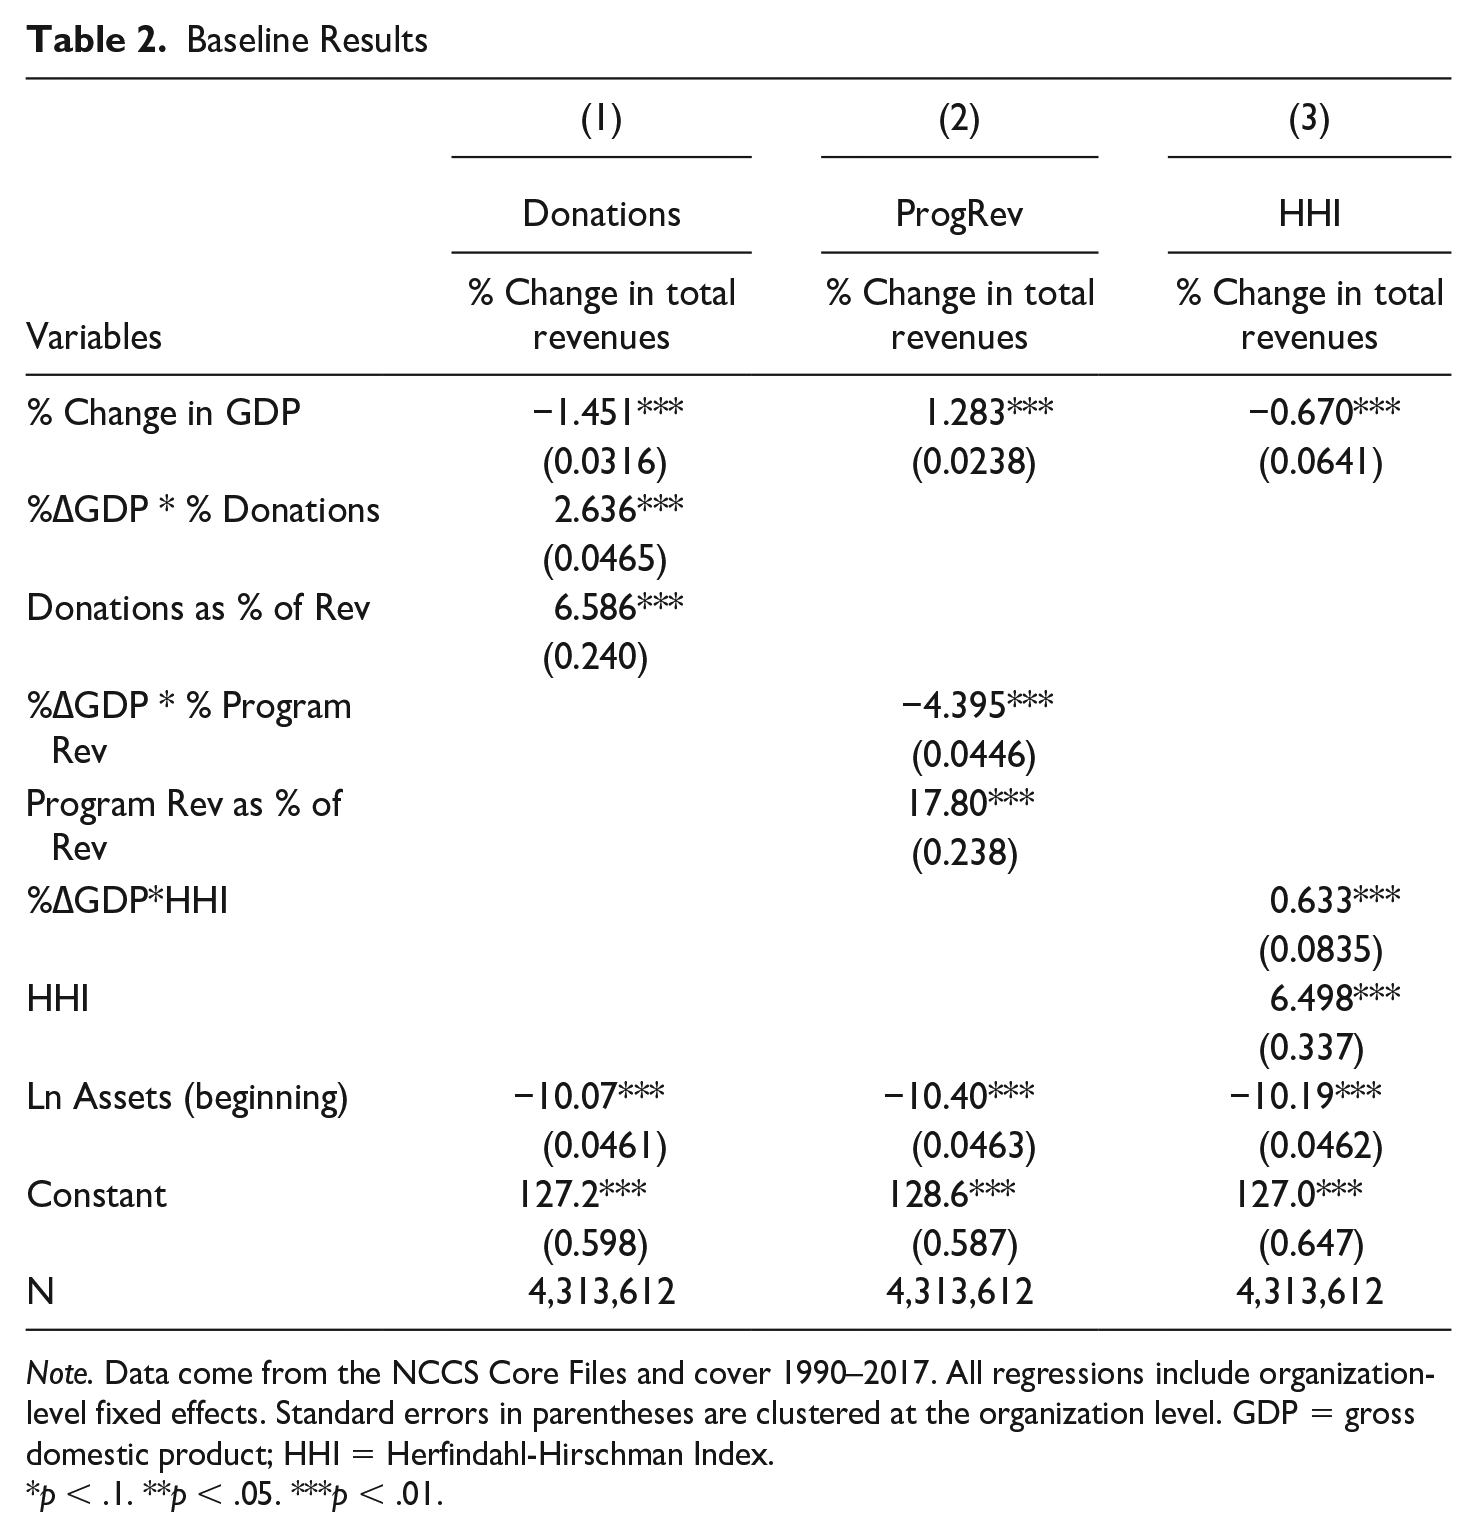
Note. Data come from the NCCS Core Files and cover 1990–2017. All regressions include organization-level fixed effects. Standard errors in parentheses are clustered at the organization level. GDP = gross domestic product; HHI = Herfindahl-Hirschman Index.
p < .1. **p < .05. ***p < .01.
Before discussing the results for the coefficients of interest, we note that the coefficient on assets is negative in every case, as would be expected. Larger organizations (by size of assets) show lower levels of revenue growth than smaller organizations. This provides some face validity to our findings.
Donations
To examine the impact of donations on business cycle risk, we first consider cyclicality when donations are zero. We can observe this by considering the coefficient on the standalone business cycle term (% change in GDP) in column 1. Here we see evidence of countercyclicality; all else equal, a one percentage point increase in GDP is associated with a 1.5 percentage point decrease in total revenues. To the extent that program revenues and donations are the major types of revenues for nonprofits, this finding is consistent with Figure 3; organizations that rely more heavily on program revenues than donations will have revenue portfolios than are more countercyclical.
When we examine the coefficient of interest, the coefficient on the interaction term between the percent of revenues from donations and the percent change in GDP, we see that it is positive and significant, indicating that procyclicality increases as the percentage of the revenue portfolio attributable to donations increases. One way to interpret this is to consider the marginal effect of a change in GDP at different values of the revenue share. With donations at 25% of revenues and all other variables set to their mean values, a one percentage point increase in GDP is associated with a 0.8 percentage point decrease in total revenues. With donations at 75% of revenues, a one percentage point increase in GDP is associated with a 0.5 percentage point increase in total revenues. Again, this result is consistent with our descriptive findings above: a higher percentage of revenues from donations tends to increase procyclicality. We also observe a positive coefficient on the standalone donations term, indicating that when real GDP growth (and thus the interaction term involving the percent of donations) is zero, an increase in donations as a relative share of the revenue portfolio boosts revenue growth.
Earned Revenues
Once again, we first consider the standalone business cycle term (% change in GDP). This reveals the extent to which total revenues are procyclical when the percentage of earned revenues is zero. The coefficient is positive and statistically significant. A one percentage point increase in GDP is associated with a 1.3 percentage point increase in total revenues. This again is consistent with a model of the nonprofit sector in which donations are driving procyclicality: When an organization does not earn program revenue and instead relies on donations, its total revenues are procyclical.
When we consider the coefficient on the interaction term, we find that it is negative, larger in magnitude than the corresponding coefficient for donations, and statistically significant. An increase in the proportion of revenues coming from earned revenues attenuates the procyclicality of an organization’s overall revenue portfolio. With program revenue at 25% of total revenue and all other variables set to their mean values, a one percentage point increase in GDP is associated with a 0.2 percentage point increase in total revenues. With program revenue at 75% of total revenue, a one percentage point increase in GDP is associated with a 2 percentage point decrease in total revenue. The results for donations and program revenue, as expected, mirror each other. As in the case with donations, the coefficient on the standalone term representing the share of revenues from earned revenue is positive, implying that when GDP growth is zero and the standalone term is interpreted independently from the interaction term, an increase in the share of revenue coming from earned revenue increases overall revenue growth.
HHI
According to the results in column 3, when the revenue portfolio is perfectly diversified (the hypothetical scenario where HHI = 0), total revenues are moderately countercyclical, though the coefficient is small. The interaction term is also small and positive, suggesting that as an organization becomes less diversified—and more reliant on a single revenue type, like donations—its revenues become more procyclical. Thus, this finding is somewhat in line with the widely employed recommendation that revenue diversification is an effective risk management tool; an organization with a perfectly diversified revenue portfolio will have little exposure to the business cycle.
Robustness
The findings above use OLS regressions and a national measure of GDP to explore the effects of different nonprofit revenue types on business cycle risk. In this section, we explore the robustness of these findings by considering alternative specifications.
First, we address the concern that revenue shares may be endogenous. If the economic cycle directly impacts revenue shares, then this may bias our coefficients of interest. For example, if an economic downturn causes donations to fall—thereby causing the revenue share of donations to fall—then this may bias the coefficients on the GDP terms. To address this concern, we instrument for the revenue shares (the RP variables in equation 1) using two lags of the share.
The results are in Table 3. For donations and program revenue, there is little change to our main conclusions. The sign and statistical significance of the coefficients on the interaction terms remain unchanged, although they have decreased in magnitude. The HHI results, however, do change; the coefficient on the interaction term is no longer significant. While the coefficient on the percent change in GDP remains small—indicating that revenues are somewhat acyclical for organizations with a perfectly diversified revenue portfolio—it is not clear that an increase in revenue concentration has any effect on business cycle risk.
Using Lags to Instrument for Revenue Shares.
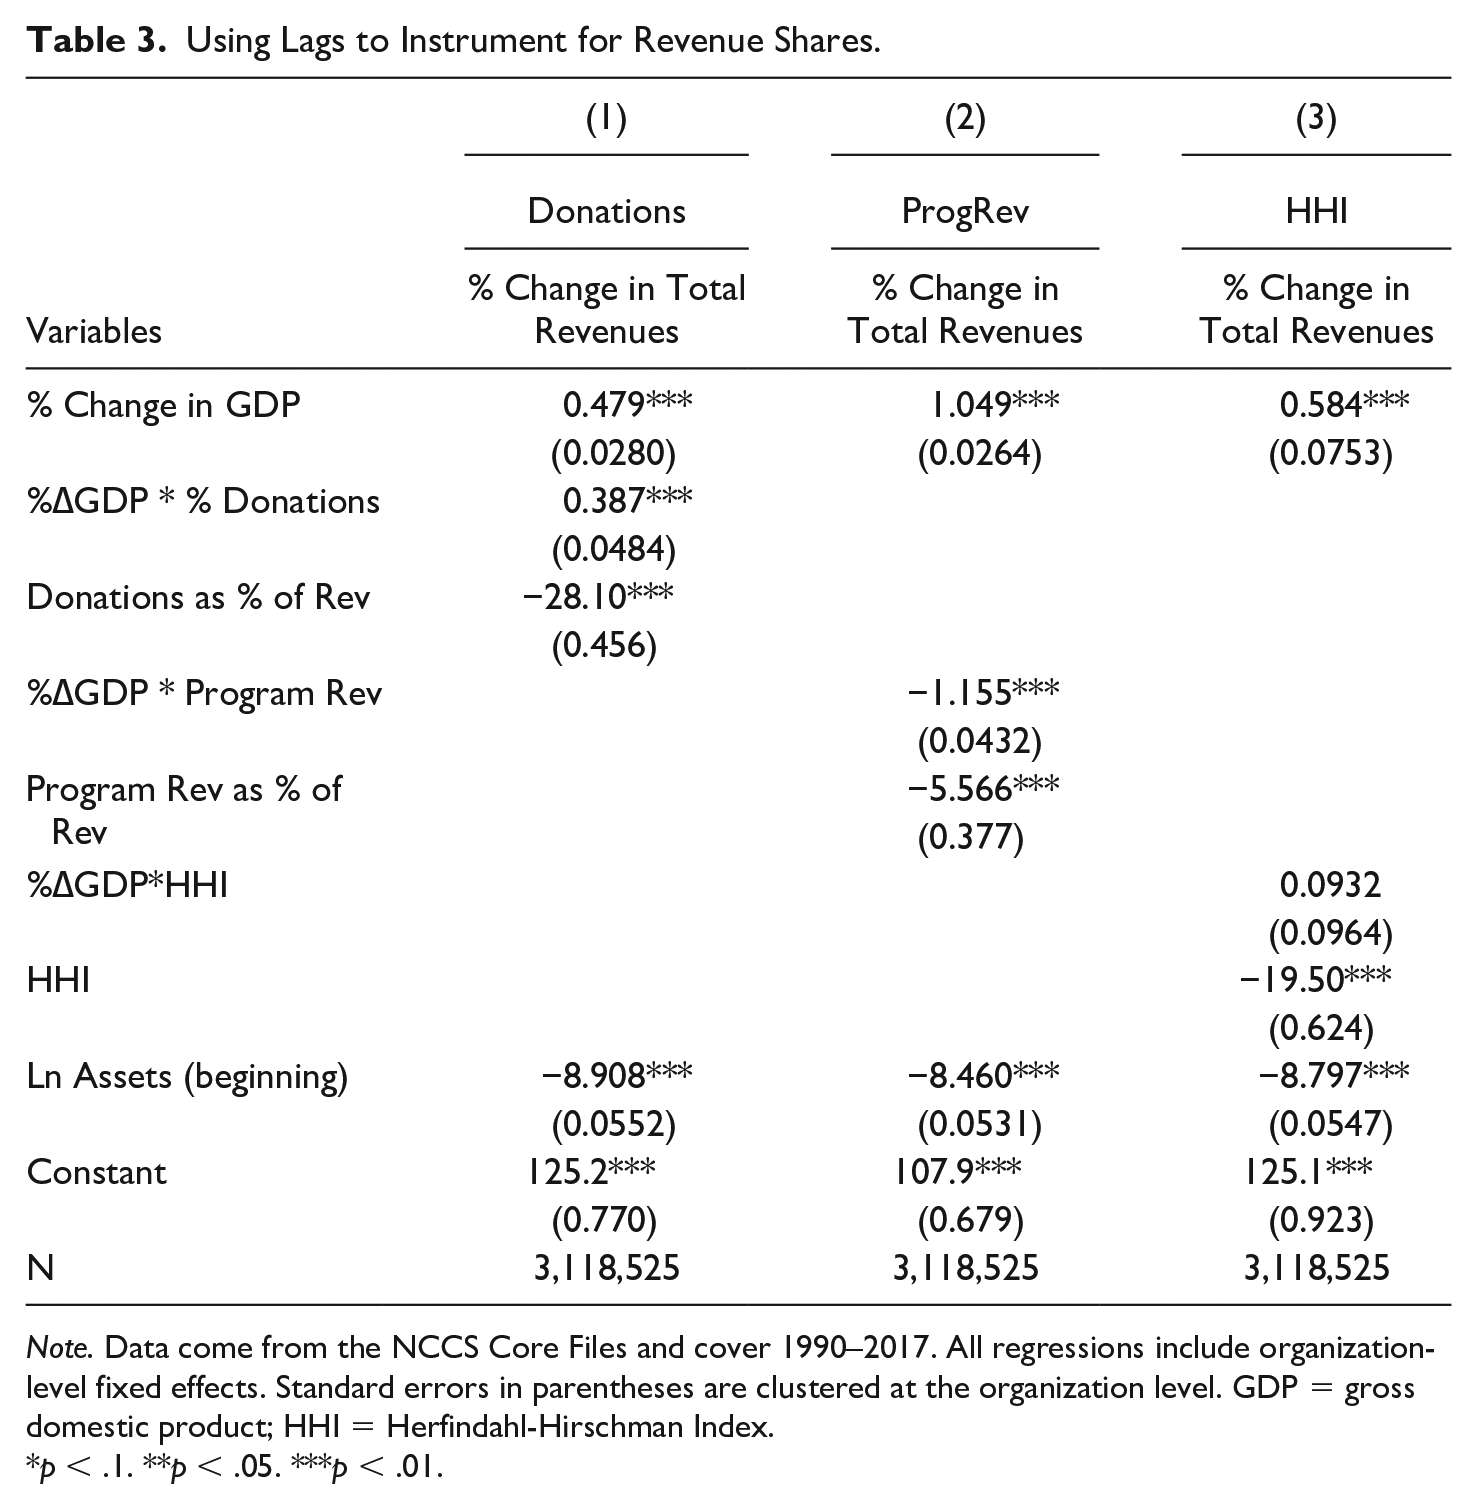
Note. Data come from the NCCS Core Files and cover 1990–2017. All regressions include organization-level fixed effects. Standard errors in parentheses are clustered at the organization level. GDP = gross domestic product; HHI = Herfindahl-Hirschman Index.
p < .1. **p < .05. ***p < .01.
In Table 4 we adjust our model once again, this time using state GDP rather than national GDP as a measure of the business cycle. To the extent that nonprofits draw from in-state donors, then state GDP may be a better measure of business cycles in so far as they are experienced by nonprofits. Once again, the results for donations and program revenue are unchanged; the signs and statistical significance of the interaction terms are the same. 6 In the case of HHI, the coefficients on the percent change in (state) GDP and the interaction term are even smaller than those in Table 2, casting even further doubt on the role of revenue diversification in mitigating business cycle risk.
Using State GDP.
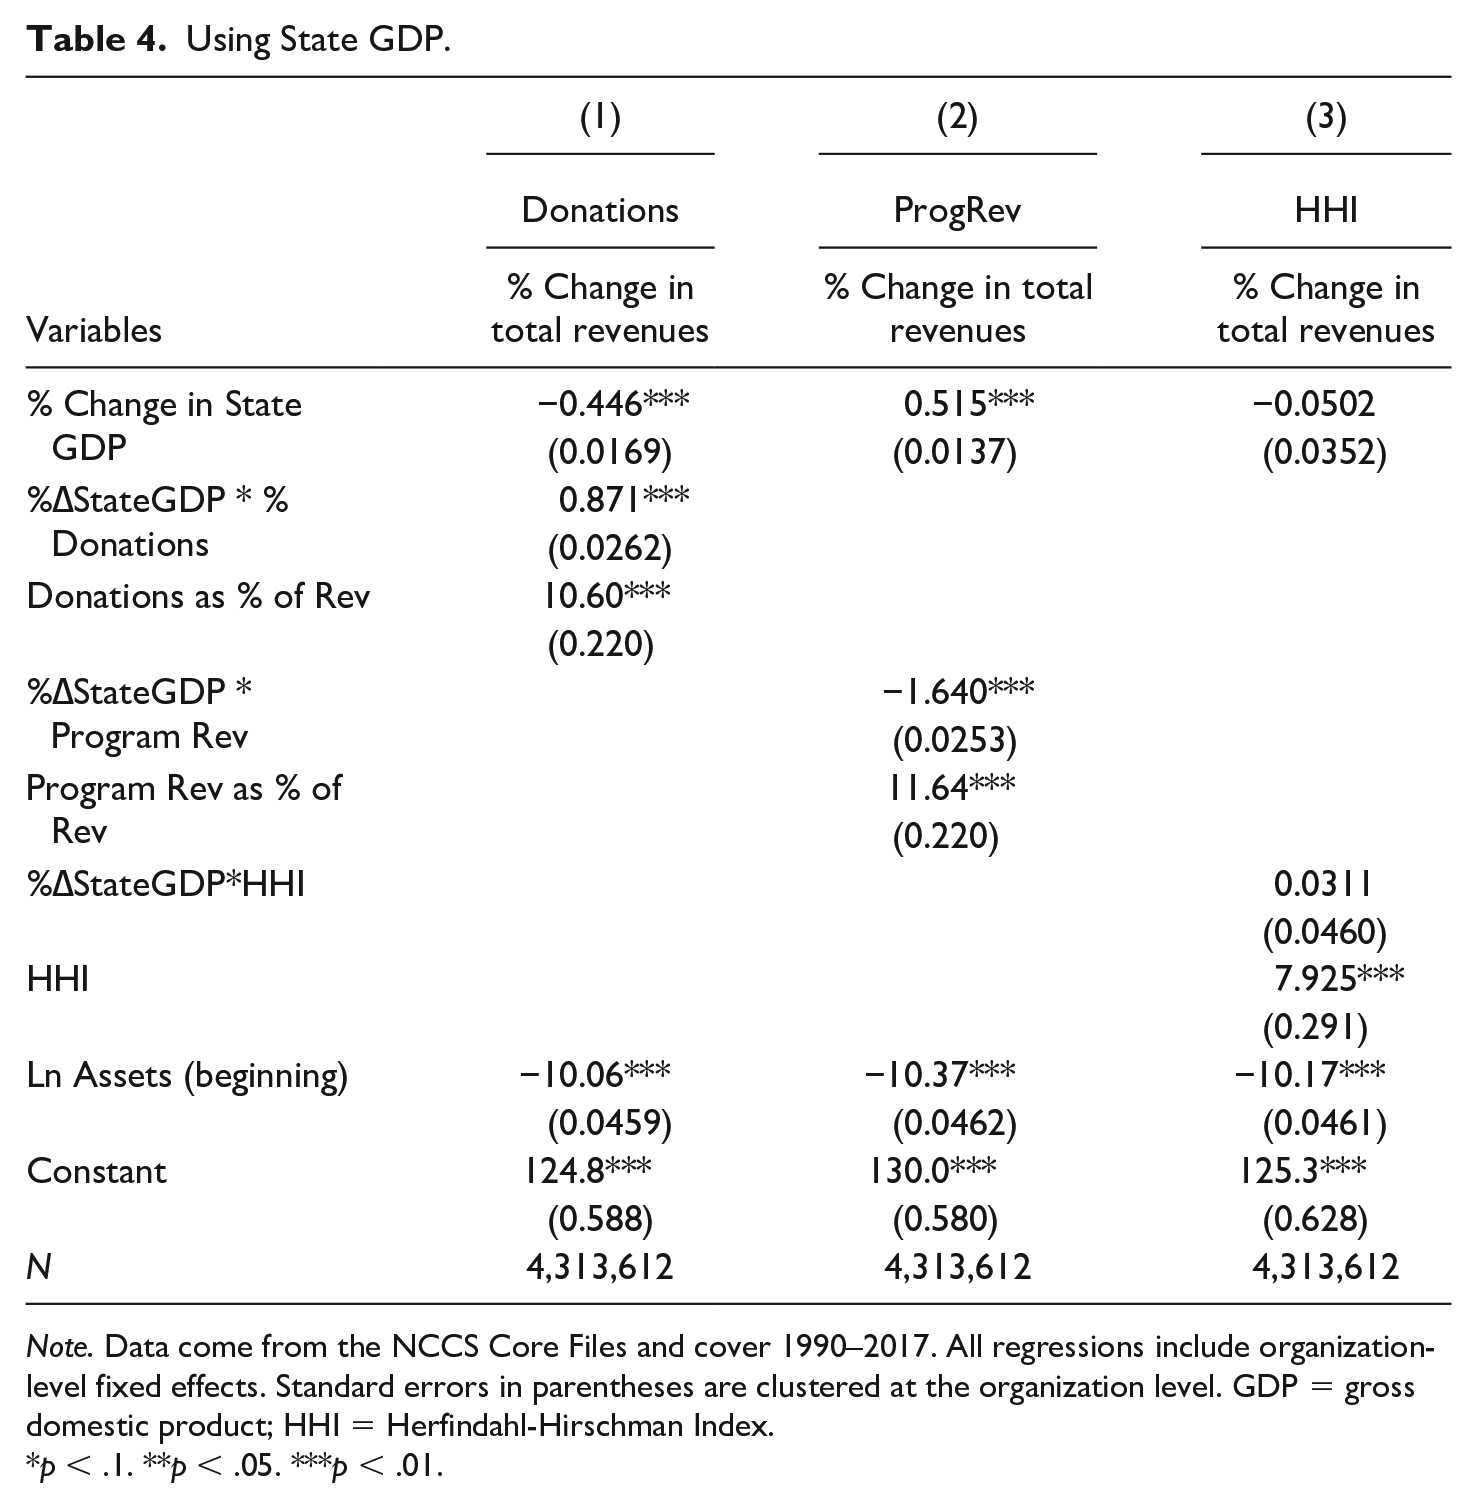
Note. Data come from the NCCS Core Files and cover 1990–2017. All regressions include organization-level fixed effects. Standard errors in parentheses are clustered at the organization level. GDP = gross domestic product; HHI = Herfindahl-Hirschman Index.
p < .1. **p < .05. ***p < .01.
Discussion
This study is consistent with other work that has investigated the relationship between the nonprofit sector and the business cycle. Exley et al. (2023) also conclude that nonprofit revenues are procyclical. However, they frame this question in terms of how nonprofits should optimally provide services and rely on survey methods to inform their theory-building. Relative to prior work, this study extends the boundary of the literature in two ways. First, we test the cyclicality of specific types of revenue using time series filters to examine the revenue portfolios of different nonprofit subsectors. Second, we use fixed effects regressions to investigate the effects of shifting revenue portfolios on the business cycle risk of individual organizations, with the aim of generating actionable guidance for nonprofit managers.
Our conclusions call for a new look at the benefits and risks of earned revenues. For many years, funders have treated earned revenues as the pathway to resilience or “self-sufficiency.” The COVID pandemic brought this into question as there is evidence that those nonprofits most reliant on earned revenues were in the most trouble. However, this study provides evidence that earned revenues may be useful insofar as they provide a counterbalance to more procyclical revenue types, thereby reducing exposure to business cycle risk.
The findings also raise questions about the role of diversification as a panacea for mitigating revenue-related risks. While our results using HHI are somewhat sensitive to changes in the model specification, two of the three models show no effect of diversification on business cycle risk, a finding that is consistent with recent work showing that diversification as measured using the HHI has little effect on risk exposure (Kim, 2024). We interpret these results to mean that it is not the process of diversification that is beneficial to managing exposure to the business cycle, but rather the management of the specific revenue types themselves. Diversifying into a stronger donation profile will actually increase an organization’s exposure to business cycle risk, highlighting the folly of focusing on diversification as a standalone aim.
Despite these insights, there are limitations to this study. We focus only on the role of revenues in business cycle risk, and we do not explore the role that savings may play. Nonprofits with revenue profiles that are highly procyclical can in principle mitigate the problems that this creates by building up sufficient reserves. Indeed, there is a large literature in government financial management about the importance of rainy-day funds in smoothing out expenditure fluctuations. However, nonprofits face unique challenges in building up and maintaining sufficient reserves, due in part to the fact that donors do not like to give to organizations with a large amount of liquid assets (Calabrese, 2011). As a result, we leave this aspect of risk management for future work.
Conclusion
This study not only adds to the empirical evidence regarding the cyclicality of nonprofit revenues, but also introduces the concept of business cycle risk via the revenue portfolio. We find that contribution revenue in the aggregate is procyclical, while earned revenue is countercyclical, and that nonprofits exposure to these revenue types will influence their exposure to the business cycle accordingly. We also strengthen an important distinction in the literature of revenue diversification, arguing that it is more than simply the source of funds, that is, the set of donors, agencies, and clients that an organization interacts with, but also the type of funds, such as contributions or earned revenues, that can impact the ability to manage risk.
We define business cycle risk as the correlation between the cyclical component of total nonprofit revenues and the cyclical component of GDP. Mitigating this risk involves balancing the portfolio for different time periods; while both earned revenues and donations can serve as important drivers of revenue growth, the strong procyclicality of donations means that the revenue upswings during good times will necessarily be coupled with downswings during the bad times. Managers balancing the revenue portfolio and researchers providing guidance should be mindful of these risks for two reasons. The first is that it is unclear whether the process of diversification itself significantly mitigates the impacts of the business cycle, leaving the actual revenue types as the main drivers of the effects. The second reason is that, as often noted in critiques of the diversification literature, the practical limitations of switching from one revenue type to another (or increasing their relative share of the portfolio) means that such tactics are difficult to deploy. A nonprofit is likely unable to adjust its portfolio with much precision, especially over the short term. Therefore, further research (likely with a survey or qualitative component) on how to implement such strategies is needed.
Combined with the findings of Exley et al. (2023), this study also highlights the role that donations play in risk management. In that study, surveyed potential donors and the authors expressed “disappointment” that nonprofits in areas such as social services were not able to expand their activities during economic downturns (Exley et al., 2023, p. 42). However, both Exley et al. (2023) and this study find evidence that revenues are procyclical, with the lack of funding potentially driving the inability to expand. What is more evident following this study is that the strongly procyclical donations are driven by a decreased willingness to donate during those hard times, which is turn drives a contraction in total revenue and inability to provide more services during downturns. The disappointment and culpability for this shortcoming are shared between the managers of the revenue portfolio and those potential donors whose gifts contract during times of need, as nonprofits cannot provide services for which there is no funding.
This study also yields several additional insights for the practice of nonprofit financial management. First, nonprofit managers should assess and manage their revenue streams with an eye for risk. Second, they should be mindful of the type of revenue—rather than just the source of the revenue, as has been previously emphasized—when considering their portfolio. Third, managers should design a reserve policy that is attentive to the nature of their revenue portfolio and in particular their reliance on donations and program revenue. 7 The more that their portfolio exposes them to business cycle risk, the greater the need for actively managing their savings during periods of hardship. Finally, foundation boards and policymakers should stay informed about the nonprofit sector’s relationship with business cycle risk and work to offset potential impacts using their own funding levers. Future research will hopefully shed light on which of these channels—the mix of revenues, the nature of their reserve policy—is most important for managers to consider.
Footnotes
Data Availability
Declaration of Conflicting Interests
The author(s) declared no potential conflicts of interest with respect to the research, authorship, and/or publication of this article.
Funding
The author(s) received no financial support for the research, authorship, and/or publication of this article.