
Abstract
People tend to donate more to help a single rather than a group of victims. However, recent studies were able to reverse this compassion fade effect by presenting people with multiple donation appeals with different victim group sizes (joint evaluation) instead of just one donation appeal (separate evaluation). Because practitioners often use the compassion fade effect to boost giving, the reversal of this effect in joint evaluation settings has important implications for fundraising. This study tests whether the reversed compassion fade effect can be replicated in the field by using data from the crowdfunding platform GoFundMe. When browsing projects on GoFundMe, people see multiple projects displayed at once, placing them in a joint evaluation context. I found a concave effect of the perceived victim group size on the amount of funds raised, the number of donations received, and the size of the average donation received by a project.
Introduction
Online fundraising has become increasingly popular, providing access to a vast donor pool at very low costs (Payne et al., 2014). Crowdfunding platforms such as GoFundMe have harnessed the promises of online fundraising by allowing people to set up campaigns with only a few clicks. The $15 billion that has been collectively raised since 2010 on GoFundMe (GoFundMe, 2022), the largest donation-based crowdfunding website, speaks for the success of these platforms. Although the amount of funds raised on GoFundMe is impressive, most campaigns fall short of their fundraising targets (Kenworthy & Igra, 2022). To achieve the fundraising target, fundraisers could turn to “helping effects” to boost donations (Erlandsson, 2021). For example, they could place fewer people in the campaign picture to take advantage of the compassion fade effect, which posits that people donate more to smaller victim groups (Västfjäll et al., 2014). Evidence regarding the compassion fade effect is robust but rests on some limitations (Butts et al., 2019). The two main limitations are that the compassion fade effect has never been tested with real-world data (i.e., data collected outside of a laboratory) and that lab studies almost exclusively used between-subjects designs to study the compassion fade effect. In a between-subjects design, participants only see one donation request and are thus unable to compare between donation requests. As argued by Butts et al. (2019), between-subjects designs “do not adequately reflect the realistic settings in which people make donation decisions” (p. 27).
This study addresses both of these limitations by testing compassion fade with real-world data in a setting where potential donors can compare different donation requests. This is achieved by using data from almost 30,000 crowdfunding projects from GoFundMe. When browsing fundraising projects on GoFundMe, people can easily compare multiple donation requests because projects are displayed in a grid (see Figure A1 in the Online Appendix). In line with the stimuli used in laboratory experiments, I use the number of persons displayed in the project profile picture shown in this grid as a measure of the (perceived) beneficiary group size. In lab studies that test the effect of the beneficiary group size on giving, the perceived beneficiary group size (i.e., how many people are depicted in the picture) usually corresponds with the actual beneficiary group size (i.e., the size of the group that will receive the donations; e.g., Garinther et al., 2022). However, in real-life donation requests, there is usually no direct correspondence between the size of the depicted beneficiary group (e.g., a poor child from Sudan) and the size of the group that benefits from the donation (poor Sudanese children, in this example). 1 Thus, in this work, I attempt to test whether fundraisers can raise more funds by manipulating the size of the perceived beneficiary group.
To identify the effect of the perceived beneficiary group size on the funds raised by a project, I control for confounders between the number of people depicted in a project profile picture and the amount of funds raised (i.e., the topic of a fundraising project). While the effects based on single countries show some heterogeneity, the models based on the pooled data from all countries show a consistent concave effect of the number of persons in the project profile picture on (a) the amount of funds raised by a project, (b) the total number of donations received by a project, and (c) the size of the average donation received by a project. While past studies did not report a concave effect, this discovery is backed by a reanalysis of the data from Garinther et al. (2022), which revealed that their data also shows a concave effect of the beneficiary group size on donations. Sensitivity analyses show that the linear effect is strongest when only projects that display a maximum of four persons in the project profile picture are included in the sample. This aligns with research showing that this is the threshold up to which humans can quickly and reliably judge visual numerosities (e.g., the number of persons in a picture). Robustness checks show that my results are unlikely to be driven by unobserved confounders (Oster, 2019).
My results have important implications for both theory and practice. Concerning theory, the concave effect found in this study’s data and the data by Garinther et al. (2022) indicates that factors that lead to the compassion fade effect in separate evaluation (i.e., between-subjects design) likely also influence decision-making in a joint evaluation setting (i.e., within-subjects design). My analyses also suggest that the effect could be driven by the humans’ ability to quickly and reliably judge visual numerosities. Regarding practice, fundraisers should carefully consider whether potential donors see only one donation request (separate evaluation) or whether they see multiple donation requests (joint evaluation) and adjust their fundraising material accordingly. When potential donors are in a joint evaluation context, showing a larger beneficiary group seems beneficial, but only up to a certain extent.
Literature Review
Compassion Fade
Compassion fade refers to a decrease in helping behavior (e.g., donating) as the number of individuals in need increases (Västfjäll et al., 2014). Studies on compassion fade typically find a negative relationship between the number of victims and helping behavior/intent (Cameron, 2017). For example, Västfjäll et al. (2014) found that participants on average donated more to one child (24.5 SEK) than to two children (21.5 SEK). In both groups, the children were identified by a short description and a picture. A meta-analysis by Butts et al. (2019) based on 41 studies found that the size of the beneficiary group negatively affected both helping intent and behavior (e.g., donations).
One prominent explanation of the compassion fade effect is that it is caused by numeracy limitations and biases in the basic affective processing underlying the decision to help (Hamilton & Sherman, 1996; Slovic, 2007). Butts et al. (2019) called this the affective bias perspective. According to this explanation, individuals are cognitively represented with greater vividness and coherence than groups, which in turn elicits stronger emotional reactions (Hamilton & Sherman, 1996). In contrast to a single victim, a group of victims constrains people’s capacity for attention and imagery (i.e., mental representation), which results in a fragmented representation of the victims and thus a weaker affective response (Dickert & Slovic, 2009; Kogut & Ritov, 2005a). For example, participants in Dickert and Slovic (2009) made sympathy judgments about a child target presented alone or as part of a group. They found that sympathy was lower when the child was presented as part of a group than when the child was presented alone.
The other prominent explanation postulates that people manage their emotions to maximize their personal goals while minimizing potential costs that may seem overwhelming (Butts et al., 2019; Cameron & Payne, 2011). As people anticipate feeling increased empathy and compassion with an increasing number of victims, they may have concerns about the potential monetary and psychological costs associated with expressing such compassion (Cameron et al., 2016). It could be that people expect helping multiple victims to be a more expensive or less efficacious expenditure (i.e., “drop in the bucket”; Cameron, 2017). Costs could also be psychological, as people might expect the need of the group to be emotionally exhausting or overwhelming (Cameron et al., 2016). This motivated choice perspective (Butts et al., 2019) aligns with the cost–reward model of helping (Dovidio et al., 1991) and past work on empathy avoidance (Shaw et al., 1994). This past work demonstrated that potential donors regulate their emotions to avoid feelings that necessitate helping when helping is foreseen as too costly. Evidence suggests that the motivated choice explanation is more plausible than the affective bias explanation (Butts et al., 2019; Cameron & Payne, 2011). The motivated choice explanation also aligns with recent evidence showing that people opt to avoid compassion when given the opportunity (Scheffer et al., 2022).
Studies on compassion fade almost exclusively used between-subjects designs where each participant sees only one donation request (Butts et al., 2019). The meta-analysis by Butts et al. (2019) explicitly excluded studies where participants saw multiple donation requests (i.e., within-subjects). The authors acknowledged this shortcoming by stating that between-subjects designs “do not adequately reflect the realistic settings in which people make donation decisions” (p. 27). The few studies that have used within-subjects designs have found inconsistent results (Butts et al., 2019). As mentioned by Garinther et al. (2022), only one of the studies replicated the compassion fade effect (Västfjäll et al., 2014, Study 2). The other studies either found comparable donations to different numbers of beneficiaries (Kogut & Ritov, 2005b) or were even able to reverse the compassion fade effect (Hsee, Zhang, Lu, & Zu, 2013; Kogut & Ritov, 2005b). Garinther et al. (2022) took the existing inconsistencies in the design and results of these studies as motivation to systematically study the compassion fade effect in within-subjects designs. Over multiple studies, the authors showed that when subjects saw multiple donation requests, either simultaneously or sequentially, they donated more to larger groups of beneficiaries.
The reversal of the compassion fade effect in within-subjects designs can be explained by how humans evaluate attributes of options when they see only one option (separate evaluation) as compared to when they can compare multiple options (joint evaluation; Erlandsson, 2021; Garinther et al., 2022). Research has shown that the effect of attributes that are difficult to evaluate on their own (e.g., the number of beneficiaries, Erlandsson, 2021) is less pronounced in separate evaluation (Hsee, 1996). The effect of the number of beneficiaries is, therefore, stronger in joint evaluation because it is easier to evaluate in this case and because it is high in justifiability (most people agree that [all else equal] helping more people is better than helping fewer people, Dickert et al., 2015; Erlandsson, 2021; X. Li & Hsee, 2019). In line with this Hsee, Zhang, Wang, & Zhang (2013) showed that the willed amount to (hypothetically) donate when one could save 200 rather than 100 polar bears was almost twice as high in joint evaluation (
The finding of a reversed compassion fade effect in joint evaluation conditions has important practical implications since it contradicts the compassion fade effect literature in a setting that “better mirror[s] real charitable giving contexts” (Butts et al., 2019, p. 27). Thus, in contrast to popular advice from compassion fade studies (Butts et al., 2019), fundraisers whose solicitations are evaluated jointly with other solicitations can potentially attract more donations by increasing the (perceived) size of the beneficiary group. If this recommendation is externally valid, we should observe the following:
Even though we have evidence for a reserved compassion fade effect in joint evaluation from lab studies, it is not clear whether this effect generalizes to the field (i.e., is externally valid). This is because the decision situation can vary in important ways between lab and field environments (Levitt & List, 2007). For example, many studies that tested compassion fade used hypothetical donation scenarios that are not incentivized (Dickert et al., 2015; Garinther et al., 2022). It is easy to say that you would double your donation when the number of beneficiaries doubles when this does not affect your expenses (i.e., cheap talk). Indeed, hypothetical evaluations typically lead to overstated evaluations (Camerer & Mobbs, 2017; Murphy et al., 2005). Evidence from Västfjäll et al. (2014) shows that this also applies to compassion fade. Västfjäll et al. (2014) asked two groups of participants how much they were willing to donate to either a single child or to two children (between-subjects design). In Study 1a, participants were asked to state how much of 70 SEK they would donate (hypothetically), whereas in Study 1b, participants received 70 SEK that they could donate. In the hypothetical donation study, participants donated 43.3% more to the single child (37.7 SEK vs. 26.3 SEK). In the real donation study, this difference was less than half (14%, 24.5 SEK vs. 21.5 SEK). Thus, studies that used hypothetical donation decisions probably overestimate the effect of the number of beneficiaries on the willingness to donate. Unfortunately, the study by Garinther et al. (2022) used such hypothetical donations as their dependent variable. The composition of the sample is another factor that often varies between lab and field studies. Most lab studies on compassion fade used student samples. Studies that compared students’ prosocial behavior to nonstudent samples typically found that students show lower levels of prosocial behavior than the general population (Cappelen et al., 2015; Falk et al., 2013). Finally, within-subjects design studies on compassion fade could be driven by experimenter demand effects. That is, participants could donate more to larger beneficiary groups because this is the norm (Dickert et al., 2015) and they might think that the experimenter expects them to follow this norm (De Quidt et al., 2018; Zizzo, 2010). This study circumvents these limitations by analyzing real donations made by a nonstudent sample.
Success Factors of Donation-Based Crowdfunding Campaigns
This section aims to briefly summarize what factors (beyond the size of the beneficiary group) influence the success of crowdfunding campaigns. The evidence presented in this section will inform the selection of control variables used in the analyses. This short review primarily draws on two excellent reviews by van Teunenbroek and Dalla Chiesa (2022) and van Teunenbroek et al. (2022). van Teunenbroek and Dalla Chiesa (2022) summarize motives that lead people to donate to crowdfunding campaigns. Many of the mechanisms that affect charitable giving in traditional contexts are also likely to play a role in crowdfunding campaigns (van Teunenbroek et al., 2022). Among these are altruism (Fehr & Fischbacher, 2003), the joy of giving (i.e., warm glow, Andreoni, 1990), and solicitation (van Teunenbroek & Hasanefendic, 2023). van Teunenbroek and Dalla Chiesa (2022) also mention feeling part of a community as a motive. Project backers cannot only donate but also comment on the project and share it on social media. Thus, donors can become part of a community by donating (Josefy et al., 2017). The narrative of a project, communicated, for example, through the project description, can also motivate donors to contribute (van Teunenbroek & Dalla Chiesa, 2022).
Campaign pictures also influence potential donors. As mentioned by van Teunenbroek and Dalla Chiesa (2022), Rhue and Robert (2018) found that campaigns that depict people with happy facial expressions raised more money than campaigns depicting people with neutral facial expressions. van Teunenbroek and Dalla Chiesa (2022) note that the crowdfunding environment is characterized by high uncertainty because of the information asymmetry between the donors and the project initiators. According to van Teunenbroek and Dalla Chiesa (2022), people use quality signals (e.g., the amount and quality of the information provided about the project) to guide their behavior in such situations (van Teunenbroek et al., 2020). Therefore, the perceived quality of a project is positively related to its funding success (Mollick, 2014; van Teunenbroek & Dalla Chiesa, 2022). Similarly, the number of campaign updates is positively related to campaign success (Mollick, 2014). As mentioned by van Teunenbroek and Dalla Chiesa (2022), the perceived credibility of the project initiator also feeds into the perceived quality of a project. For example, Hörisch (2015) found that projects initiated by an officially recognized nonprofit organization tend to be more successful.
With crowdfunding being an inherently online-based fundraising channel, social media plays an important role. Sharing a project on social media increases its visibility and therefore solicits potential donors (Bhati & McDonnell, 2020; Priante et al., 2022). Unsurprisingly, the number of social media shares is positively related to a project’s success (Kubo et al., 2021). Knowing how crowdfunding campaign factors affect the success of a campaign, we can now go on to discuss the identification strategy that I use to identify the effect of the perceived size of the beneficiary group on the amount of funds raised by a project.
Method
Data and Identification Strategy
I used data downloaded from GoFundMe to test the compassion fade effect in a real-life donation setting. Researchers have successfully used data from GoFundMe to study nonexperimenter-solicited charitable contributions in a real-world setting (Sisco & Weber, 2019). In March 2022, I downloaded over 60,000 fundraising projects from four countries (the United States, the United Kingdom, Australia, and Canada). When visiting GoFundMe.com, people see a grid of fundraising projects (see Figure A1 in the Online Appendix). This grid displays the most important information for each project. One can see the project’s location, the project profile picture, the title of the project and the first few words of the description, the target amount to be raised, the funds already raised, and when the last donation was made. Fundraising progress is visualized by a green progress bar. Although projects on GoFundMe have a target amount, GoFundMe follows a direct donation structure (van Teunenbroek et al., 2022) that allows initiators to keep the donated money regardless of whether the target was reached. Raising more than the target amount is also possible. By clicking on a project from the project overview page, one is forwarded to the project profile page. On this page, project creators can display more photos and videos and provide a detailed textual description of the project. From the project overview and profile pages, I downloaded the data I needed to test hypothesis 1 (see Table 1). The data was downloaded from the publicly accessible GoFundMe website using the R programming language. Each project belongs to a category (see Figure 1), and up to 1,000 projects can be downloaded per category.
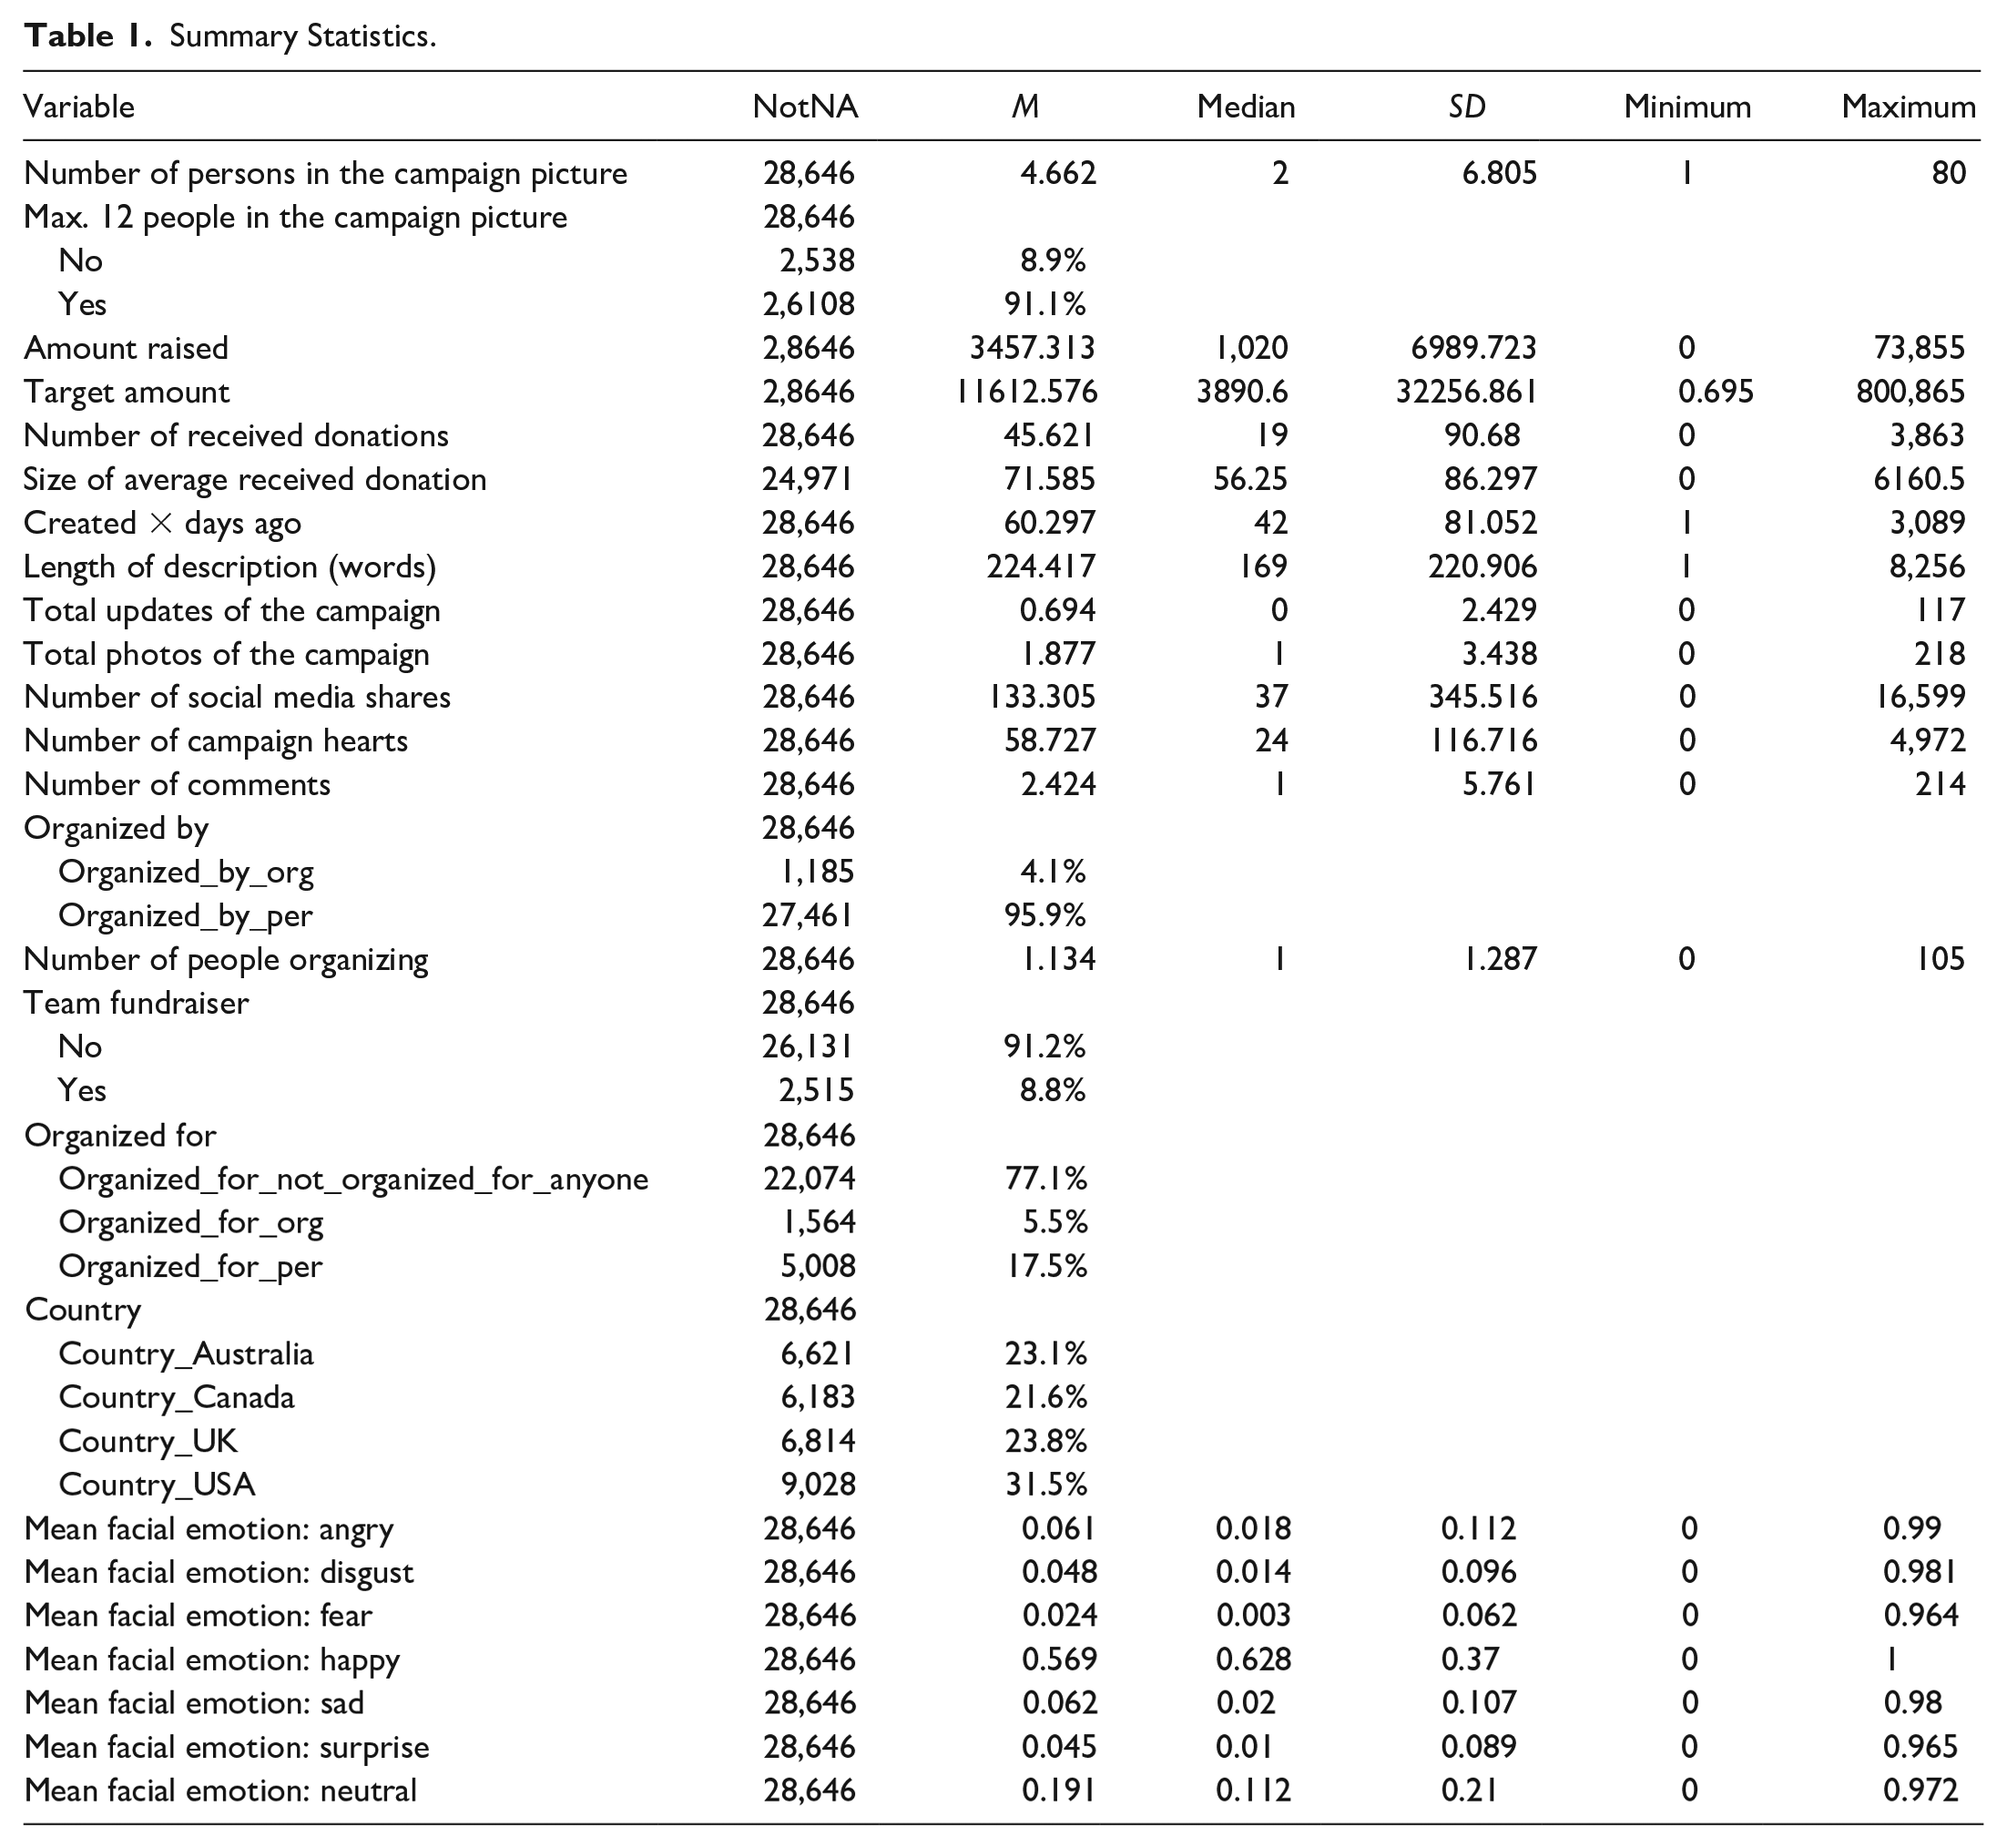
Summary Statistics.
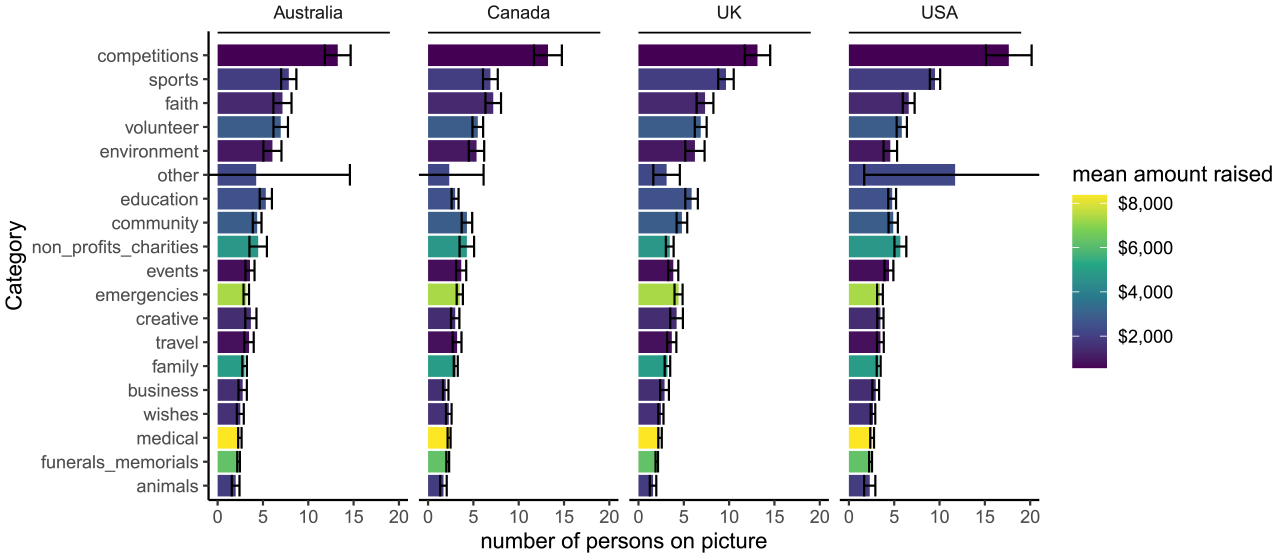
Mean Number of Persons in the Project Profile Picture by Project Category. Error Bars Represent 95% Confidence Intervals.
My identification strategy relies on the backdoor criterion. A set of variables Z satisfies the backdoor criterion relative to an ordered pair of variables (x, y) if (a) Z blocks every path between x and y that contains an arrow into x and (b) no node in Z is a descendant of x. In other words, the backdoor criterion ensures that the association between x and y is not spurious (i.e., caused by another variable that causes both x and y). Given our treatment variable (number of persons in a project profile picture) and our dependent variable (amount of funds raised), I assume that the topic of a fundraising campaign, which I measure with the campaign description text and the campaign category, satisfies the backdoor criterion. The campaign topic likely influences how many people are shown in the project profile picture and how much people will donate to the project (Figure 1). The directed acyclic graph (DAG; Rohrer, 2018) that visualizes this assumption is shown in Figure 2. I can directly control for the category of a campaign since each campaign is assigned to a category. To control for the campaign description text, I use natural language processing (NLP) methods to convert the text data to a numerical representation. There is a relatively new but growing stream of literature on using textual data as controls in statistical models (Keith et al., 2020). As mentioned by Keith et al. (2020), multiple ways of measuring confounders from text exist, such as lexicons, supervised classifiers, topic models, and embeddings. As I want to control for the overall topic of a project, I use the latter two methods. These methods inductively learn confounding factors to (ideally) account for all known and unknown aspects of the text (Keith et al., 2020). Topic models are generative probabilistic models that represent text as a mixture of latent topics (Roberts et al., 2014). Embeddings represent text as low-dimensional, dense vectors that encode the meaning of the text. These numerical text representations are then used in place of the confounder (the topic of the campaign) in a causal adjustment method (e.g., linear regression; Keith et al., 2020). As our identification strategy crucially depends on our ability to measure the confounders from text, I use multiple text representation methods. Namely, I use topic models (Roberts et al., 2014) and document embeddings (Le & Mikolov, 2014). This approach allows us to see how sensitive our estimates are to different text representations. Because these models cannot deal with multiple languages, I removed all projects with non-English descriptions from the sample. I describe these methods in more detail in the Online Appendix.
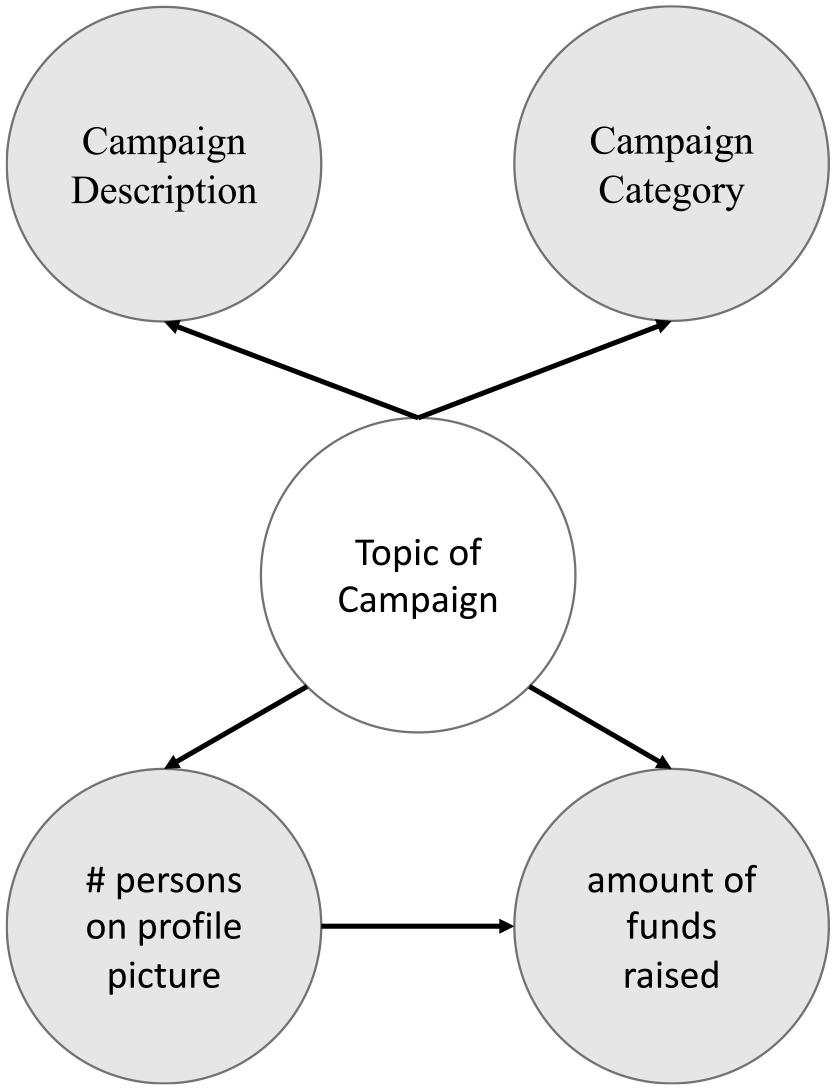
Directed Acyclic Graph (DAG) Showing How I Use the Campaign Category and Campaign Description to Control for Confounding Between the Number of Persons on a Project Profile Picture and the Amount of Funds Raised by the Project.
Because the results of Garinther et al. (2022) depend on people being in a joint evaluation context, my identification strategy also needs to make sure that I control for the number of people who donated to a project without browsing other projects before (these would be in a separate and not in a joint evaluation condition). Research on crowdfunding suggests that almost half of the people who donated via crowdfunding were asked to do so (47%; van Teunenbroek & Hasanefendic, 2023). Among these, most were asked via social media (58%; van Teunenbroek & Hasanefendic, 2023). This reveals that the number of times a project was shared on social media is a good proxy for how many people donated to a project without browsing other projects before (and thus not being in a joint evaluation condition).
Web traffic analytics data can also be used to gain insights into GoFundMe visitors’ browsing behavior. Similarweb is a company that provides such data. The advantage of this data is that it directly reflects the browsing behavior of people who access GoFundMe. According to Similarweb’s freely available data based on traffic between June 2023 and August 2023 (Similarweb, 2023), 44.5% of the traffic on GoFundMe was “direct” traffic. According to Similarweb, direct traffic refers to “traffic sent from users that directly entered a URL into a browser saved bookmarks or any links from outside the browser (such as on Microsoft Word).” This could be traffic from people who directly visit GoFundMe by typing the URL into the browser or traffic from sources that do not allow tracking from where the user is accessing (e.g., a link in a document). A further 24.6% is traffic from “social” channels. According to Similarweb, this is “traffic sent from social media sites such as Facebook or Reddit (organic and paid).” The last big share of traffic comes from organic search (21.6%). According to Similarweb, this refers to “traffic sent via organic (nonpaid) results on search engines such as Google.”
So according to the data by van Teunenbroek and Hasanefendic (2023), more than half of the people who donate via crowdfunding do this without being asked to do so. It is very plausible to assume that these people browsed other projects before donating, as directly accessing a project without browsing other projects is only possible if you know the link to the project. The data by van Teunenbroek and Hasanefendic (2023) also reveal that social media shares are a good proxy to control for the share of people who donated without browsing other projects before, as more than 50% who were asked to donate and donated were asked via social media. The importance of social media is also reflected in the GoFundMe-specific data from Similarweb, as a quarter of the traffic comes from this channel. However, it is important to note that one can also be asked to donate to a crowdfunding project through channels other than social media (e.g., text message, e-mail). A quarter of the people who donated in the sample of van Teunenbroek and Hasanefendic (2023) were asked to donate via these channels. So controlling for the number of times a project was shared on social media is a good, but not perfect, proxy for the share of people who donated to a project without browsing other projects before. This means that I likely underestimate the effect of the size of the beneficiary group on the amount of funds raised since I cannot perfectly control for the share of people who are not in a joint evaluation condition (and for whom the effect of the size of the beneficiary group on the amount they donate should thus be negative, Butts et al., 2019).
Control Variables
As just mentioned, I use the category of a fundraising project and the project description to identify the effect of the perceived size of the beneficiary group on the amount of funds raised (i.e., to control for confounding). However, there are other variables that, although they are not confounders, can increase the precision of the estimate of interest (Cinelli et al., 2022). The section on the “success factors of donation-based crowdfunding campaigns” motivates and informs the selection of these variables. Although the effects of these variables on campaign success were already discussed, I still briefly state the reason for inclusion when presenting the control variables. I include the total photos of a fundraising project, the number of updates posted, and the length of the project description as control variables because studies have found that better-documented projects raise more money (Wu et al., 2022). I also control for whether the fundraiser is organized by an organization or by people, whether it is a team fundraiser or not, and how many people are organizing the fundraiser. I include these controls because these variables likely affect the sharing of the fundraiser, which increases the visibility of the fundraiser and thus likely also the amount of funds raised (Kubo et al., 2021). For the same reason, I also created variables that control for whether the fundraiser was organized for anyone or not and if so whether it was organized for another person or to benefit an organization. I use the state-of-the-art named entity recognition model “ner-english” provided by the flair Python library to do this (Akbik et al., 2018).
To control for the popularity of the fundraiser, I include the number of times the fundraiser was shared on social media, the number of hearts (i.e., likes) the fundraiser collected, and the number of comments made on the fundraiser project page as control variables. These variables likely affect the fundraiser’s visibility, which should affect the amount of funds raised. Some of these control variables are also included to ensure that I control for the number of people who directly visit a fundraising project without browsing other projects beforehand (e.g., the number of people organizing the fundraiser and the number of social media shares).
The target amount is also included as a control as it has been shown to be associated with campaign success (Mollick, 2014). For obvious reasons, I also control for the days that passed since the project launched. Finally, I also control for the emotions displayed by the people depicted in the project profile photo. I do this because the facial expressions of beneficiaries have been shown to affect giving behavior (Rhue & Robert, 2018; Small & Verrochi, 2009).
When considering which controls to include, one must make sure that no “bad” controls are included (Cinelli et al., 2022). Colliders are an example of such bad controls. Conditioning on a collider, that is, a common effect of the exposure and outcome, leads to a noncausal association between the exposure and the outcome (Cinelli et al., 2022; Hünermund et al., 2021). In my case, the “social” variables (number of social media shares, number of comments, and number of campaign hearts) could be such collider variables. People could share the fundraiser on social media, like, or comment because they are depicted in the fundraiser’s project profile picture. Making a donation could also lead people to do these same things, which could make these variables serve as colliders between the number of people depicted in the project profile picture and the amount of funds raised. I, therefore, also fit the regression models without these three variables as controls (see Online Appendix). However, I think including these variables for the above reasons is more important, which is why these variables are included by default. Moreover, the results for the models without these variables are very similar to those with these variables. In fact, the effect of the number of persons in the project profile picture is even stronger when not controlling for these variables. Because the estimated effects of these control variables are unlikely to have a causal interpretation, I only report them for the most important models in the Online Appendix (Hünermund & Louw, 2020; Westreich & Greenland, 2013).
Inference Methods
To estimate the effect of the number of persons in a campaign profile picture, I mainly rely on regression models and use double machine-learning to assess the robustness of the results. I use double machine-learning (Chernozhukov et al., 2017) as a robustness check because it allows us to control for confounders in a flexible (i.e., nonlinear) way. To achieve this, double machine-learning uses machine-learning algorithms to predict the response and the treatment from the control variables. The residuals of these two prediction problems are then regressed onto each other to obtain the estimate of interest. Because machine-learning algorithms (e.g., random forests) are inherently nonlinear, this method allows to control for control variables in a flexible (i.e., nonlinear) way without explicitly specifying the nonlinearity (as one would have to do when using, for example, ordinary least square [OLS] regression).
Person and Facial Emotion Detection
Given the large number of project profile pictures, I rely on machine-learning algorithms to detect the number of persons in a project profile picture and the facial expressions shown by these people. The state-of-the-art algorithms for these tasks are as good or even better than human raters while being significantly faster. To detect the number of persons in a project profile picture, I used a Faster R-CNN model (Ren et al., 2015) that was trained to detect persons in the COCO dataset (Lin et al., 2014). I implemented the model using the mmdetection Python library (Chen et al., 2019). More information regarding this model is provided in the Online Appendix.
To detect the facial emotions expressed by the people in the project profile picture, I used a model that was considered state of the art in facial expression detection at the time of performing the analysis (Savchenko, 2021). I use the hsemotion Python library to detect expressed facial emotions with this model. For each detected face, this model returns the probability that this face shows emotion x for seven emotions (angry, disgust, fear, happiness, sadness, surprise, and neutral). I take the mean per emotion when multiple faces are detected to obtain one value per project profile picture.
Fitted Models and Preprocessing
To ensure that the results are not driven by outliers, I followed previous literature that used data from GoFundMe (Sisco & Weber, 2019) and removed projects that raised more than the mean plus 3 SD per country. The analyses conducted on the full sample are reported in the Online Appendix. The results for the models with outliers are similar to those without outliers but tend to have larger standard errors. To account for heteroscedasticity, heteroskedasticity-consistent standard errors (HC1) were used. To ensure comparability to Garinther et al. (2022), I ran the analysis once for all projects and once only for projects with 12 or fewer people in the project profile picture. This approach also increases the comparability with other studies; M.-R. Li and Yin (2022) found that in studies that showed participants pictures of beneficiaries, showing eight beneficiaries was the most frequent approach. Given the effect of facial emotional expressions on giving (Rhue & Robert, 2018; Small & Verrochi, 2009) and given that studies conducted in the lab usually have at least one person in the solicitation picture, I restricted the analysis to projects where at least one face was detected in the project profile picture.
I fit models that identify the effect of the number of persons in the project picture on (a) the amount of funds raised by a project, (b) the total number of donations received by a project, and (c) the size of the average donation received by a project. The effect on the amount of funds raised is arguably a combination of the other two effects. The analyses of the effect on the total number of donations and on the average received donations isolate the effect on the extensive margin (how many people donated) and the intensive margin (how much they donated), respectively. Most studies on compassion fade (including Garinther et al., 2022) studied the effect on the intensive margin. So the effect on the size of the average donation is the closest extension of the Garinther et al. (2022) study to the GoFundMe setting. Because the effect of the number of people who donated cancels out in the analysis of the average donation, it is also the methodologically most robust analysis.
This is because I cannot perfectly control for the number of persons who received an ask to donate to the project. The social media shares that I use as a proxy to control for this do not control, for example, offline asks. It is reasonable to expect that more people receive an ask to donate to a project as the number of persons in the project profile picture increases. This leads to these projects raising more funds, but not through the channel we are (mainly) interested in (size of the donations received). As the effect of the number of people who donated cancels out when analyzing the size of the average donation, analyzing the average donation isolates the effect of the number of persons in the project picture on the size of the donations made. Of course, it could be that projects with more people in the project profile picture also attract more donations from donors who have not been asked to donate, but the data does not allow me to cleanly isolate this effect (due to the likely confounding with unobserved [i.e., offline] asks).
Results
Descriptive Results
The data without outliers contain 28,646 fundraising projects without any missing data in the variables listed in Table 1. This table also contains summary statistics for all of these variables. On average, these projects raised $3,457 (SD = $6,990), received 45.6 donations (SD = 90.7), and received an average donation of $71.6 (SD = $86.3). There are on average 4.6 persons depicted in the project profile picture, with a standard deviation of 6.8 persons. Only a few projects (8.9%) have more than 12 persons in the project profile picture (Figure 1). The majority of projects are thus comparable to the experimental literature with regard to the number of persons shown in the donation request (M.-R. Li & Yin, 2022). The mean facial emotions expressed in the project profile pictures are mostly happy and neutral. The Online Appendix shows the values in Table 1 for the full sample (i.e., with outliers). As I consider projects that raised more than the mean plus 3 SD per country as outliers, 445 (1.6%) of the projects were excluded from the sample.
Effect of the Perceived Size of the Beneficiary Group on Funds Raised
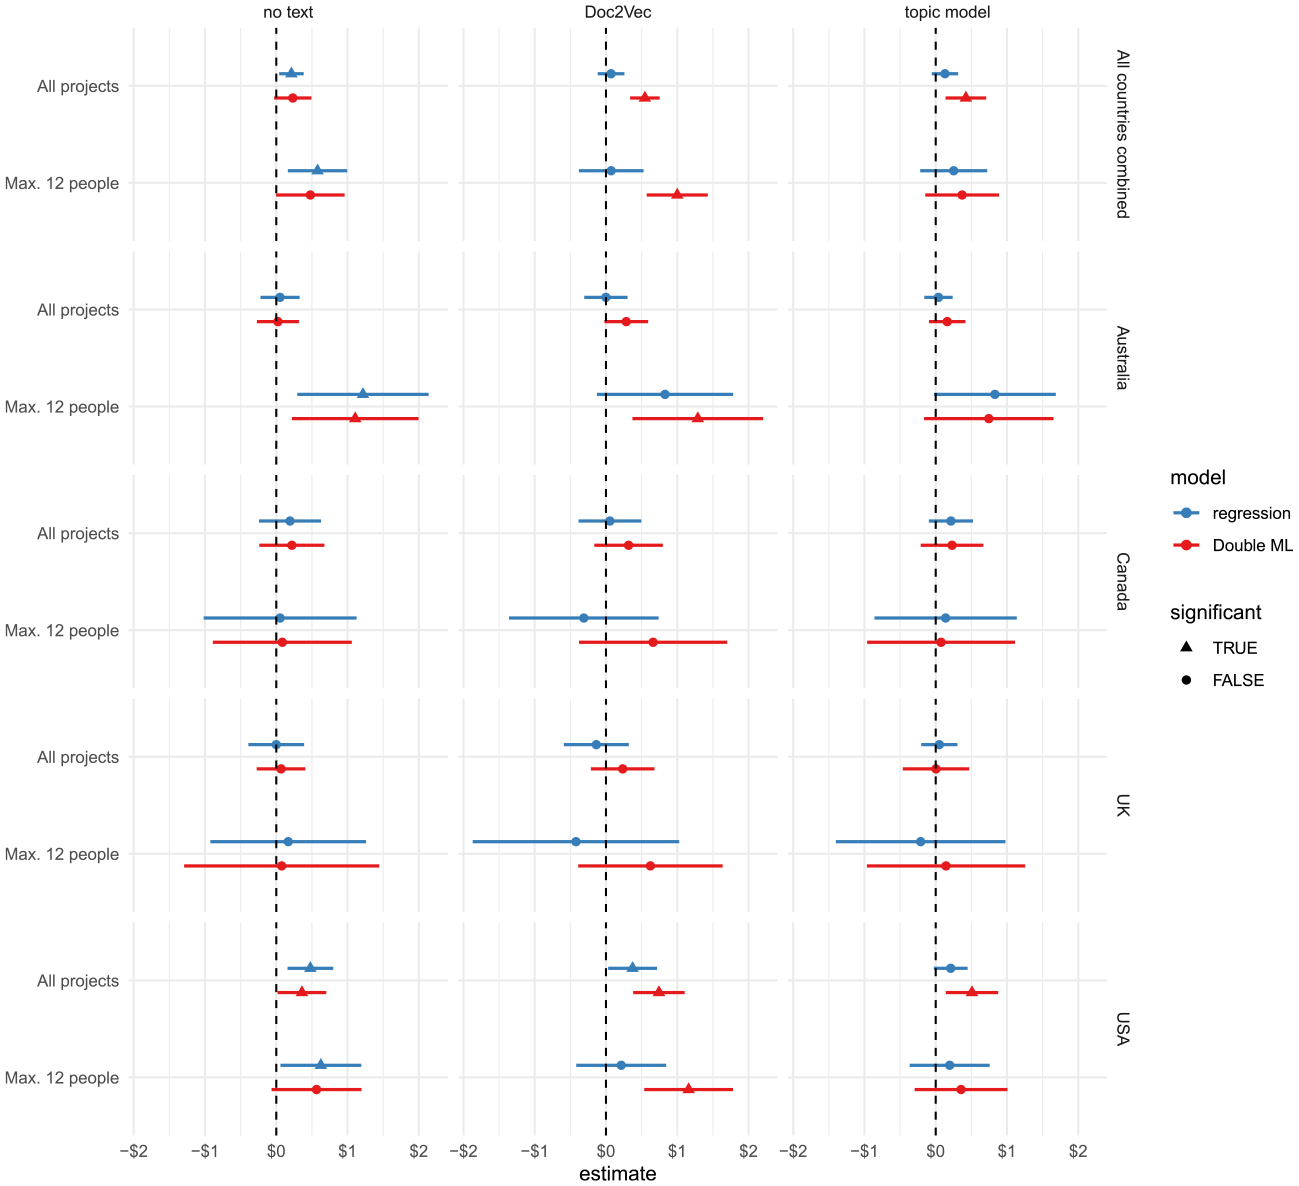
Figure 3 shows the effect of the number of persons in a project’s profile picture on the amount of funds raised by a project. For each country, text control method, and subset of data, two models are fitted (one double machine-learning model and one regression model). Regarding the results that consider all projects (top row for each country panel), the models based on the pooled data from all countries indicate a significant positive effect, which is not the case for most models based on data from individual countries. In most cases, the regression- and double machine-learning models reach the same qualitative (i.e., sign and significance) conclusion.
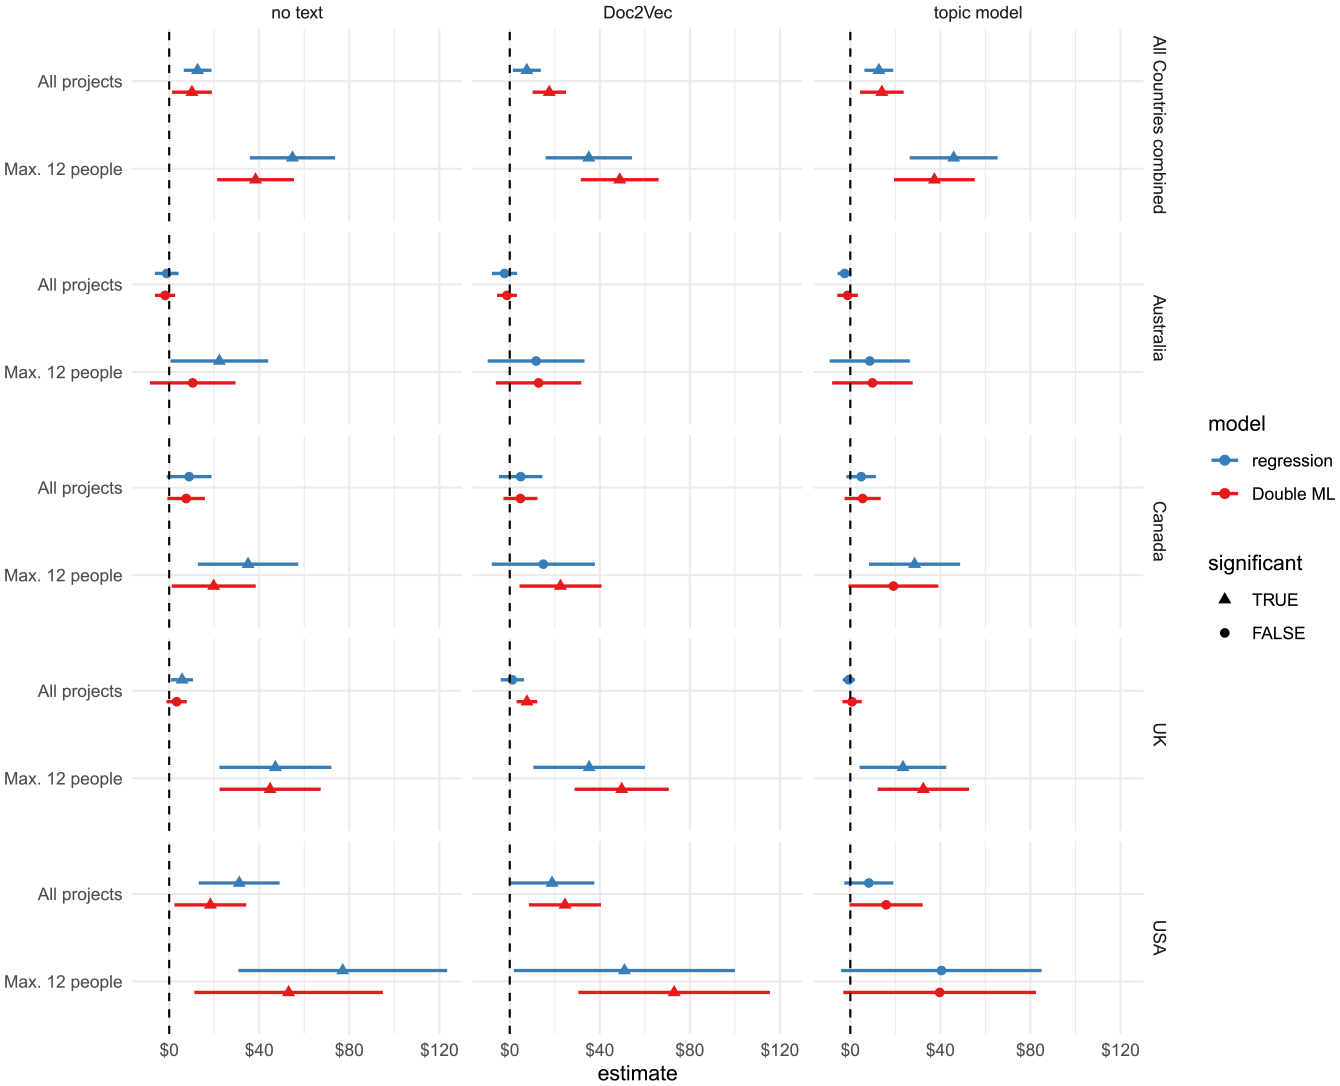
Effect of the Number of Persons in a Project’s Profile Picture on the Amount of Funds Raised. Error Bars Denote 95% Confidence Intervals.
Restricting the analysis to projects that show no more than 12 people in the project profile picture increases the effect of the number of people in the picture on the amount of funds raised across all countries. For most countries and models, the estimates show that an additional person in the project profile picture leads to an increase in the amount of funds raised of approximately $25. Overall, these results suggest a small, but not consistent, effect of the number of persons in the project profile picture on the amount of funds raised. The positive effect is most consistent for the subset of projects with at most 12 people in the project profile picture. Most importantly, not one of the estimates of the fitted models shown in Figure 3 indicates a significant negative effect of the number of persons in the project profile picture on the amount of funds raised.
The fact that models with projects that have at most 12 people in the picture show larger effects could indicate a nonlinear (i.e., concave) effect of the number of people in a project profile picture on the amount of funds raised. I, therefore, also fit the models shown in Figure 3 with a quadratic effect of the number of persons in a project’s profile picture. I only use ordinary least squares regression to fit these models because the results of the regression and double machine-learning estimates are very similar.
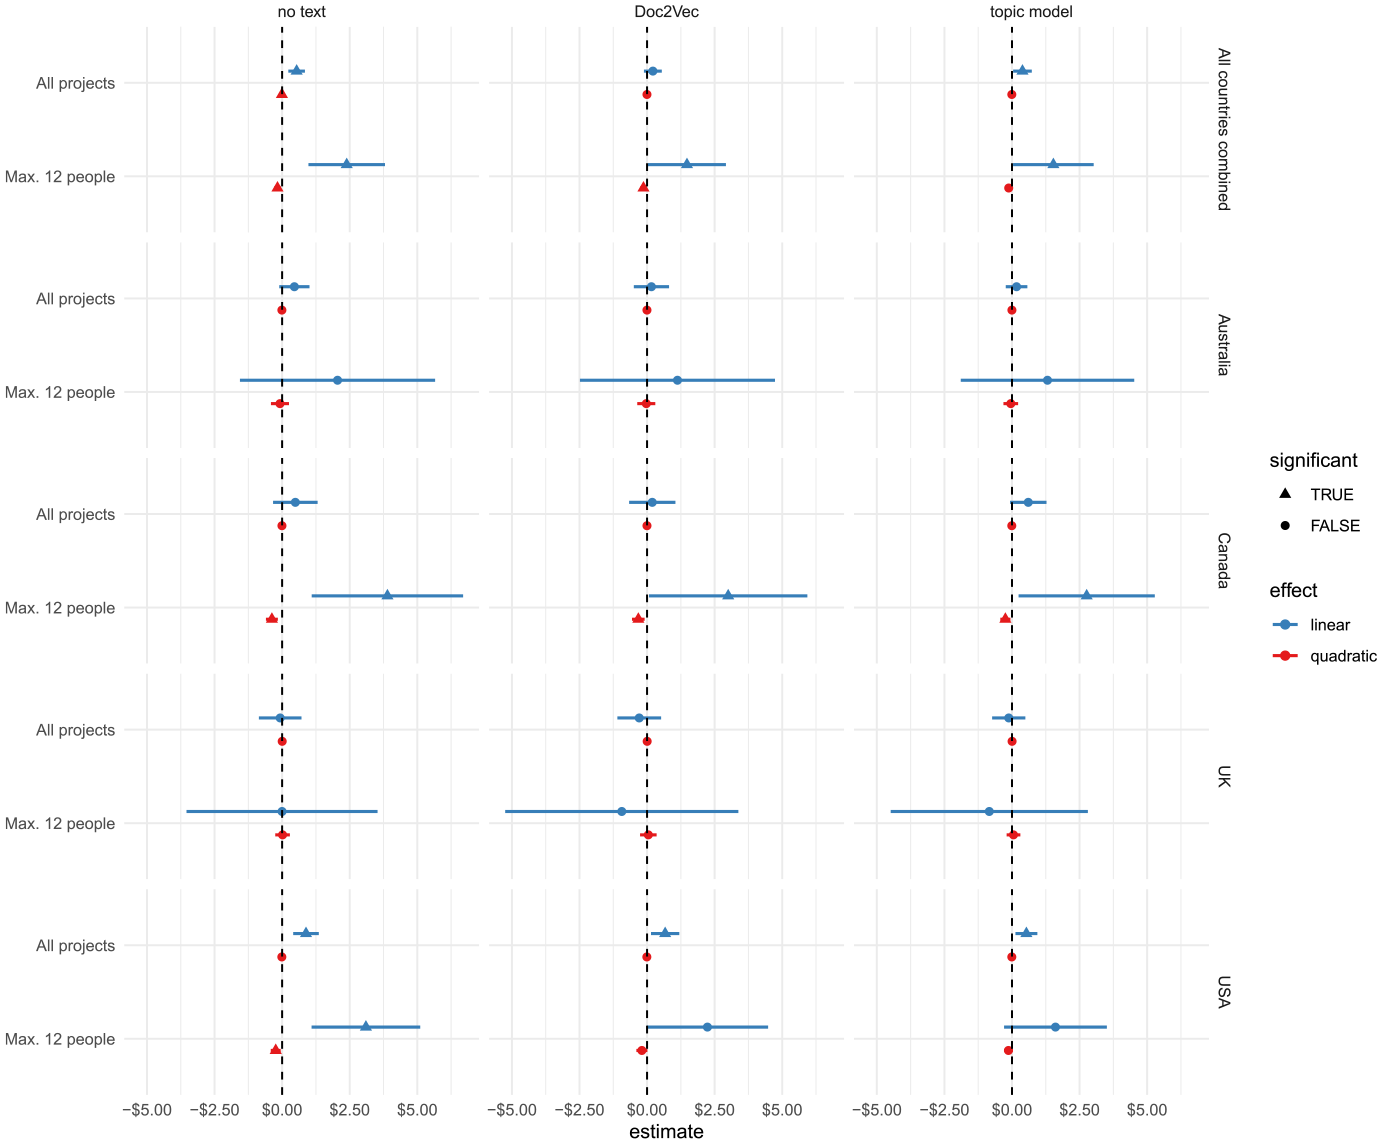
Figure 4 shows the results of the same models as those in Figure 3, but it includes an additional quadratic term for the number of persons in a project profile picture. In most models, the quadratic term has a small but significant negative effect. Compared to Figure 3, the linear effect of the number of persons in the project profile picture seems to be larger. Indeed, there is now a significant positive linear effect for the models with at most 12 people in the picture for all countries except the United Kingdom (although U.K. projects showed a significant linear effect in the absence of a quadratic effect; see Figure 3). According to these models, the effect of an additional person in the project profile picture on the amount of funds raised is considerable (approximately $100 for projects in Australia and Canada and around $300 for projects in the United States).
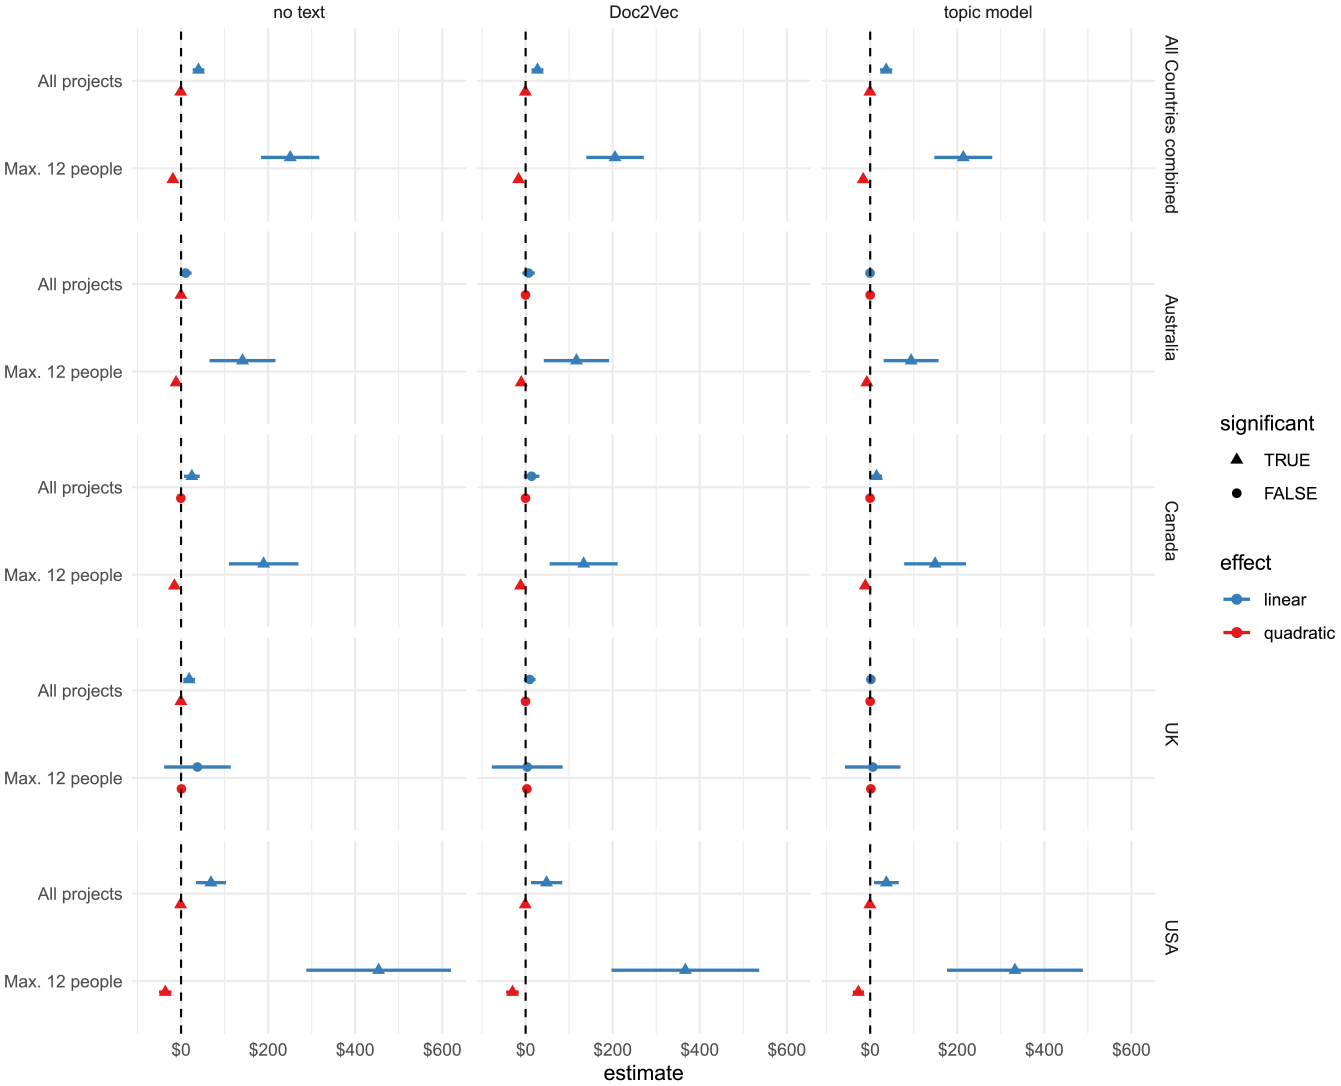
Linear and Nonlinear Effect of the Number of Persons in a Project’s Profile Picture on the Amount of Funds Raised. Error Bars Denote 95% Confidence Intervals.
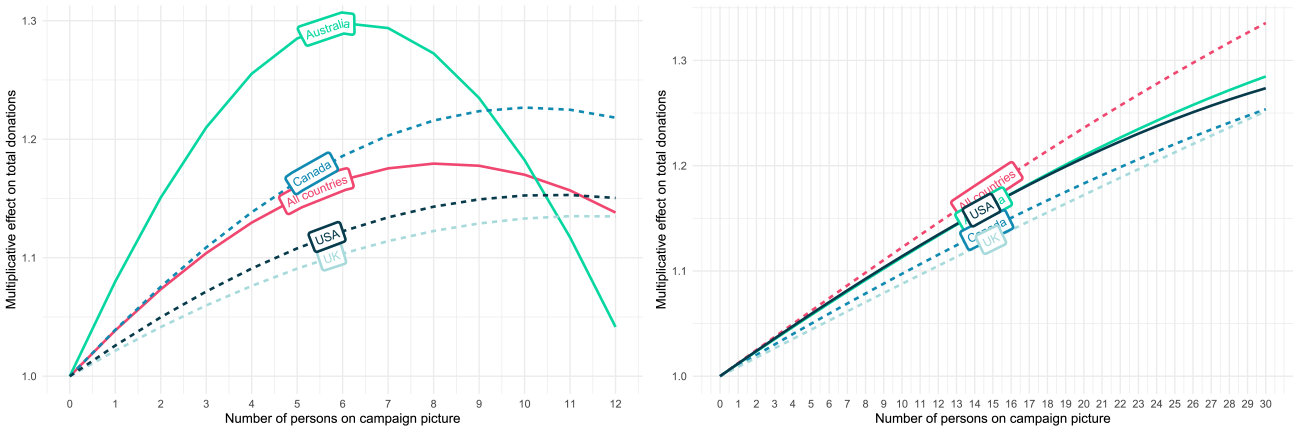
Figure 5 plots the nonlinear effect of the number of persons in the campaign picture on the amount of funds raised. While the strength of the concave effect differs across countries, the effect reaches its maximum between around five to seven persons for all countries except the United Kingdom for the models fitted on projects with a maximum of 12 people. The positive (concave) effect of the number of persons in the project picture on the amount of funds raised by a project could be caused by two things. First, it could be that these projects attract more donations. That is, potential donors choose these projects to donate to instead of other projects. Second, it could be that people donate higher amounts to projects with a larger group of beneficiaries. I will investigate both of these channels in the following two subsections.
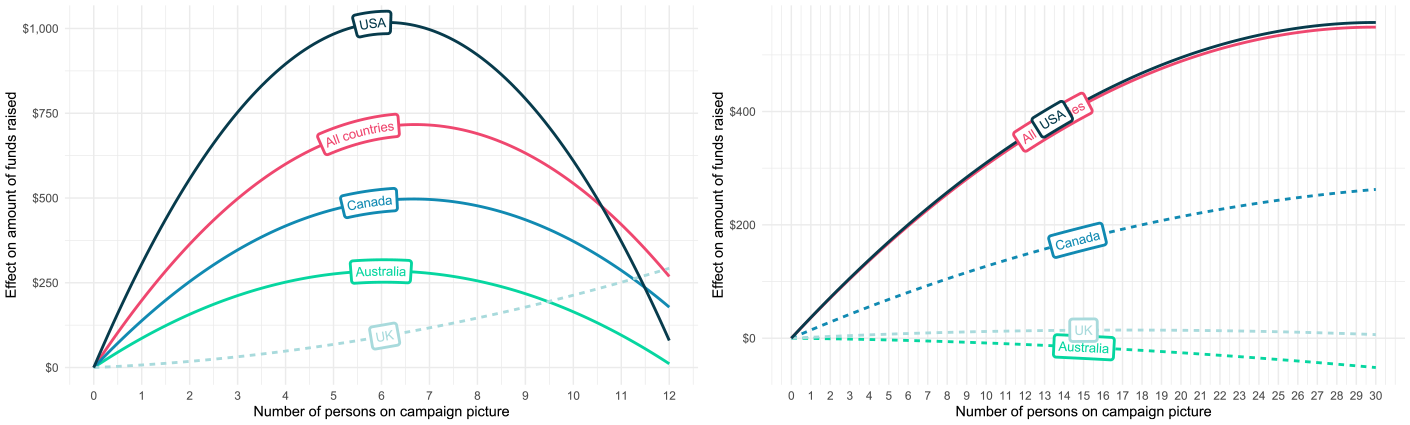
Visualization of the Effect of the Number of Persons in a Project’s Profile Picture on the Amount of Funds Raised. Estimates Based on the Topic Model Regressions (Figure 4). The Effects of the Models Where Both the Linear and Quadratic Effects Were Significant Are Represented as Solid Lines. In Contrast to the Plot on the Right, Only Projects With a Maximum of 12 Persons in the Picture Were Used to Fit the Models in the Left Plot.
Effect of the Perceived Size of the Beneficiary Group on the Number of Donations
Figure 6 shows the linear effect of an additional person in the project profile picture on the number of donations a project received. The effect is obtained from a Poisson regression model, and there is no double machine-learning estimate because it is not possible to fit these models with a Poisson distributed dependent variable. For most countries and models, increasing the beneficiary group size by one person increases the expected number of donations by about 1%. Adding a quadratic term (Figure 7) increases the size of the linear effect, especially for the models fitted on the subgroup of projects with at most 12 people in the picture. According to the model with the pooled data across all countries, increasing the beneficiary group size by one person increases the expected number of donations by about 3%. However, due to the negative quadratic effect, the strength of the positive association diminishes as the number of persons in the project picture increases (see Figure 8).
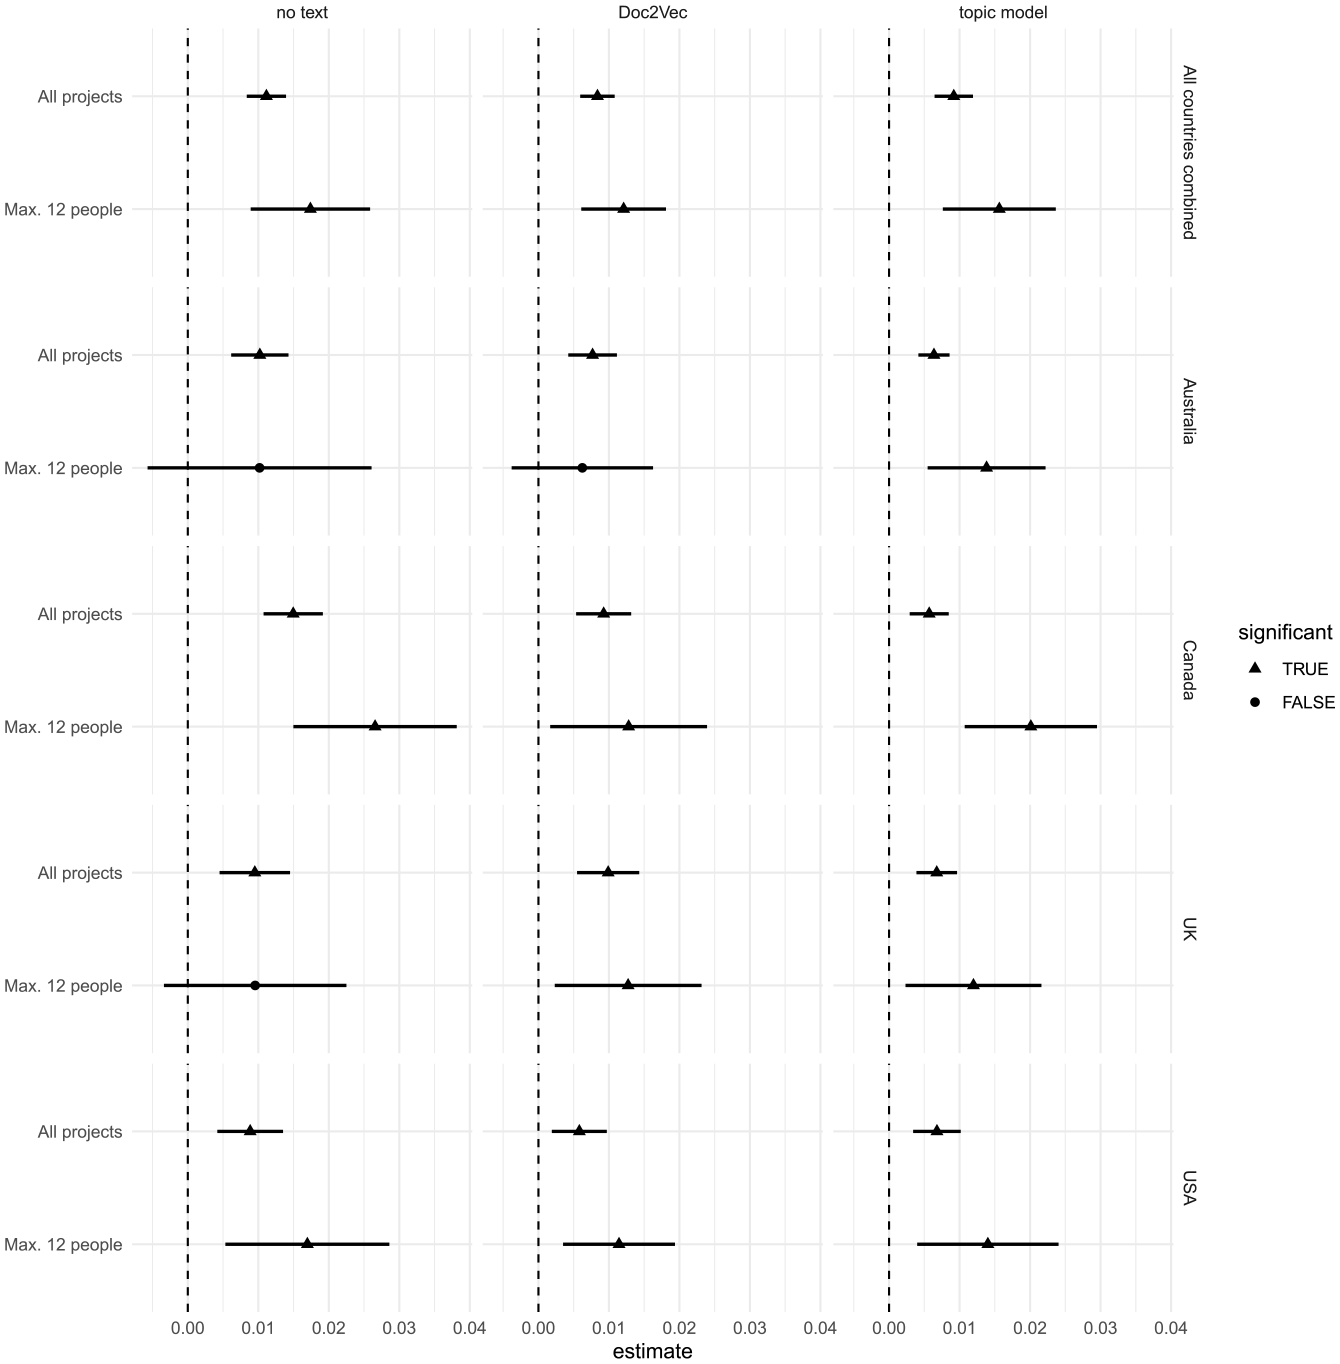
Linear Effect of the Number of Persons in a Project’s Profile Picture on the Number of Donations. Error Bars Denote 95% Confidence Intervals.
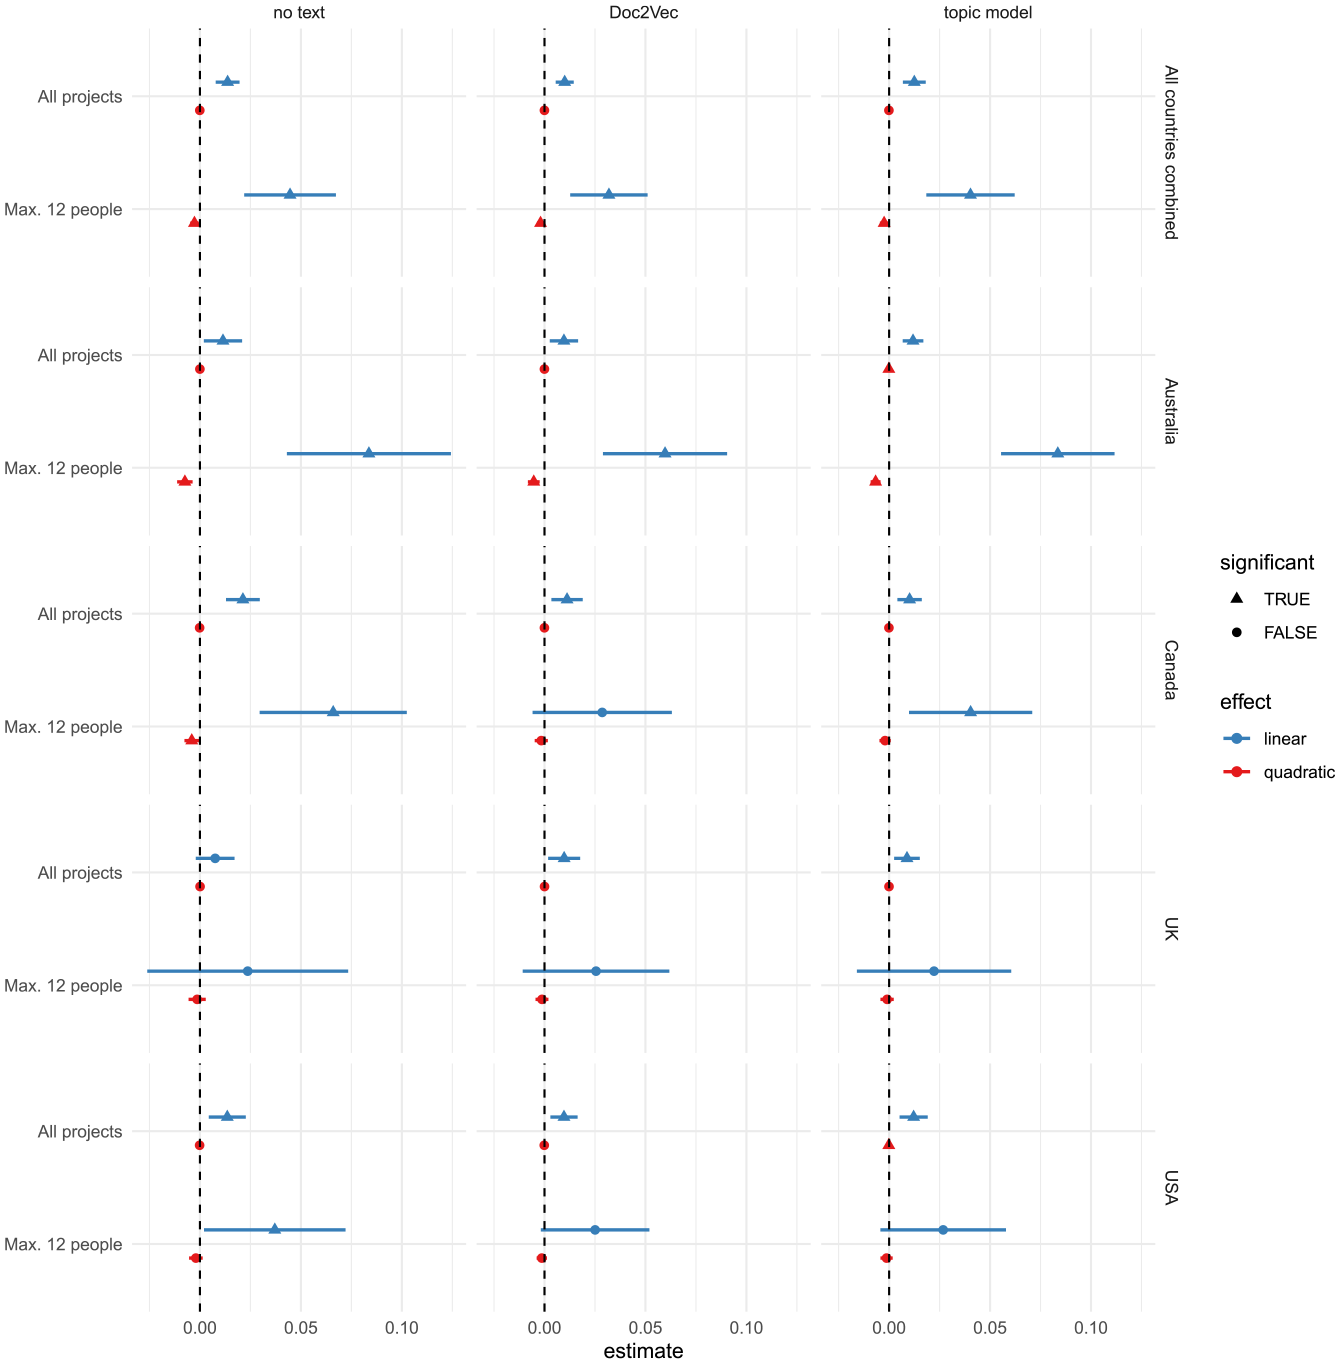
Linear and Quadratic Effect of the Number of Persons in a Project’s Profile Picture on the Number of Donations. Error Bars Denote 95% Confidence Intervals.
Visualization of the Effect of the Number of Persons in a Project’s Profile Picture on the Number of Donations. Estimates Based on the Topic Model Regressions (Figure 7). The Effects of the Models Where Both the Linear and Quadratic Effects Were Significant Are Represented as Solid Lines. In Contrast to the Plot on the Right, Only Projects With a Maximum of 12 Persons in the Picture Were Used to Fit the Models in the Left Plot.
Effect of the Perceived Size of the Beneficiary Group on the Average Donation
To test whether the size of the beneficiary group also affects the size of the donations made to the crowdfunding projects, I use a project’s average donation as the dependent variable. Figure 9 shows the linear effect of an additional person in the project picture on the average donation received by a project, fitted with regression and double machine-learning models. The estimates from the double machine-learning models fitted on the pooled data from all countries indicate that an additional person in the profile picture leads to an increase in the average received donation of about $0.5. Adding a quadratic effect increases the size of this linear effect to around $2 for the models with the pooled data (and a maximum of 12 people in the picture), but there is heterogeneity across countries (Figure 10). Since the linear effect is not constant due to the presence of the quadratic term, Figure 11 plots the resulting concave effect of the number of persons in the project picture on the average donation received per project. For the model fitted on projects with a maximum of 12 people in the picture and the pooled data from all countries, the effect of an additional person in the project picture on the average donation a project receives increases until there are six persons in the picture. Figure 11 also shows the effect identified by Garinther et al. (2022). Interestingly, the effects identified by Garinther et al. (2022) are very similar to those found for projects in the United States, which is the country that Garinther et al. (2022) recruited subjects. For both the data presented in this study (maximum of 12-person model) and the data by Garinther et al. (2022), the models indicate an increase in the average donation received by a project of about $4 when going from zero to six persons in the project picture. This is quite a substantial effect given the average donation of $72 (Table 1).
Effect of the Number of Persons in a Project’s Profile Picture on the Average Donation. Error Bars Denote 95% Confidence Intervals.
Linear and Quadratic Effect of the Number of Persons in a Project’s Profile Picture on the Average Donation. Error Bars Denote 95% Confidence Intervals.
Visualization of the Effect of the Number of Persons in a Project’s Profile Picture on the Average Donation. Estimates Based on the Topic Model Regressions (Figure 10). The Effects of the Models Where Both the Linear and Quadratic Effects Were Significant Are Represented as Solid Lines. In Contrast to the Plot on the Right, Only Projects With a Maximum of 12 Persons in the Picture Were Used to Fit the Models in the Left Plot.
Sensitivity Analysis
It is quite surprising that the effects of the number of persons in the project picture differ so much between models that were fitted on the full sample and models that were fitted on the subset of projects with a maximum of 12 people in the project picture. Beyond following Garinther et al. (2022), there was no theoretical rationale for using 12 as the cutoff. I, therefore, analyzed how sensitive the estimates are to this threshold. For the three dependent variables (amount of funds raised, number of donations, and average donation), I analyzed how the effect of the number of people in the picture changes as a function of the maximum number of persons in the project picture present in the sample. I started with a threshold of three, meaning only projects with a maximum of three persons in the picture were considered for fitting the model, increasing by increments of one person all the way up to a maximum of 30 persons (x-axis in Figure 12). The models that only include a linear term show an exponential decay in the effect of the number of persons in the picture that asymptotically converges to a small effect for all three dependent variables (but not asymptotically significant for the effect on the average donation). The effects are not very sensitive around the threshold of 12 persons but quite sensitive for smaller numbers (i.e., 3–8 persons). For all three dependent variables, the maximum effect is achieved when only projects with no more than four people in the project picture are considered. For the models that also include a quadratic effect, the linear effect only starts to positively affect the dependent variable once projects with six to seven people are also included in the sample.
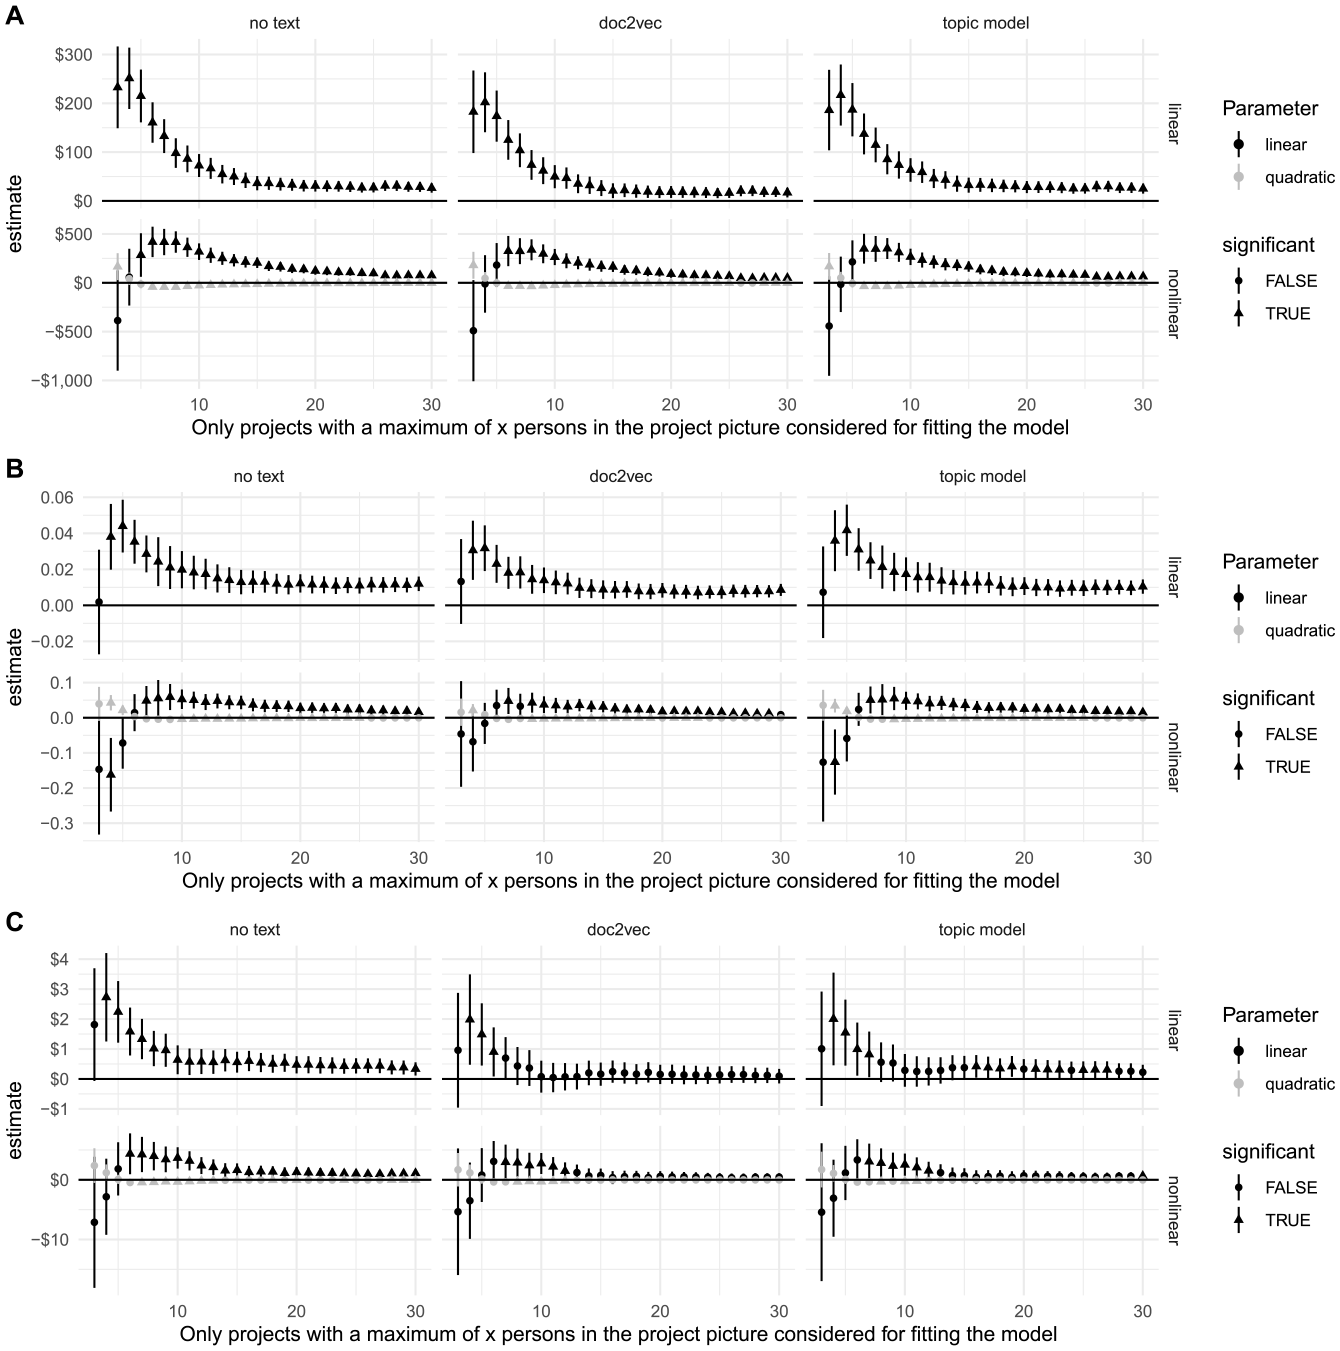
Sensitivity Analysis Concerning the Maximum Number of Persons in the Project Picture Present in the Sample. Error Bars Denote 95% Confidence Intervals. (A) Effect on the Amount of Funds Raised. (B) Effect on the Number of Donations. (C) Effect on the Average Donation.
This sensitivity analysis reinforces the results from the previous analyses, namely that the effect is weaker for projects with more than around six persons in the picture (Figure 11). The results from the linear models of the sensitivity analysis show that the sweet spot may be even lower, with the linear effect reaching a maximum when only projects with a maximum of four persons in the project picture are considered. It could be that projects with more than this number of persons in the picture are about a different kind of ask (that my methods to control for this don’t catch). However, this does not explain the gradual decline of the effect as the number of persons in the picture increases. A more plausible explanation for this pattern can be found in the human’s ability to quickly form judgments about the numerical quantity of objects (e.g., persons in a picture). The classical results show that the enumeration time is almost constant when the number of elements is up to four, but it increases sharply as the number of displayed elements increases (Balakrishnan & Ashby, 1991; Mandler & Shebo, 1982). Enumeration for up to four display elements is so fast that it has been referred to as a unique numerical ability called “subitizing” (Kaufman et al., 1949). A more recent study found that error rates were almost zero for numerosities 1 through 4 but began to rise steeply once more than four elements were presented (Revkin et al., 2008). This study also showed that both error rates and response times were significantly lower in the range from 1 through 8 than in the range from 10 through 80 (Revkin et al., 2008). These results align nicely with the pattern revealed by the sensitivity analysis. One could argue that instead of needing to know the exact number of persons in a project picture, people who browse GoFundMe projects just need to be able to judge which of two projects has more people in the project picture. Such judgments can quickly and accurately be formed if the difference between the two numerosities is large enough (around 30%, Anobile et al., 2014; Ross, 2003). The problem is that this is hardly the case with the GoFundMe pictures, as the variation in number of persons depicted per category is rather small (Figure 1). It is thus unlikely that the number of persons in the project picture varies by more than 30% within categories, which is the ratio needed for fast and reliable numerosity discrimination (Anobile et al., 2014; Ross, 2003). This is even more the case as the average number of persons in the picture per category increases, which is again consistent with the pattern revealed in the sensitivity analysis.
Robustness Checks
To further check the robustness of the results, I applied the method by Oster (2019) to assess omitted variable bias. The estimator constructed by Oster (2019) estimates the degree of selection on unobservables relative to observables (δ) needed for the true effect to go to zero. For the models shown in Figure 4 (effect on the amount of funds raised), none of the models in the “All projects” group passes the robustness check, while all except the model based on the United Kingdom data pass the robustness check in the “Max. 12 people” group. This suggests that the significant effects of the models that were fitted on the full set of projects might be subject to unobserved confounding. This is unlikely to be the case for the models only fitted on projects with a maximum of 12 persons in the project picture. For the models shown in Figure 10 (effect on the average donation), only the models that were fitted on data from the United States and on the pooled data from all countries survived the robustness test in the “All projects” group. For the group of models that were fitted on the projects with at most 12 people in the project picture, the Canada and U.S. models passed the robustness test, while the model that was fitted on the pooled data from all countries barely failed the robustness check.
Reanalysis of Garinther et al. (2022)
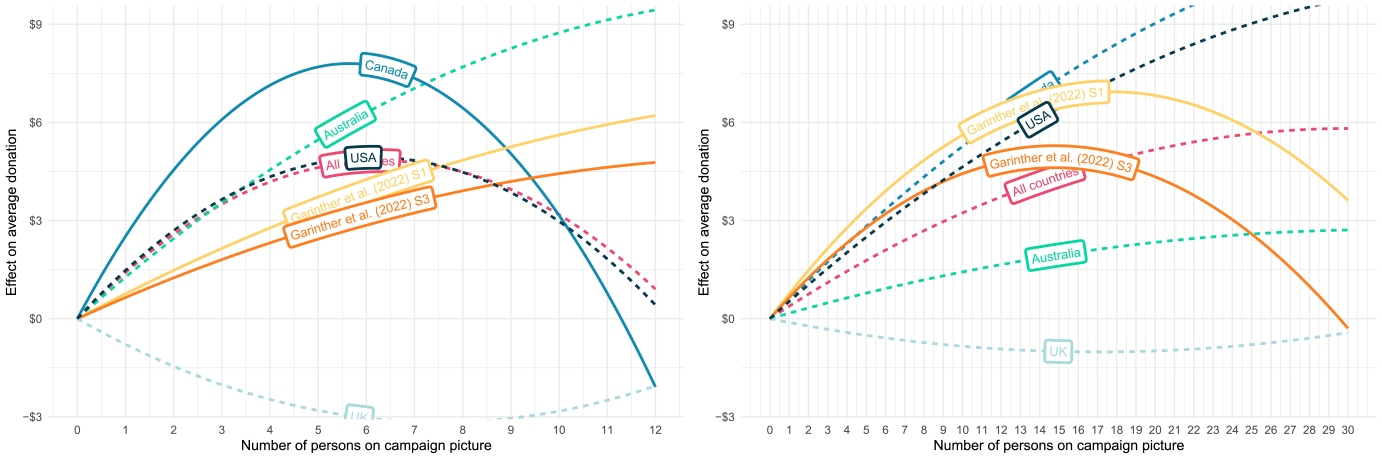
The nonlinearities revealed in the analysis of the GoFundMe prompted me to check whether such nonlinearities are also present in the data by Garinther et al. (2022). Although Garinther et al. (2022) do not mention a concave effect of the beneficiary group size on donations, a reanalysis of their data revealed one. Only a very careful reading of the results by Garinther et al. (2022) hints at a nonlinear effect. This might be because Garinther et al. (2022) modeled the beneficiary group size as an ordinal predictor (i.e., a variable where the distances between the categories are unknown). This alone is not problematic, especially given that Garinther et al. (2022) used a model that does not assume equidistance between the different categories. One should thus be able to observe nonlinearities from the plot of the fitted estimates. However, the main figure in Garinther et al. (2022) plots the size of the beneficiary group as equidistant categories on the x-axis. This creates the illusion that the distance between the different beneficiary group sizes (i.e., 2, 5, 7, and 12) is the same and produces a figure that makes the effect of the size of the beneficiary group on donations look approximately linear (see the left panel of Figure 13 which reproduces Figure 2 of Garinther et al. (2022). The right panel of Figure 13 plots the same estimates but now with a numerical x-axis that preserves the inherent (and meaningful) distance between the different beneficiary group sizes. This presentation clearly shows a concave effect for Study 1 and Study 3 of Garinther et al. (2022). 2 I confirmed the concavity of the effect for Study 1 and Study 3 with a mixed model that modeled the number of victims as a numerical predictor and included a quadratic effect of the number of victims. The quadratic effect is negative and significant for the data of Study 1 and Study 3. The detailed results of the reanalysis are provided in the Online Appendix.
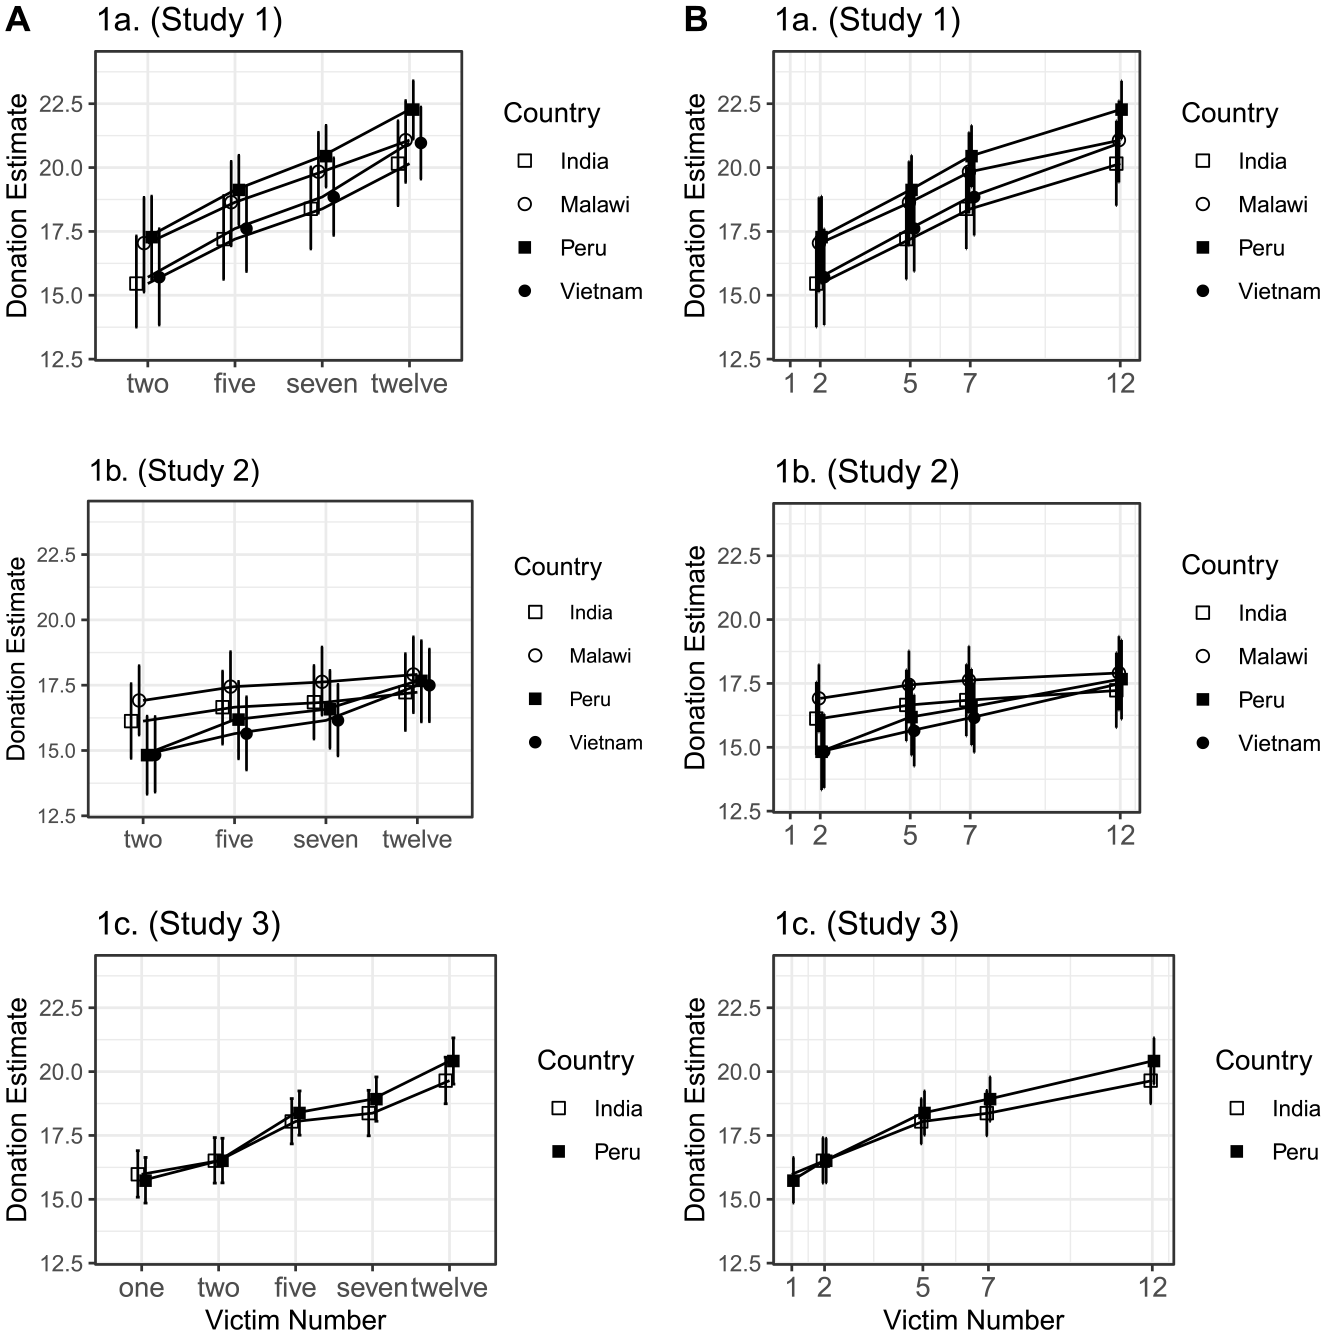
Reanalysis of the Data by Garinther et al. (2022). (A) Reproduction of Figure 2 of Garinther et al. (2022), Size of the Beneficiary Group Plotted as Equidistant. (B) Same Data as Shown in Panel A, But Taking the Actual Distance Between the Different Beneficiary Numbers Into Account.
Discussion
Crowdfunding has great promise both for individual and institutional fundraisers (Alexiou et al., 2020). However, most fundraising projects fail to reach their targets (Kenworthy & Igra, 2022; Schneiderhan & Lukk, 2023). In this study, I explored whether this lack of success could in part be explained by the different characteristics of crowdfunding and more traditional fundraising (e.g., mail solicitation). Among other things, crowdfunding platforms differ from more traditional means of fundraising in that potential donors are in a joint evaluation context, that is, they can choose among many projects to donate to. This contrasts with traditional fundraising, where potential donors often face only one donation request at a time (separate evaluation). Importantly for fundraisers, laboratory studies have shown that the effect of the size of the beneficiary group on donations reverses when going from a separate (seeing only one donation request) to a joint evaluation (seeing multiple donation requests) context (Erlandsson, 2021; Garinther et al., 2022). In contrast to results obtained from studies where participants only see one donation request (separate evaluation), studies that show each participant multiple donation requests (joint evaluation) report a positive effect of the beneficiary group size on donations (Erlandsson, 2021; Garinther et al., 2022). Using data from almost 30,000 GoFundMe crowdfunding projects from four countries, I tested whether this effect generalizes to a real-world setting. I did this by testing the effect of the number of people in a project’s profile picture (i.e., the perceived size of the beneficiary group) on the amount of funds raised by a project, the number of donations received by a project, and the size of the average donation received by a project. As hypothesized, and consistent with recent evidence from the lab that tested this effect in a joint evaluation condition (Garinther et al., 2022), I found a mostly significant positive effect of the number of people depicted in the project profile picture on these variables for the subgroup of projects that is most similar to the stimuli used in the laboratory (i.e., maximum 12 people in the picture). The results of the models fitted on the full sample were more mixed, and only a few indicated a significant positive effect.
Sensitivity analyses revealed that the effect of the number of persons in the project picture is strongest when only projects with a maximum of four persons in the picture are considered. As mentioned already, this pattern aligns with the human’s ability to quickly form judgments about the numerical quantity of objects. Studies show that the enumeration time is almost constant when the number of elements is up to four, but it increases sharply as the number of displayed elements increases (Balakrishnan & Ashby, 1991; Mandler & Shebo, 1982). Thus, when browsing projects, potential donors can quickly discriminate between pictures that contain up to four persons, but this becomes increasingly tedious and error-prone as the number of persons in the picture increases. This aligns with the gradual decrease in the effect of the number of persons in the picture as the threshold for the maximum number of persons in the picture is increased. This also explains why the models with a quadratic effect fit the data better, as models without a quadratic effect cannot capture the decrease in the effect as the number of persons in the pictures increases.
However, the reanalysis of the data by Garinther et al. (2022) also revealed a concave effect. In their study, the relative differences in the number of persons in the picture between the projects were well above the threshold difference needed to quickly judge which quantity is larger (Anobile et al., 2014). This suggests that other factors are also at play. The concave effect might indicate that even people in a joint evaluation condition might be prone to affective biases. The affective bias perspective denotes that in separate evaluations, people’s numeracy limitations and biases in affective processing (Hamilton & Sherman, 1996; Slovic, 2007) might be responsible for the compassion fade effect (Butts et al., 2019). The larger the beneficiary group, the more these affective biases could dampen the positive effect of the size of the beneficiary group on donations, leading to a concave effect. The reanalysis of the data by Garinther et al. (2022) showed that these biases could indeed affect decision-making even in a joint evaluation setting but are trumped by attributes that have a high level of justifiability (i.e., size of the beneficiary group; Erlandsson, 2021). It could also be that the concave effect is caused by people deliberately avoiding projects with a large perceived beneficiary group because they expect the needs of groups to be potentially overwhelming. Work on this motivated choice perspective shows that people regulate their emotions to prevent themselves from experiencing overwhelming emotions induced by witnessing a large group of people in need (Cameron & Payne, 2011). In a setting like GoFundMe, deliberately ignoring such projects when browsing would also be an effective strategy for avoiding such emotions. Such a strategy also aligns with recent evidence showing that people opt to avoid compassion when given the opportunity (Scheffer et al., 2022).
While the models fitted on the pooled data from all countries show consistent and robust effects on all three dependent variables (amount of funds raised, number of donations received, size of the average donation), the results from individual countries show some heterogeneity. Country-specific factors could potentially explain this heterogeneity. For example, the United States is the only one of these countries without universal health care. Accordingly, raising money for routine medical care is more common in the United States than in the United Kingdom and Canada (Saleh et al., 2020), which could increase the popularity of GoFundMe.
The average social media usage per country is another factor that likely affects the results. This is because social media shares were used as a proxy to control for the share of people who donated without being in a joint evaluation condition. The more time people spend on social media, the more likely they will come across a crowdfunding campaign. According to data from the consumer research company GWI, people in the United States spend considerably more time on social media than people from the other three countries (GWI, 2023). This would make social media shares a better proxy for the share of people who donated without browsing other projects before in the United States since the share of donations made through social media is likely to be higher. This is in line with the results of the robustness tests, where the United States was the only country that passed all robustness tests, suggesting that the results based on the U.S. data are not driven by omitted variable bias.
My results are not without limitations. First, as with any observational study aiming to draw causal conclusions, my results depend on the identifying assumptions. I used the project category and the project description to control for confounders between the number of people shown in the project profile picture and the amount of funds raised. I also used several other control variables that should help with identifying the variance needed to draw causal conclusions. However, it is possible that I have omitted a confounder or included a bad control. While this possibility cannot be ruled out, the fact that the results are consistent with results from the laboratory and that the results also hold for the models without the (potentially) bad controls indicates that the results are hopefully not affected by such a possibility. The second limitation concerns the data. While it covers countries from three different continents, my analysis is still restricted to a Western sample. Due to cultural differences in how crowdfunding projects are set up (Cho & Kim, 2017), my results do not necessarily generalize to, for example, more collectivist cultures (Nie et al., 2022). Future research could replicate my results in such cultures. Another limitation could be that I used the number of people in the project picture as a measure of the (perceived) beneficiary group size and did not control for the “true” beneficiary group size. For example, it could be that three persons are depicted in the image, but the description reveals that only one of the persons will benefit from the donations or vice versa. However, evidence points to the fact that people are more likely to be influenced by the perceived beneficiary group than by the “true” beneficiary group. First, a study by Hou et al. (2023) revealed that the project picture was the most attention-catching element of crowdfunding campaigns. Second, the “true” beneficiary group size is often very difficult to determine. Project descriptions rarely mention specific numbers but rather mention quantifiers such as “family” or “team.” Third, the sensitivity analysis results align with the hypothesis that people use the project picture as a measure of the beneficiary group size. Overall, I think that this is more of a strength than a weakness, as it suggests that fundraisers can manipulate the perceived beneficiary group size to attract more donations even when the true beneficiary group size doesn’t change.
Another related limitation is that I do not control for how many people were depicted in pictures other than the campaign profile picture. While not ruling out the effect of these additional pictures, the majority of the projects (68%) have no pictures other than the campaign profile picture. I also could not control for the “contrast” in which the projects appeared (i.e., how many persons were depicted in the project pictures of the projects surrounding a given project). However, I think this is unlikely to have an effect because (a) the variance of the number of people depicted in the profile picture is rather small within projects that share the same category and (b) Garinther et al. (2022) showed that the order in which people saw projects that they could donate to (e.g., whether they first saw a project with one person and then a project with seven persons or vice versa) did not have an effect on how much they donated.
For future research, it would be interesting to test whether these results expand to other forms of prosocial behavior, such as volunteering. A recent study by Meier et al. (2023) found that the number of COVID-19-related deaths had a concave effect on individuals’ amount of volunteering during the COVID-19 pandemic. The authors discussed that the concavity of the effect could result from compassion fade. It would also be interesting to test whether other “helping effects” (Erlandsson, 2021), such as the identifiable victim effect (IVE), generalize to the field. The IVE posits that people are more motivated to help identified (e.g., through a picture) victims than to help nonidentified (i.e., anonymous) victims (Lee & Feeley, 2016). However, recent evidence from a preregistered replication and extension of a seminal demonstration of the IVE (Small et al., 2013) and a reevaluation of the literature with a Bayesian meta-analysis called this effect into question (Maier et al., 2022). Practitioners should thus be weary of applying this effect in the wild before its efficacy has been demonstrated in the field.
Conclusion and Advice for Practitioners
This is the first study that tested compassion fade with data collected outside of a laboratory environment. Based on a sample of 30,000 GoFundMe campaigns, this study replicates recent evidence from the laboratory, which found that the compassion fade effect reverses when potential donors are confronted with multiple (rather than just one) donation requests. I found a positive but diminishing (i.e., concave) effect of the perceived beneficiary group size on the amount of funds raised by a project, the number of donations received, and the size of the average donation. The implication of these results is that solicitors need to carefully think about whether potential donors will only see this solicitation request or will be confronted with multiple solicitation requests when deciding how many people to present in their solicitation materials. When potential donors are likely to only see this solicitation request (e.g., door-to-door solicitation or direct-mailing), current evidence suggests that displaying a smaller beneficiary group is preferable to exploit the compassion fade effect. But when potential donors are likely to be confronted with multiple donation requests (e.g., crowdfunding), displaying a larger beneficiary group (i.e., around five to six people) should be more effective.
Supplemental Material
sj-pdf-1-nvs-10.1177_08997640241255707 – Supplemental material for Compassion for All: Real-World Online Donations Contradict Compassion Fade
Supplemental material, sj-pdf-1-nvs-10.1177_08997640241255707 for Compassion for All: Real-World Online Donations Contradict Compassion Fade by Dominik S. Meier in Nonprofit and Voluntary Sector Quarterly
Footnotes
Declaration of Conflicting Interests
The author(s) declared no potential conflicts of interest with respect to the research, authorship, and/or publication of this article.
Funding
The author(s) received no financial support for the research, authorship, and/or publication of this article.
Supplemental Material
Supplemental material for this article is available online.
Notes
Author Biographies
References
Supplementary Material
Please find the following supplemental material available below.
For Open Access articles published under a Creative Commons License, all supplemental material carries the same license as the article it is associated with.
For non-Open Access articles published, all supplemental material carries a non-exclusive license, and permission requests for re-use of supplemental material or any part of supplemental material shall be sent directly to the copyright owner as specified in the copyright notice associated with the article.