
Abstract
This article draws on literature on nonprofit resilience to hazards to explore the impact of federal Paycheck Protection Program (PPP) loans on nonprofits’ staffing, services, and financial health during the COVID-19 pandemic’s first year. Through propensity score matching with survey data collected in spring 2020 and winter 2021 from the New Orleans area, linked to publicly available PPP data, nonprofits that did and did not receive a PPP loan were matched on covariates representing critical resilience capacities pre-pandemic, allowing calculation of effect sizes for short-term outcomes. Results suggest that PPP tentatively supported nonprofit liquidity in the form of reserves, but had at best mixed results in promoting service maintenance, and did not support hiring or staff retention in excess of the non-treatment group. Despite the small sample size, these preliminary findings inform how PPP may have supported short-term sustainability and help guide future federal policy to support nonprofits during crises.
Keywords
Nationwide lockdown orders issued in response to the COVID-19 pandemic changed the way nonprofits operate. Traditionally the first to respond to disasters due to their proximity to the affected population, nonprofits were heavily impacted by the pandemic (Hutton et al., 2021). In recognition of the strain induced by lockdowns upon small businesses (Cajner et al., 2020), as well as nonprofits, the U.S. federal government issued unprecedented financial relief in the form of the Coronavirus Aid, Relief, and Economic Security (CARES) Act of 2020, which combined funding for economic security and COVID-19 disaster relief. The Paycheck Protection Program (PPP) established by the CARES Act served as a stopgap measure to sustain small businesses and nonprofits through federally backed loans that were either forgivable, if organizations met expense qualifications and maintained employees and pay rates, or capped at a low interest rate (Autor et al., 2020).
PPP was not crafted specifically for nonprofits, but the capacities and impacts associated with receipt of PPP funds should be incorporated into nonprofit resilience models to prepare the sector for successful collaborations with and revenue accessibility from the federal government when future economic stimulus and relief funds become necessary (Johnson et al., 2020). By resilience, we are referring generally to nonprofits’ ability to survive and thrive through a crisis or hazard (Rao & Greve, 2018). Resilience is more than a return to stability post-crisis, encompassing a latent organizational capacity to proactively adapt to changing contexts (Searing et al., 2021) and transform challenges into opportunities (Witmer & Sarmiento Mellinger, 2016). This article draws on literature on nonprofit resilience to compound hazards (Hutton et al., 2021) to explore the impact of PPP loans on supporting nonprofits’ short-term resilience, specifically in the form of their ability to adapt, maintain, and even enhance staffing, services, and financial health during the first year of the COVID-19 pandemic.
Using propensity score matching (PSM; Harris & Horst, 2016) with survey data collected in spring 2020 and winter 2021 from nonprofits located in and around New Orleans, Louisiana, linked to publicly available PPP data from the U.S. Small Business Administration (SBA), nonprofits that did and did not receive a PPP loan in the program’s first round were matched on covariates that represent critical resilience capacities pre-pandemic, allowing calculation of effect sizes for short-term sustainability outcomes promoted by PPP 1 year later. Despite the relatively small sample size (n = 94), these preliminary findings inform whether and how PPP may have supported short-term nonprofit sustainability and help guide future federal policy to support nonprofits during concurrent pandemic and economic crises.
Literature Review
Impact of COVID-19 on Nonprofits
Public policies to mitigate further spread of the COVID-19 pandemic since March 2020—including government-mandated lockdowns, social distancing, and personal protective equipment (PPE) requirements—have contributed to global economic shock by forcing business and nonprofit closures and cancelation of events and services (Stewart et al., 2021). These necessary public health measures reduced revenues, limited cash flow, and threatened solvency of organizations without reliable cash flow, diverse revenue streams, and elastic portfolios (Johnson et al., 2020; Maher et al., 2020).
More specifically, nonprofit management strategies required to reduce transmission of COVID-19 depleted both volunteers and funding streams while increasing operating costs to secure PPE and social distance, threatening organizational continuity and sustainability (Stewart et al., 2021). Almost all nonprofits reported negative effects from COVID-19, including reduced or delayed contributions, service suspension, event cancelation, declines in dues and fees, staff disruptions, increased operating costs, and supply lapses (Mirabella et al., 2020; Stewart et al., 2021). As a result of these disruptions, 13% of nonprofit jobs disappeared in the first 3 months of the pandemic (Salamon & Newhouse, 2020).
Indeed, nearly half of nonprofits (45%) perceived the impacts of COVID-19 to be worse than the 2008 economic crisis (Maher et al., 2020). To weather that recession, nonprofits drew down endowments, shifted from dependence on large gifts to revenue-generating social entrepreneurship, and increased reliance upon government funds (Besel et al., 2011). Similarly, to adapt to the pandemic, nonprofits froze discretionary spending and hiring, delayed capital expenditures and maintenance, applied for grants, reduced operating hours, developed online programming, and drew on endowments (Maher et al., 2020). Cutting staff and core services were last resort options, yet U.S. national data by state show that up to 88% of nonprofits in each state relied on virtual work, 45% furloughed or laid off employees, 40% cut employee hours, and 32% issued pay cuts (Stewart et al., 2021).
At the same time, nonprofits are essential service providers during hazards (Hutton et al., 2021). Nonprofits facilitate collective action in the communities where they are located (Paarlberg et al., 2020), especially to address the needs of adversely affected vulnerable populations who may have limited access to government services. Nonprofit hazard mitigation cycles from bridge-building in the short term, wherein agile nonprofits shift funding and operations toward emergent community needs, to linkage-building during later stages of recovery when well-connected nonprofits restore and expand long-term funding relationships (Hutton et al., 2016; Maher et al., 2020).
Pandemic operations require alterations to traditional emergency plans in the areas of communication, document back-up, remote work technology, and quick response (Hutton et al., 2021). Empathetic and adaptive leaders who can operate beyond traditional strategic plans, acknowledge stakeholders, adapt operations to include new programs, engage in reasonable communication and evaluation, reduce overhead, and navigate red tape have been critical to the resilience of nonprofits across the globe (Mirabella et al., 2020). Commitment of staff, boards, volunteers, and funders is also key, as is access to reserves or liquid assets in part to move to the virtual environment.
However, community capital and organizational capacity are strained during a pandemic (Hutton et al., 2021), and nonprofit response to hazards is challenged by restrictive funding and reporting requirements (Mirabella et al., 2020). In addition, community volunteerism is reduced (Johnson et al., 2020; Rao & Greve, 2018). As a result, the capacity for nonprofits to maintain services and diversify funding in the face of the pandemic and accompanying economic shock is especially reliant on government support.
U.S. Government Support Programs for COVID-19
As a cornerstone of its pandemic response efforts, the U.S. federal government passed the $2.2 trillion CARES Act in late March 2020. The largest relief package passed at the time of its signing (Johnson et al., 2020), the CARES Act included an umbrella of policies encompassing PPP, Economic Injury Disaster Loans (EIDL), and other assistance provided by the SBA and other federal agencies through delayed taxes, increased tax credits, reimbursement for unemployment benefits, additional disaster assistance and loan availability, advances, and reduced loan rates for mid-size organizations (Havens & Hellmuth, 2020). These policies collectively sought to preserve capacity for small businesses to produce goods and services (Hubbard & Strain, 2020).
Specifically, federally backed PPP loans allowed organizations that employ between one and 500 paid staff members to receive funds from private banks for salaries, wages, state and local taxes, and employee benefits including paid leave and health insurance (Autor et al., 2020; Johnson et al., 2020). PPP had two primary goals for small businesses: stabilize revenues and maintain employee hours (Li, 2021). Stable revenues and human resources facilitate nonprofit service continuity via organizational realignment and sectoral reorganization during hazards (Hutton et al., 2021). Given the pandemic’s unprecedented and immediate negative impact on nonprofit revenues and the overall economy, rapid stabilization would represent an important step toward nonprofits’ short-term resilience, bolstering adaptive capacity for longer-term adjustments (Young & Searing, 2022).
The Census Bureau’s Small Business Survey suggests that 74% of small businesses applied for PPP loans, 27% applied for EIDL funds, and 10% applied for other SBA loans or grants, with receipt at 65% for PPP, 16% for EIDL, and 6% for other SBA funds (Li, 2021). Despite PPP’s intent as pandemic relief, the severity of COVID-19 impacts did not appear to factor into application or approval rates for small businesses. Nonetheless, Autor et al. (2020) found modest positive improvements to employment associated with PPP funding receipt. Hubbard and Strain (2020) show that in the short term, PPP retained employees and sustained small businesses, particularly for the smallest eligible businesses, and that the positive impacts increased over time from April to August 2020.
The swiftness of the CARES Act response appears to have provided insulation for workers while businesses adapted to new conditions (Groshen, 2020). However, because PPP funds are expensed and not renewed, recessionary dynamics may emerge yet again. Hubbard and Strain (2020) cautioned that businesses struggling prior to the pandemic would continue to struggle after, regardless of the receipt of federal funds. Groshen (2020) called for additional investment in services for disadvantaged populations and support of consumption via fiscal policy to sustain the labor market through longer-term recovery from COVID-19, which was addressed in part by subsequent expansions and extensions of PPP, including opportunities for a second draw of PPP loans in 2021.
The CARES Act was not specifically designed for nonprofits but rather small enterprises in general (Johnson et al., 2020). Still, as of late July 2020, nonprofits nationwide had received 3.7% of PPP loans and a larger share of the high dollar loans than any other entity type (Williams, 2020). Over half (59%) of nonprofits that applied for PPP loans in the program’s initial months were approved (Mirabella et al., 2020). One third of nonprofit jobs within 40% of eligible nonprofits were affected by the initial round of PPP loans (Williams, 2020). However, 20% fewer jobs were protected than expected because many smaller nonprofits did not apply or succeed. Organizations that did apply for PPP may vary from those that did not for multiple reasons, including existing financial stability and motivation to pursue federally subsidized private loans (Hubbard & Strain, 2020). Indeed, many nonprofit leaders are skeptical of relying on public funds, even in the short term, due to perceived and previously experienced risks that federal funds are volatile and restrictive, require burdensome application and reporting paperwork, and do not cover full costs of employment and service delivery (Searing et al., 2021).
PPP funds were at least partially associated with shadow workers who were still paid but not actually back to work or retained beyond the length of the PPP loan, ranging from 35% in social assistance to 87% in museums, with education, civic organizations, health care, and performance falling in between (Salamon & Newhouse, 2020). However, now that the program has ceased granting new loans as of May 31, 2021, little is known about the full effects of the program on nonprofit sustainability. Additional research is needed to explore which nonprofits did or did not receive PPP loans, and how, if at all, PPP loans impacted nonprofits’ short-term sustainability in terms of staff retention, service maintenance, and financial health.
Theoretical Framework
This article applies a nonprofit compound hazard resilience model (Hutton et al., 2021) to explore the impact of PPP loans on nonprofit resilience outcomes. Eight factors are thought to be effective in nonprofit resilience at the organizational level to compound hazards like simultaneous pandemic and economic shock: adaptive capacity, strategic planning, external communication, financial management, board leadership, operational capacity, mission orientation, and staff management (Hutton et al., 2021). These resilience capacities may allow nonprofits to realign and reorganize to fill gaps in response, preparation, and recovery efforts through coordination and collaboration with the government that maintain and expand services for vulnerable populations, even when community support wanes. In the adopted framework, these capacities are expected to influence pursuit and receipt of PPP loans, as well as broader nonprofit sustainability.
This model is consistent with other inductively generated models of nonprofit resilience. For instance, Witmer and Sarmiento Mellinger (2016) identified six themes that promote organizational resilience to funding changes, including commitment to mission, improvisation, community reciprocity, servant and transformational leadership, hope and optimism, and fiscal transparency. Searing et al. (2021) identified five themes encompassing financial, human resources, outreach, programs and services, and management and leadership tactics. All three models converge on a core set of resilience capacities, ranging from the more quantitatively measurable (e.g., financial and staffing metrics), to the more qualitative (e.g., organizational cultural and leadership style, community relations). For simplicity, and because it was designed with compound natural (i.e., pandemic) and financial hazards in mind, we operationalize the Hutton et al. (2021) model in this study and incorporate considerations from the other models throughout this article.
According to Hutton et al. (2021), adaptive capacity denotes the nonprofits’ resource flexibility for responding to sudden shock, such as through diversified revenue streams and liquid assets. Revenue diversification is often thought to cushion nonprofits from financial blows, but it may also increase short-term shock to severe crises that simultaneously hinder multiple funding streams (Lin & Wang, 2016). Liquid financial resources—and reserves in particular—support supply acquisition, service maintenance, and staff retention during times of crisis (Kim & Mason, 2020).
Strategic planning refers to the nonprofit’s scenario and contingency planning to enhance preparedness for disasters, often documented in a written “continuity of operations plan,” or COOP. As promoted by the Federal Emergency Management Agency (FEMA, 2018), a COOP helps ensure that essential organization functions are sustained in case of a disruption, including through use of telework and technology.
External communication refers to the nonprofit’s access to networks and partners, particularly funders who often provide technical assistance and financial resources to nonprofits in their social network in times of crisis (Faulk et al., 2016), including during the COVID-19 pandemic (Finchum-Mason et al., 2020).
Financial management reflects the nonprofit’s existing financial capacity, resource cut mitigation, short-term operational and financial changes that can take effect within the next fiscal year, and reformation to take on emergent opportunities (Maher et al., 2020).
Board leadership denotes the board’s governance capacity for leading the nonprofit through times of crisis (McMullin & Raggo, 2020), based in part on the stage of the nonprofit’s life cycle and its institutional history with past crises.
Operational capacity refers to organizational size in terms of staff and revenues, which are positively associated with receipt of PPP loans within the program’s eligibility criteria (Faulk et al., 2021).
Mission orientation refers to leader and staff commitment to mission and motivation, which have implications for organizational culture and staff retention (Vincent & Marmo, 2018).
Staff management likewise reflects staff job satisfaction with implications for retention and service continuity. For instance, providing health insurance to full-time employees is thought to promote staff retention among nonprofits (Slatten et al., 2021) and is especially valuable for employees during a pandemic.
These eight resilience capacities should predict both pursuit and receipt of a PPP loan as an adaptive strategy. In turn, anticipated outcomes that would indicate nonprofit short-term sustainability through initial response to the pandemic are centered around staff retention, service maintenance, and financial health (Hutton et al., 2021), all of which align with the espoused goals of PPP (Li, 2021). This article uses survey indicators from New Orleans-based nonprofits to test the applicability of these resilience capacities to receipt of PPP funding and operational success as defined by the CARES Act. It aims to test three hypotheses regarding the impact of PPP loans on nonprofit resilience outcomes 1 year into the COVID-19 pandemic among nonprofits with comparable pre-pandemic resilience capacities:
Method
Data Collection
The three hypotheses were tested through survey data collected from a sample of 501(c)(3) nonprofits (i.e., “public charities”) in the New Orleans-Metairie Metropolitan Statistical Area (MSA) in the southern United States, linked to additional publicly available data sets. The research was approved by the Institutional Review Board (IRB) of the first author’s academic institution.
A sampling frame of charitable nonprofits with addresses in the eight parishes (counties) included in the New Orleans-Metairie MSA was constructed based on the Urban Institute’s National Center for Charitable Statistics’ (NCCS) cleaned version of the Internal Revenue Service’s (IRS) Business Master File (BMF), which lists all tax-exempt organizations actively registered with the U.S. federal government (NCCS, 2020). The frame was further limited to 501(c)(3) public charities that had filed IRS Form 990. Excluded from this list were nonprofits reporting negative or zero revenues, religious congregations that are not required to file taxes, and especially large nonprofits including hospitals, clinics, nursing homes, universities, charter schools, and foundations (Faulk et al., 2021).
The New Orleans-Metairie MSA nonprofit sector is not an outlier in terms of its overall size, density, or finances (McKeever et al., 2016). A recent nationally representative survey found that more than four-fifths of U.S. nonprofits are headquartered in urban and suburban areas (Faulk et al., 2021). According to the most recent estimate available from the U.S. Bureau of Labor Statistics (BLS), 11.6% of the workforce in the New Orleans-Metairie MSA is employed by nonprofits (BLS, 2017), comparable to the national estimate of 10.2% (Salamon & Newhouse, 2020). Nonprofits in the MSA were similarly affected by the early waves of the COVID-19 pandemic as other nonprofits across the nation (Hutton et al., 2021; Mumford, 2022).
The resulting list of public charities based in the MSA was matched to email contacts gathered through a review of websites and a contact database shared by a community foundation sponsoring the research. A total of 564 nonprofits were sent an online survey at two time points: the “baseline” survey was open from March 23 to May 13, 2020, and the “follow-up” survey was open from January 12 to February 15, 2021. Emails requested that the survey be completed by the nonprofit’s Executive Director on behalf of the organization.
Both surveys’ questions covered nonprofit operations, services, staffing, finances, and needs. Some questions were adapted from the Nonprofit Finance Fund’s (2018) “State of the Nonprofit Sector Survey.” The baseline survey asked respondents to reflect back on February 2020, just before the pandemic began, and project the impact of the pandemic. The follow-up survey was more comprehensive, asking respondents about changes their nonprofit had made in response to the pandemic since March 2020 and its current status.
A total of 171 respondents completed both surveys and were also eligible for a PPP loan in 2020 based on staff size (Autor et al., 2020), as indicated in the baseline survey, for a 30.3% response rate. Ninety responding nonprofits were matched by name to SBA’s (2021a) public list of all PPP loan recipients, suggesting that 52.6% of eligible nonprofits in the survey sample received PPP loans. For comparison, a nationally representative survey found that two-thirds of nonprofits applied for PPP loans in 2020—although these figures may include nonprofits with no paid staff ineligible for PPP—and 99% of applicants received a loan (Faulk et al., 2021).
Propensity Score Matching
Causal inference is complicated by the issue of selection bias; that is, nonprofits that self-selected into applying for (and ultimately receiving) PPP loans may be systematically different from those that did not, biasing estimates of the potential impact of the loans on short-term sustainability outcomes (Henry, 2015). Specifically, PPP applicants should demonstrate more resilience capacities discussed above based on pursuing and obtaining the loan, potentially increasing their chances of achieving desired outcomes during the first year of the pandemic. A simple way to correct for self-selection is to control for baseline resilience capacities in a regression model; however, the survey data violated critical assumptions of residual independence, constant variance, and normality necessary for rendering unbiased estimates via regression.
Therefore, PSM was adopted (Harris & Horst, 2016; Leonard et al., 2020) to form a matched sample balanced on covariates that might influence selection into the treatment and/or outcome variables. The PSM command in SPSS version 27 was employed to regress a binary variable for receipt of a PPP loan on 10 resilience capacity indicators described below, calculate a propensity score (or probability of receiving a loan) for each nonprofit, and match like cases across treatment and non-treatment groups through one-to-one matching without replacement within a 0.20 point match tolerance. The number of indicators and match tolerance were chosen to balance concerns for matching precision against size of the final matched sample (Harris & Horst, 2016). In this way, the matched non-treatment group can serve as a counterfactual for the treatment group, as long as all covariates that may influence either loan receipt and/or resilience outcomes are incorporated into propensity scores.
Matched Covariates
Covariates were selected to represent the nonprofit compound hazard resilience factors (Hutton et al., 2021) from the theoretical framework, as discussed above. The factors were operationalized through nonprofits’ pre-pandemic characteristics gathered from the spring 2020 baseline survey, as well as the NCCS BMF data set where indicated. Metrics include the following:
Adaptive capacity: extent of pre-pandemic revenue diversification and number of months’ operating expenses covered by existing cash on hand and reserve funds (Searing et al., 2021). Diversification is measured by a count of the number of different types of funding sources the nonprofit received prior to the pandemic, including private grants, public grants, contracts or fees for service, earned income, federally backed loans, donor campaigns, corporate sponsorships, or lines of credit (for a maximum of eight).
Strategic planning: a binary variable indicating whether the nonprofit had a written COOP. In New Orleans pre-pandemic, COOPs were most often tailored to hurricanes, but many practices applied to pandemic mitigation or were readily adapted (Hutton et al., 2021). Prior existence of a COOP framework for disaster response suggested an organization’s existing capacity for both scenario planning (Young & Searing, 2022) and strategic improvisation (Witmer & Sarmiento Mellinger, 2016).
External communication: a binary variable indicating whether the nonprofit is a grantee partner of the Greater New Orleans Funders Network, a partnership of 10 foundations engaged in place-based grantmaking in the MSA and their local grantees (
Financial management: total cumulative assets from the NCCS BMF data set based on pre-pandemic IRS tax filings, representing long-term investments that can support banking relationships and access to credit through collateral (Lin & Wang, 2016). Liquidation of assets in response to crises is an important stopgap measure to support dependable cashflow (Searing et al., 2021).
Board leadership: organizational age in years from obtaining tax exempt status to February 2020 based on the NCCS BMF data set. Ostrower (2007) found that age is positively associated with several good governance practices of the board, including audits and document retention, which may directly support PPP loan application. It also reflects nonprofit’s experience with past hazards such as Hurricane Katrina (Jenkins et al., 2015), promoting organizational memory that might be applied to subsequent emergency situations.
Operational capacity: total annual revenues in the most recent year included in the NCCS BMF data set (most often 2018) and the nonprofit’s total number of full-time equivalent (FTE) paid staff self-reported in the baseline survey, both of which permit organizational slack that could be leveraged during the pandemic (Young & Searing, 2022).
Mission orientation: a binary variable indicating whether the nonprofit planned to pursue an SBA loan (including, most notably, through the Paycheck Protection Program) in response to the pandemic at the time of the baseline survey in spring 2020 just as the COVID-19 pandemic began in the United States. This can be thought of as an “intention to treat” measure representing motivation to pursue a loan that would help advance mission during a crisis.
Staff management: a binary variable indicating whether the nonprofit provides health insurance to full-time employees (Slatten et al., 2021), thus helping to support staff capacity and retention through the pandemic and possibly reducing stress and burnout (Searing et al., 2021).
Matching Results
The matched sample consists of 94 nonprofits representing 55.0% of the original sample, with an equal number of 47 in each group. In the unmatched sample, propensity scores ranged from 0.37 to 0.83 for recipients and from 0.05 to 0.81 for non-recipients; mean scores were significantly different across groups, M = 0.61 versus 0.53, t(118) = 3.24, p = .002. However, in the truncated matched sample, propensity scores ranged from 0.37 to 0.78 for recipients and from 0.36 to 0.81 for non-recipients, indicating similar distribution (Harris & Horst, 2016). In addition, the mean scores across groups were rendered equal (M = 0.55 vs. 0.55).
Improvement in covariate balance across groups via matching is displayed in Table 1. In the unmatched sample, as expected (Faulk et al., 2021), PPP loan recipients tended to have larger revenues, assets, and especially staff size when compared with non-recipients, consistent with the prior finding noted above that smaller nonprofits were less likely to seek and/or obtain PPP loans in the initial months of the pandemic (Williams, 2020). Furthermore, unmatched loan recipients exhibited more resilience capacities in terms of revenue diversification, as well as greater likelihood of providing health insurance, having a COOP, participating in a funders network, and indicating plans to pursue an SBA (i.e., PPP or other federally guaranteed) loan.
Comparison of Means on Baseline Resilience Capacity Variables for Unmatched and Matched Samples.
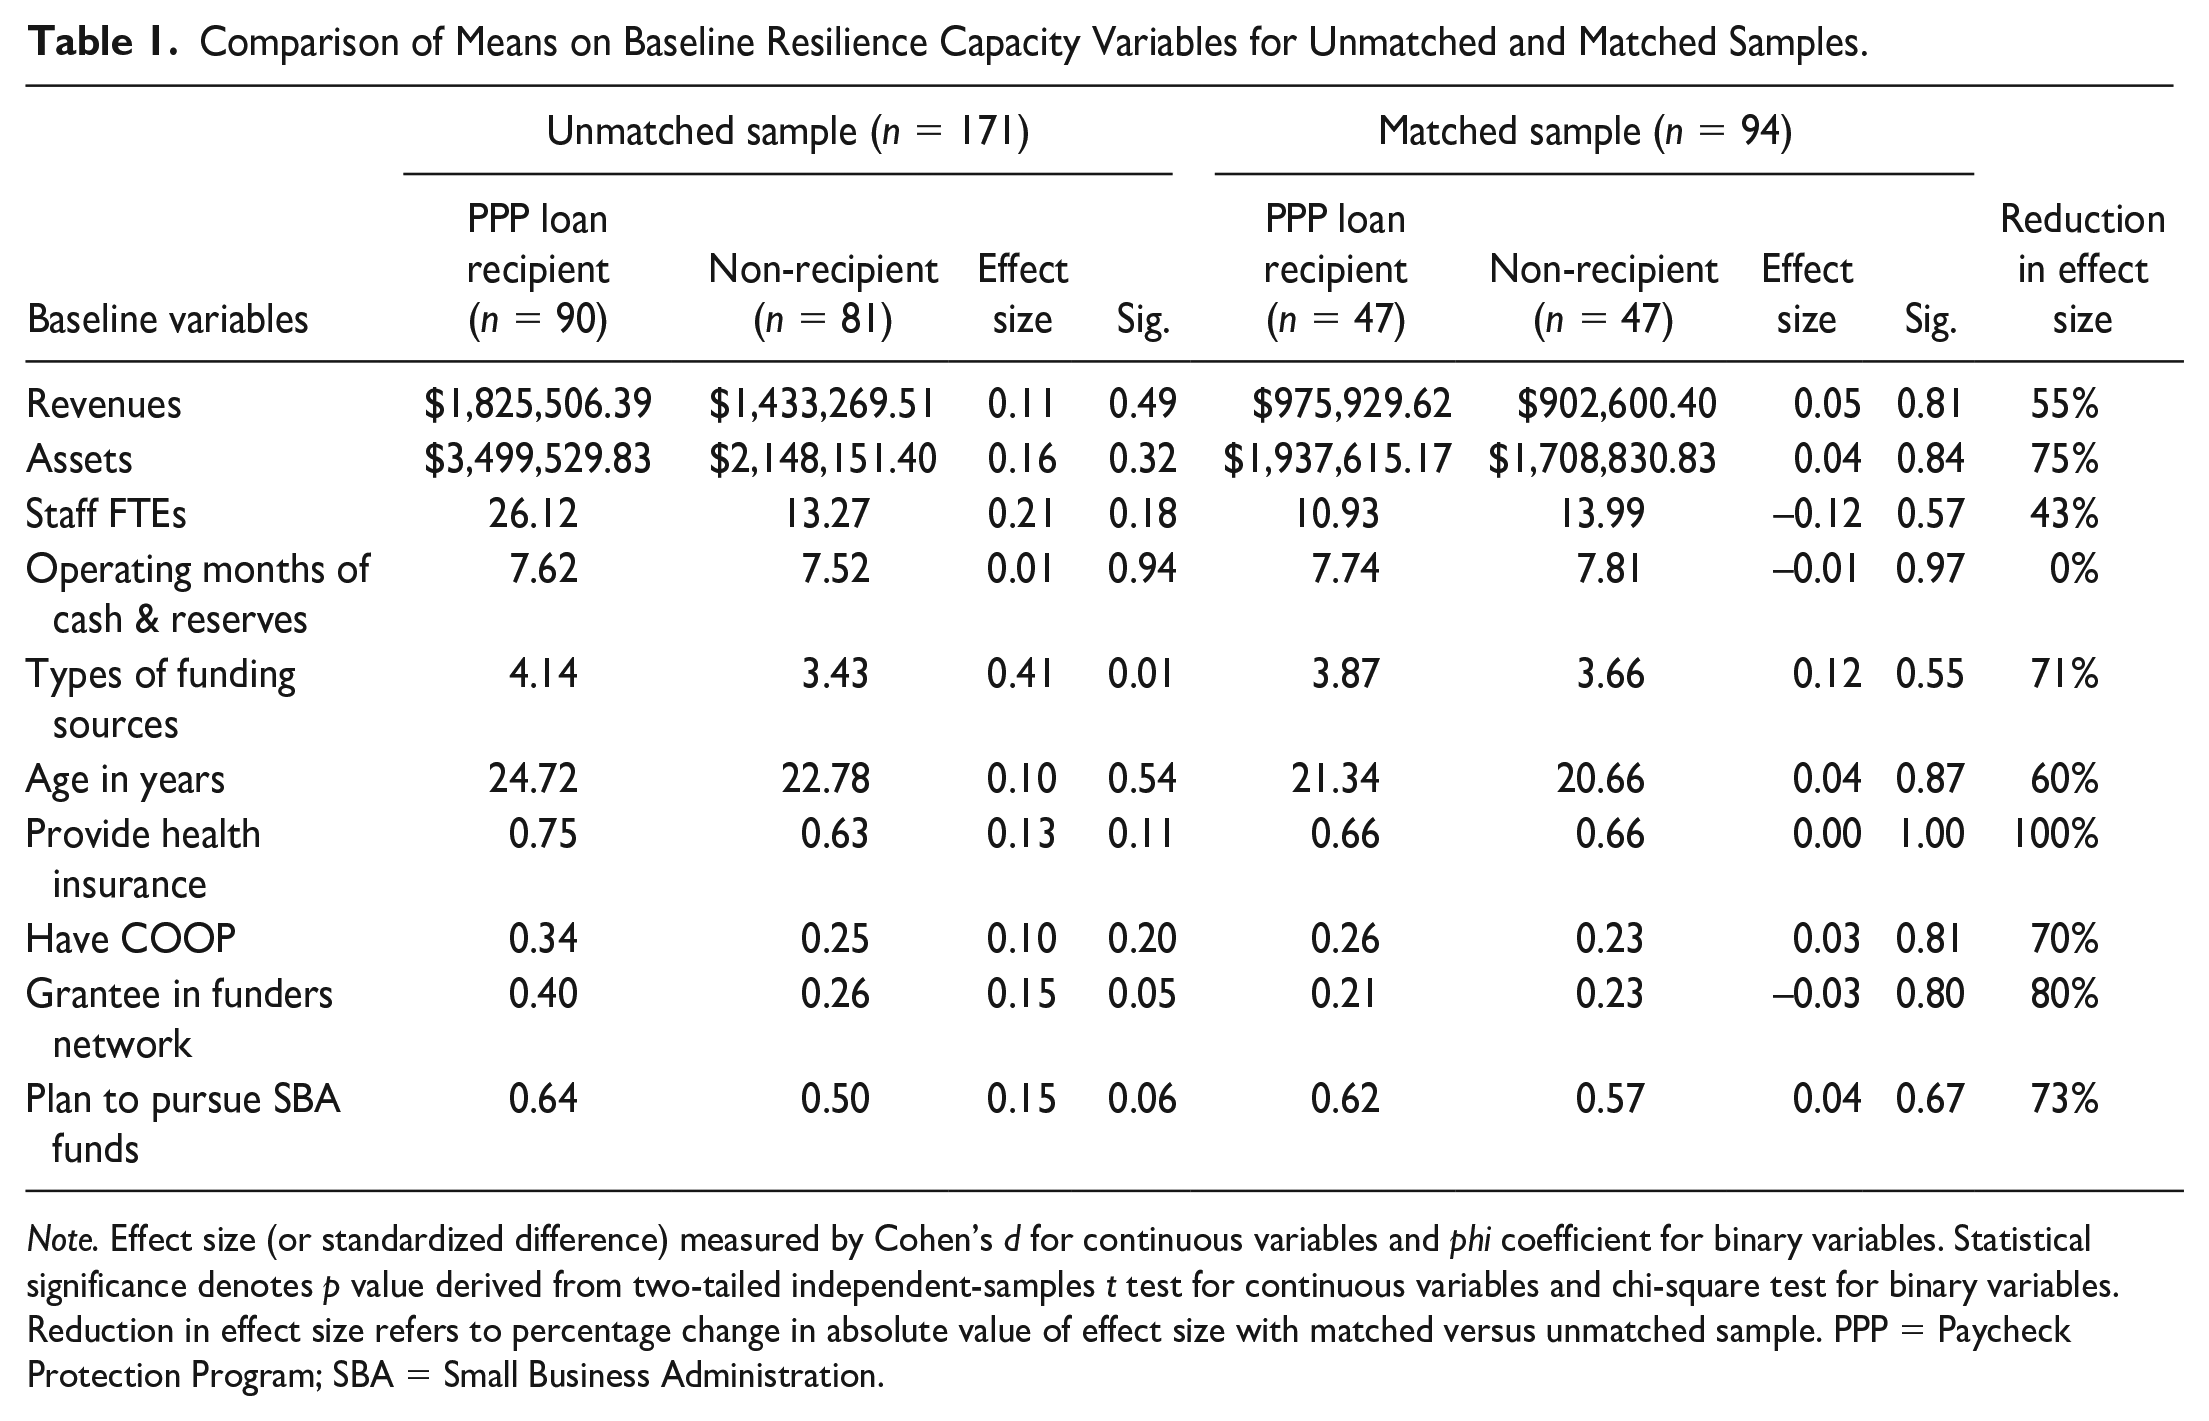
Note. Effect size (or standardized difference) measured by Cohen’s d for continuous variables and phi coefficient for binary variables. Statistical significance denotes p value derived from two-tailed independent-samples t test for continuous variables and chi-square test for binary variables. Reduction in effect size refers to percentage change in absolute value of effect size with matched versus unmatched sample. PPP = Paycheck Protection Program; SBA = Small Business Administration.
In the matched sample, these differences were greatly reduced, resulting in well-balanced groups suitable for comparison (Harris & Horst, 2016). However, the truncated matched sample includes notably smaller PPP-eligible nonprofits in terms of revenues, assets, and staff FTEs, compared with the larger unmatched sample. Thus, in terms of representativeness, nonprofits retained in the truncated matched sample fall within the overall sector’s middle range of organizational size, excluding both the smallest (i.e., PPP-ineligible) and largest nonprofits in the region and limiting our ability to extrapolate findings to populations at the sectoral distribution’s tails.
Comparison of PPP Loans Across Samples
PPP loan characteristics were compared across the unmatched and matched samples to assess differences that may hold additional implications for generalizability of results. Among matched PPP loan recipients (n = 47), loans were received between April 4 and June 20, 2020, with loan amounts ranging from $8,361.00 to $334,200.00, for a mean of $83,430.95. Loan amounts represented from 1% to 29% of the nonprofit’s total annual revenues pre-pandemic, for a mean of 11.7%. These loan recipients reported that the PPP loan preserved from one to 52 jobs during its duration, for a mean of 11.0.
In contrast, loans for the unmatched sample of recipients (n = 90) were considerably larger on average, with a mean of $216,556.98 and maximum of $2,904,406.00, representing up to 50% of total annual revenues. Furthermore, loans for the unmatched sample preserved from one to 500 jobs (the full range of program eligibility), for a mean of 29.7 jobs. Thus, additional data suggest the largest loan recipients (and nonprofits in general) from the unmatched sample were omitted from the matched sample, as discussed in the previous section, which limits generalizability of our findings.
For the matched subsample (n = 47), a mean of 93.3% and minimum of 75.0% of loan funds were dedicated to payroll costs, with 27.7% of recipients (n = 13) dedicating additional funds to utilities, and two recipients each dedicating additional funds to health care and rent. More than four-fifths of these total loans (83.0%) were completely forgiven by the program’s end in July 2021, with the first loan forgiven in November 2020.
Match on Additional Covariates
The matched groups show balance on several additional covariates, which were not incorporated into propensity scores to preserve parsimony in the PSM logistical regression model. There was no difference in the percentage of nonprofits in each group that were identified as either arts and culture nonprofits (17.0% each), or a combination of health and human services nonprofits (48.9% each), based on National Taxonomy of Exempt Entities (NTEE) codes gathered from the NCCS BMF data set (Jones, 2019). The percentage of nonprofits classified in these two subsectors was consistent with that of the region overall (Mumford, 2022). Nor were there meaningful differences based on chi-square tests in the percentage of each group that reported providing direct services in response to the pandemic in the baseline survey (54.5% of PPP loan recipients vs. 54.3% of non-recipients, p = .985), or experiencing an increase in service demand during the pandemic in the follow-up survey (57.8% vs. 53.5%, p = .686). This suggests that groups were further balanced in likelihood of providing “essential services” during the pandemic, which could have implications for staffing, services, and funding.
Furthermore, the matched treatment and non-treatment groups showed no statistically significant differences on a range of baseline survey measures (p > .300 for all differences), including in the percentage of each group in spring 2020 that: anticipated cutting employee hours (21.3% of PPP loan recipients vs. 19.1% of non-recipients), furloughing employees (14.9% vs. 21.3%), and/or laying off employees permanently (6.4% vs. 4.3%); operated a physical office (89.4% vs. 83.0%), shifted staff to remote work (83.3% vs. 82.1%), and/or closed the physical office temporarily (61.9% vs. 64.1%); provided sick leave to employees (78.7% vs. 74.5%); and had a pre-pandemic reserve fund (31.9% vs. 31.9%), anticipated cashflow problems (83.0% vs. 69.6%), and/or had to cancel or postpone a major fundraising event (58.5% vs. 54.5%).
Thus, the two groups were statistically comparable in terms of the pandemic’s initial impact on their staffing, services, operations, and finances, at least as measured by the baseline survey. That said, percentage differences between the two groups reported above, although not reaching statistical significance within this relatively small sample (n = 94), suggest that loan recipients may have had slightly greater operational costs than their counterparts (e.g., operating a physical office and providing staff with sick leave), and anticipated more cashflow problems, perhaps further motivating them to seek a potentially forgivable PPP loan.
Likewise, while the two groups were rendered comparable in the percentage of each that planned to seek an SBA loan in general (see Table 1), it is unclear why none of the 27 nonprofits in the non-treatment group (57.4%) that planned to seek an SBA loan ultimately received PPP funds. Indeed, eventual PPP recipients were slightly more likely to plan to seek government grants in response to the pandemic at baseline (68.1% vs. 57.4%, p = .286), suggesting they may have had greater existing relationships and comfort with government funding sources writ large. On the other hand, nonprofits in the non-treatment group were slightly more likely to plan to seek lines of credit (14.9% of PPP recipients vs. 23.4% of non-recipients, p = .294) or private loans (2.1% vs. 8.5%, p = .168), and eventual receipt of these alternative funding sources may have obviated the pursuit of PPP loans, and/or they may have received SBA loans outside of PPP. Furthermore, nonprofits that did not receive a PPP loan were marginally more likely to report they were considering a merger due to the pandemic at baseline (6.5% of PPP loan recipients vs. 21.3% of non-recipients, p = .073).
In sum, there may have been small but noteworthy differences between the matched treatment and non-treatment groups in their motivation to pursue or ability to obtain a PPP loan (as opposed to other, perhaps less generous, types of emergency loans or measures) that at least partially accounted for differences in their performance on short-term resilience outcomes (Searing et al., 2021; Witmer & Sarmiento Mellinger, 2016). Such differences may bias the results we obtained (Harris & Horst, 2016), although the direction of the potential bias is unclear. We return to this potential limitation of the study below; nonetheless, these differences are relatively minor in comparison to the many covariates on which the two groups were rendered similar.
Hypothesis Testing
With the formation of well-balanced treatment and non-treatment groups across the large majority of covariates expected to influence PPP loan receipt and/or short-term sustainability outcomes, outcome variables were compared across groups via bivariate analyses to measure impact of the PPP loan program on nonprofit resilience (Harris & Horst, 2016). Effect sizes for the impact of PPP loans were derived from Cohen’s d and two-tailed independent-samples t test for continuous variables, and phi coefficient and chi-square test for binary variables. Effect sizes represent the average treatment effect on the treated (ATT). Operationalization of short-term sustainability outcome variables is described below, based on data collected in the winter 2021 follow-up survey.
The outcome of staff retention was operationalized in two ways: (a) by the change in reported staff FTEs from baseline to follow-up; and (b) by a checklist of binary variables indicating whether the nonprofit had made any of eight changes (primarily negative) to paid staffing levels since March 2020, including canceling planned employment contracts, delaying planned new hires, increasing staff workload, laying off employees, losing staff due to turnover, reducing staff hours, reducing staff pay or benefits, or increasing paid staffing in any form. These options are consistent with a wide range of payroll adjustment strategies identified by Young and Searing (2022).
Service maintenance was operationalized by a checklist of binary variables indicating whether the nonprofit had made any of eight changes to services and/or programming since March 2020, including incorporating new activities, adapting or adopting new strategies, introducing new programs or services, eliminating or suspending services, expanding services to new populations, making accommodations to provide in-person services, reducing number of clients served, or shifting services online.
Financial health was operationalized in three ways: (a) the change in self-reported months’ operating expenses covered by cash on hand and reserves from baseline to follow-up; (b) a binary indicator of whether the nonprofit had a reserve fund separate from cash on hand designated for emergencies and/or opportunities; and (c) a binary indicator of whether the nonprofit reported its budget (total revenues) increased or stayed about the same since March 2020.
Results
H1: Staff Retention
Table 2 displays the results of interest from hypothesis testing. No differences on outcome variables related to staff retention attained meaningfully large or statistically significant effect sizes across treatment and non-treatment groups, and as shown in the table, both groups lost FTEs on average during the first year of the pandemic. However, it is important to note that the lack of statistically significant findings at conventional levels (i.e., p < .05) for these and all other outcome variables included in Table 2 may have been due to the relatively small size and thus statistical power of the matched sample (n = 94).
Comparison of Means on Outcome Variables for Matched Sample (n = 94).
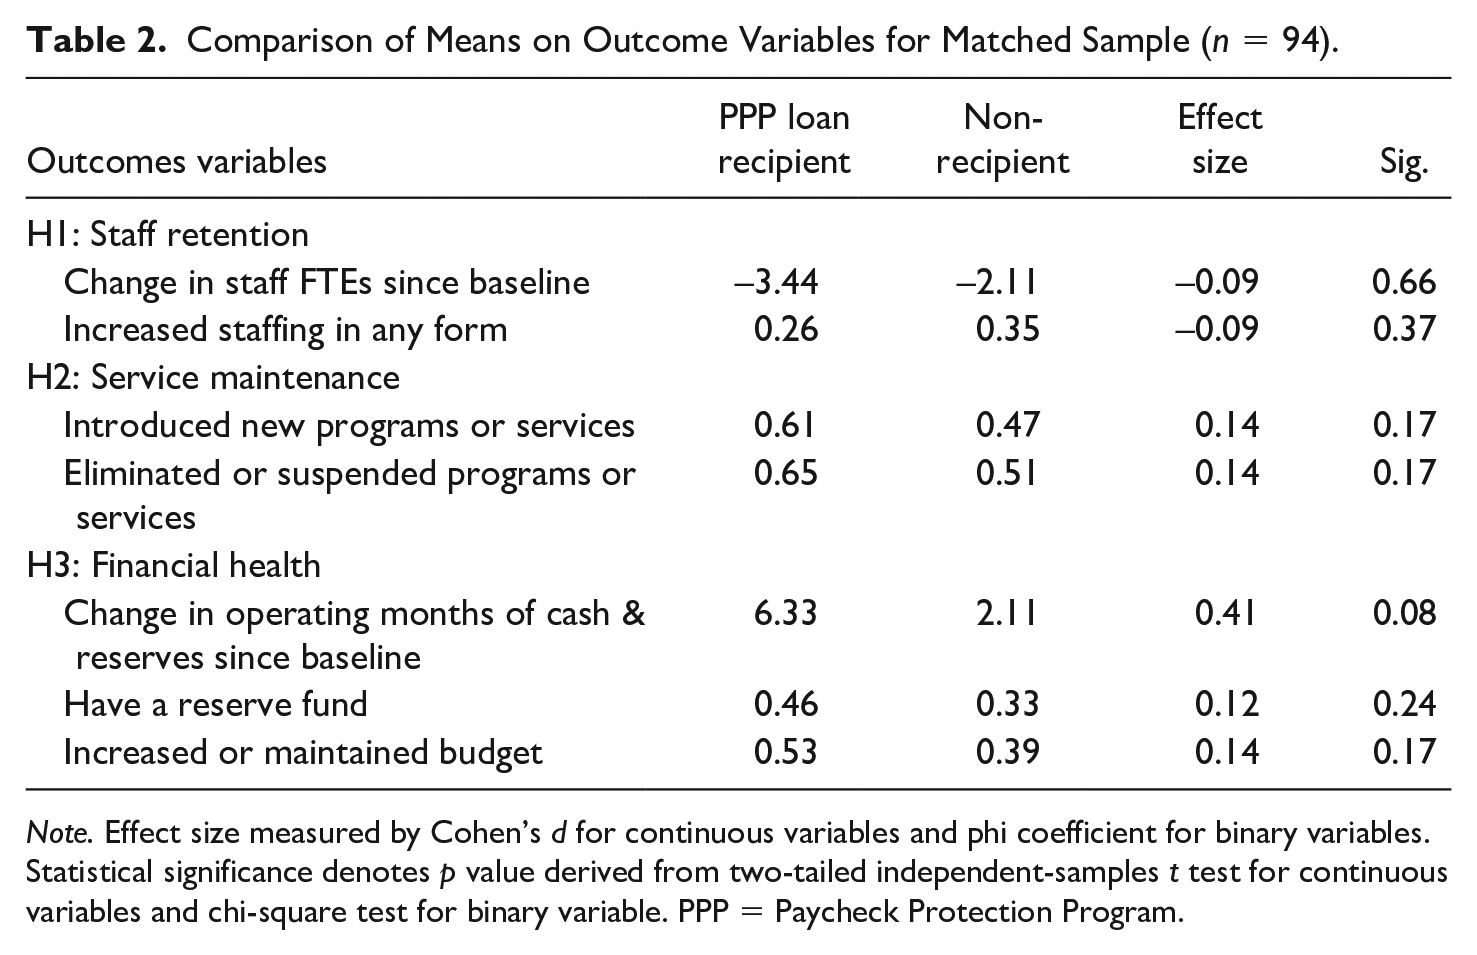
Note. Effect size measured by Cohen’s d for continuous variables and phi coefficient for binary variables. Statistical significance denotes p value derived from two-tailed independent-samples t test for continuous variables and chi-square test for binary variable. PPP = Paycheck Protection Program.
Furthermore, and not displayed in Table 2, loan recipients were not significantly more likely than non-recipients to lose staff due to turnover (30.4% vs. 23.9%, phi = 0.07, p = .482) or reduce staff hours (19.6% vs. 23.9%, phi = −0.05, p = .613). Thus, it does not appear that PPP loans substantially enhanced staff retention during the first year of the pandemic relative to the matched comparison group, despite that being an espoused purpose of the program (Li, 2021), and H1 was not supported.
Nonetheless, it is possible that PPP recipients benefited from a second draw of PPP loans after the follow-up survey, which may have enhanced longer-term staff retention beyond the period under study. Indeed, 57.4% of PPP recipients in the first round (n = 27) also received a second draw loan, with approvals granted as early as January 22, 2021, and there were high correlations between the loan amounts, r(27) = .985, p < .001, and reports of number of preserved jobs, r(27) = .867, p < .001, across draws. Still, first round PPP loan recipients were equally likely as non-recipients to report plans to increase staffing in 2021 according to responses to the winter 2021 follow-up survey (53.2% vs. 52.2%, p = .631).
H2: Service Maintenance
As shown in Table 2, PPP loan recipients were perhaps slightly more likely than non-recipients to introduce new programs or services (61% vs. 47%), as well as to eliminate or suspend services (65% vs. 51%), although such suspensions may have been temporary pending loan receipt or after initial loan funds were expended. Although not statistically significant (p = .170 for both), these items attained the largest effect sizes from the survey’s service maintenance checklist despite the small sample size. On the other hand, PPP loan recipients were not significantly more likely to incorporate new activities (73.9% vs. 63.8%, phi = −0.11, p = .294), adapt or adopt new strategies (71.7% vs. 63.8%, phi = −0.09, p = .415), nor shift services online (73.9% vs. 66.0%, phi = −0.09, p = .403), among other service maintenance items not included in Table 2.
Loan recipients were slightly more likely to report receiving earned income as a revenue source during the pandemic (37% vs. 22%, phi = −0.17, p = .110), which may have enhanced financial sustainability. In contrast, the two groups did not meaningfully differ on this indicator prior to March 2020 (40.4% vs. 36.2%, p = .671). Thus, PPP loans may have tentatively promoted some service adaptation and maintenance during the first year of the pandemic, but these outcomes were mixed and temporary at best, and H2 is not supported.
H3: Financial Health
As displayed in Table 2, PPP loan recipients increased the total coverage of their cash and reserve funds combined by an average of more than six operating months, compared with just over 2 months for non-recipients; this was the largest effect size attained of all outcome variables (phi = 0.41), although only marginally significant (p = .080). The two groups were the same on this metric at baseline (see Table 1), but by a year later, loan recipients could cover an average of 13.59 total months, compared with 7.80 months for non-recipients.
In fact, 64.3% of the increase in loan recipients’ total months’ operating funds can be attributed to increased reserves, compared with just 28.0% for non-recipients, who were instead more likely to increase cash on hand, suggesting that differential investment in reserves drove this marginal outcome. That said, in the follow-up survey, 46% of PPP recipients reported having a reserve fund compared with 33% of non-recipients, a difference that was not statistically significant (p = .240) within the relatively small sample size (see Table 2).
Finally, despite matching for baseline revenues, assets, and revenue diversification across groups (see Table 1), PPP loan recipients were slightly yet non-significantly more likely than non-recipients to report increasing or maintaining their budget during the first year of the pandemic (53% vs. 39%, p = .170), primarily driven by greater likelihood of budget maintenance (25.5% vs. 14.9%; results not shown in Table 2), which was also an espoused purpose of PPP (Li, 2021). It therefore does not appear that nonprofits receiving PPP loans simply stretched existing reserves by reducing their operating budgets. Thus, H3 is tentatively supported.
Sensitivity Analyses
To assess the robustness of results, four sets of sensitivity analyses were run with the matched sample. First, recipients of SBA EIDL loans and their matches were removed from the sample (n = 4 in each group). The four nonprofits that received EIDL funds, based on matched records from SBA (2021b), all also received PPP loans; EIDL amounts ranged from $20,400.00 to $150,000.00. Second, outliers and their matches were removed based on Mahalanobis distance calculated from all continuous matching covariates from Table 1 combined (n = 6 in each group; p < .001). Third, PPP loan recipients whose loans had not been forgiven based on the SBA PPP data and their matches were removed (n = 7 in each group). And fourth, all three of these sample restrictions were run simultaneously (n = 17 were removed from each group, resulting in a final matched sample size of n = 60).
For all sensitivity analyses, results were similar in direction and statistical significance to those reported above for the full matched sample. Removal of outliers, unforgiven loans, and the three restrictions combined all attenuated effect sizes and significance values on most continuous and binary outcome variables, resulting in smaller observed differences between treatment and non-treatment groups (results not shown). Results of sensitivity analyses therefore generally support the robustness of the results above but suggest additional caution in concluding that PPP loans had a meaningful impact on any of the three short-term sustainability outcomes.
Discussion
For nonprofits, PPP does not appear to have affected staffing, contrary to initial impacts of PPP found for small businesses (Autor et al., 2020; Hubbard & Strain, 2020). Furthermore, PPP’s impact on service maintenance was at best mixed and temporary and therefore had limited if any influence on recipients’ ability to sustain earned income during the pandemic and counteract recessionary trends (Mirabella et al., 2020; Stewart et al., 2021), not to mention serve their communities in a time of acute crisis (Hutton et al., 2021). That said, results of this study are preliminary and suggestive, due in part to the relatively small size of the final matched sample (n = 94 nonprofits), as well as additional study limitations summarized later in this article.
These preliminary results imply that nonprofits that received PPP loans were no more adaptive and resilient in general than their matched counterparts in terms of their willingness to experiment with service delivery throughout the pandemic to maintain stable revenues (Groshen, 2020). That said, potential existing resilience capacities in the areas of leadership style, improvisation, and motivation or mission commitment (Witmer & Sarmiento Mellinger, 2016), or what Young and Searing (2022) identify as an internal culture of entrepreneurship (or more precisely, “intrapreneurship”) and innovation, are less readily quantifiable than the survey measures operationalized for this study. Abstract and multi-faceted qualities of adaptive leadership (Hutton et al., 2021; Mumford, 2022) and organizational culture are particularly important to emphasize in models of nonprofit resilience and related studies going forward.
Where PPP appears to have most helped nonprofits, at least tentatively, is in providing liquidity and financial cushion in the form of reserves without further diminishing cash on hand (Kim & Mason, 2020; Searing et al., 2021). This enhanced slack seems critical to strengthening a nonprofit’s latent resilience capacity and may promote longer-term resilience beyond the single year covered in this study (Young & Searing, 2022), particularly as the pandemic continued, and new hazards struck, including Hurricane Ida.
Nevertheless, the question remains whether PPP may have enabled participants to amass a “prudent level of slack” in line with Young and Searing’s (2022, p. 162) “Goldilocks principle: not so much to render the organization wasteful or ineffectual but enough to ensure resilience in a crisis.” By early 2021, loan recipients had amassed over 1 years’ worth of operating expenses in combined cash on hand and reserves on average (6 months more than their counterparts), indicating healthy cushion. On the other hand, less than half of loan recipients had a reserve fund by 2021, suggesting that more financial slack is needed in the sector overall to promote broader community resilience (Hutton et al., 2021).
Why didn’t marginally increased financial reserves translate into more staff and service retention or even expansion within the year studied? It could be because PPP loans were seen (and indeed intended) as short-term and temporary, even after they were expanded through mid-2021 (Groshen, 2020; Hubbard & Strain, 2020; Salamon & Newhouse, 2020). Thus, recipients may have been wise to reallocate discretionary funds toward flexible savings as opposed to increasing liabilities through increased hiring above their baseline, especially as new variants of COVID-19 extended the pandemic throughout 2021 and beyond. Young and Searing (2022) advise that flexible staffing arrangements, such as engaging contract workers and volunteers, may promote nonprofit adaptability and resilience. On the other hand, these arrangements may simultaneously harm employee morale and individual well-being (e.g., if they lack benefits like health insurance and sick leave), potentially exacerbating burnout (Searing et al., 2021), and volunteer participation seems to have decreased during the pandemic (Hutton et al., 2021).
It appears that PPP at best partially achieved its objectives of stabilizing revenues, maintaining employee hours, and supporting service continuity (Li, 2021). It also appears that loans were more likely to go to larger, more professionalized and connected, and more diversified nonprofits that did not necessarily experience greater financial need, similar to for-profit businesses that received loans (Li, 2021). Future federal relief programs for pandemic or severe hazard might better target funds based on smaller organizational size and need, as subsequent rounds of PPP attempted to do. Furthermore, substituting financial tools such as lockdown insurance, revenue replacement programs, and maintained or expanded government grants and contracts for relatively flexible loans might help with targeting (Hubbard & Strain, 2020), although this could also exacerbate time lags, restrictiveness, and bureaucratic requirements (Mirabella et al., 2020).
To increase loan uptake among smaller organizations, which might benefit the most from emergency funding programs like PPP (Hubbard & Strain, 2020), governments, private banks, and/or nonprofit intermediaries might offer training, coaching, and technical assistance to guide organizations through the application process and related paperwork requirements. For instance, a community foundation based in New Orleans that supported this research implemented such a capacity-building intervention early in the pandemic (Mumford et al., 2022). PPP was not initially conceptualized with nonprofits in mind (Johnson et al., 2020), so technical assistance was even more necessary for small nonprofits considering whether and how to apply. For future iterations of similar programs, policymakers should more proactively engage with national nonprofit advocacy organizations like Independent Sector (https://independentsector.org/) to ensure that program requirements are either compatible with or adapted to nonprofits and as streamlined as possible.
Limitations
Findings are based in part on a relatively small sample of self-report surveys that may suffer from response and social desirability biases. Surveys reflect snapshots at two points in time, the most recent in winter 2021, while the pandemic and PPP were both ongoing and fluid and extended beyond the study period. It is possible that not all PPP and EIDL loan recipients were identified in the SBA (2021a, 2021b) data sets, or that non-recipients benefited from other SBA or federal funds, especially as 57% of non-recipients in the matched sample intended to seek an SBA loan at baseline, and 70% reported they had received one at follow-up.
It is also possible that unobserved covariates influenced pursuit and receipt of PPP loans, violating PSM’s conditional independence assumption for matching on all relevant covariates (Harris & Horst, 2016; Leonard et al., 2020). Perhaps nonprofits that initially expressed interest in pursuing an SBA loan and ultimately did not were in better financial position based on unobserved metrics than loan recipients, or that their loan applications were denied for unknown reasons. Nonprofits may have relied on fundraising and volunteers to substitute or supplement PPP resources to differing degrees (Hutton et al., 2021).
Loan recipients may have benefited in unobserved ways from adaptive leadership and internal culture qualities not incorporated into propensity scores (Young & Searing, 2022). At the same time, non-recipients may have benefited from unmeasured financial support through, for instance, a relationship with a parent nonprofit, program merger, liquidation of assets, leader self-sacrifice in the form of personal donations or forgoing a salary, or more effective community outreach and fundraising (Searing et al., 2021). At very least, despite our best efforts to control for selection into PPP, it seems possible that loan recipients were differentially motivated to pursue federal government support during the pandemic. Due to these potential biases, results of our analysis should be considered preliminary and exploratory.
Finally, generalizability is limited both by the regional purview and the truncated matched sample of PPP loan recipients. This study utilizes data from nonprofits operating in Greater New Orleans, which may have increased resilience because of the areas’ experience with historic Hurricane Katrina, a system-wide catastrophe not experienced in many areas prior to the pandemic (Jenkins et al., 2015). Experience with past events improves response systems, emergency funding availability, and resilience capacity (Paarlberg et al., 2020). Furthermore, the matched sample included only smaller nonprofits that received loans within the larger unmatched sample, and, as noted above, Hubbard and Strain (2020) found greater employment impacts for the smallest eligible for-profit businesses that received PPP loans.
Future Research
Longitudinal research is needed to track the influence of CARES Act and subsequent rounds of relief funding on nonprofit operations, the capacity to restore traditional funding streams, and employee retention over the long term, to surmise whether PPP contributed to recipients’ long-term resilience by enhancing financial slack (Young & Searing, 2022). The CARES Act was a stopgap measure, not a sustainable funding source for staffing and operating expenses. Inventories and analysis of communities and their characteristics are needed to identify what resilience looks like at the community and sectoral levels as the pandemic progressed, and whether public and private financial support were sustained, to explore the complex interplay between nonprofit and community resilience (Hutton et al., 2021; Mumford et al., 2022).
Furthermore, research is needed on more subjective impacts of the pandemic such as its psychological effects on nonprofit employee mental health (Hutton et al., 2021), which has been harmed by past hazards (Jenkins et al., 2015) and is important to organizational resilience (Searing et al., 2021). Research is likewise needed on the pivotal role of executive and board leadership in making tailored decisions to steer their organization through the pandemic in myriad ways (McMullin & Raggo, 2020; Mumford, 2022; Witmer & Sarmiento Mellinger, 2016), including through allocation of PPP funds, and whether and how an entrepreneurial culture influenced loan pursuit and receipt (Young & Searing, 2022). Due to the nuanced, situational, and process-oriented nature of these inquiries, qualitative and mixed method approaches would be preferable (Searing et al., 2021).
Finally, and most proximally, qualitative studies should explore why different nonprofits elected to apply for PPP loans or not, and the obstacles and barriers they perceived or experienced throughout the process. Such a focused inquiry would help to inform interventions to make public funding more accessible to nonprofits of all sizes in the future, which may have important equity implications (Mumford, 2022).
Conclusion
PSM proved a useful strategy for exploring PPP loans’ impact one year into the COVID-19 pandemic. Findings suggest that PPP tentatively supported nonprofit liquidity in the form of reserves, but not service maintenance, nor hiring and staff retention in excess of the non-treatment group. While preliminary, results question the short-term efficacy and cost-effectiveness of PPP for nonprofits compared with the program’s target population and objectives, although it appears PPP funds were potentially useful for enhancing recipients’ savings and capacity to weather future shocks (Kim & Mason, 2020).
Going forward, nonprofits will indeed face future financial shocks with implications for service continuity, financial sustainability, employee retention and well-being, long-term organizational solvency, and ultimately the resilience capacity of communities served. More work among policymakers, the public, and nonprofit stakeholders is needed to design interventions at multiple levels to stabilize the sector and sustain its contributions to compound hazard mitigation and management.
Footnotes
Declaration of Conflicting Interests
The author(s) declared no potential conflicts of interest with respect to the research, authorship, and/or publication of this article.
Funding
The author(s) disclosed receipt of the following financial support for the research, authorship, and/or publication of this article: Financial support for this research was provided by the Greater New Orleans Foundation, Greater New Orleans Funders Network, and University of New Orleans Tolmas Scholars Program.