
Abstract
This article examines whether it pays to be green in the microfinance industry. Environmental issues are important for all businesses around the world, and thus many microfinance institutions (MFIs) started embracing them as an additional objective alongside their traditional social and financial objectives. This article is among the first to test the relationships between environmental performance and both the financial and social performance of MFIs. Using a sample of 234 rated MFIs in 58 countries, we find that being green is associated with higher social and financial performance. Specifically, MFIs with environmental policies have higher financial performance (i.e., higher returns on assets, lower operating costs, and lower cost of capital) and higher social performance (i.e., a higher social rating score) than those without environmental policies. Overall, the results suggest that it pays to be green in the microfinance industry and this should motivate MFIs considering being green to do so.
Introduction
Microfinance is the provision of financial services to poor individuals and families, and their small-scaled entrepreneurial activities (Postelnicu and Hermes, 2018). Most microfinance institutions (MFIs) consider themselves to be hybrid organizations with dual objectives: financial sustainability and social performance (Beisland et al., 2019; Morduch, 1999). The social performance objective concerns the MFI’s contribution in the fight against poverty while the financial objective is about being financially sustainable in the long-run (Hudon et al., 2020). However, recently, another performance dimension of MFIs’ business activities has been highlighted as MFIs “are starting to consider their environmental bottom line in addition to their financial and social objectives” (Allet & Hudon, 2015, p. 395; also see Dorfleitner et al., 2021). Thus, MFIs are now moving from a double-bottom line of financial and social objectives to a triple-bottom line of financial, social, and environmental objectives, which is sometimes referred to as the “profit, people, and planet” approach (Rippey, 2011).
Even if environmental issues to a certain degree have been on the microfinance agenda for quite some time (see, e.g., GreenMicrofinance, 2007), they are “still one of the least often addressed dimensions in the microfinance sectoral literature” (Garcia-Perez et al., 2017, p. 3391; see also Forcella & Hudon, 2016). The main focus of the microfinance literature has been on the double-bottom line metrics, and the traditional view has been that these two traditional performance dimensions are often in conflict (Beisland et al., 2019; Morduch, 2000). However, a notoriously challenging aspect of empirical microfinance research has been to meaningfully measure MFIs’ social performance (Copestake, 2007; Hudon et al., 2020). To solve this problem, a relatively recent development has led to the provision of social performance ratings of MFIs, conducted by independent third-party rating agencies (Clark & Sinha, 2013). The rating reports contain a grade or score where a higher score indicates better social performance of an MFI (Beisland et al., 2019). Thus, the social performance ratings have eased the empirical research on relations between social performance and other aspects of microfinance. Moreover, social performance is increasingly attracting investors. According to the Microfinance Barometer 2019, nearly $13 billion were invested in socially responsible businesses (Convergences, 2019).
Overall, there has been little focus on environmental or “green” performance in emerging markets and developing countries where most MFIs operate (Lindlein, 2011). Fortunately, this is changing rapidly in many countries, and in the microfinance industry, there is an increasing interest in environmental issues (Forcella & Hudon, 2016); in fact, resilience to climate change was a top issue on the agenda of the European Microfinance Week 2019 (European Microfinance Platform, 2019). However, so far, little research exists on the relation between “the third bottom line”—green performance—and the traditional microfinance performance metrics (Garcia-Perez et al., 2017). This lack of academic focus is unfortunate, given the growing interest in environmental issues.
Allet and Hudon’s study (2015) is one of the few studies on green performance in the microfinance industry. They find no association between green performance and financial performance of MFIs. However, their study does not investigate the possible association between social performance and green performance. This relation is of interest to policy makers, donors, and investors focusing on social and environmental returns in addition to mere monetary payoff. Thus, the question this study seeks to be the first to answer is this: Are socially concerned MFIs also more likely to be environmentally concerned? If the answer is affirmative, green investors (or donors) can rely, at least partly, on social performance scores when choosing between MFIs. If the answer is negative, social performance scores are of no value to green investors, who may have to seek other sources of information when deciding which MFIs to invest in.
This study uses data from social performance rating reports and is supplemented by data from traditional financial rating reports. The study covers approximately 400 firm-year observations from 234 MFIs located in 58 countries. Our metric for environmental/green performance is a binary indicator variable, measuring whether or not an MFI has an environmental policy (EP) guiding its business operations. Consistent with our hypothesis, this study shows a significantly positive relation between the green and the social bottom line. This suggests that information on social performance appears to be of practical value for green investors or donors who may not otherwise have access to relevant metrics for “the third bottom line.” Contrary to the findings of previous studies (e.g., Allet & Hudon, 2015), the results further show that there is a positive relation between financial and environmental performance. Overall, this study suggests that it pays to be green in the microfinance industry—a finding that is documented in several studies in nonfinancial industries as well (e.g., Lefebvre et al., 2003).
The rest of this article is organized as follows. Section “Hypotheses Development” develops the hypotheses, section “Data and Methodology” presents the data sample and the research design, section “Empirical Findings” presents and discusses the empirical findings, and section “Concluding Remarks” concludes the article.
Hypotheses Development
The general wisdom regarding environmental performance is that attempts to protect the environment come with additional costs to the firm, which may reduce its competitiveness and hence lower financial performance (Ambec & Lanoie, 2008). However, in the past decades, this wisdom has been challenged by scholars such as Porter and Van der Linde (1995) who argue that environmental performance can improve a firm’s financial performance. Indeed, empirical findings support this new paradigm. For instance, Hart and Ahuja (1996) and King and Lenox (2001) suggest that pollution prevention comes with improved financial performance. Lefebvre et al. (2003) find that firms that implemented an environmental management system increased shareholder wealth through improved competitiveness, and several other studies (e.g., Aragón-Correa et al., 2008; Russo & Fouts, 1997) also find a positive relationship between environmental and financial performance.
Notably, the empirical findings of this line of research are ambiguous; some studies (e.g., Wagner et al., 2002) find that environmental performance reduces financial performance, supporting the traditional wisdom, while others (e.g., McWilliams & Siegel, 2000) suggest that environmental performance has no association with financial performance at all. Nonetheless, overall, it seems studies reporting a positive impact of environmental performance on financial performance dominate (see, e.g., Ambec & Lanoie, 2008). Thus, better environmental performance is associated with better financial performance.
Allet and Hudon (2015) and Forcella and Hudon (2016) provide initial evidence from the microfinance industry suggesting that there is no relationship between environmental and financial performance. These studies apply the Microfinance Environmental Performance Index (MEPI) developed by Allet (2012) as their metric for environmental performance. This index is constructed based on MFIs’ declarations and not third-party assessments of environmental performance. Because we use a different data set, more observations and a different metric of environmental performance, we start our analysis with an investigation of financial performance to check whether our data confirm the results of these two novel investigations.
Despite of the fact that Allet and Hudon (2015) find no significant association, they initially hypothesize that financial and environmental performance are positively related. The underlying line of reasoning is that environmental focus is resource-demanding and can only be afforded by profitable MFIs. Green management strategies “have higher upfront costs, such as the provision of green microcredit and environmental non-financial services” (Allet & Hudon, 2015, p. 398). This line of reasoning is logical, and we cannot rule out that the no-results reported in their study are due to a low number of observations. Moreover, recently, the banking industry has put strong emphasis on the risks banks face when they do not consider climate issues (Carney et al., 2019), and ESG (Environment, Social, and Governance) criteria have become core in rating agencies’ evaluations of financial institutions (Postigo et al., 2019). Thus, we follow Allet and Hudon (2015) and hypothesize that:
Our second focus in this study is the relation between social and environmental performance. As we will see in the remainder of this section, environmental performance is often regarded as one element in the social performance dimension in the microfinance industry. In their study of green microfinance in Europe, Forcella and Hudon (2016) specifically state that “historically, the business community considered that social responsibility encompassed both social and environmental performance” (p. 446). If the social and environmental performance dimensions are actually intertwined, then a positive association between them is expected.
Microfinance is generally presented as an important investment class for socially responsible investors (Beisland et al., 2021). Postelnicu and Hermes (2018), consistent with the United Nations Principles for Responsible Investment (United Nations, 2015), regard social responsible investments (SRIs) as investments that are motivated by ESG issues. It is not expected that investors particularly concerned with social issues will be attracted to entities performing poorly on the two other issues. Hence, a positive correlation between ESG issues seems reasonable. Similarly, Serrano-Cinca et al. (2016) build a credit-scoring model for microfinance that incorporates social and environmental performance. Environmental impact is included under what they refer to as “social criteria” in their model, and this suggests a positive association between social and environmental performance. Thus, overall, both Postelnicu and Hermes (2018) and Serrano-Cinca et al. (2016) seem to support the starting point of Forcella and Hudon (2016) that social and environmental performance metrics are positively related. In a similar vein, Allet and Hudon (2015), even though they do not study social performance, regard both social and environmental performance as part of Corporate Social Responsibility (CSR), which Fransen (2013) defines as “a firm’s voluntary actions to mitigate and remedy social and environmental consequences of its operation” (p. 213).
A slightly alternative view is presented in the microfinance literature review by Garcia-Perez et al. (2017), who argue that environmental aspects are the third axis of the sustainability concept (in addition to the social and economic axes). According to such a contention, environmental performance is not included in the social performance dimension. But, unfortunately, Garcia-Perez et al. (2017) did not identify any papers that studied the interrelationships between the three sustainability axes.
Lack of empirical evidence in the microfinance industry is a main motivation behind this study. Nonetheless, the few existing studies related to green performance in microfinance offer some relevance to our hypothesis development. For instance, Allet (2014) conducts a quantitative survey where the respondents are asked about motives of MFIs regarding green microfinance. Specifically, on a 5-point scale, the respondents were asked whether they agreed with a list of statements reflecting legitimation, competitiveness, and ethically responsible motives. Social responsibility shows up as the main driver of the environmental bottom line. The study differs from ours in that it seeks to understand the motives for “going green.” And notably, the results are based on subjective views of the MFIs themselves and not third-party assessments. Nonetheless, because of the finding that social responsibility is the main motivation for going green, we regard the study as a further support for the contention that there is a positive association between social and environmental performance. In fact, when developing research questions to be tested, Allet (2014) explicitly states that “promoters of green microfinance usually emphasize that ecological responsibility is closely intertwined with the MFI’s social mission” (p. 410). Another relevant empirical study is the recent investigation by Beisland et al. (2021) which finds that different aspects of social performance are significantly related to each other. Although none of the disaggregated metrics include environmental performance, the findings might suggest—as a general proposition—that nonfinancial aspects of performance are related.
Overall, when reviewing the scarce literature on environmental performance in the microfinance industry, we agree with Forcella and Hudon’s (2016) statement that “historically, the business community considered that social responsibility encompassed both social and environmental performance” (p. 446). Hence, we propose the following hypothesis:
Data and Methodology
Data Sample
We use hand-collected data from microfinance financial rating reports and microfinance social rating reports. The former, which have been around for some time in microfinance and are the “traditional” rating reports, analyze MFIs’ ability to reach their multiple operational and financial goals simultaneously (Beisland & Mersland, 2012). Their focus is on financial indicators, business model, governance and not on the MFIs’ social performance. Thus, there has been a need for assessments of social performance and a recent innovation in the microfinance industry is social performance rating reports. In contrast to financial performance, social performance is a loosely defined concept (Copestake, 2007) and, until recently, relatively crude proxies for social performance (e.g., average loan size and share of female clients) were applied in microfinance research (see, e.g., D’Espallier et al., 2017; Postelnicu and Hermes, 2018).
The social performance rating score reported in the social performance rating reports can be considered a superior social performance metric compared to the previously used proxies (Beisland et al., 2021). According to the rating agencies’ Social Rating Guide, a social performance rating is considered an expert view of the social performance of a financial institution and the degree to which the institution’s declared social goals are in line with recognized social values (Clark & Sinha, 2013). According to Beisland et al. (2021), “the specialized microfinance rating agencies are supposed to assess six common elements in deciding the social rating to be allocated to an MFI: country context, social performance management, social responsibility, depth of outreach, quality of services, and outcomes” (p. 4). The overall social performance rating score assigned by third-party rating agencies constitutes the main social performance metric used in this study.
As part of the social rating report, the rating agencies include information on the existence of environmental policies that guide or limit MFIs’ activities. The environmental assessment is qualitative, with no rating score assigned to the MFIs’ green performance. However, based on the information given in the rating report, we construct a binary variable for whether the MFI has an EP. Most MFIs do not have such policies (see below); therefore, we regard the presence of environmental policies as a measure of superior environmental performance, compared to those without such policies. The use of binary performance variables is common in the microfinance industry; for instance, Mersland et al. (2011) apply indicator variables for both gender bias and rural focus as social performance metrics in their global study of microfinance performance. One of the strengths of our measure is that it is based on third-party assessments. As Forcella and Hudon (2016) acknowledge, environmental performance is notoriously difficult to measure; therefore, researchers are often left with self-reported data.
Here are some examples that illustrate how the binary variable is applied. Planet Rating (2008) writes the following about the EP of the Montenegrin MFI AgroInvest: “AgroInvest is aware of the environmental risks related to the activities it finances but has not put in place strong policies to mitigate them” (p. 13). Thus, AgroInvest is considered to have no EP in place, and our binary variable is coded 0. In contrast, Planet Rating (2010) concludes that the Jordanian MFI Microfund for Women has listed “the activities it would not fund due to their negative impact on the environment” (p. 8). This MFI is considered to have an EP in place, and our binary, green performance, variable is coded 1. Other MFIs with environmental policies in place include the Azerbaijani MFI AzerCredit, which has implemented “a policy to prevent financing activities with high environmental impact” (MicroFinanza Rating, 2014, p. 18) and the Philippine MFI CEVI, which has taken “several initiatives to promote socially responsible practices towards the environment” (Planet Rating, 2009, p. 11).
The information in the social rating reports is not substantive enough for a continuous green performance score or index to be constructed. We recommend that this challenge be addressed in future research. It should also be noted that in this study we focus on the consequences of the microfinance business (Rippey, 2011) rather than the MFIs’ internal activities. We acknowledge that “an MFI’s activity does not directly generate a high environmental impact in terms of resource use, energy consumption, transport or emissions. However, activities financed by MFIs can have a high impact on biodiversity, pollution and waste generation” (Garcia-Perez et al., 2017, p. 3391). An implicit assumption in this study is that the environmental outcomes are superior when MFIs have explicitly defined environmental policies. We find this assumption reasonable, even though, similar to prior research within the area (Forcella & Hudon, 2016), we do not have data to directly measure this relationship.
As mentioned, our main metric of social performance is the independent social rating score assigned by three rating agencies Planet Rating, MicroFinanza Rating, and MicroRate. Notably, the agencies use different scales. For instance, MicroRate assigns from ½ to 5 stars, whereas MicroFinanza Rating assigns letters ranging from D to AAA, similar to traditional credit rating agencies. We follow the procedure outlined by Beisland et al. (2021) and transform the rating grades to a 10-point numerical scale, where 1 is the lowest and 10 is the highest score assigned.
As a robustness test, we construct an additive index based on the six universal standards for social rating of MFIs (Clark & Sinha, 2013) following Beisland et al.’s (2021) measurement of the standards (see Appendix, Table A1). The values of the index range from 2 to 14 and 14 means all the six standards are present. Notably, the rating agencies do dedicate some space in their reports to describe the EP of the MFI even if they do not indicate that this policy influences the social score. When we construct the Universal Standards Index (USI), we exclude elements in universal standard 1 that could have been influenced by environmental performance. Hence, we argue that this alternative social performance metric cannot have been affected by the level of environmental performance.
In addition, we also include the traditional proxies for social performance that have been widely used in microfinance research. The most used proxy (e.g, D’Espallier et al., 2017; Mersland et al., 2011) is average loan size, where a lower average is considered to be associated with a higher focus on poorer clients and hence higher social performance. We also use the percentage of female clients and a binary variable for rural focus (Mersland et al., 2011; Postelnicu and Hermes, 2018). Female clients and clients situated in rural areas are among the poorest and most vulnerable clients, and MFIs focusing on these groups are considered to have higher social performance, ceteris paribus (Beisland et al., 2021). Finally, we use total clients as an outreach variable (Copestake, 2007). A higher number indicates that more poor clients are reached, and thus higher social performance.
In terms of financial performance, we test along three dimensions: profitability, cost, and risk. We apply two standard profitability metrics: return on assets (ROA) and return on equity (ROE), and two indicators of cost: total operating costs (scaled by loan portfolio) and cost of capital. In terms of risk, we use PaR30 (PaR = portfolio at risk), the portion of the loan portfolio that is overdue more than 30 days (Gutiérrez-Nieto and Serrano-Cinca, 2007). Lankoski (2006) and Ambec and Lanoie (2008) argue that environmental performance has the potential to increase revenues, reduce cost (i.e., cost of capital, labor, materials, energy and services, and regulation), and reduce risk. In particular, better environmental performance could lead to lower cost of capital since “green or ethical mutual funds are getting more popular, which is providing green firms with a better access to capital” (Ambec and Lanoie, 2008, p. 56). As described below, we also include control variables in the multivariate analysis.
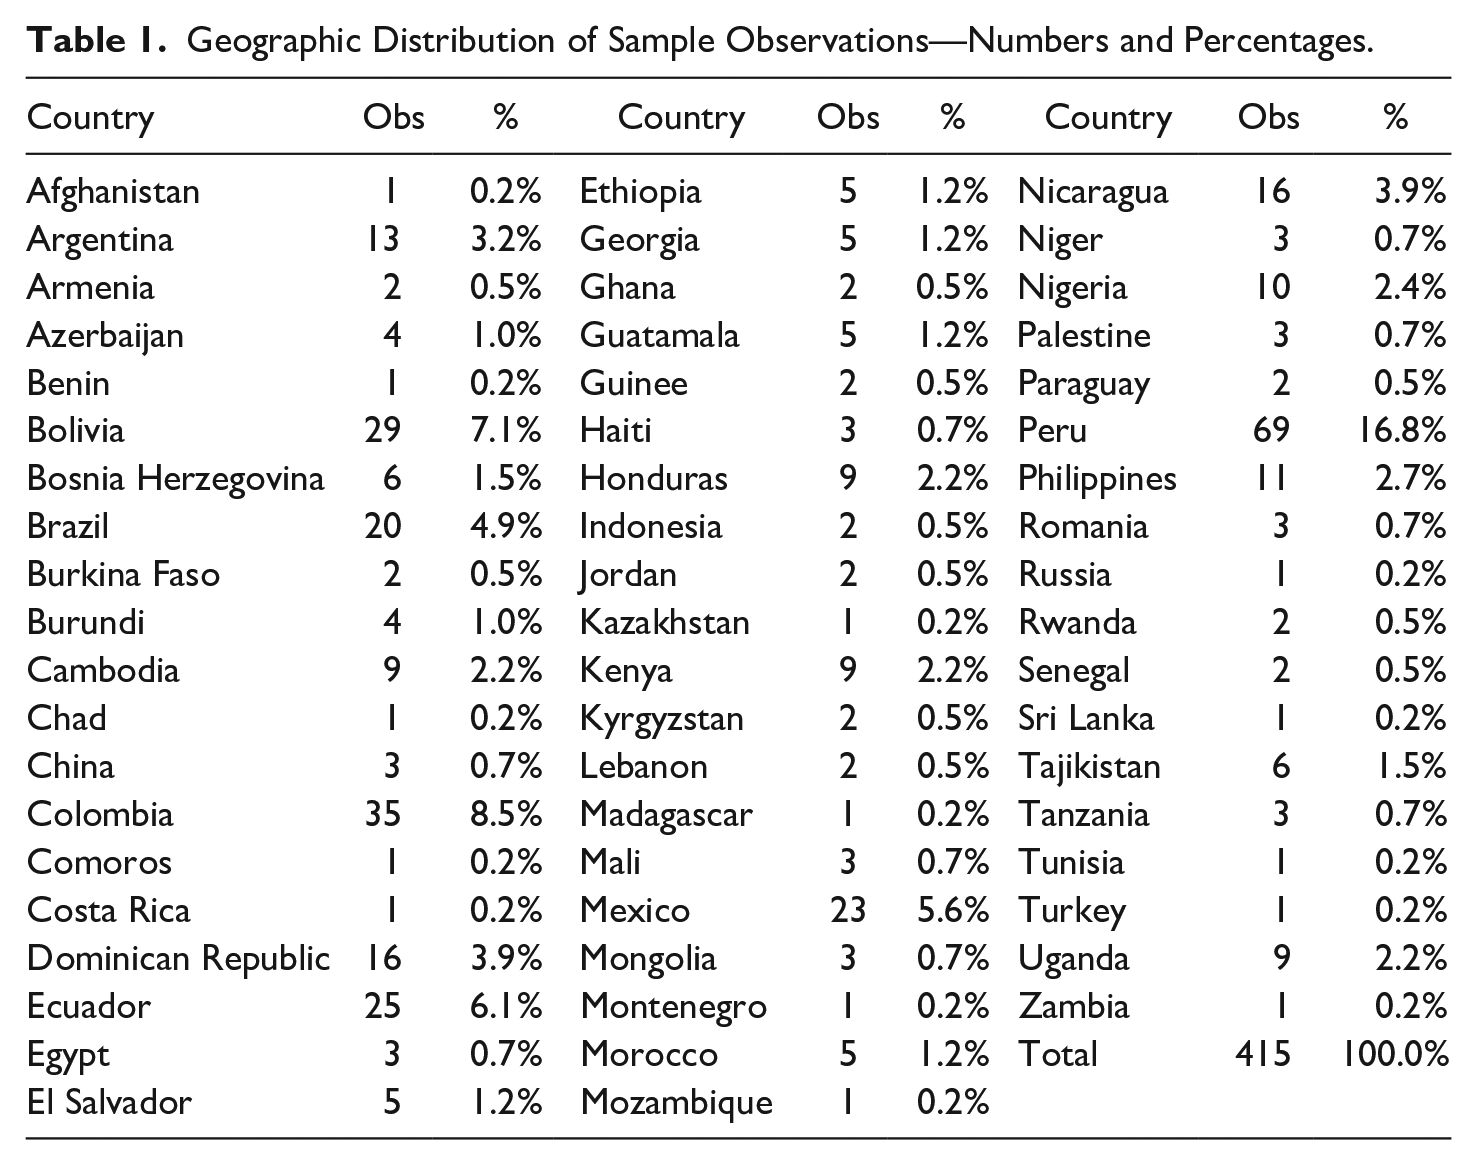
Data that are not found in the social rating reports are collected from the financial microfinance rating reports. The total number of observations in the data set employed is 415. These observations cover 234 MFIs in 58 countries; see Table 1 for more information on the geographical distribution. The observations are from 2005 to 2018, with the majority from 2010 to 2015.
Geographic Distribution of Sample Observations—Numbers and Percentages.
The reader should note that outside of the microfinance industry, several ratings and metrics systems are being applied and refined to provide information on the triple-bottom-line performance of firms. Examples of alternative metrics include the World Economic Forum’s Common Metrics for Responsible Capitalism (World Economic Forum 2020), the Global Impact Investing Network’s (2019) Impact Reporting and Investing Standards (IRIS+) which is a tool for impact measurement and management (IMM), and the Global Reporting Initiative’s (2021) Sustainability Reporting Standards. Such metrics may provide avenues for future research, but currently, we do not have any data available in the microfinance industry.
Research Design
We start the analyses with t-tests based on the binary variable for green performance (Forcella & Hudon, 2016). Following Allet and Hudon (2015), we proceed with a multivariate analysis, where green performance is regressed on other performance metrics and control variables. Because our green performance metric is binary, we use multivariate logit regression (e.g., Dorfleitner et al., 2021). Owing to missing information, the number of observations typically ranges from 149 to 270 in the multivariate analysis. The average number of observations per MFI is around 1.7, which makes panel data analysis inappropriate (Baltagi, 2013), and thus we treat the data as cross-sectional in the multivariate analysis. All conclusions are based on robust standard errors.
The regression model is as follows:
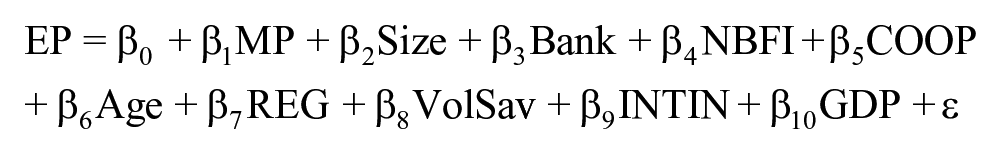
EP is the binary variable for green performance, and MP represents microfinance performance indicators, either financial performance or social performance. One microfinance performance variable is analyzed at a time due to nonoverlapping missing observations and multicollinearity challenges. The social performance variables analyzed are the (transformed) social rating score, USI, average loan size, percentage of female clients, rural focus (=1 if the MFI’s main focus is on rural clients, 0 otherwise), and the log of (to handle scale) the total number of MFI clients. Financial performance metrics are ROA, ROE, operating cost to loan portfolio, cost of capital (measured using borrowing cost), and PaR30. Following Allet and Hudon (2015), we control for size, MFI type/legal status, age, international initiator, and geographical location. Size is the log of total assets. For MFI type, we have four indicator variables: bank, nonbank financial institution (NBFI), cooperative, and nongovernmental organization (NGO). NGO is the left-out category in the regression analysis. Age is the number of years since the MFI initiated microfinance activities. We use gross domestic product (GDP) per capita to control for geographical location and development level of the country in which the MFI is situated.
Based on previous studies (Allet & Hudon, 2015; Forcella & Hudon, 2016), we expect that larger and more mature MFIs more often have environmental policies and the same goes for MFIs registered as banks. Allet and Hudon (2015) find limited geographical differences in green performance, but a priori, we expect a positive association between our EP variable and the level of economic development as measured by GDP per capita. International initiative (INTIN) is a binary variable equal to 1 if the MFI was initiated by an international organization and 0 otherwise. An internationally initiated MFI may be more environmentally concerned than locally initiated ones because most international initiators of MFIs are located in developed countries where sustainability issues are upheld.
In addition, we control for regulation and voluntary savings. Microfinance is an industry in which some entities are regulated while other are not (Hartarska & Nadolnyak, 2007). Regulation is a binary variable equal to 1 if the MFI is subject to banking regulations and 0 otherwise. Even if the country-specific regulations do not specifically cover environmental performance, we suspect that such regulation could have positive spillover effects on the likelihood of an MFI having environmental policies (see discussion in Beisland et al., 2015). Voluntary saving (VolSav) is a binary variable equal to 1 if the MFI accepts savings, 0 otherwise. This variable summarizes many of the differences in business models across MFIs and may therefore have an association with microfinance green performance metrics. Finally, in the regression model, the βs are regression coefficients and ε is the error term.
Descriptive Statistics
Descriptive statistics are presented in Table 2. We note that 30% (untabulated) of the 415 observations on green performance are equal to 1; that is, in these cases, the MFIs have defined environmental policies that guide and limit their operations. The average operating cost is 26% of the loan portfolio, the borrowing cost is 9%, and ROA and ROE are 4% and 11%, respectively. Five percent (5%) of the loan portfolio is overdue more than 30 days on average. On the 10-point scale for social performance, the average in our sample is 5.96, close to the median of 6. No MFI has a social rating score of 1—the lowest observation is 2—but we note that some MFIs have received the maximum score of 10. The USI has a mean value of 6.78 which is similar to the median value of 7. The lowest value of USI is 2 and maximum value is 14 which indicates that all the six universal standards are present. The average loan outstanding is $1197 and is higher than the median of $702 due to a right-skewed distribution; hence, we use log values in the multivariate analysis. On average, the percentage of female clients is 65%, illustrating that the typical microfinance client is a woman. Only 10% of the MFIs have a defined rural focus (note that binary variables’ descriptive statistics are not tabulated). The average number of clients of 51,810 which is higher than the median (21,116) (not tabulated); hence, we use log values in the regressions.
Descriptive Statistics.
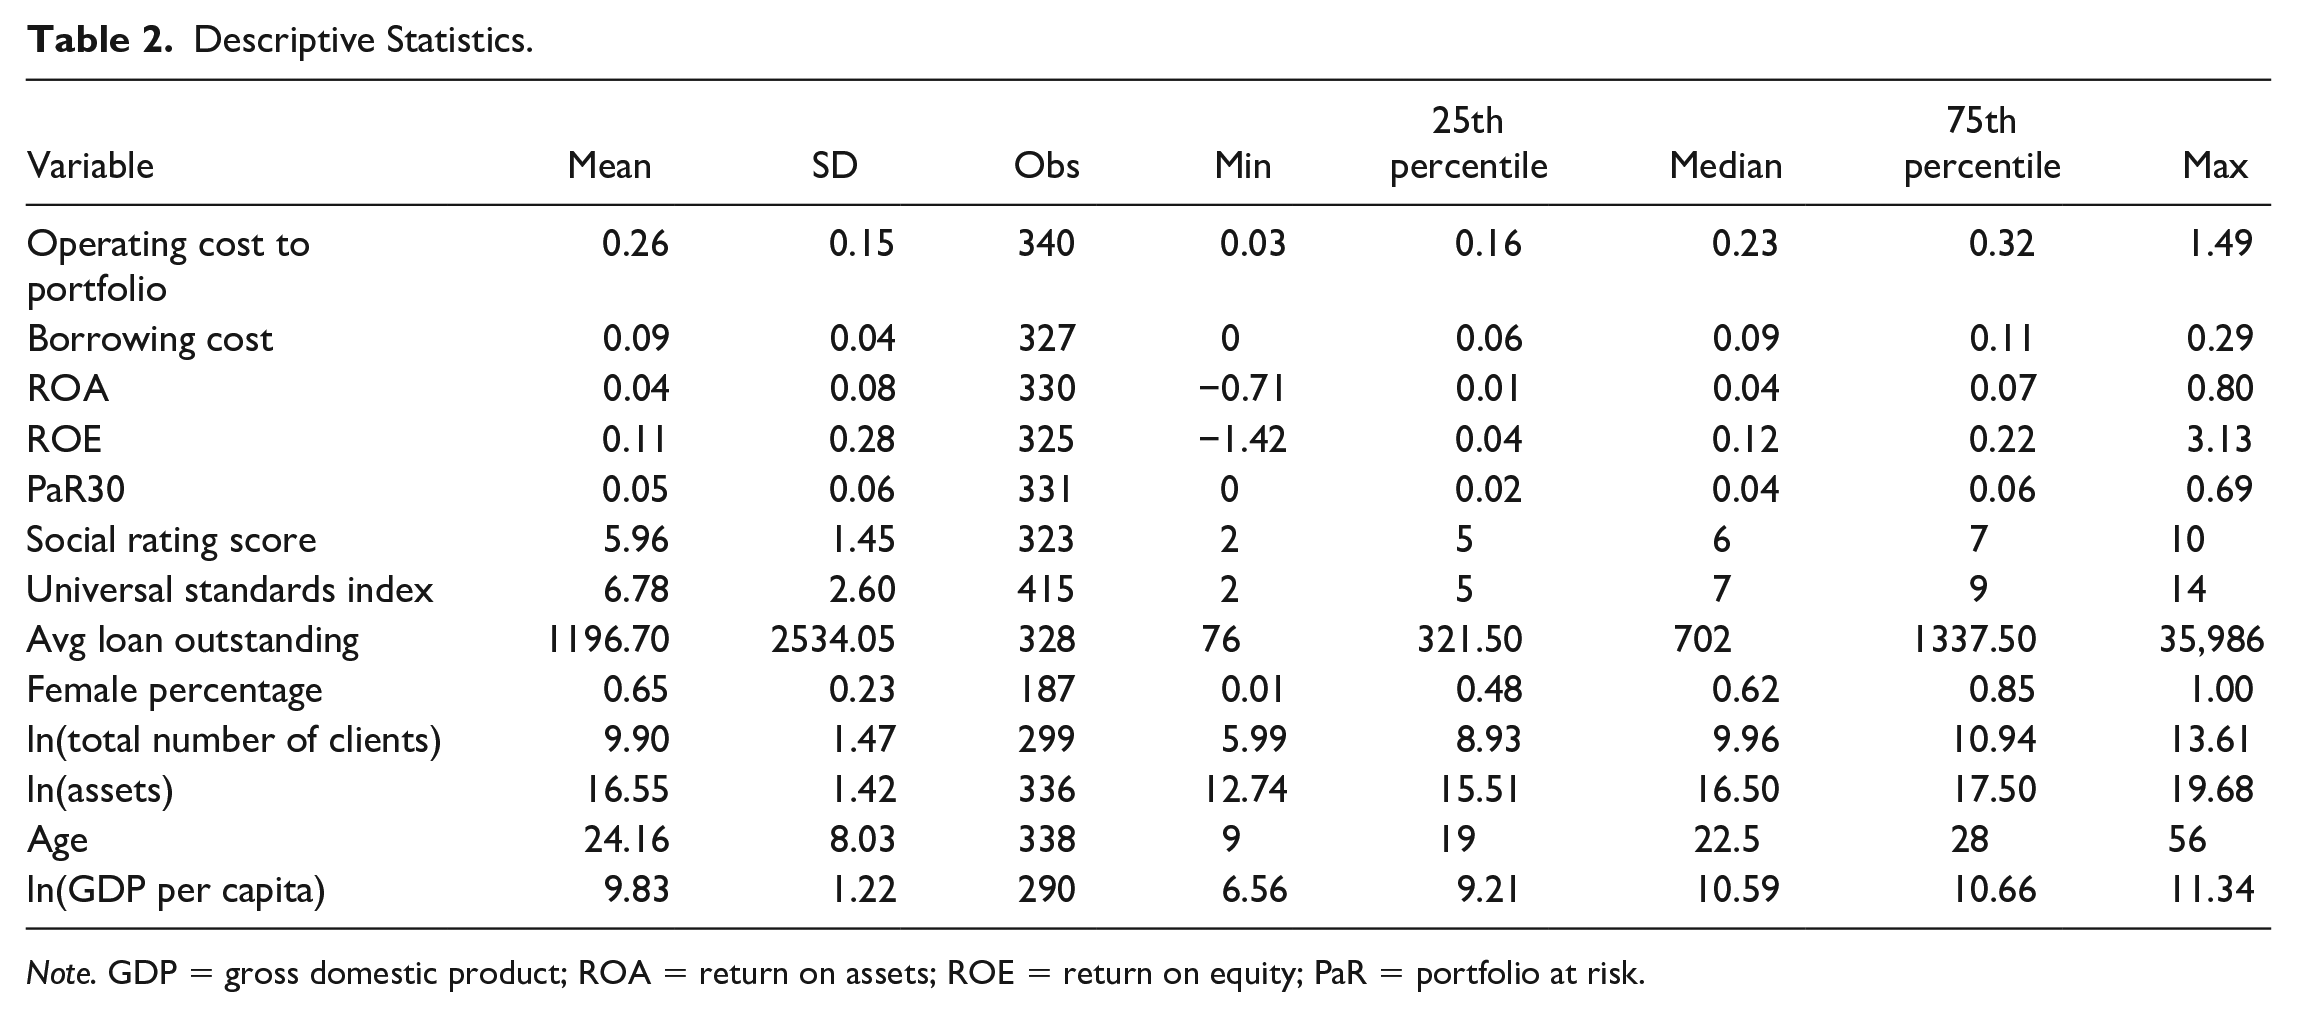
Note. GDP = gross domestic product; ROA = return on assets; ROE = return on equity; PaR = portfolio at risk.
As for the control variables, we note that the mean log of assets is 16.55, which is close to the median and illustrates that the log is much more symmetrical than the original variable, which is significantly skewed to the right. Nontabulated data show that the average of total assets is $40 million, whereas the median is $14 million. Seven percent (7%) of the MFIs in the sample are banks, 33% are NBFIs, 12% are cooperatives, and 48% are NGOs.
The average MFI has been offering microfinance services for 24 years. Note that some entities might be older, but we only measure the period the MFI has been operating in the microfinance industry. Forty percent (40%) of the observations are of regulated MFIs, whereas 30% accept voluntary savings and about 43% of the observations come from MFIs initiated by an international organization, illustrating the strong international influence in the industry (Mersland et al., 2011).
Table 3 displays the pairwise Pearson correlation coefficients between the explanatory variables. We note that some of the performance variables are highly correlated, as expected, though not at problematic levels for inclusion in the regression models (Kennedy, 2008); moreover, each performance variable is used in a separate regression. For instance, PaR30 is significantly positively correlated with operating cost and significantly negatively correlated with ROA, ROE, the social performance rating score, and female percentage. Moreover, as expected, female percentage is positively correlated with the social rating score and negatively correlated with average loan size, the most heavily used social performance metric in traditional microfinance research (Mersland & Strøm, 2010). As expected, the USI is significantly and positively associated with the social rating score. Unsurprisingly, the correlation coefficients between the performance metrics and the control variables are often significant; thus, the choice of control variables seems reasonable. But, obviously, these relations might change in a multivariate setting.
Pairwise Pearson Correlations.
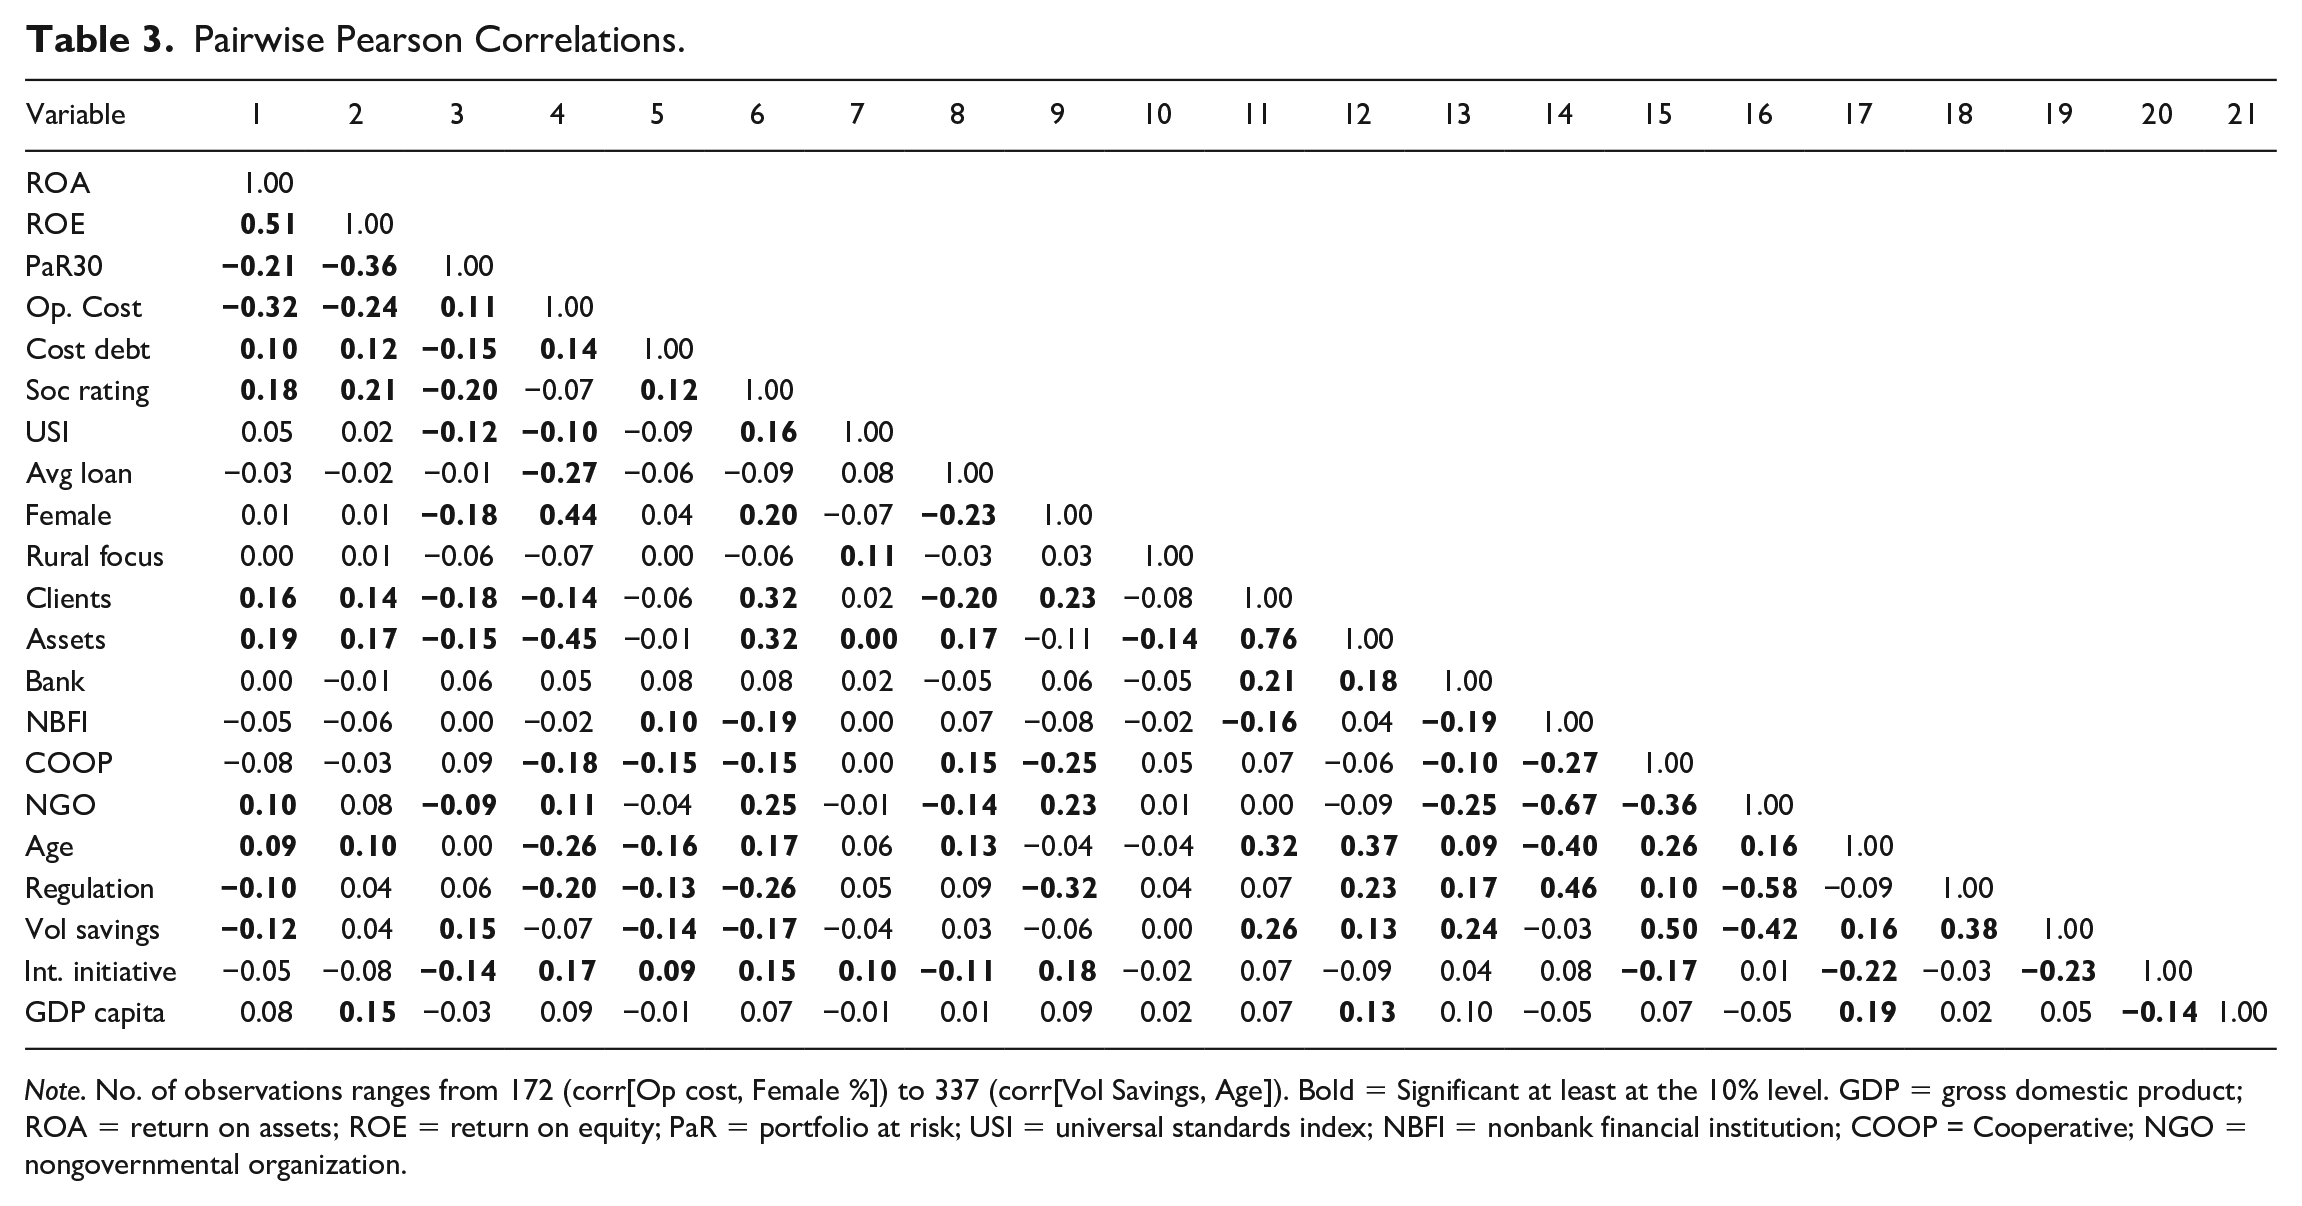
Note. No. of observations ranges from 172 (corr[Op cost, Female %]) to 337 (corr[Vol Savings, Age]). Bold = Significant at least at the 10% level. GDP = gross domestic product; ROA = return on assets; ROE = return on equity; PaR = portfolio at risk; USI = universal standards index; NBFI = nonbank financial institution; COOP = Cooperative; NGO = nongovernmental organization.
Empirical Findings
Bivariate t-Tests
We start the empirical investigation with t-tests for differences in means. Specifically, we examine whether the means of the explanatory variables are different for MFIs that have an EP compared to those without one. The results are displayed in Table 4. For the financial performance variables, we find clear indications that financial performance is higher for MFIs with environmental policies; operating cost ratio, borrowing cost, and risk (PaR30) are lower, and ROA is higher. Thus, there is support for the contention of previous studies (e.g., Allet & Hudon, 2015; Hart & Ahuja, 1996) that green performance is positively associated with financial performance.
t-Tests Comparing MFIs With and Without Environmental Policies.
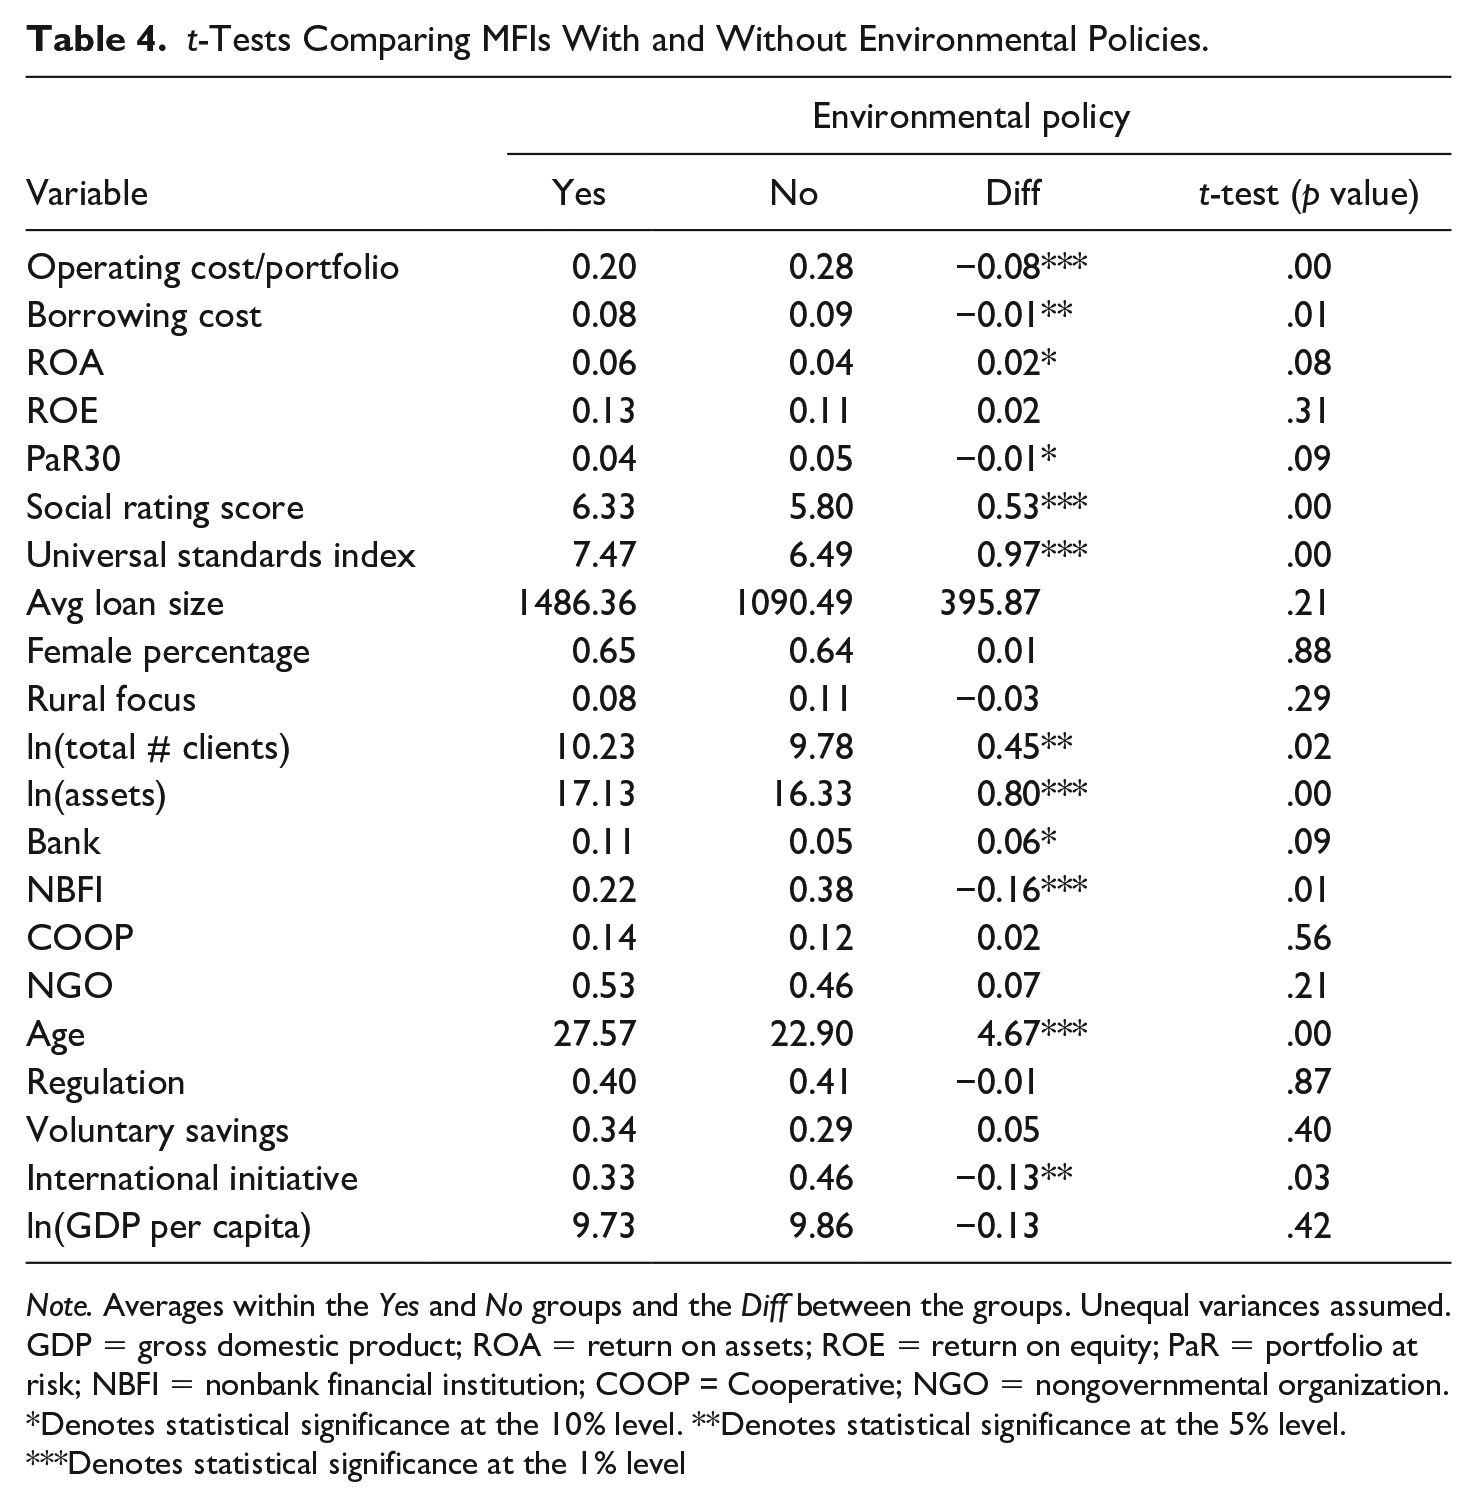
Note. Averages within the Yes and No groups and the Diff between the groups. Unequal variances assumed. GDP = gross domestic product; ROA = return on assets; ROE = return on equity; PaR = portfolio at risk; NBFI = nonbank financial institution; COOP = Cooperative; NGO = nongovernmental organization.
Denotes statistical significance at the 10% level. **Denotes statistical significance at the 5% level. ***Denotes statistical significance at the 1% level
For the social performance score, we find statistically strong results as measured with the t-tests. The average social rating score is 6.33 for MFIs with environmental policies in place compared to 5.80 for MFIs without such policies. Similarly, the means of the USI are also significantly different between MFIs with (7.47) and those without (6.49) EP. However, Beisland et al. (2021) find strong positive associations between MFI size and social performance rating scores. Both as measured by total clients and total assets, the t-tests strongly suggest that MFIs with environmental policies are bigger than other MFIs. Therefore, the difference in social performance scores between the MFIs that have and do not have environmental policies might be a mere size effect. The difference might also be an age effect; Beisland et al. (2021) suggest that social performance scores can be a function of age and the t-tests suggest that MFIs with environmental policies are significantly more mature than others. Overall, the t-tests illustrate the importance of control variables and provide interesting indications of statistical associations; however, we must await the multivariate regressions in order to draw strong conclusions.
We note that although the t-tests suggest differences in social rating scores between our two groups of MFIs, Table 4 does not display any significant differences in average loan size, female percentage, and rural focus. Thus, the results on social performance differ based on whether the new social performance metrics (social rating score and universal standards) or the traditional social performance metrics are analyzed. These findings might be related to the long-standing discussion on social performance measurement in the microfinance industry, where the traditional social performance metrics have been criticized for being too crude to serve as proxies for social performance (Bédécarrats et al., 2012; D’Espallier & Goedecke, 2019). If the measures are too crude or inaccurate, differences in social performance between two groups of MFIs might be difficult to detect. The introduction of social performance ratings is an important response to the criticism on the traditional metrics. As mentioned above, we regard the social rating scores and USI as the superior social performance measures among the existing alternatives. However, given the large attention that traditional metrics have received in prior microfinance research, we do include these metrics in the multivariate analysis presented in the next subsection.
We conclude this subsection with an analysis of possible differences between MFIs based on legal incorporation (or MFI type). We note that there are significant differences, in particular for NBFI MFIs. NBFIs constitute 22% of the MFIs that have environmental policies in place, compared to 38% of the MFIs that do not have environmental policies. A more instructive way to look at differences between MFI types is simply to look at the EP percentages of the various legal incorporations. In the total sample, 30% of the MFIs have environmental policies that guide and limit their operations compared to 50% for banks, 20% for NBFIs, 33% for COOPs, and 33% for NGOs. Far more banks, relatively speaking, are found to have environmental policies. The finding that banks are the MFIs with the highest level of green performance is consistent with the study of Allet and Hudon (2015). Finally, the difference in means of INTIN between MFIs with and without environmental policies is significant. A smaller number of MFIs that are internationally initiated have environmental policies and this finding is somewhat unexpected, see discussion above.
Multivariate Analysis
We now present the results of the multivariate logit regression. We start with a brief discussion of financial performance and its relation to green performance, which is more or less a replication of the Allet and Hudon (2015) study, but with a larger sample and a different definition of green performance.
The multivariate analysis of financial performance is presented in Table 5. We find evidence of better financial performance for MFIs with green performance compared to those without it. Specifically, MFIs with environmental policies have lower costs (i.e., operating cost and cost of capital) and a higher return on assets (ROA). Note also that ROE and PaR30 have positive and negative coefficients, respectively, even though they are statistically insignificant. These multivariate results generally mirror those of the bivariate t-tests. The findings suggest that green MFIs have better access to capital at lower cost (Ambec & Lanoie, 2008) and improved possibilities to increase revenue (Ambec & Lanoie, 2008; Lankoski, 2006). As the awareness of environmental protection increases in all parts of the world, MFIs that market themselves as green could potentially attract new clients that are particularly enthusiastic about environmental issues.
Multivariate Logit Analysis of Environmental and Financial Performance.
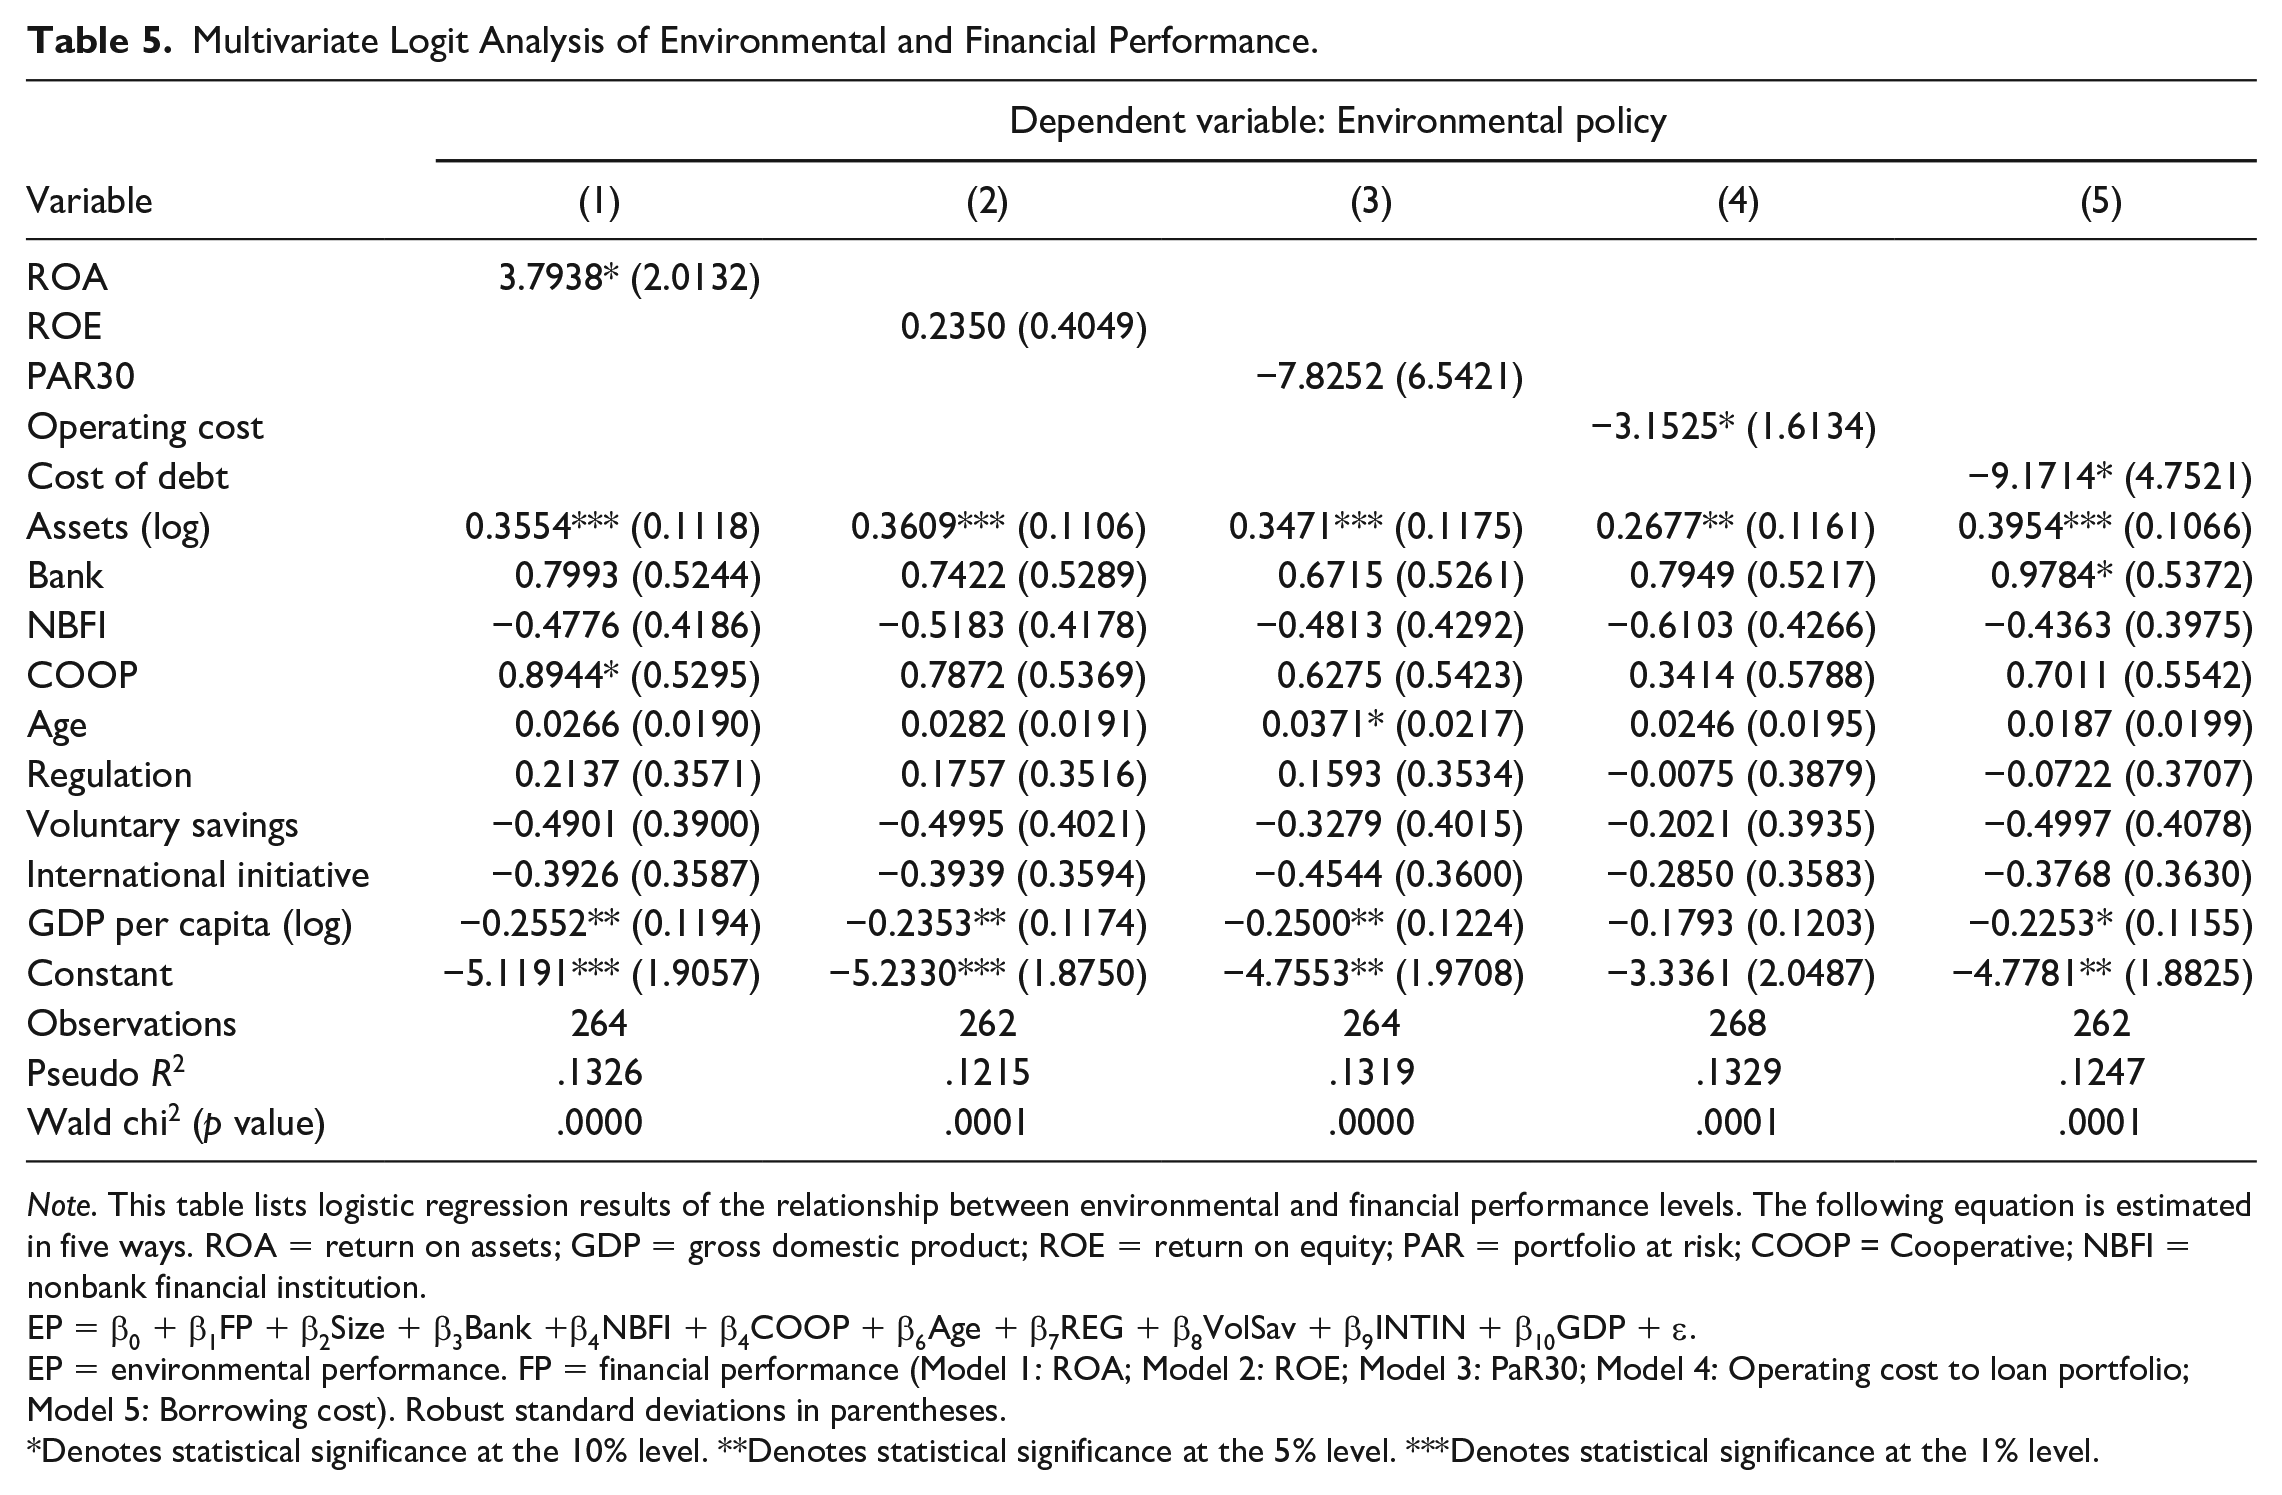
Note. This table lists logistic regression results of the relationship between environmental and financial performance levels. The following equation is estimated in five ways. ROA = return on assets; GDP = gross domestic product; ROE = return on equity; PAR = portfolio at risk; COOP = Cooperative; NBFI = nonbank financial institution.
EP = β0 + β1FP + β2Size + β3Bank +β4NBFI + β4COOP + β6Age + β7REG + β8VolSav + β9INTIN + β10GDP + ε.
EP = environmental performance. FP = financial performance (Model 1: ROA; Model 2: ROE; Model 3: PaR30; Model 4: Operating cost to loan portfolio; Model 5: Borrowing cost). Robust standard deviations in parentheses.
Denotes statistical significance at the 10% level. **Denotes statistical significance at the 5% level. ***Denotes statistical significance at the 1% level.
Overall, the results lend support to our Hypothesis 1 that there is a positive association between green performance and financial performance in the microfinance industry. The results are consistent with those of several nonmicrofinance studies (e.g., Hart & Ahuja, 1996; King & Lenox, 2001) but inconsistent with those presented by Allet and Hudon (2015) and Forcella and Hudon (2016). Our results differ from those of Allet and Hudon (2015) and Forcella and Hudon (2016) probably because of the use of a different measure of environmental performance and a larger sample. Thus, our study is among the first in the microfinance industry to document a positive relation between financial and green performances.
The results on the relation between green performance and social performance are presented in Table 6. The main variables of interest are the social performance rating score and the USI. The t-tests presented in Table 4 suggested a significantly positive association between these variables and the likelihood that an MFI has formalized environmental policies to guide its operations. Similarly, in the multivariate setting, the results are significant; we can then conclude from this multivariate analysis that there is an association between green performance and social performance.
Multivariate Logit Analysis of Environmental and Social Performance.
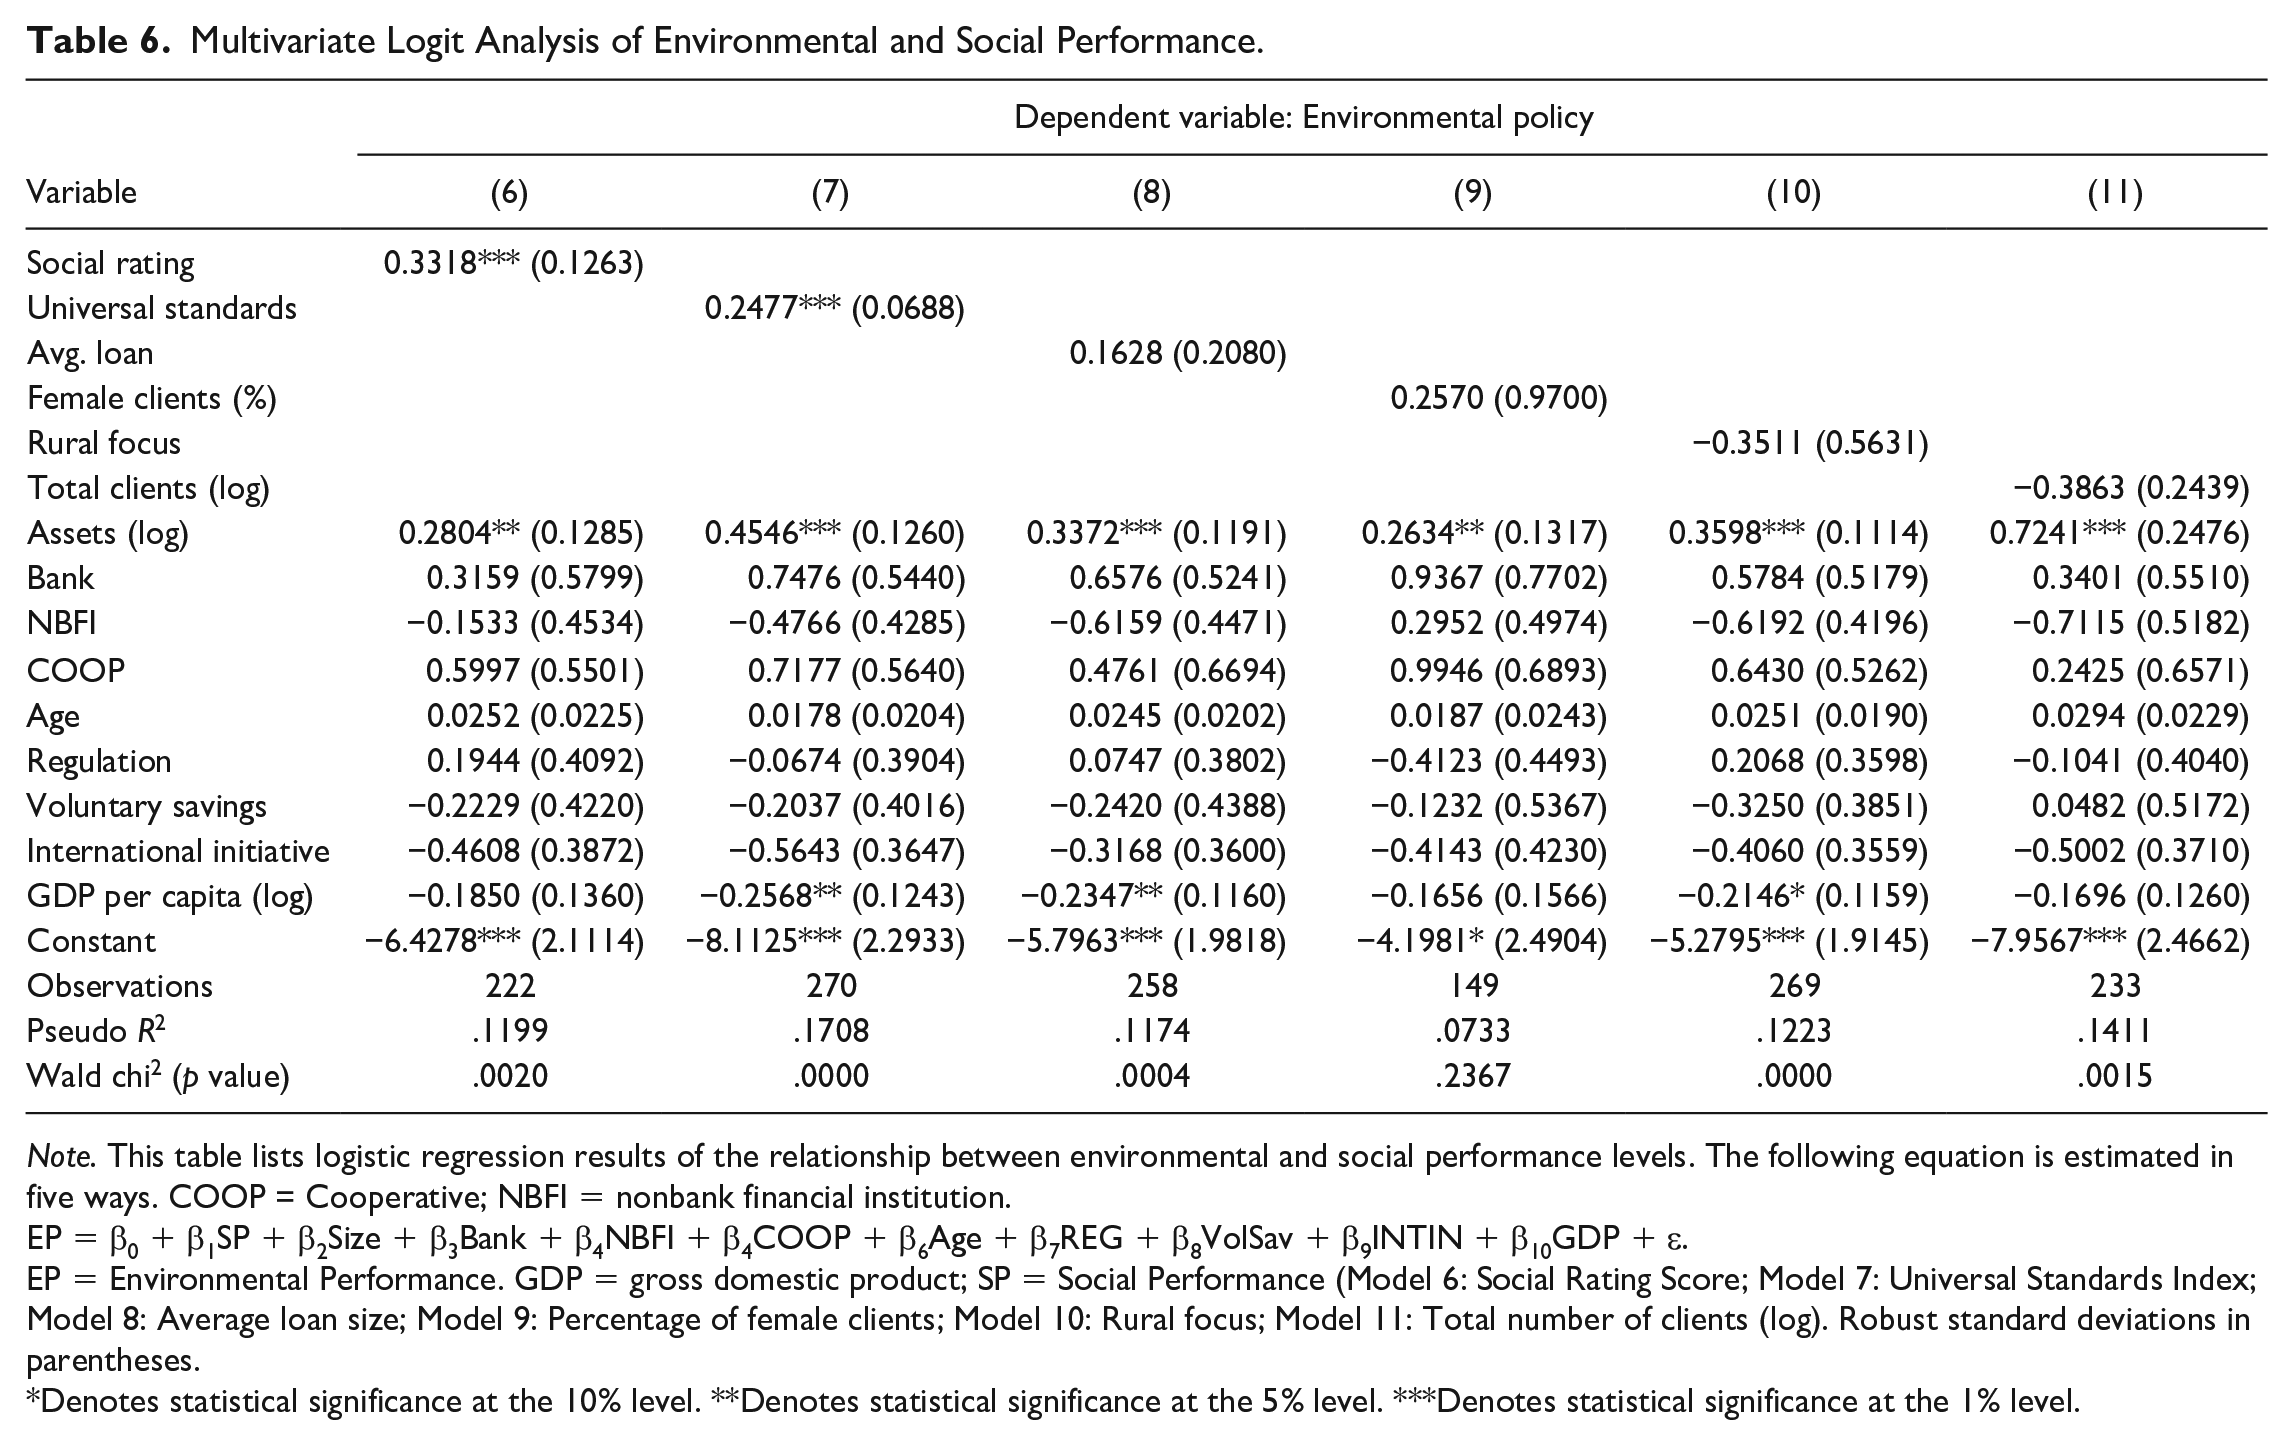
Note. This table lists logistic regression results of the relationship between environmental and social performance levels. The following equation is estimated in five ways. COOP = Cooperative; NBFI = nonbank financial institution.
EP = β0 + β1SP + β2Size + β3Bank + β4NBFI + β4COOP + β6Age + β7REG + β8VolSav + β9INTIN + β10GDP + ε.
EP = Environmental Performance. GDP = gross domestic product; SP = Social Performance (Model 6: Social Rating Score; Model 7: Universal Standards Index; Model 8: Average loan size; Model 9: Percentage of female clients; Model 10: Rural focus; Model 11: Total number of clients (log). Robust standard deviations in parentheses.
Denotes statistical significance at the 10% level. **Denotes statistical significance at the 5% level. ***Denotes statistical significance at the 1% level.
Regarding the traditional measures of social performance, we do not find any relation between green performance and average loan size, female percentage of clients, rural focus of MFIs, and number of active clients. We argue that these metrics are cruder and more inaccurate measures of social performance. This probably explains why the empirical findings on these traditional measures of social performance are different from those of the preferred alternatives, the social rating score and USI.
Overall, the significant findings for the social rating score and the USI (in both t-tests and multivariate settings) are consistent with Hypothesis 2—that there is a positive association between social performance and environmental performance in the microfinance industry. Our investigation is the first to provide empirical support to previous studies (e.g., Forcella & Hudon, 2016; Postelnicu and Hermes, 2018; Serrano-Cinca et al., 2016) which argue that social and environmental performance metrics are positively related. For instance, Forcella and Hudon (2016) argue that “historically, the business community considered that social responsibility encompassed both social and environmental performance” (p. 446).
We note that the other control variables are generally insignificant. However, we would like to stress that based on the t-tests, we expected some differences between MFI types. Table 4 illustrates that far more banks than NBFIs have environmental policies in place. Similar results are found in the multivariate setting (Tables 5 and 6), but with weak statistical significance. We suspect that the small sample size makes it difficult to detect statistically significant differences between MFI types in a multivariate setting. Banks, for instance, constitute only 7% of our sample (see Table 2). Both the t-tests and the multivariate results indicate that larger MFIs are associated with green performance, which is consistent with the literature (e.g., Allet & Hudon, 2015).
Finally, we would like to point out that GDP per capita is found to be negatively associated with green performance and this finding is unexpected: we expected that developed countries, relatively speaking, are also the countries with the strongest focus on green performance. Our analysis suggests that the focus on environment does not necessarily depend on a country’s economic development level.
Concluding Remarks
Traditional microfinance performance research has typically treated MFIs as hybrid organizations with both financial and social objectives. However, a third dimension of microfinance performance is becoming increasingly important. In this study, we examine the association between the existence of environmental policies in the MFI, which is our measure of green performance, and financial and social performance metrics.
Contrary to prior microfinance research (Allet & Hudon, 2015; Forcella & Hudon, 2016), we find a positive association between green performance and financial performance. In addition, a novel contribution of this study is the investigation of the relation between green and social performance. We are able to document a statistically significant positive association between green performance and social performance using social rating score, and USI as our metric of social performance. We do not however find any associations between green performance and the traditional metrics (e.g., average loan) for social performance.
The findings that green performance is associated with both better financial and social performance may have positive implications for the MFIs and investors in the industry, as well as for environmentally concerned stakeholders. A priori, we hypothesized a positive relation between financial performance and green performance, though we also highlighted that previous research on MFI data had not discovered such a positive relationship. Thus, our findings illustrate that environmental concerns do not have to hamper an MFI’s financial performance.
Interestingly, rating agencies are currently considering including green performance as a seventh dimension of the Universal Standards for Social Performance (Convergences, 2019). The social rating score may then become an even stronger indication of the environmental performance level than suggested by our study. A challenge in this regard is that most MFIs are not subject to social ratings. Thus, valuable information about an MFI’s social and green performance is not becoming available. This is unfortunate not only for the MFI itself but also for the multiple microfinance stakeholders including the investors. Our study suggests that traditional metrics for social performance may not only be crude; in addition, they seem to poorly capture the environmental performance level of MFIs.
This study is as far as we know the first to empirically examine the association between green and social performance in the microfinance industry. We believe it is of importance for investors, donors, and policy makers to know whether the social and financial performance levels of MFIs also provide indications of the often undocumented green performance level. We contend that much more research is needed on the topic. In modern business ethics research, it is probably unnecessary to mention that the green performance dimension is of vital importance in microfinance as in all other businesses. Therefore, new empirical studies on alternative and hopefully larger samples would be welcome. And more effort needs to be put into designing alternative measures of green performance (e.g., use of factor analysis) as this performance dimension is not necessarily easily measurable. A particularly important topic to study in future research is the long-term consequences of environmental policies and other metrics for superior environmental performance. Moreover, we expect that regulations can affect both the actual environmental performance and the reporting of such performance. Hence, we will encourage future studies to look into possible relations between microfinance regulations and environmental performance.
Notably, we acknowledge that the association between green performance and other performance metrics is possibly subject to reverse causality challenges. A solution to reverse causality is often instrumental variables regression techniques. We do not have variables that we regard as reasonable to use as instrumental variables in our study and such techniques are in any case methodologically troublesome to use whenever the dependent variable is binary. Therefore, we refrain from discussing causal effects in this study and merely investigate associations. This endogeneity problem represents a clear challenge in the research on green performance, but we suggest that the use of survey evidence could be a fruitful avenue for future research.
Finally, we note that there are currently many attempts to design performance metrics that capture the triple-bottom-line performance of firms and organizations. As (if) data become available, future studies could employ performance metrics issued by, for instance, the Global Impact Investing Network, the Global Reporting Initiative, the World Economic Forum, and the United Nations in wide microfinance performance investigations.
Footnotes
Appendix
Definitions of the Six Universal Standards.
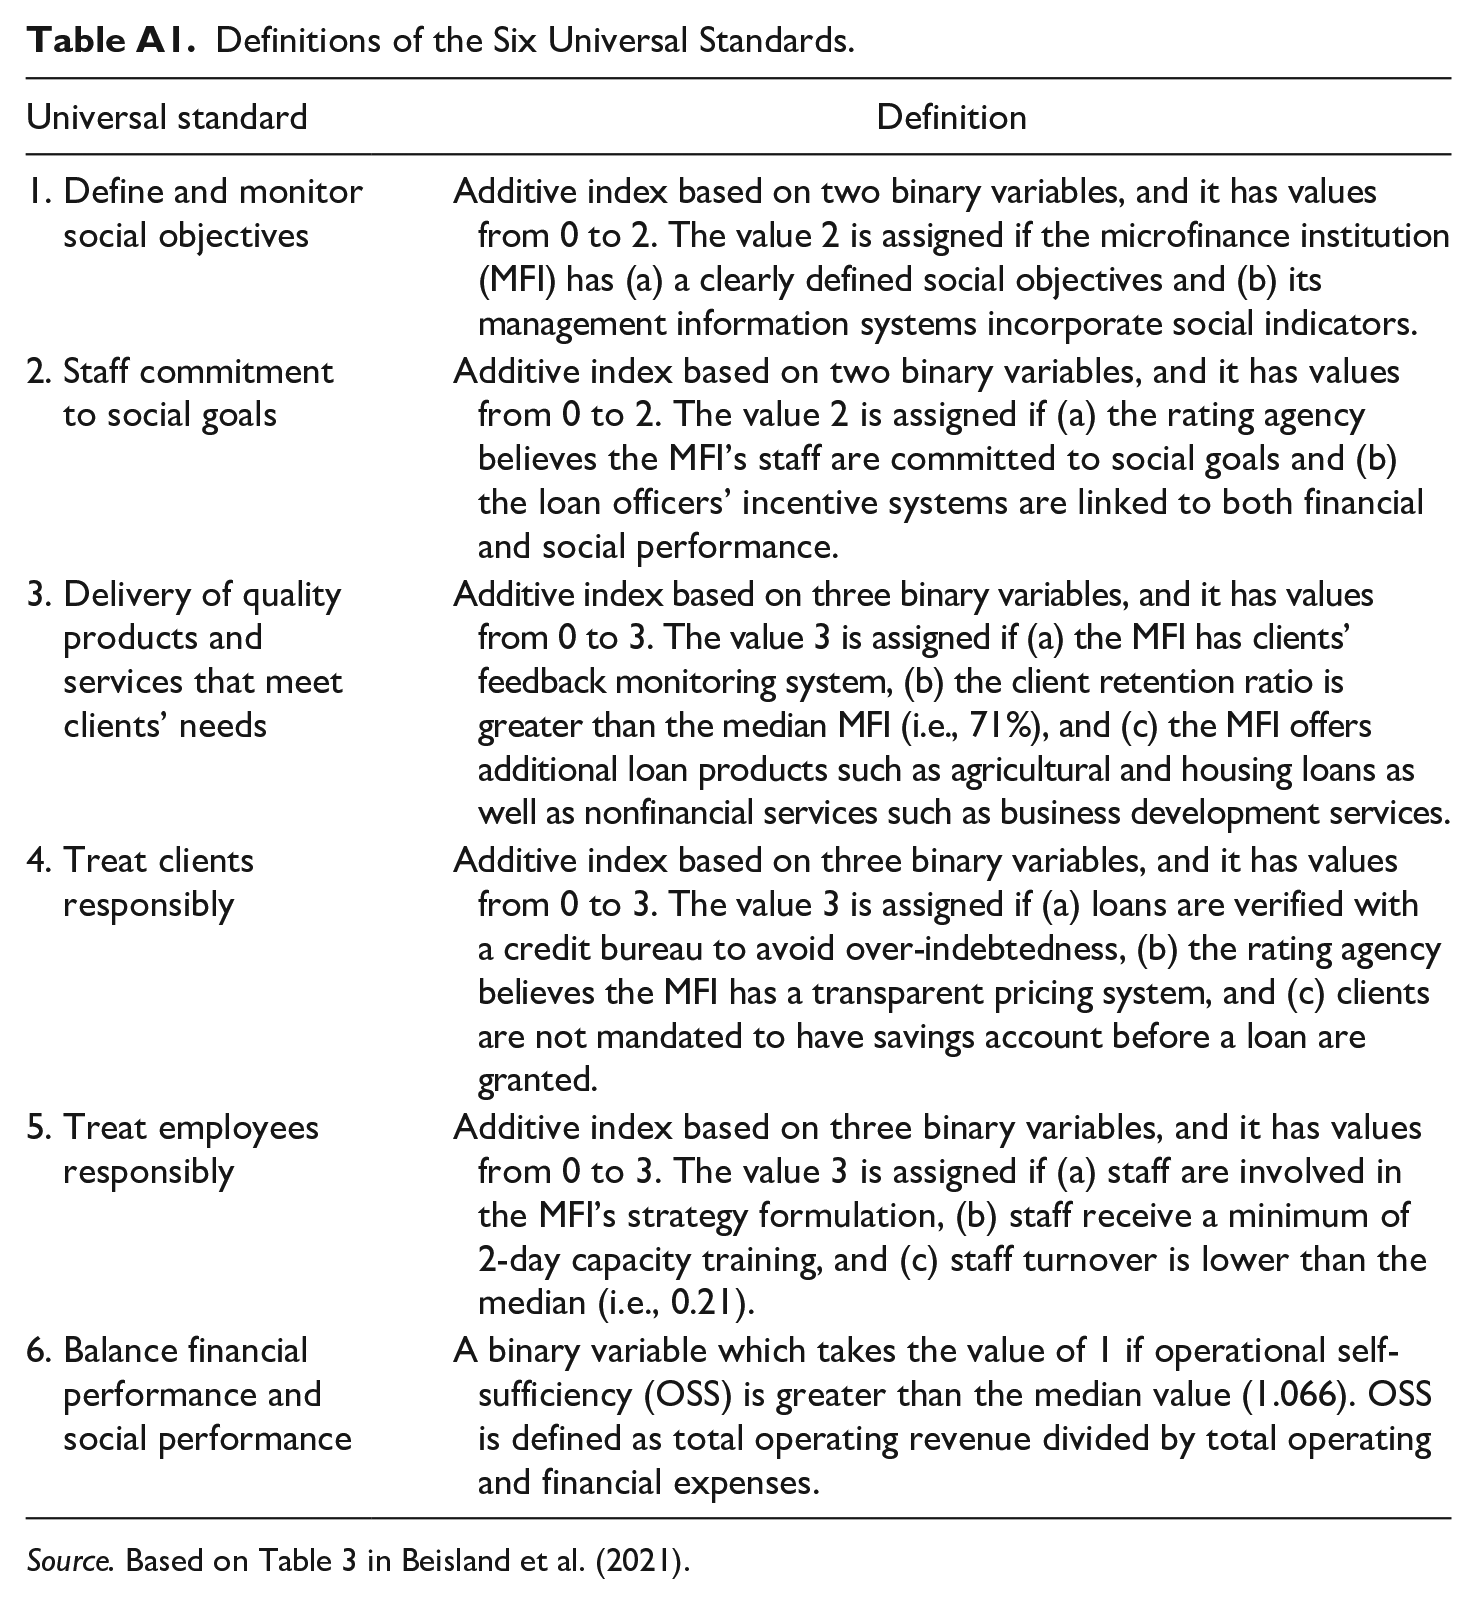
| Universal standard | Definition |
|---|---|
| 1. Define and monitor social objectives | Additive index based on two binary variables, and it has values from 0 to 2. The value 2 is assigned if the microfinance institution (MFI) has (a) a clearly defined social objectives and (b) its management information systems incorporate social indicators. |
| 2. Staff commitment to social goals | Additive index based on two binary variables, and it has values from 0 to 2. The value 2 is assigned if (a) the rating agency believes the MFI’s staff are committed to social goals and (b) the loan officers’ incentive systems are linked to both financial and social performance. |
| 3. Delivery of quality products and services that meet clients’ needs | Additive index based on three binary variables, and it has values from 0 to 3. The value 3 is assigned if (a) the MFI has clients’ feedback monitoring system, (b) the client retention ratio is greater than the median MFI (i.e., 71%), and (c) the MFI offers additional loan products such as agricultural and housing loans as well as nonfinancial services such as business development services. |
| 4. Treat clients responsibly | Additive index based on three binary variables, and it has values from 0 to 3. The value 3 is assigned if (a) loans are verified with a credit bureau to avoid over-indebtedness, (b) the rating agency believes the MFI has a transparent pricing system, and (c) clients are not mandated to have savings account before a loan are granted. |
| 5. Treat employees responsibly | Additive index based on three binary variables, and it has values from 0 to 3. The value 3 is assigned if (a) staff are involved in the MFI’s strategy formulation, (b) staff receive a minimum of 2-day capacity training, and (c) staff turnover is lower than the median (i.e., 0.21). |
| 6. Balance financial performance and social performance | A binary variable which takes the value of 1 if operational self-sufficiency (OSS) is greater than the median value (1.066). OSS is defined as total operating revenue divided by total operating and financial expenses. |
Source. Based on Table 3 in Beisland et al. (2021).
Declaration of Conflicting Interests
The authors declared no potential conflicts of interest with respect to the research, authorship, and/or publication of this article.
Funding
The authors received no financial support for the research, authorship, and/or publication of this article.