
Abstract
The distribution of charitable organizations in an equitable and socially just manner is a long-standing policy concern in the United Kingdom and many other jurisdictions. Geographic variations are important as they are linked to potentially inequitable service provision and opportunities for participation in voluntary activities. This study links large-scale administrative data on charities registered in England and Wales with local authority-level measures of material deprivation for 5 U.K. census years (1971–2011). Count and spatial regression models show evidence of nonlinear associations between charity density and social need, and changes in the shape of this distribution over time. In general, charity density is highest in the least deprived local authorities but this varies across different types of organizations and census years. These results provide important new insights into the evolving relationship between charity density and social need, and demonstrate the value of adopting more advanced, longitudinal statistical approaches for studying this phenomenon.
Introduction
The distribution of charitable organizations in an equitable and socially just manner is a long-standing policy concern in the United Kingdom (Mohan, 2015; Mohan & Breeze, 2016). John Stuart Mill (1848) claimed that “charity almost always does too much or too little. It lavishes its bounty in one place, and leaves people to starve in another” (p. 299). The influential Wolfenden (1978) Report—a key postwar inquiry into the British voluntary sector—posited that “some social and geographical contexts seem to provide a much more fertile soil for voluntary action than others” (p. 58). The U.K. Conservative Party’s (2008) policy paper, A Stronger Society: Voluntary Action in the 21st Century, argued that support was needed to establish organizations in geographic areas that lacked them. This was followed by a report from the Centre for Social Justice (2014), revealing specific areas of England that could be classified as “voluntary sector cold spots.” The report’s claim rested upon a comparison of the uneven distribution of the ratio of charitable organizations to population measured at local authority level (Mohan, 2015). The importance of charitable activity to local communities has again been reaffirmed in the U.K. government’s Civil Society Strategy (HM Government, 2018, p. 19). The Strategy aims to create “thriving communities with sufficient social, financial, natural and physical capital” through strengthening five “foundations” of social value: people, places, the social sector (i.e., charities and social enterprises), the private sector, and the public sector.
In this Research Note, we examine longitudinal trends in the distribution of charitable organizations across local authorities in England and Wales for 5 census years: 1971, 1981, 1991, 2001, and 2011. For each local authority and year, we calculate the ratio of registered charities to population and analyze changes in the distribution of this measure over time. Such analyses have not previously been possible due to data limitations (either because data are not available for a consistent set of spatial units or because relevant indicators are not available consistently over time). We then assess whether patterns in the level of material deprivation in a local authority are associated with observed geographic variations in charity density. Examining differences between areas in a given census period, we find evidence of a nonlinear association between charity density and social need, which persists when controlling for spatial dependence among local authorities, and for other covariates. Looking across time periods within a given local authority, we find tentative evidence that density responds to changes in deprivation: As a local authority becomes more deprived, there is a suggestion that its level of charity density increases. Thus, an original feature of this article is the ability to examine changes “between” and “within” local authorities over multiple time periods.
We start by reviewing past work on the uneven distribution of nonprofit organizations and then consider issues of data and method. After presenting the results, the discussion centers around three findings: the nonlinear association between charity density and social need, the temporal variations in the nonlinear trends observed, and, because of the heterogeneous nature of the charity sector, variations in the association between density and need. We conclude by considering the implications for policy and practice—Given that the evidence suggests considerable and persistent disparities between places in the distribution of charitable entities, to what extent are efforts to reduce these disparities feasible, or desirable?
Literature
Empirical work has consistently observed an uneven geographic distribution of voluntary organizations, but establishing a connection between these distributions and patterns of social need requires a more nuanced analysis. The literature is divided into studies finding a positive, negative, or inconclusive association between these phenomena. Grønbjerg and Paarlberg (2001) used the 1999 Internal Revenue Service (IRS) data for Indiana counties to study the association between nonprofit density and religious diversity and social distress (percentage of children in poverty), controlling for supply and community-level factors. They observed a negative association between the level of density and need. Using data on 3,000 U.S. counties, M. Kim (2015) also found a negative correlation between nonprofit density and social need, as measured by racial/ethnic diversity and unemployment rate (a small, nonsignificant effect for poverty rate was estimated). Lindsey (2013) explored whether geographical variations in the distribution of charities also occurred at a local scale, in this case at the neighborhood level; drawing on a mix of quantitative and qualitative data for two case study areas in the United Kingdom (one affluent and one deprived), the study observed fewer registered charities in the more deprived area. Clifford (2012), drawing upon data for England from the 2008 National Survey of Third Sector Organisations, observed that less deprived local areas had a much higher prevalence of registered voluntary sector organizations than more deprived local areas. Clifford’s (2018) recent work, examining charity density and survival rates at the neighborhood level in England between 1996 and 2011, provides two key insights: Less deprived areas have higher levels of charity density and charities in more deprived neighborhoods have a higher rate of dissolution than those in less deprived areas.
In contrast, some studies find a positive association between density of organizations and disadvantage. In a study of voluntary organizations working in the field of social welfare in Glasgow, United Kingdom, Fyfe and Milligan (2003) found a moderate, positive correlation between the number of organizations per 1,000 residents and the level of material deprivation in a community. However, like many community-level studies of the distribution of organizations, its reliance on local listings compiled for a multiplicity of purposes limited the comprehensiveness of the data and therefore the validity of their conclusions (Grønbjerg & Clerkin, 2005; Mohan, 2012). Yan et al. (2014), in their study of census tracts in Hartford, CT, discovered that areas with higher rates of poverty, unemployment, and renter-occupied dwellings had a higher prevalence of antipoverty nonprofits. Peck (2008), and Joassart-Marcelli and Wolch (2003) also focused on the density of antipoverty nonprofits in local areas across Phoenix, AZ and Southern California, respectively: both found positive associations between density and social need.
There are a small number of studies that did not find a strong, unambiguous link between nonprofit density and social need. In a study of Brazilian municipalities, da Costa (2016) concluded that measures of community need—poverty, violent crime and unemployment rates, and income inequality—were not strongly associated with nonprofit density. Similarly, Van Puyvelde and Brown (2016), in their 2012 study of 254 Texan counties, found mixed results: the poverty rate had a positive association with two nonprofit subsectors (but not overall), racial diversity was positively associated with the distribution of the sector overall and the arts subsector, whereas the unemployment rate was not statistically significantly correlated. Finally, Wo’s (2018) examination of 974 Los Angeles census tracts from 2010 to 2012 revealed a more nuanced representation of the association between density and need: The highest levels of nonprofits were found in the least and most deprived areas, indicating a U-shaped trend across the deprivation index.
In summary, the literature offers mixed findings on the size, direction, and even shape of the association between nonprofit density and social need, although some themes emerge. First, the studies finding a positive correlation tended to focus on one geographic region and one nonprofit subsector (e.g., the number of antipoverty nonprofits across Southern California). Second, most research leverages cross-sectional data, with limited ability to analyze longitudinal shifts in density and its link with social need. Finally, most studies employ ordinary least squares (OLS) regression approaches, which may lead to biased inferences, given the measurement of the dependent variable (count of nonprofits per capita) and the possibility of spatial dependence among the units of analysis. In this context, we seek to advance the field by focusing on longitudinal changes in the distribution of charitable organizations at multiple time periods and, by investigating whether these patterns are associated with levels of material deprivation, controlling for other factors highlighted in the literature.
Method
Data
The term charity in this study refers to organizations that at some point in their history have been formally registered with the Charity Commission of England and Wales (“The Commission”). These organizations are equivalent to public charities (501 [c](3) organizations) in the United States. We employ a recent version of the Charity Register that provides a snapshot of charities in England and Wales registered between 1961 and 2016 inclusive (n = 309,587). The Register contains a suite of variables capturing the characteristics (e.g., charity number and registration year), financial profile (e.g., headline annual income), geographic scale of activity, field of activity (e.g., Social Services), and postcode and local authority of the organization’s head office. We reduce the sample size through cleaning of the data set: once completed, we have observations for 282,952 charities—see the supplementary document for details of this process.
Data on population estimates and measures of deprivation are drawn from the University of Liverpool’s PopChange (Population Changes and Geographic Inequalities in Britain, 1971–2011) project (Lloyd, Catney, Williamson, & Bearman, 2017). This research project produced geographically consistent sets of population counts from U.K. Censuses for the period from 1971 to 2011 (Lloyd, Catney, Williamson, Bearman, & Norman, 2017). This is an important contribution to longitudinal spatial studies of the United Kingdom as the Local Government Act, 1972, resulted in substantial changes to the boundaries of counties and districts in England and Wales in 1974. By allocating census data for very small areas (enumeration districts, with a typical population of 150) to a consistent set of local authority boundaries (the post-1974 spatial units), the Popchange data resources enable researchers to track changes in population and deprivation across census years. Although other measures of deprivation exist, notably the Index of Multiple Deprivation for England, the PopChange project employed the Townsend score as this can be calculated in a consistent manner for each census year since 1971. The Townsend score is a composite measure of the following indicators of material deprivation: the percentage of the population who are unemployed, the percentage of households not owner-occupied (i.e., rented), the percentage of households with no access to a car or van, and the percentage of households with more than one person per room (Townsend et al., 1988).
The two data sets are linked using the local authority code field: this enables us to produce a count of the number of charities in each of the 328 local authorities in our sample for each census year. Local authorities are areas with populations of between 80,000 and 1 million, although the great majority have populations of under half a million. The use of an organization’s postcode for matching to local authority data engenders two main issues. First, the address of a charity’s administrative offices does not necessarily imply that all of its activities, resources, and impact are specific to this location (i.e., the “headquarters effect”). For example, there are numerous small charities that operate solely overseas in which case use of their administrative address is an inaccurate descriptor of where they operate. This is an unavoidable consequence of the use of regulatory data on charities, although we attempted to mitigate its effects by drawing upon information on a charity’s self-defined area of benefit to help us determine where organizations operate. Second, the data do not contain records for subsidiaries or branches of charities, which could lead to an underestimate of voluntary activity for particular areas.
Analytical Approach
The analytical strategy is focused on understanding the following two aspects of our phenomenon:
The “between” story: How has the relationship between charity density and social need evolved (or not) across census years?
The “within” story: Does the level of density respond to changes in social need within a local authority?
The former is concerned with understanding the magnitude and shape of this relationship for England and Wales as a whole in each census period; the latter examines how changes in social need influence the subsequent level of density within an area.
The dependent variable is the number of charities per 5,000 residents in a local authority; per capita values were used because of the strong correlation between population size and the number of charities in an area (Pearson’s r = .51, p < .001). To account for the heterogeneous nature of the U.K. charity sector, we disaggregate some of our analyses by geographic scale of operation and primary field of activity. Scale of operation is measured using information provided by charities at registration on their geographic area of operation (they are invited to nominate the administrative areas in which they are active); this was used to categorize charities according to whether they are local, national, or overseas. By “local” we refer to an organization that is operating in no more than one local authority. Field of activity is operationalized in accordance with the International Classification of Nonprofit Organizations system (Salamon & Anheier, 1996).
For the “between” analysis, in which we are interested in comparing local authorities at each census period, we employ zero-truncated Poisson regression to model the count of charities per 5,000 residents as a function of material deprivation, urban/rural classification, and the previous level of charity density. Material deprivation is operationalized as a continuous measure of a local authority’s Townsend score: a value of zero represents a local authority with a mean level of material deprivation, values above zero identify areas with higher than average levels of deprivation, whereas values below zero capture areas with lower than average levels. The Townsend score is attractive as it can be calculated consistently across censuses (unlike other measures such as the Index of Multiple Deprivation). In line with Wo’s (2018) findings, we include a quadratic term for Townsend score to capture the presence of a curvilinear association between density and deprivation. The individual components of the Townsend score—notably the unemployment and owner-occupancy measures—are common proxies for social need in statistical models of nonprofit density (see Peck, 2008; Van Puyvelde & Brown, 2016; Wo, 2018; Yan et al., 2014). Urban/rural classification is an ordinal measure of the number of persons per hectare in a local authority; previous studies have shown that urban/rural differences in charity density are expected, and including this measure alleviates some of the confounding that can occur between density and material deprivation, that is, rural areas tend to be less deprived (Clifford, 2012; da Costa, 2016). Prior density is a continuous measure of the level of density in the previous census year; this measure emerged as a strong predictor in the work of da Costa (2016) and Clifford (2018), and there is a theoretical basis for expecting it to be correlated with our dependent variable (see Bielefeld & Murdoch, 2004). A limitation of the statistical models is our inability to capture a wider range of independent variables relating to population (e.g., levels of income and education), community (e.g., racial and religious diversity), and resource (e.g., central and local government spending) characteristics. Such indicators have all been productively employed in previous studies (see Grønbjerg & Paarlberg, 2001; S. E. Kim & Kim, 2015; Peck, 2008) but those indicators are not available consistently over time either because they have not been captured at all or, if they are, variables have been operationalized in a manner that varies from one census to the next.
For the “within” analysis, in which we are interested in the effects of changes in deprivation within local authorities, we estimate a series of change-score models in the form of OLS regressions (as a change in density can be negative). To better capture changes in material deprivation, we operationalize a categorical variable, indicating whether a local authority’s position in the ranking distribution on this measure has changed: A negative change in rank between census years indicates a relative decrease in deprivation, whereas a positive change indicates the obverse. Table 1 summarizes the operationalization of our key variables. In our supplementary online documentation, we provide details on why multicollinearity is not problematic for the analyses.
Key Variables.
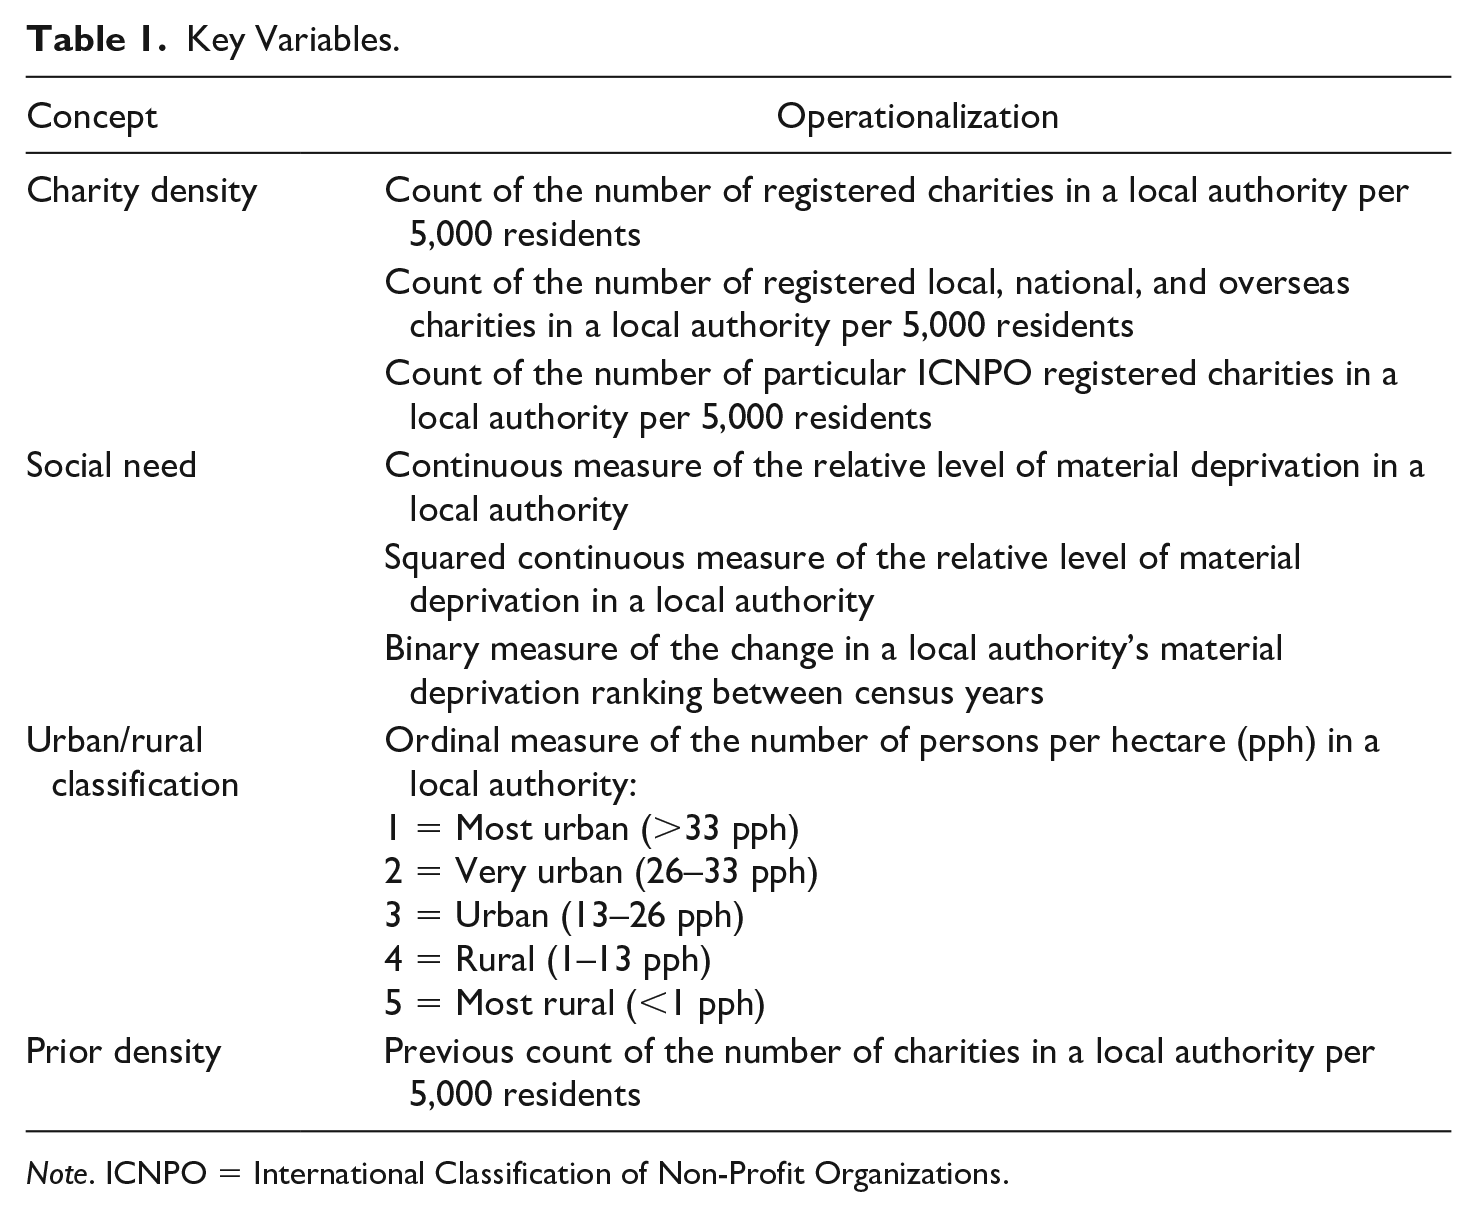
Note. ICNPO = International Classification of Non-Profit Organizations.
Results
Figure 1 displays the distribution of charity density for the period overall (1971–2011). It appears that there is some degree of clustering—that is, there are groups of local authorities with similar levels of density. Figure 2 presents changes in this distribution over time. The distribution is shifting upward, indicating that greater numbers of local authorities have more registered charities per 5,000 individuals; this is confirmed by the positive association between density and census year (Spearman’s ρ = .41, p < .001). This trend is largely driven by sharp increases in the number of registered charities (particularly between 1971 and 2001): The typical local authority experienced around a 30% increase in its population base between 1971 and 2011, whereas the number of registered charities more than doubled.
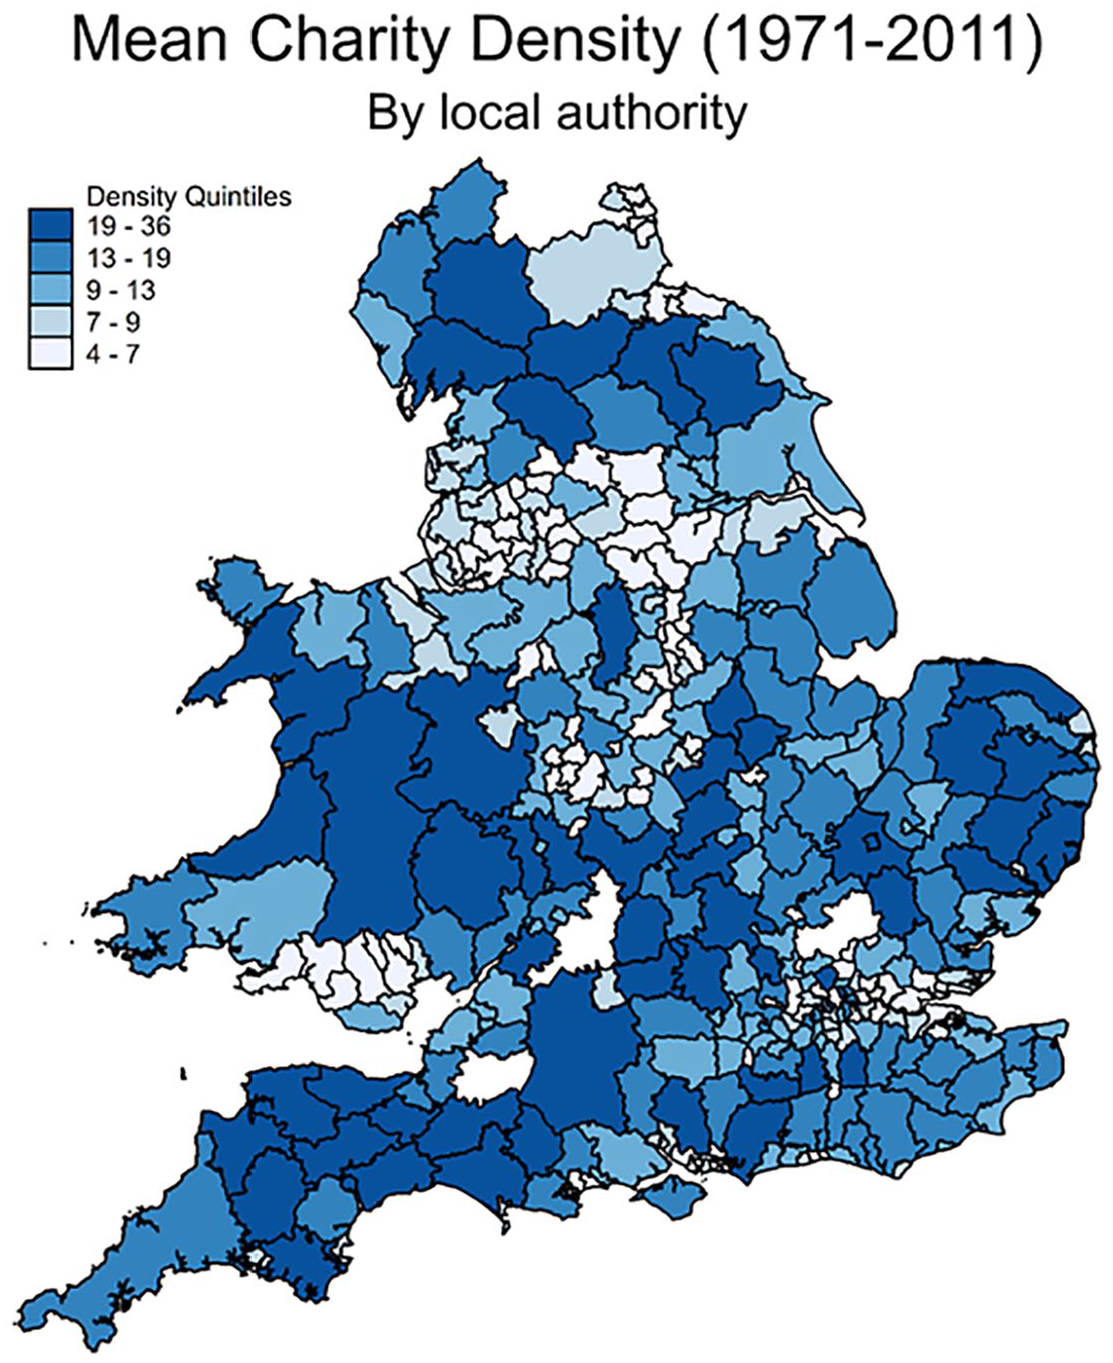
Map of mean charity density (1971–2011).
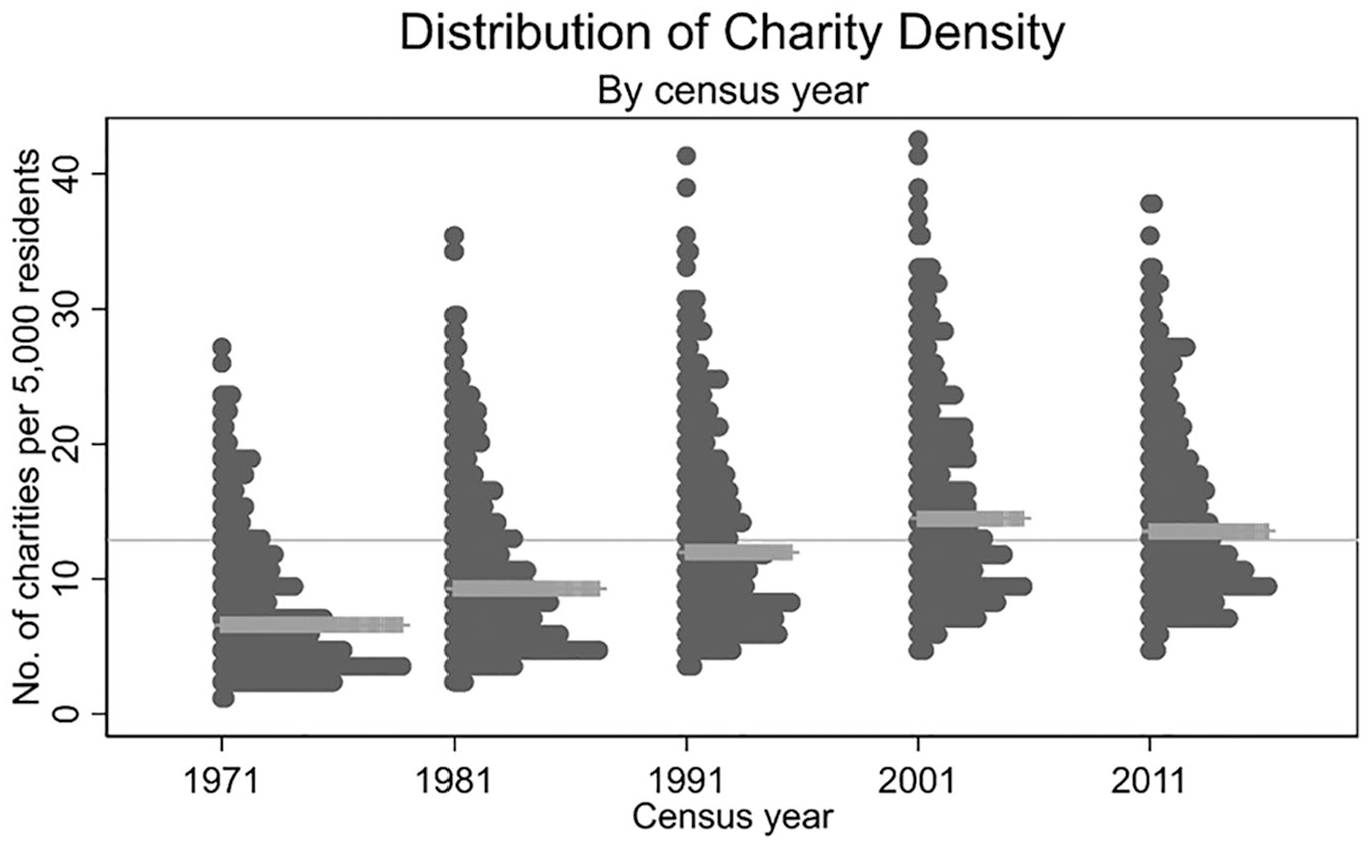
Distribution of charities per 5,000 residents by census year.
Figure 3 displays the distribution of charity density by Townsend score for each census year. There are clear differences in density according to the relative level of material deprivation. For each census year, more deprived local authorities (i.e., those with a Townsend score greater than 0) tend to have a lower density of charities than less deprived areas. Consistent with Clifford (2012), we observe a strong, negative correlation between density and the level of material deprivation in an area over the entire period (Spearman’s ρ = −.59, p < .001), with the correlation increasing slightly over time: from −.45 (p < .001) in 1971 to −.59 (p < .001) in 2011. However, there is some evidence of an emerging curvilinear relationship between these two measures: The most and least deprived local authorities exhibit the highest levels of charity density, although the distribution appears to be driven by a small number of London-based local authorities at the most deprived end of the scale. We now examine whether these bivariate associations are persistent when controlling for other factors in our statistical models.
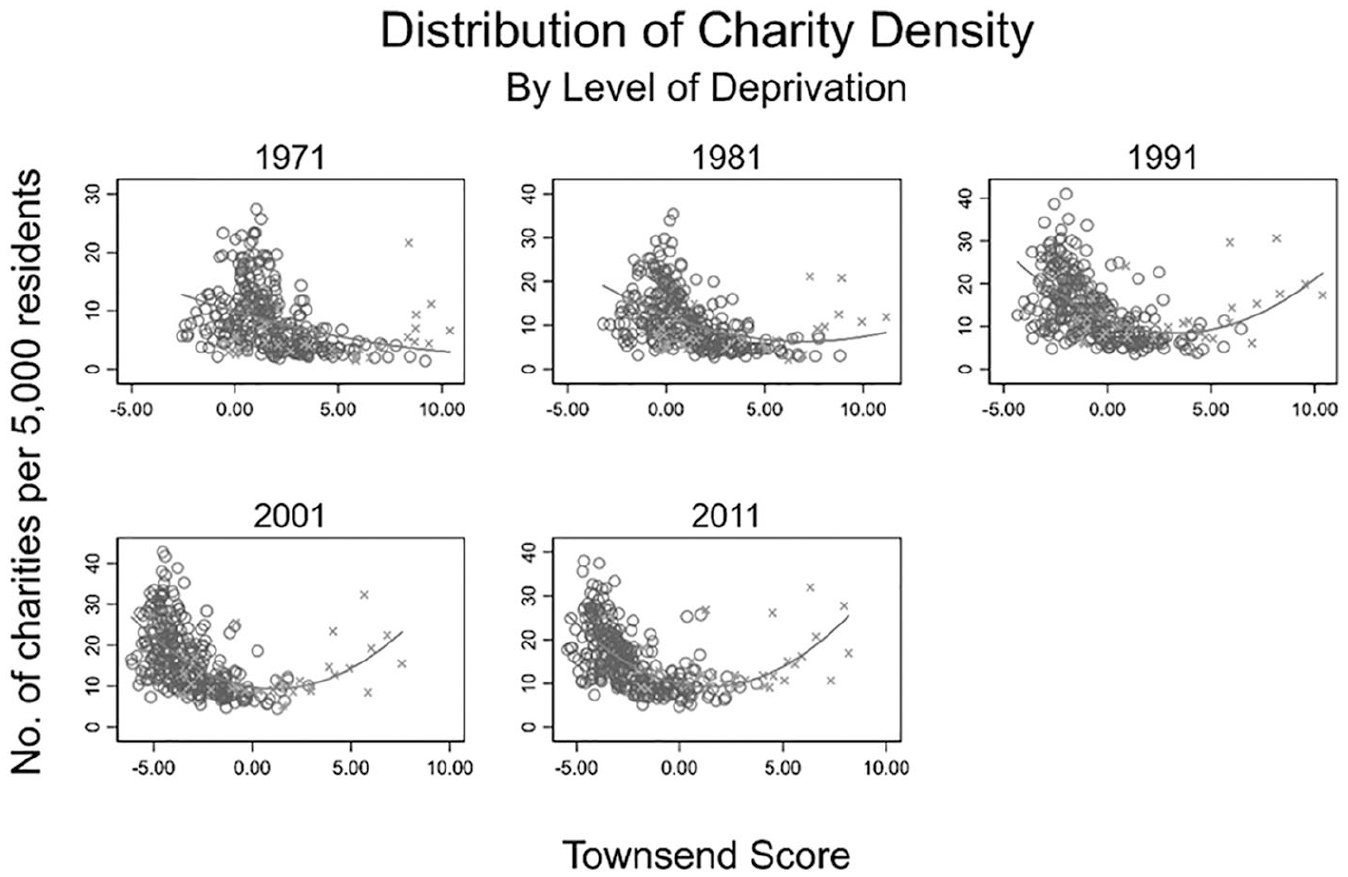
Distribution of charity density by Townsend score and census year.
Differences Between Local Authorities
The first series of statistical models predict density for the charity sector overall. We also conducted a series of sensitivity analyses checking for spatial autocorrelations (see supplementary document). Table 2 presents the results of the main model. With the exception of 2011, an increase in Townsend score (i.e., becoming more deprived) results in a decrease in the expected number of charities per 5,000 residents; this effect is strongest in 1971 and lessens over time. The positive, significant coefficient for the square of Townsend score indicates a curvilinear relationship between material deprivation and charity density, controlling for other factors. However, in 2011, the combined effect of material deprivation is positive, meaning an increase in Townsend score, both its linear and quadratic functional forms, results in an expected increase in charity density. As mentioned above, this pattern is also accounted for by the strong influence of the small number of relatively very deprived, London-based local authorities. Figure 4 communicates this pattern more clearly. The curvilinear association is highly symmetrical in 2011, predicting similar counts of charities per 5,000 residents at the extreme ends of the material deprivation distribution. For other census years, the highest density alternates between the most and least deprived local authorities: In 1971 and 2001, the least deprived local authorities had the highest predicted level of density, whereas in 1981 and 1991, the most deprived areas had the highest predicted density. The changing shape of the distribution, becoming more U-shaped over time, reflects the bivariate patterns described in Figure 3.
Zero-Truncated Poisson Regression: Charity Density (Overall).
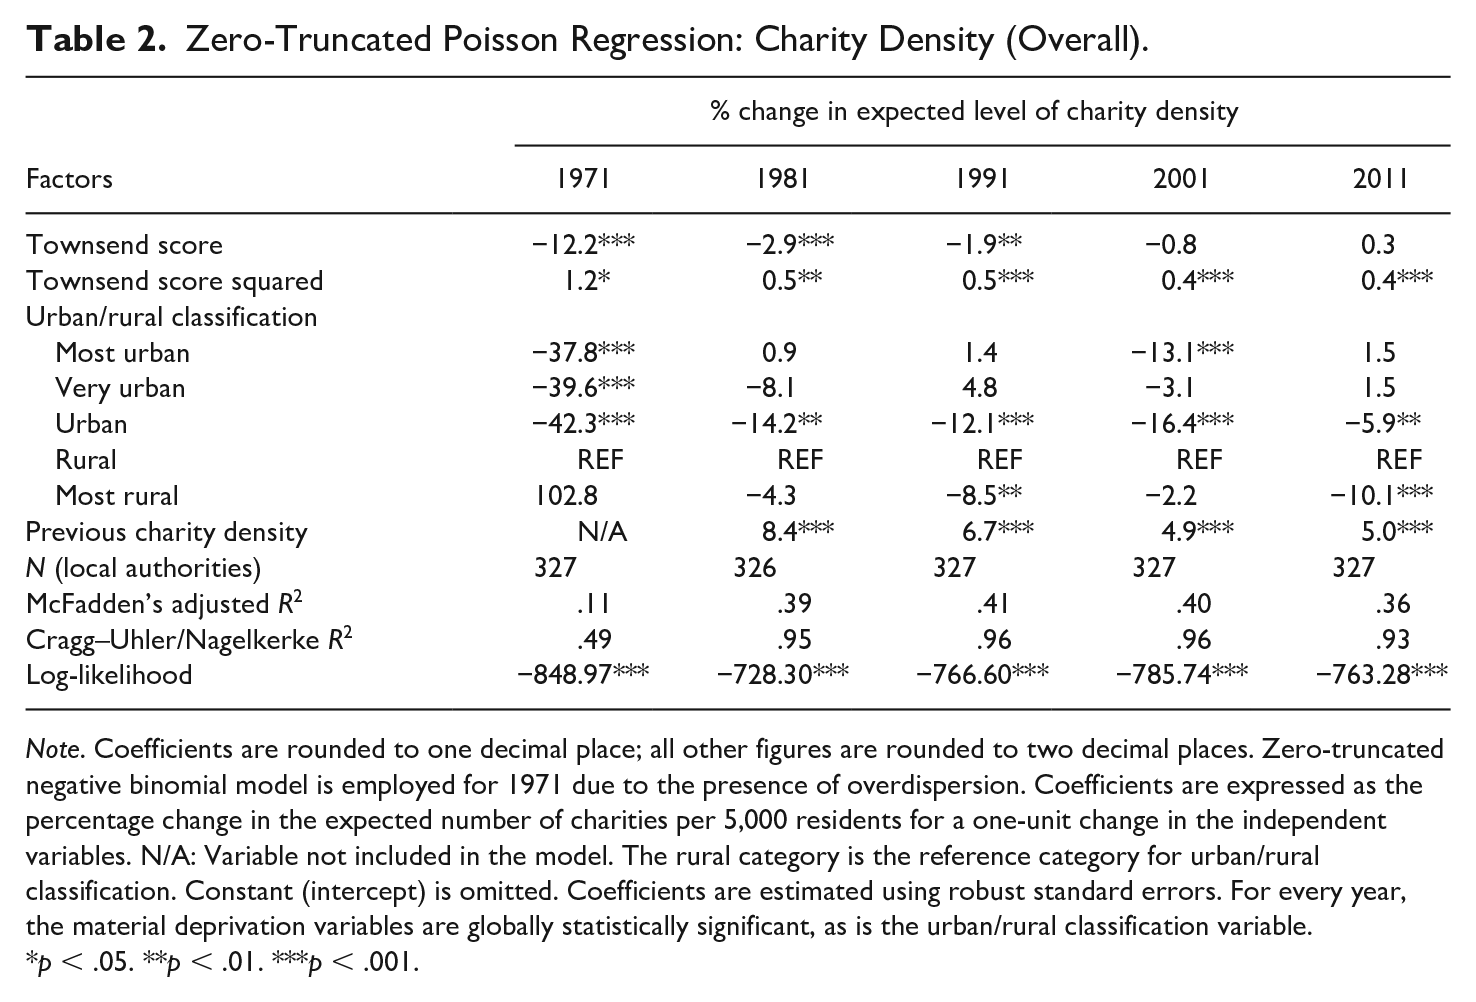
Note. Coefficients are rounded to one decimal place; all other figures are rounded to two decimal places. Zero-truncated negative binomial model is employed for 1971 due to the presence of overdispersion. Coefficients are expressed as the percentage change in the expected number of charities per 5,000 residents for a one-unit change in the independent variables. N/A: Variable not included in the model. The rural category is the reference category for urban/rural classification. Constant (intercept) is omitted. Coefficients are estimated using robust standard errors. For every year, the material deprivation variables are globally statistically significant, as is the urban/rural classification variable.
p < .05. **p < .01. ***p < .001.
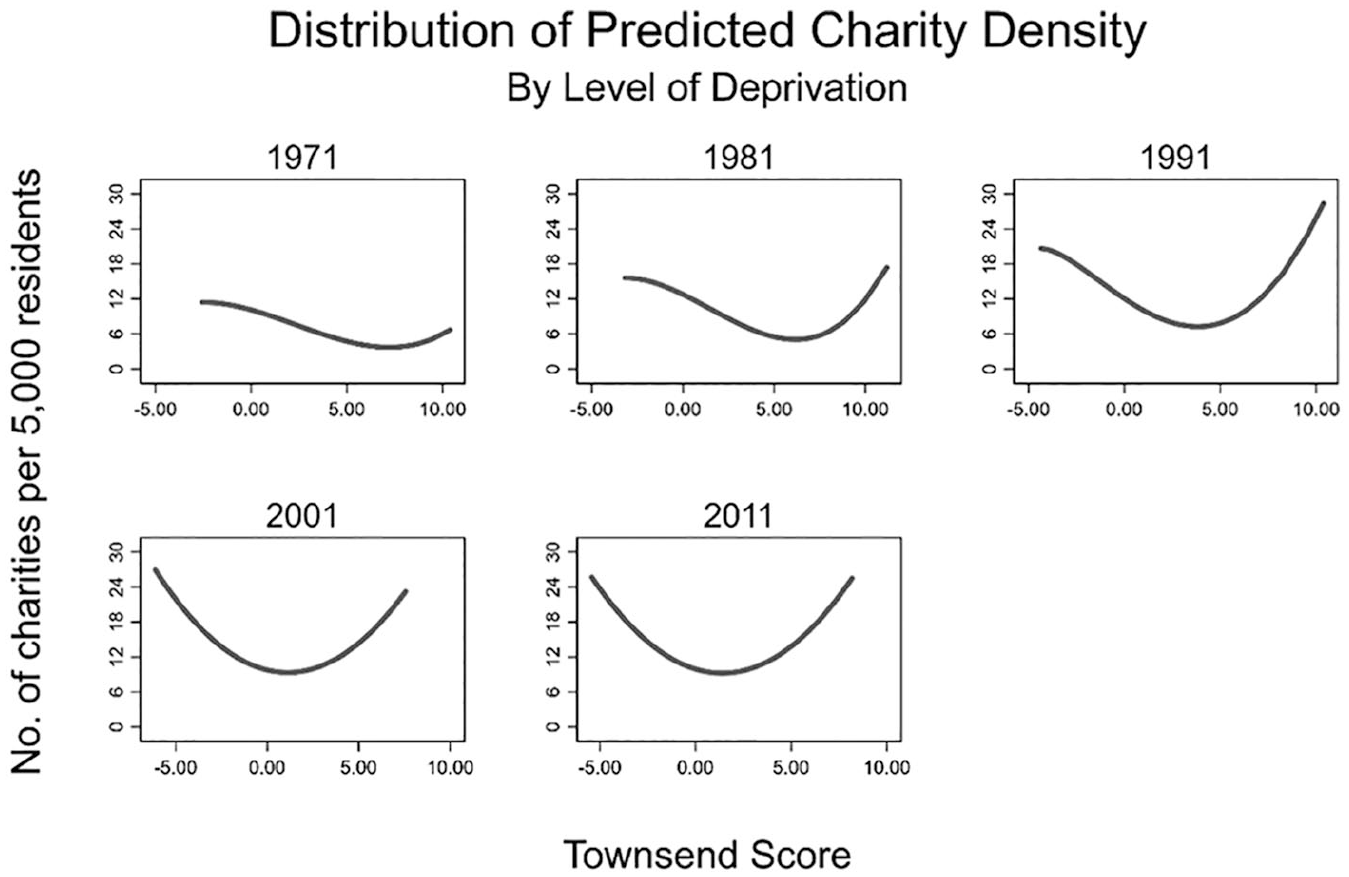
Distribution of predicted number of charities per 5,000 residents by Townsend score and census year.
The prior level of charity density is a statistically significant predictor of the outcome, with the size of the effect larger for earlier census years. For example, in 2001, a one-unit increase in prior density results in an increase of 4.9% in the expected number of charities per 5,000 residents, whereas the magnitude was 8.4% in 1981. We also observe significant variation between categories of urban/rural classification: Local authorities designated as Urban have lower levels of charity density than their Rural counterparts, with this effect being strongest in 1971 and weakest in 2011.
Geographic Scale of Operation
Disaggregating by geographic scale of operation, there is a higher level of density in more deprived areas than in less deprived areas for national and overseas charities. In fact, there is a downward trend in the predicted number of charities per 5,000 residents until a local authority becomes more deprived than the average (i.e., its Townsend score exceeds 0)—see Figures 5 and 6. This pattern could be driven by national and overseas charities establishing their headquarters in large conurbations, which tend to be more deprived relative to their more rural counterparts. The trend for local charities is similar to that for the charity sector overall, although this is unsurprising, given that they constitute the vast majority of organizations in the sector (Figure 7). However, the curvilinear nature is less pronounced in 2001 and 2011, with the least deprived local authorities having a higher predicted level of charity density than the most deprived areas.
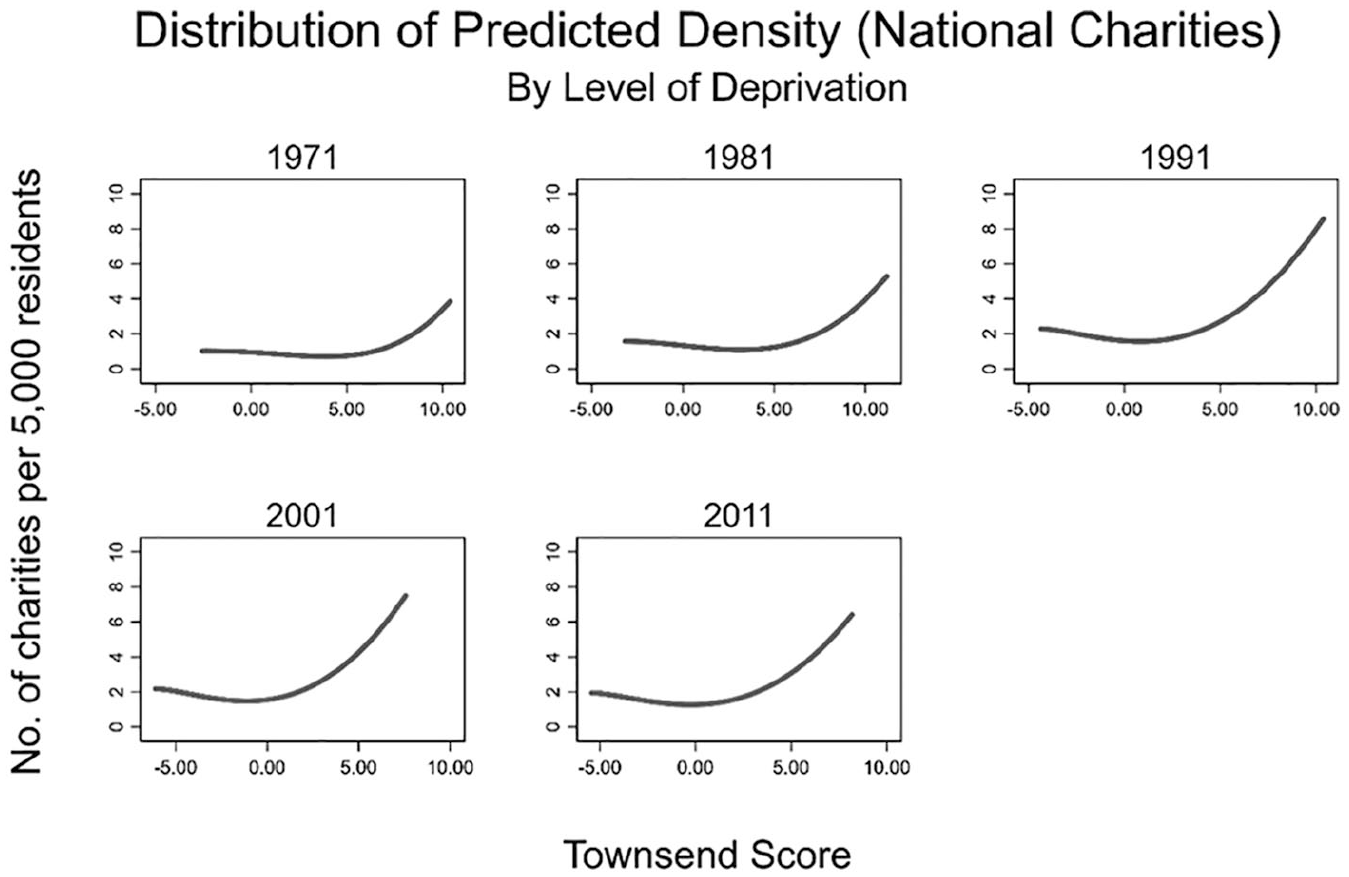
Distribution of predicted number of national charities per 5,000 residents by Townsend score and census year.

Distribution of predicted number of overseas charities per 5,000 residents by Townsend score and census year.
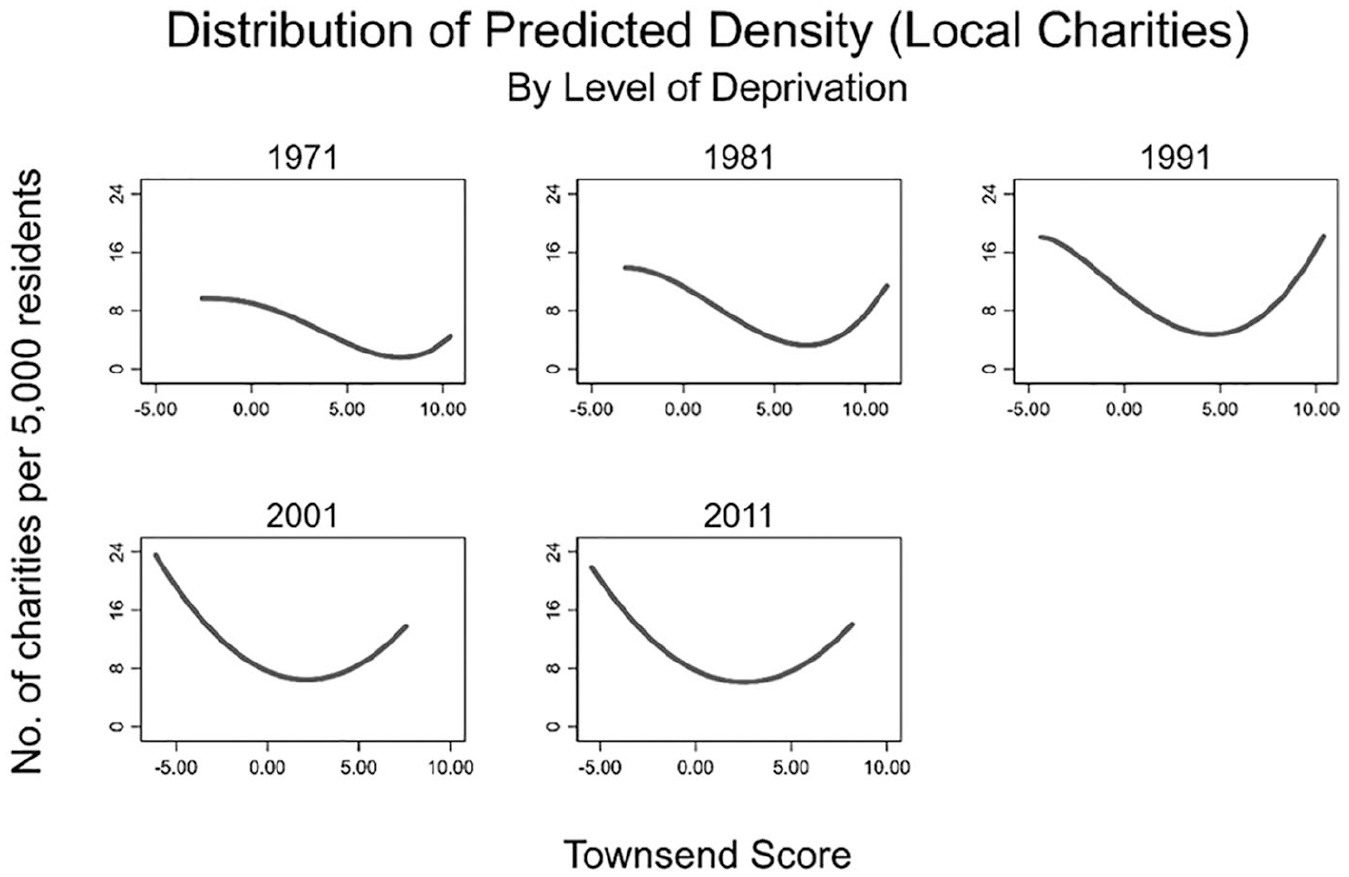
Distribution of predicted number of local charities per 5,000 residents by Townsend score and census year.
Field of Activity
Disaggregating by “vertical field” of activity of the charity (Kendall, 2003), there is a higher level of charity density in more deprived areas than in less deprived areas for Religion charities (with the exception of 1971)—see Figure 8. The distribution for Social Services charities is almost identical to that of the sector overall, with increasing evidence of a symmetrical, curvilinear association between density and deprivation over time (Figure 9). The distribution of density for Culture and Recreation charities is largely stable over time (Figure 10), with evidence of a strong curvilinear association with deprivation (though it is interesting to note how in 1991 and 2001 the predicted density is higher in the most deprived local authorities than in the least deprived). While there is some degree of a curvilinear association, this pattern is much weaker for Development charities: The least deprived local authorities tend to have greater levels of charity density than the most deprived (Figure 11). The same pattern is largely replicated for Education charities (Figure 12; this is expected as the great majority of these organizations are small and rely almost entirely on donations, parental fees, and voluntary effort (Body & Hogg, 2018).
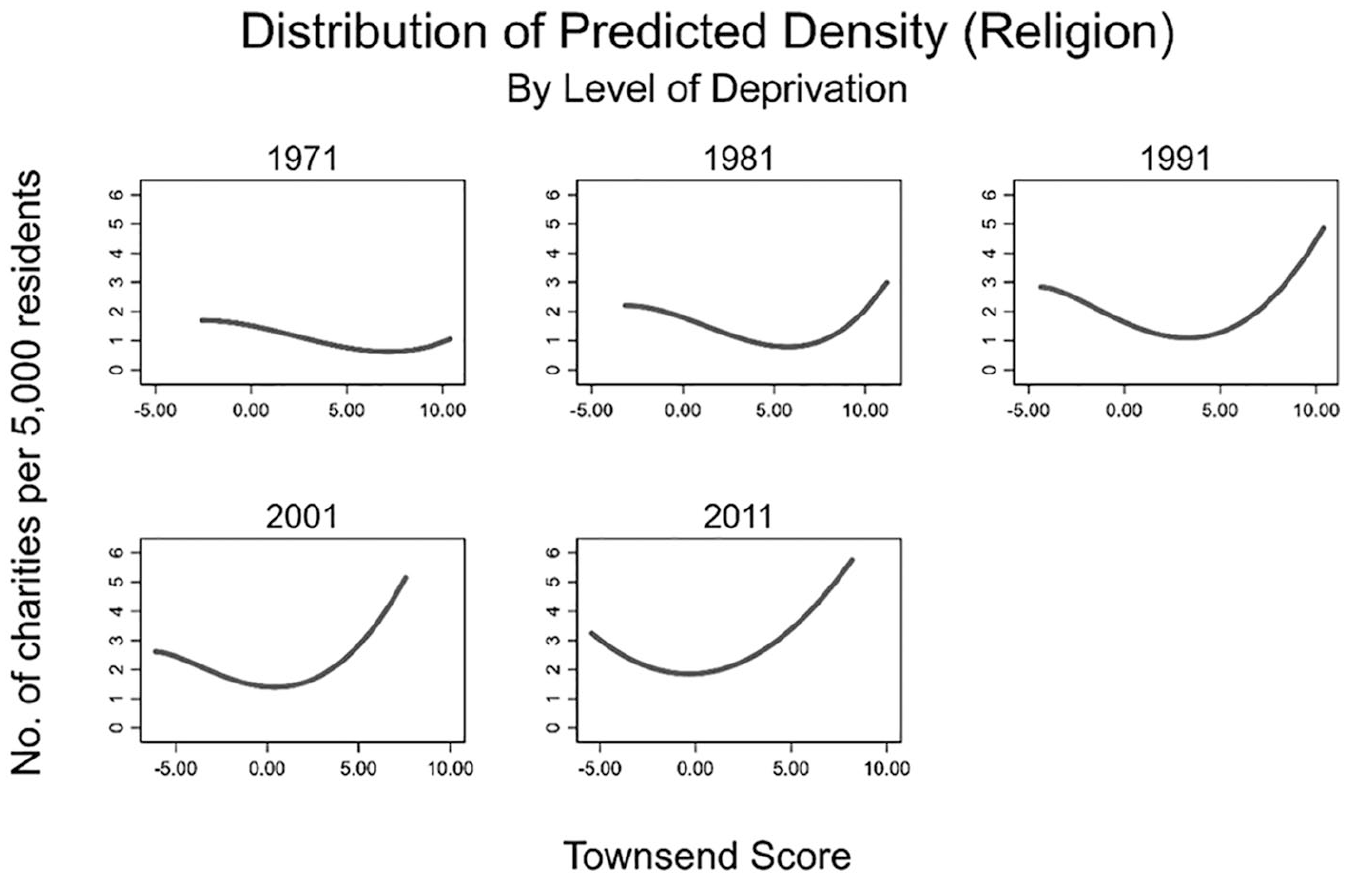
Distribution of predicted number of religion charities per 5,000 residents by Townsend score and census year.
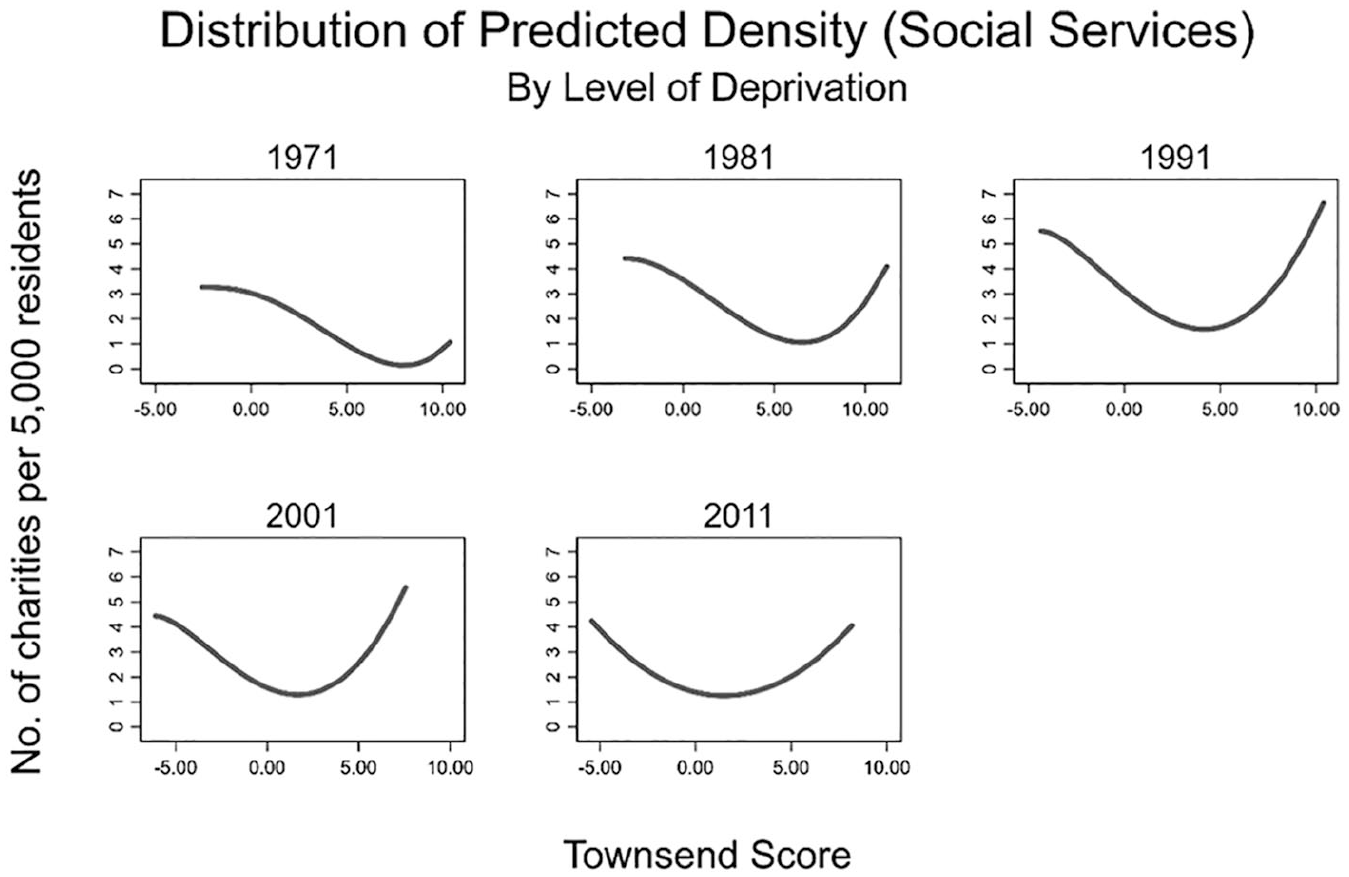
Distribution of predicted number of social services charities per 5,000 residents by Townsend score and census year.
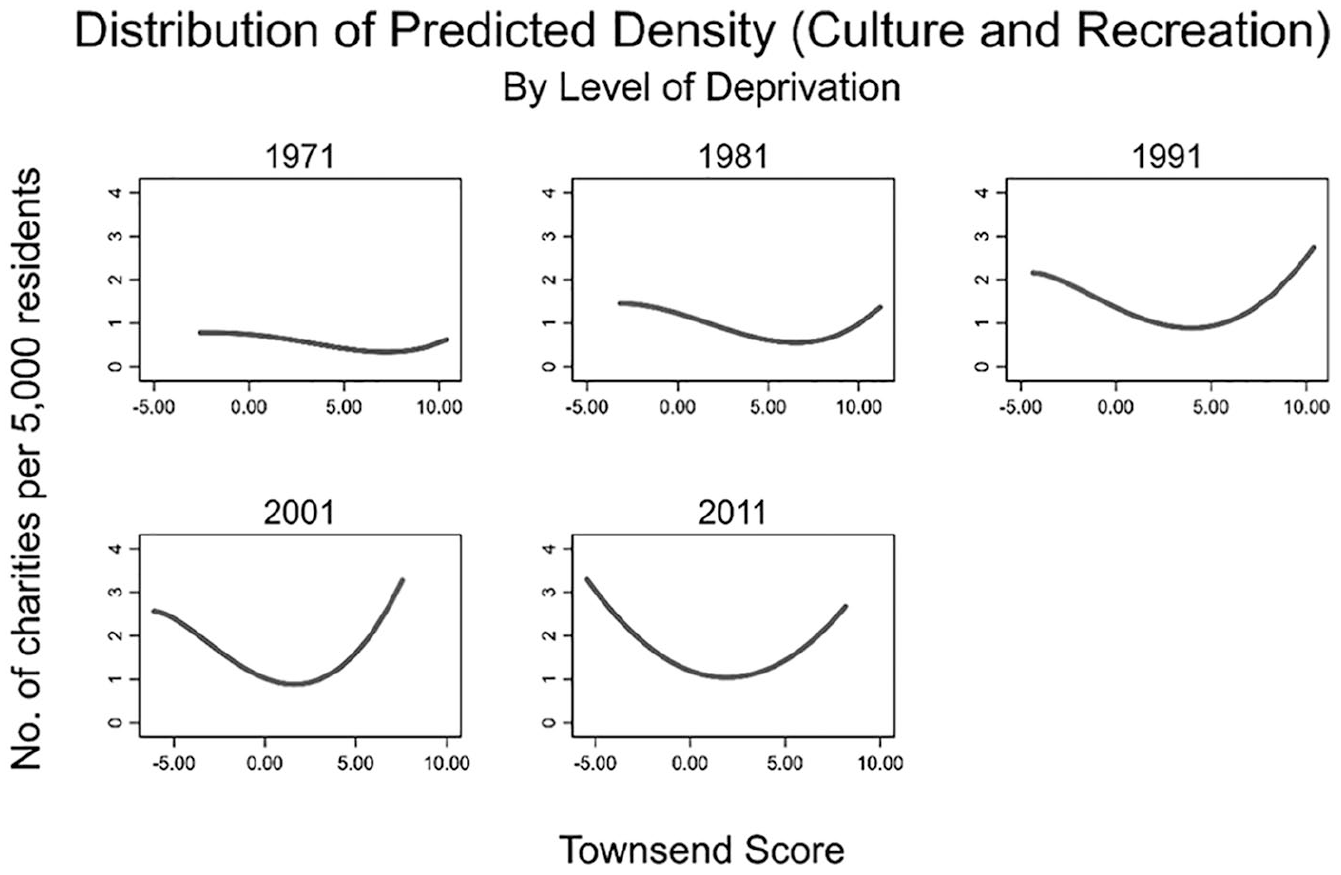
Distribution of predicted number of culture and recreation charities per 5,000 residents by Townsend score and census year.
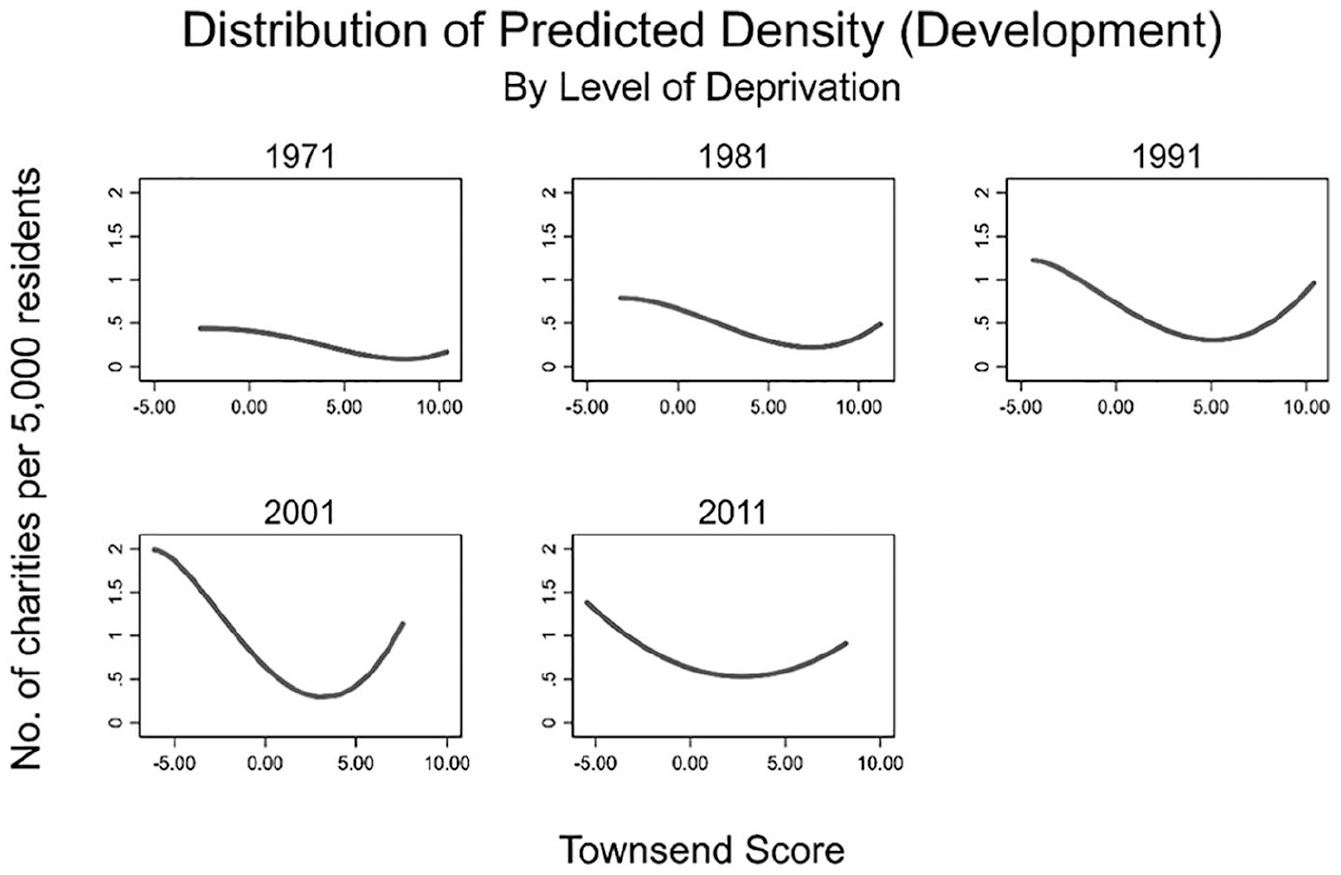
Distribution of predicted number of development charities per 5,000 residents by Townsend score and census year.
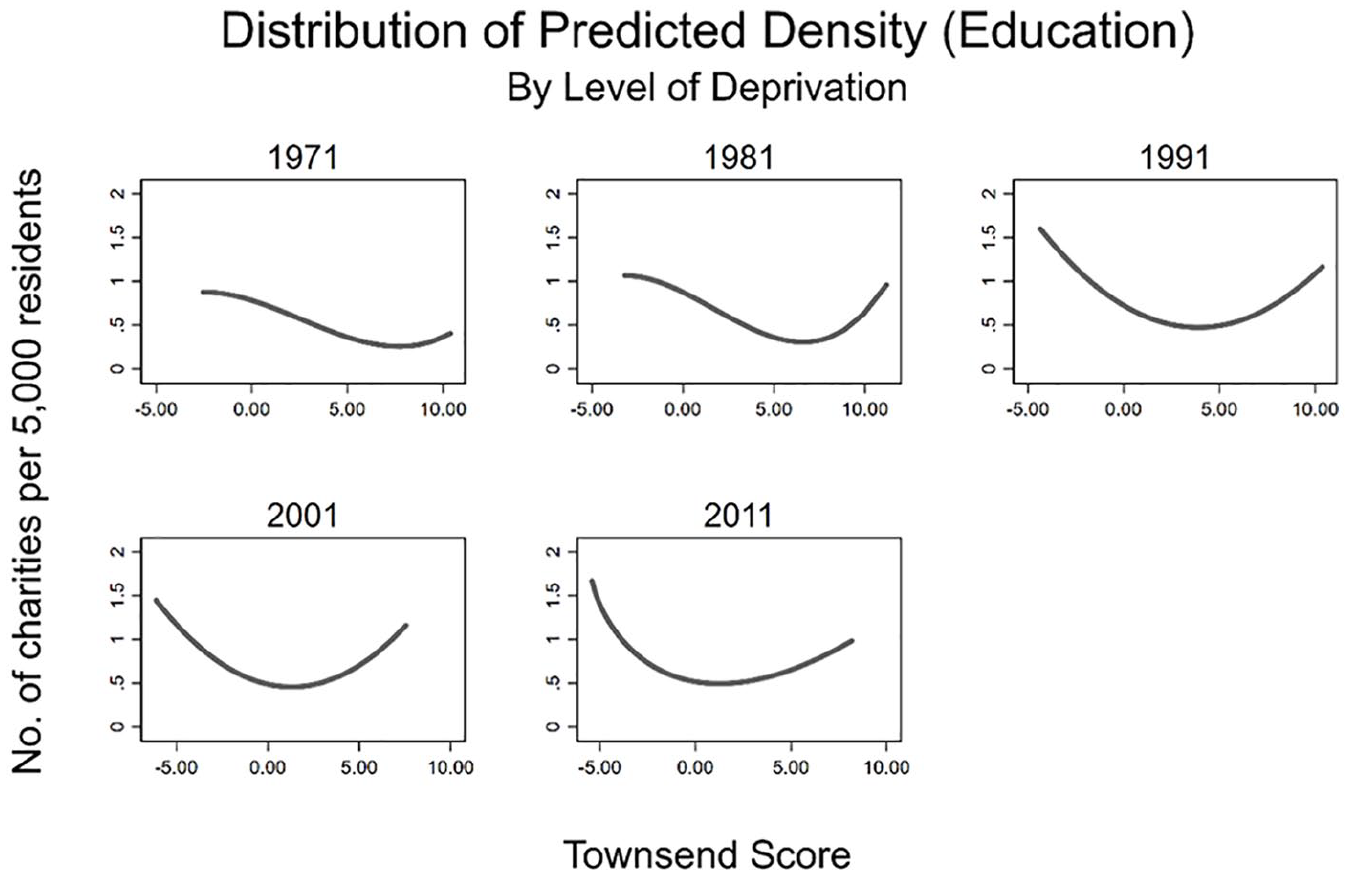
Distribution of predicted number of education charities per 5,000 residents by Townsend score and census year.
Changes Within Local Authorities
We now present the results of a series of change-score OLS regression models for the period from 1981 to 2011. As Table 3 highlights, there are interesting differences with the results of the “between” analyses. For example, an increase in a local authority’s material deprivation ranking (i.e., becoming more deprived) between 1981 and 1991 is associated with an increase in the level of density between these same years. This association is also positive for the period from 1991 to 2011, reflecting the increasing curvilinear (U-shaped) distribution of material deprivation and charity density over time (see Figure 3).
OLS Regression: Charity Density—Change-Score Model.
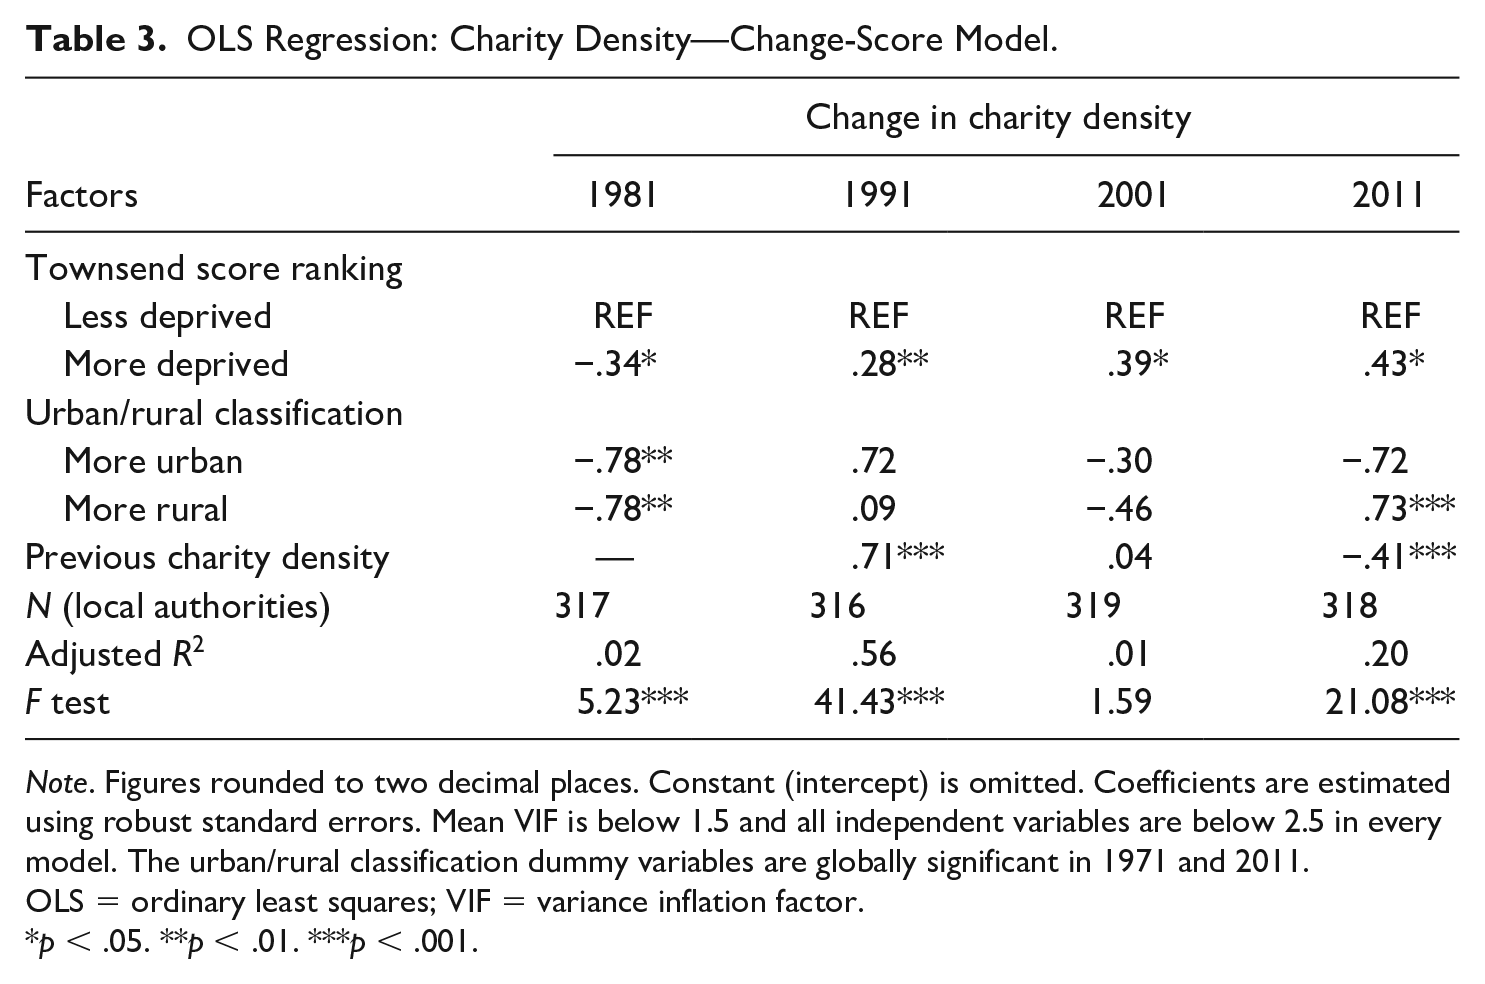
Note. Figures rounded to two decimal places. Constant (intercept) is omitted. Coefficients are estimated using robust standard errors. Mean VIF is below 1.5 and all independent variables are below 2.5 in every model. The urban/rural classification dummy variables are globally significant in 1971 and 2011. OLS = ordinary least squares; VIF = variance inflation factor.
p < .05. **p < .01. ***p < .001.
Discussion
There are important policy implications for understanding where charities locate and the determinants of this decision (Clifford, 2012; da Costa, 2016). Although there has been increasing scholarly interest in this phenomenon, the link between social need and charity density remains underinvestigated (Wo, 2018). This article demonstrates clear and enduring geographic differences in charity density across local authorities in England and Wales, and their association with levels of material deprivation. We highlight three key findings.
First, we find evidence of a nonlinear association between charity density and social need in a given census period, controlling for other factors. This stands in contrast to the linear trends observed by many previous studies (e.g., Joassart-Marcelli & Wolch, 2003; Peck, 2008; Yan et al., 2014), although it is in line with the findings of Clifford (2012) and (Wo, 2018). This nonlinearity remains when controlling for possible spatial dependence of local authorities: With the exception of 1971, we do not observe a spillover effect, that is, density in a given area influences the level in neighboring local authorities. However, caution is advised when interpreting these results: There are relatively few local authorities located on the extreme end of the deprivation scale (i.e., most deprived) and many are based in London. Thus, the nonlinear trend may be a consequence of the “headquarter effect,” whereby charities base their main office in large conurbations, which in turn tend to be more deprived than their more rural counterparts. Finally, looking across time periods within a given local authority, we find tentative evidence that density responds to changes in deprivation: as a local authority becomes more deprived, the level of charity density increases.
Second, there is significant temporal variation in the nonlinear trends observed: In 1971 and 2001, the least deprived local authorities had the highest predicted level of charity density, whereas, in 1981 and 1991, the most deprived areas had the highest predicted density. This is an important addition to the literature in this field as previous studies have chosen or been unable to observe density across multiple time periods. We also observe the distribution becoming more U-shaped (i.e., symmetrical) over time, resulting in similar levels of density for the most and least deprived local authorities. This raises the intriguing possibility that prominent policy initiatives have begun to redress some spatial inequalities in the distribution of organizations. From 1997 through to 2010, the Labour governments pursued strong programs of neighborhood regeneration, targeted particularly at disadvantaged areas. However, testing at a more local spatial scale would be necessary as these programs were highly targeted at the most disadvantaged areas.
Third, the heterogeneous nature of the charity sector reveals important differences in the association between charity density and social need. In contrast to national and overseas organizations, local charities tend to locate in more affluent local authorities, which is unsurprising, given the need for philanthropic sufficiency in the form of social entrepreneurs, infrastructure, and a pool of volunteers and donations (Wo, 2018). There is a higher level of predicted charity density in less deprived areas than in more deprived areas for Religious charities, whereas the obverse is the case for Development and Education organizations. This variation by subsector is consistent with the results of Van Puyvelde and Brown (2016) and da Costa (2016).
There are a number of limitations that must be acknowledged. We only capture formal voluntary organizations that are registered as charities. The implication is a likely underestimate of the totality of voluntary activity in general, but particularly for more deprived areas that tend to be more reliant on informal associations than formal institutions (Clifford, 2012; Knight, 1993). We measure our variables at a higher level of aggregation (local authority) and thus do not capture the degree of heterogeneity within units of analysis (e.g., variation in deprivation by neighborhood). Finally, due to the historical focus of this study, it was not possible to obtain data on charitable expenditure; such information is only available from the late 1990s and, furthermore, there are limitations to how far we can apportion it across communities to reflect known features of the activities of charitable organizations (see Kane & Clark, 2009).
Conclusion
Responding to the call for empirical scholarship employing more advanced statistical methodologies (Yan et al., 2014), this study shows longitudinal patterns in the distribution of charity density and its relationship with social need in England and Wales across five census periods. Our results suggest that charity density decreases as local authorities become more deprived, until a certain level of deprivation is reached and density increases (often to levels comparable with those found in much less deprived areas). This trend is also contingent on the type of charity we are interested in: Local charities are more likely to be found in the least deprived local authorities, whereas the obverse is true for national and overseas organizations. Recent change in the distribution of charities in England and Wales suggests some growth in disadvantaged local authorities, perhaps reflecting the mix of pragmatic and charitable concerns suggested by Fruttero and Gauri (2005). For example, the availability of spatially targeted funding streams in the most disadvantaged local authorities may have influenced charity numbers in an upward direction—both a pragmatic concern (the availability of funding) and a charitable one (meeting social needs). In addition, it may be more affordable to establish operations in a more deprived area, while also potentially being closer to the organization’s client base. High density in the least deprived areas may be explained by the presence of sufficient “enabling resources” (Musick & Wilson, 2008) that volunteers and founders can draw upon.
In focusing on the joint distribution of organizations and disadvantage, the article raises the question of whether it is possible to identify an appropriate level of density relative to social need (Lecy & Van Slyke, 2013). At a time of greater expectations of charitable endeavors, the evidence of enduring inequalities between areas suggests structural limitations on what charity can and cannot do. If prior organizational density is such a strong predictor of current density, and if the pattern has been stable over four decades, then it will surely take enormous efforts to change the organizational distribution. This pessimistic view, which suggests that little can be done about these inequalities, would suggest that there are no direct practical implications of this work.
However, we believe that this would be a limited conclusion and we offer two reasons for this. These concern the wider public benefits for communities that arise from the presence of voluntary organizations. First, research from the United States suggests that the presence of other nonprofits in an area is usually beneficial to the fiscal health of these organizations up to a certain level of density (Paarlberg et al., 2018). Second, proponents of greater equality in the distribution of voluntary organizations might turn for support to the neighborhood effects literature. Drawing on a major research program in Chicago, Sampson (2012, Chapter 8) has shown the significance of organizational density for collective action and well-being. His arguments have been echoed by findings elsewhere (Klinenberg, 2018) while recent scholarship (Deri-Armstrong et al., 2016; Mohan & Bennett, 2019) has pointed to the contribution that a dense organizational presence makes to the likelihood of volunteering. Thus, one might make an argument that it is appropriate to provide support for the infrastructure for voluntary action to ensure that there is a functioning organizational base in all communities. Knowledge of the enduring community-level variations described in this article is highly relevant to the targeting of such efforts even if our overall conclusion must be that, on the basis of the past four decades, we should not expect rapid shifts in the distribution of registered charities.
Supplemental Material
nvsq-accepted-charity-density-and-social-need_a-longitudinal-perspective_supplementary-materials_20200118 – Supplemental material for Charity Density and Social Need: A Longitudinal Perspective
Supplemental material, nvsq-accepted-charity-density-and-social-need_a-longitudinal-perspective_supplementary-materials_20200118 for Charity Density and Social Need: A Longitudinal Perspective by Diarmuid McDonnell, John Mohan and Paul Norman in Nonprofit and Voluntary Sector Quarterly
Footnotes
Acknowledgements
The authors would like to thank the editor and three anonymous reviewers for their detailed and critical comments on the article. David Clifford and Vernon Gayle provided valuable methodological insight on the research design. We are indebted to the teams at PopChange and the National Council for Voluntary Organisations (NCVO) for providing us with high-quality data relating to local authorities and charities, respectively.
Authors’ Note
Any remaining errors and shortcomings are the sole responsibility of the authors.
Declaration of Conflicting Interests
The author(s) declared no potential conflicts of interest with respect to the research, authorship, and/or publication of this article.
Funding
The author(s) disclosed receipt of the following financial support for the research, authorship, and/or publication of this article: PopChange was funded by the Economic and Social Research Council (ESRC) under the Secondary Data Analysis Initiative (SDAI), Phase 2 (project ES/L014769/1). Finally, this research has benefited enormously from the generous support of the Leverhulme Trust through a Research Project Grant (ref: RPG-2017-102).
Research Data
Supplemental Material
Supplemental material for this article is available online.
Author Biographies
References
Supplementary Material
Please find the following supplemental material available below.
For Open Access articles published under a Creative Commons License, all supplemental material carries the same license as the article it is associated with.
For non-Open Access articles published, all supplemental material carries a non-exclusive license, and permission requests for re-use of supplemental material or any part of supplemental material shall be sent directly to the copyright owner as specified in the copyright notice associated with the article.