
Abstract
Periodontal disease is a common disease of dogs and is initiated by the buildup of plaque on the tooth surface. As plaque matures, it becomes mineralized to form calculus, which although not directly involved in the etiology of periodontal disease, provides an irregular surface to which plaque can adhere. Evaluation of the quantity of plaque and calculus on dogs’ teeth is therefore essential to enable the efficacy of products, designed to prevent or retard plaque and calculus accumulation, to be evaluated. The objective of this study was to determine whether quantitative light-induced fluorescence (QLFTM) is a suitable tool to quantify the amount of calculus on the buccal surface of dogs’ teeth following the removal of disclosed plaque by tooth brushing. The amount of calculus on the teeth of 26 miniature schnauzers was measured, using QLF and a calculus index method (Warrick-Gorrel), during a 28-day phase crossover study comparing feeding a daily dental chew versus providing no daily chew. Quantification of calculus using the Warrick-Gorrel method showed a 43.8% reduction in calculus buildup, with 95% confidence interval of 27.3 to 60.3 (P < .001). With QLF, the percentage reduction in calculus accumulation was 65.8% (58.1-73.4, P < .001). A retrospective sample size analysis showed that fewer dogs were required for QLF analysis compared to the Warrick-Gorrel method. This study demonstrated that QLF is a sensitive and precise method for quantification of calculus on dogs’ teeth. It removes the subjective element of human examiners and has greater accuracy and reduced variability through the continuous nature of the data.
Introduction
Periodontal disease is the most frequently occurring oral disease of dogs. 1 –6 The disease is initiated by the attachment of bacteria to the salivary pellicle on the tooth surface. 7 As this microbial plaque biofilm ages and thickens, it can extend under the gingiva, often giving rise to an inflammatory response (gingivitis). This can result in further damage to the tissues supporting the tooth causing loss of attachment (periodontitis). The accumulation on the plaque of calcium salts (primarily calcium carbonate and apatite), proteins, and minerals from saliva and gingival crevicular fluid and food materials causes it to mineralize and form dental calculus. 8 –13
Calculus is not directly involved in the etiology of periodontal disease, but it does provide an irregular surface to which plaque bacteria can adhere and has been shown to affect the severity of periodontal disease in dogs. 14,15 The alkaline pH of canine saliva (approximate pH of 8.5) provides a favorable environment for mineralization and calcium formation. 16,17 Calculus is often clearly visible on dogs’ teeth, but despite this, there is a lack of detailed information about its prevalence in the dog population. Examination of 31 484 dogs by veterinary practitioners during visits to private veterinary practices in the United States reported the prevalence of dental calculus to be 20.5%. 5 A higher prevalence of 61.3% was reported in a study of 408 dogs presented at a private Czech urban veterinary hospital. 3 The amount of calculus on the teeth is more prevalent in small breed dogs and has been shown to increase with age. 3,18,19
Calculus can only be thoroughly removed by professional dental cleaning while the dog is under anesthesia. However, calculus formation can be prevented by the removal of plaque from the tooth surface through regular tooth brushing. 20 –24 Although tooth brushing is the “gold standard” method for preventing plaque and calculus buildup on dogs’ teeth, and is recommended by veterinarians, client compliance is generally poor and many dogs will not tolerate tooth brushing. 25,26 The provision of alternative solutions is therefore essential to ensure good oral health for the entire dog population. The mechanical action of chewing by dogs has been shown to have significant oral health benefits, not only in the reduction of plaque and calculus accumulation but also with respect to gingival inflammation and periodontal bone loss. 18 A number of studies have demonstrated the efficacy of raw beef bones, oxtails, 27,28 and rawhide chews 29 for the reduction of calculus deposits on dogs’ teeth. There has also been a strong emphasis on the development of tailored products, including specially textured diets, 30 diets that contain chemical chelating agents and antimicrobials, 31 –34 dental chews and biscuits either with or without chemical additives to enhance their efficacy, 29,35 –42 and water-containing functional ingredients. 43 The accurate evaluation of the quantity of plaque and calculus on dogs’ teeth is therefore essential to enable product efficacy to be measured. For this reason, the Veterinary Oral Health Council (VOHC) was established in the 1990s. The council defines standardized protocols for product efficacy testing. When applied, if the VOHC’s standards for plaque and calculus reduction are met, the product is awarded the VOHC seal of acceptance. a
The majority of methods used to quantify plaque and calculus on dogs’ teeth have been adapted from the human field. Broadly, the methods can be divided into 2 main types: plaque indices and planimetry. Plaque indices utilize highly trained human examiners to estimate the area of the tooth covered by plaque and its thickness, following disclosure of the plaque. 44 Calculus coverage and thickness are then determined following the removal of the plaque by tooth brushing 37 using similar indices. Plaque and calculus indices, although commonly used, have been criticized for their poor resolution, subjectivity, and the requirement for an experienced examiner. 44,45 Planimetry is more objective as the tooth surface is photographed, usually after staining the plaque using a disclosing solution, and then the area of plaque is measured using computer analysis software. 27 Recently, a new planimetric method has been validated for the quantification of plaque on teeth of dogs and cats called quantitative light-induced fluorescence (QLF). This method has been shown to be repeatable, reproducible, and accurate and showed a similar percentage of plaque reduction as a routinely used plaque index method. 46,47 The objective of this study was therefore to determine whether QLF can be used to quantify the amount of calculus on the buccal surface of dogs’ teeth following the removal of disclosed plaque by tooth brushing.
Materials and Methods
Study Design
A randomized crossover study was undertaken to determine the agreement between QLF and the modified Logan and Boyce method for quantifying the amount of plaque on dogs’ teeth. 46 During the study, the amount of calculus on the tooth surface was also measured to determine the feasibility of using QLF for the quantification of calculus. Briefly, 26 miniature schnauzers, aged between 1.4 and 8.2 years, were divided into 2 groups, and in the first phase of the study, one group received a daily dental chew b and the other group did not. The groups were then swapped onto the other treatment for the following phase of the study. Throughout the study, dogs were maintained on a commercially available dry diet (Royal Canin Medium Adult, Royal Canin). At the start of each phase, dogs received a full-mouth scale and polish followed by 7 days of tooth brushing. This was followed by a 28-day test phase, at the end of which the dog was given a general anesthetic and the amount of calculus on the buccal surface of teeth was determined using the Warrick-Gorrel method and QLF (see subsequently for details). The data presented here were collected as part of another study. 46 The study was approved by the WALTHAM Animal Welfare and Ethical Review Body and run under licensed authority in accordance with the UK Animals (Scientific Procedures) Act 1986.
Calculus Scoring Criteria (Warrick-Gorrel Method)
At the end of each test phase, following the quantification of dental plaque, calculus was scored using the Warrick-Gorrel method. 38 First, disclosed plaque was removed by gentle tooth brushing, the surface of the tooth was then rinsed using water, and the tooth surface dried using a dental air–water syringe. The buccal surface of the tooth was divided vertically into mesial, buccal, and distal thirds, and each third assigned a numerical score for both coverage and thickness. A periodontal probe was used to confirm the extent of coverage and to measure the thickness of the calculus. It should be noted that the VOHC no longer permits the use of vertical division of teeth for product efficacy trials. The teeth scored were those defined by the VOHC: the maxillary third incisor (I3), canine (C), third and fourth premolar (P3, P4) and first molar (M1), and mandibular C, P3, P4, and M1. The coverage score ranged from 0 to 4, where 0 was no observable calculus, 1 coverage on less than 24% of buccal tooth surface, 2 coverage on 25% to 49%, 3 coverage on 50% to 74%, and 4 coverage on greater than 75% of the buccal surface. The thickness score ranged from 1 to 3, where 1 was defined as thin (<0.5 mm), 2 moderate thickness (0.5-1.5 mm), and 3 thick (>1.5 mm). Examiners (n = 5) were trained by a recognized European specialist in veterinary dentistry and, to ensure consistency between examiners, were calibrated 2 weeks prior to the start of the trial.
The quantity of calculus on each tooth was determined in 2 ways: (1) the coverage from each of the 3 areas of the tooth were summed within each tooth (termed “coverage”), and (2) for each of the 3 areas scored per tooth, the coverage score was multiplied by the thickness score and the 3 scores summed to provide an overall tooth score (termed “coverage × thickness”).
Quantitative Light-Induced Fluorescence Image Acquisition and Analysis
The QLF images were taken in a darkened room to ensure consistent lighting. A human plastic cheek retractor was gently inserted into the mouth to allow visualization of the premolars and molars. Images were taken of the 18 teeth defined by the VOHC, as outlined previously. Images were acquired using the QLF-D Biluminator 2 system. c Each image was assessed at the time of acquisition, and if part of the tooth was missed, obscured, or blurred, another image was taken. Figure 1 shows an example QLF image of an individual dog’s teeth, following the removal of disclosed plaque by tooth brushing, when fed a commercial dry diet alone and when fed a commercial dry diet plus a daily dental chew.
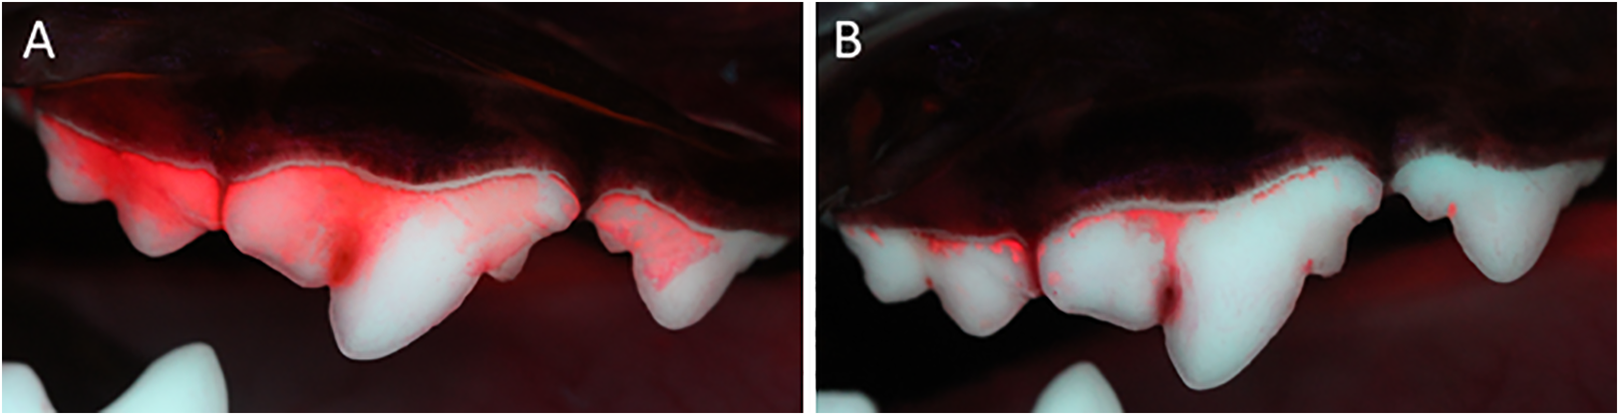
Example QLF images of an individual dog’s teeth following the removal of disclosed plaque by tooth brushing when (A) fed a commercial dry diet alone or (B) a commercial dry diet plus a daily dental chew over a period of 28 days. The teeth represented are maxillary third and fourth premolars and first molar. QLF indicates quantitative light-induced fluorescence.
The software provided with the QLF camera (Inspektor-Pro QA2 version 1.23) c was used to define the area of red fluorescence on the tooth surface at various fluorescence intensities in relation to the total tooth area (%ΔR) with the ΔR30 used in the analysis. When the number of pixels with red fluorescence was greater than the tooth area, the algorithm occasionally incorrectly assigned a 0% coverage score. In this instance only, a value of 100% was manually imputed; this occurred in 3% of cases. This was caused by the absence of white tooth due to the entire tooth being covered in calculus. This resulted in the software not being able to accurately differentiate the pink fluorescing calculus from the gum tissue and therefore resulted in a slight overestimation of the number of pink pixels.
The overall percentage of calculus coverage in the mouth was calculated in 2 ways: (1) the average percentage calculus across the 18 VOHC teeth, termed “average mouth” and (2) the total calculus on the 18 VOHC teeth divided by the total area of all the teeth and multiplied by 100 to determine the overall percentage calculus in the mouth, termed “weighted mouth.”
Statistical Analysis
Data exclusion criteria
Data were excluded from analysis if the protocol was not followed, which included dogs consuming the chew less than 98% of the time, being fed a chew when on the no chew phase of the study, or being tooth brushed by mistake. This resulted in 5.7% of the data being excluded due to 3 dogs being tooth brushed by mistake during the no chew phase of the study.
To ensure QLF and Warrick-Gorrel methods could be directly compared, dogs were excluded from the analysis if the 18 teeth defined by the VOHC were not visible due to part of the tooth being obscured on the QLF images (eg, lips or hair covering tooth, image blurred). Dogs were also excluded if data from the Warrick-Gorrel method were absent. This resulted in 17 dogs being included in the analysis where data from all 18 teeth defined by the VOHC were acquired for both phases of the trial using both methods.
Treatment effect
The quantity of calculus in the mouth was determined using QLF (average mouth and weighted mouth) and the Warrick-Gorrel method (coverage and coverage × thickness). This was analyzed using linear mixed-effects models (LMM), with dog as a random effect and chew as a fixed effect. Means and differences between means were estimated with 95% confidence intervals and a controlled family-wise error rate of 5%.
Sample size analysis
The within- and between-dog variances from these data were used to estimate the sample size needed for a 2-way crossover study to detect a 15% reduction of calculus with at least 90% power, when dogs are fed a daily dental chew versus no chew. The analyses were performed by simulation (1000) for a mixed-model analysis with dog as a random effect and diet as a fixed effect. Statistical analyses were performed in R software v3.3.2, 48 using libraries nlme 49 and multcomp. 50
Results
Agreement Between Warrick-Gorrel and QLF
After applying the predefined exclusion criteria (see “Methods” section), both Warrick-Gorrel and QLF data were available for 612 teeth (17 dogs, 18 teeth per dog, 2 phases). Analysis of the data using LMM showed statistically significant differences in the amount of calculus accumulation on the buccal surface of the teeth between dogs receiving a standard diet or a standard diet supplemented with a daily dental chew. This was observed using both QLF and the Warrick-Gorrel method (Table 1).
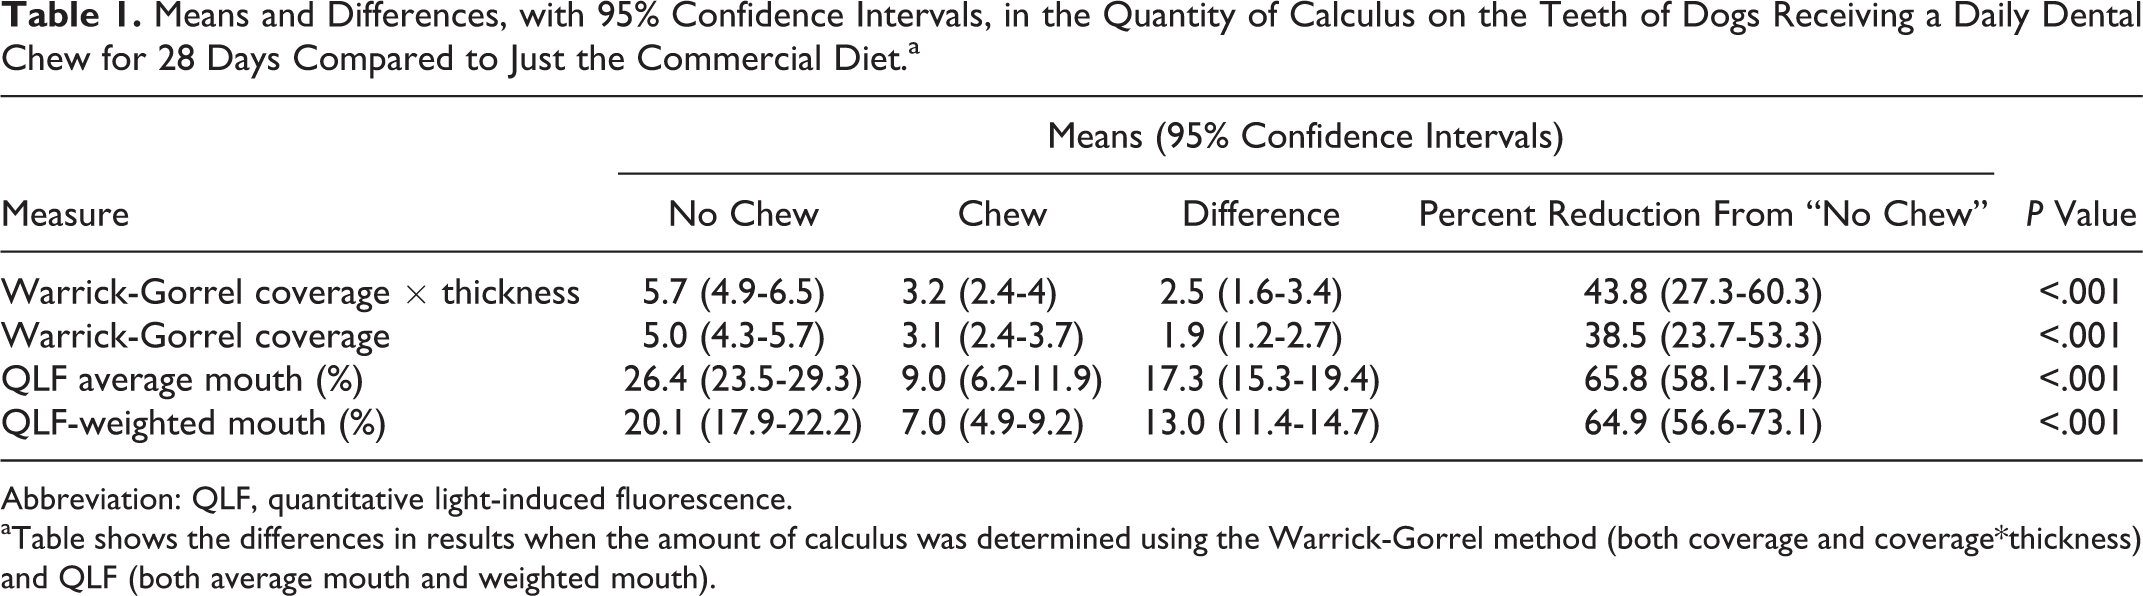
Means and Differences, with 95% Confidence Intervals, in the Quantity of Calculus on the Teeth of Dogs Receiving a Daily Dental Chew for 28 Days Compared to Just the Commercial Diet.a
Abbreviation: QLF, quantitative light-induced fluorescence.
aTable shows the differences in results when the amount of calculus was determined using the Warrick-Gorrel method (both coverage and coverage*thickness) and QLF (both average mouth and weighted mouth).
Quantification of calculus using the Warrick-Gorrel method (coverage × thickness) showed a 43.8% reduction in calculus buildup, with 95% confidence interval of 27.3 to 60.3, when dogs receiving a daily chew were compared to those that did not (P < .001). If coverage alone was included in the analysis, then the reduction in calculus accumulation was lower at 38.5% (23.7-53.3, P < .001).
When the amount of calculus on the teeth was quantified using QLF (average mouth), dogs receiving a daily dental chew had a 65.8% (58.1-73.4) reduction in calculus accumulation compared to dogs receiving the standard diet alone (P < .001). When a weighted mouth score was used to account for the varying sizes of teeth in the mouth, a similar reduction in calculus accumulation was obtained 64.9% (56.6-73.1, P < .001; Table 1). An exploratory plot of average mouth versus weighted mouth showed that the 2 types of analyses were correlated (Spearman rank correlation ρ was .95; Figure 2). The difference, however, increased with increasing percentage calculus coverage. For example, when the percentage calculus coverage was approximately 30% using the average mouth calculation (the maximum percentage calculus observed in this study), this equated to approximately 20% if the size of the teeth is taken into consideration (weighted mouth).
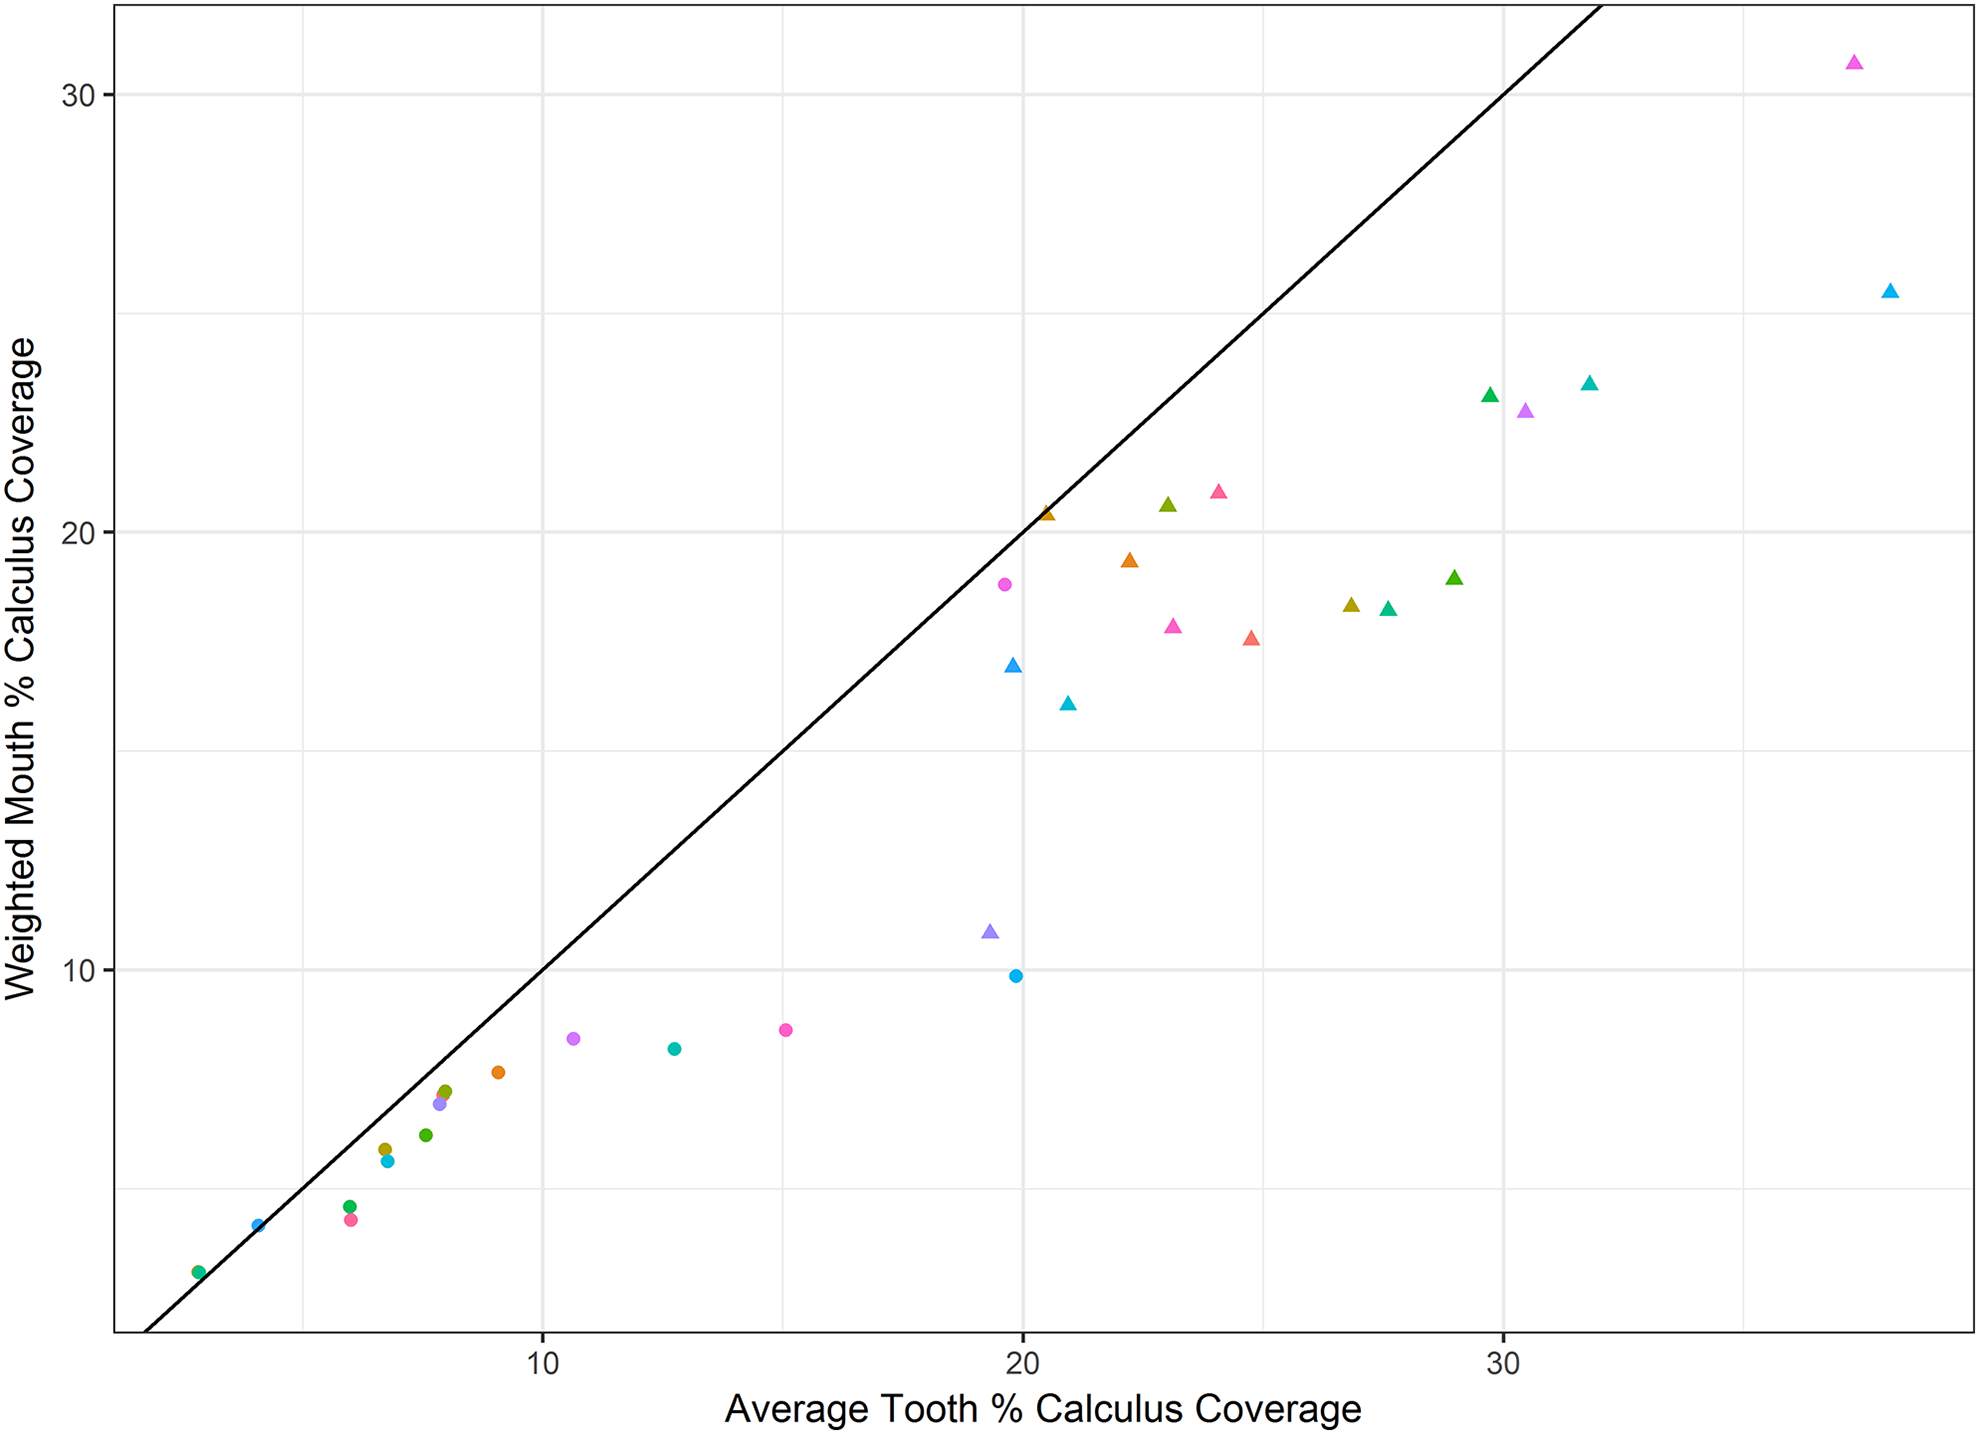
Exploratory plot of percentage calculus measured using QLF: Average mouth versus weighted mouth. Circles represent dogs receiving a daily chew, triangles dogs receiving a standard diet only and colors represent individual dogs. The black solid line illustrates a 1:1 ratio.
Retrospective Sample Size Analysis
A retrospective sample size analysis, using the within- and between-dog variances from each data set, showed that the Warrick-Gorrel method would require over 30 dogs to detect a 15% reduction in calculus accumulation between dogs receiving a dental chew compared with no chew with 90% power (Figure 3): With 30 dogs, only 67% to 75% power would be achieved. The QLF required fewer dogs than the Warrick-Gorrel method; with 13 to 15 dogs (average mouth and weighted mouth, respectively), a 15% reduction in calculus accumulation between dogs receiving a dental chew compared with no chew could be detected with 90% power.
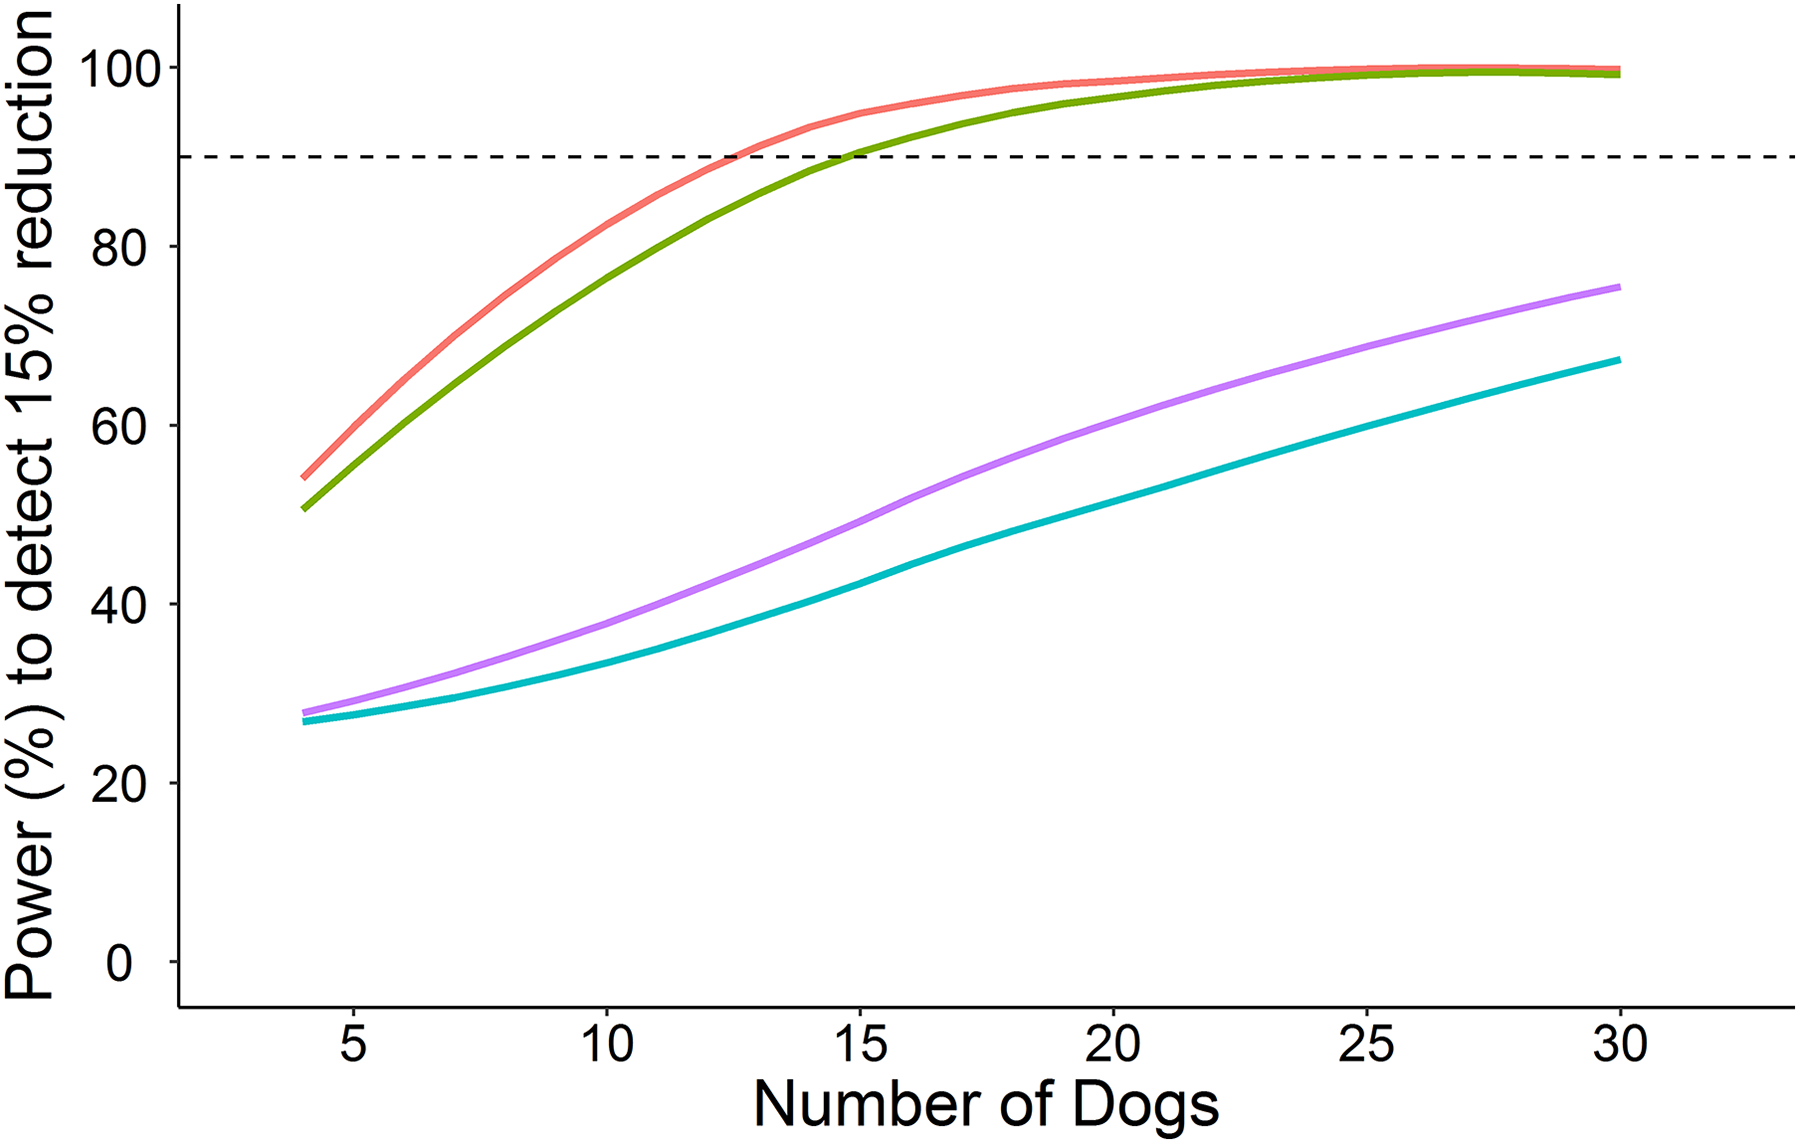
Power curves showing the number of dogs required to detect a 15% reduction in calculus accumulation when fed a dental chew compared to no chew in a 2-way crossover trial with 90% power (dashed line). Warrick-Gorrel method is depicted by blue (coverage × thickness) and purple (coverage) lines, and QLF is depicted by red (average mouth) and green (weighted mouth) lines. QLF indicates quantitative light-induced fluorescence.
The differences between the 2 methods in the number of dogs required are due to the larger within-dog variability for the Warrick-Gorrel method compared to QLF (Figure 4). Using QLF, all dogs showed the same trend in that the percentage of calculus was higher when dogs were on the no chew phase of the study than the dental chew phase. In contrast, when using the Warrick-Gorrel method, some dogs were contradictory to the treatment effect and so to each other.
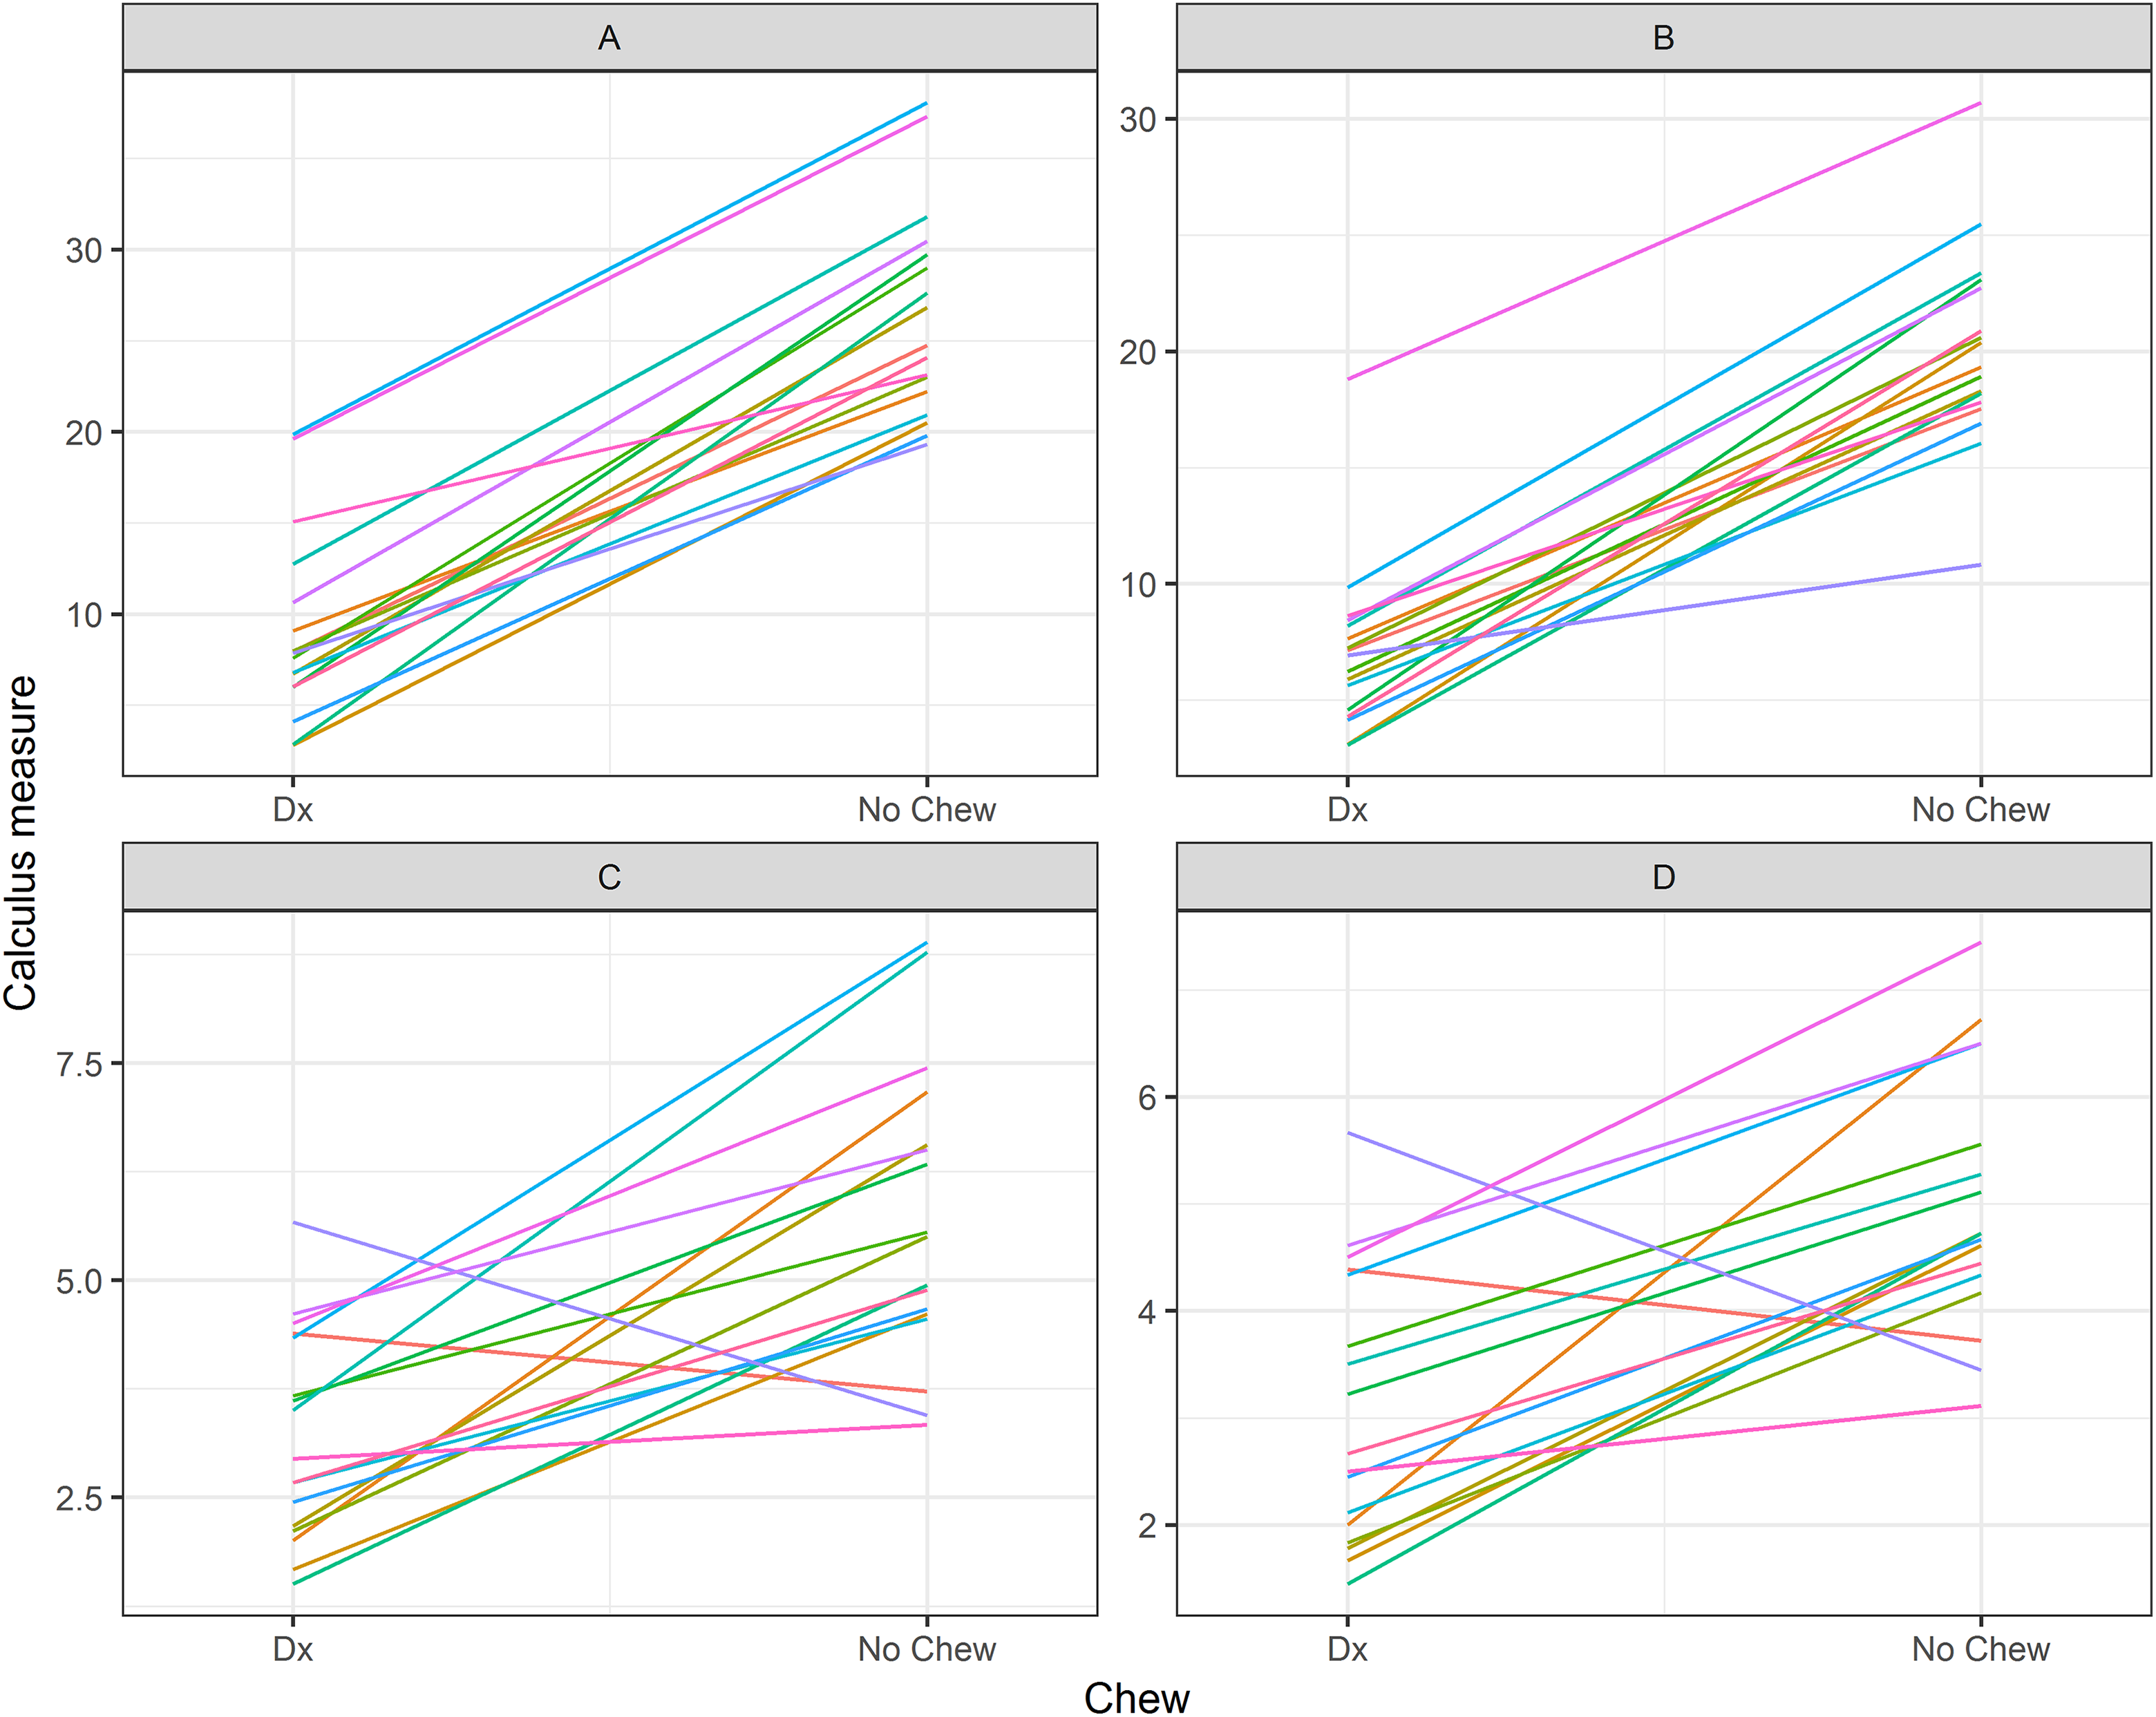
Calculus measured using (A) QLF average mouth, (B) QLF-weighted mouth, (C) Warrick-Gorrel coverage × thickness, and (D) Warrick-Gorrel coverage when dogs were fed a daily chew for 28 days compared to the standard diet only. Colored lines represent the individual dogs. QLF indicates quantitative light-induced fluorescence.
Discussion
Previous studies have demonstrated that QLF is a repeatable, reproducible, and accurate method for quantifying plaque on the buccal surface of dogs’ and cats’ teeth. 46,47 In this study, we have also shown that QLF can be used to detect calculus on the buccal surface of dogs’ teeth following disclosure of the plaque using a standard disclosing solution and subsequent removal by tooth brushing. A significant reduction in calculus accumulation was measured using both the QLF (65.8% [58.1-73.4], P < .001) and the Warrick-Gorrel index methods (43.8% [27.3-60.3], P < .001) when dogs were fed a commercial dry diet with the addition of a daily dental chew compared to a dry diet alone. The percentage reduction in calculus accumulation was however larger for QLF than the Warrick-Gorrel method, which might be due to some of the red disclosing dye still remaining within the calculus matrix. This would have been detected by QLF, but it is also likely that it would also have been visible to the human scorer. Alternative explanations for the observed differences include the following: (1) QLF is detecting natural bacterial fluorescence under blue light which would not be visible using the Warrick-Gorrel method. This is supported by the fact that canine calculus has been reported to fluoresce pink to red under long-wavelength ultraviolet light due to the presence of the bacterial component porphyrin. 51 It is plausible that there are bacteria trapped within the calculus because plaque samples, and bacterial cultures grown from calculus deposits from dogs, have also been shown to autofluoresce. 52,53 (2) The QLF and the Warrick-Gorrel methods utilize different numerical scales: QLF measures the percentage calculus coverage, which is continuous data, whereas the Warrick-Gorrel uses predefined categories for calculus coverage and thickness and therefore yields ordinal data. (3) The Warrick-Gorrel method had larger within-dog variability compared to QLF. At the time of writing the VOHC stipulates for products to be awarded the VOHC seal of acceptance, the mean calculus score of the test group must be statistically significantly better than the control group and has a minimum reduction in mean calculus score of 15% in each trial and 20% in the mean of 2 trials. Given the differences in percentage reduction in calculus accumulation between the 2 methods, the minimum reduction in mean calculus score may need to be reviewed if QLF is used in VOHC product efficacy trials.
Traditionally, a combination of coverage and thickness has been applied to both plaque and calculus measurements in dogs. 38,44 This was due to the potential for fragments of calculus to be lost, particularly in longer term studies, due to mechanical abrasion. 54 This study showed a smaller reduction in percentage calculus when only coverage was taken into consideration (38.5% [23.7-53.3], P < .001) compared to the combined coverage and thickness score (43.8% [27.3-60.3], P < .001). Currently, QLF has only been used to measure the extent of plaque coverage, and thickness of plaque and calculus has not been taken into consideration. This study of canine calculus and previous studies of canine and feline plaque using QLF have only determined the percentage coverage using the fluorescence intensity at ΔR30. However, studies of human population have shown that the red fluorescence intensity is closely linked to plaque depth and maturation. 55 Further studies are required to evaluate the validity of using a higher ΔR intensity value, increased red to green ratio due to plaque or calculus in relation to that of the tooth surface, to determine plaque and calculus thickness.
In dogs, the buccal surfaces of the teeth are more variable in size and shape than those of humans. 56 As plaque and calculus on the larger teeth have a greater surface area in contact with the gingival tissue, and therefore potentially have a bigger impact on the body, scoring systems have been proposed that take into account the size of the teeth. 56,57 In this study, a similar reduction in calculus accumulation was measured when using a weighted mouth score (64.9% [56.6-73.1], P < .001) compared to averaging across all teeth (65.8% [58.1-73.4], P < .001). The 2 approaches used to calculate the percentage calculus coverage across all 18 teeth defined by the VOHC were correlated (Spearman rank correlation ρ was .95). However, the difference between the 2 methods enlarged as the percentage calculus coverage increased. For example, an average mouth score of 30% equated to a weighted mouth score of approximately 20%. More data at the extremes of the scale for individual teeth are required to determine the true extent of the impact of tooth size on the overall mouth score. In this study, the maximum percentage calculus coverage was approximately 30%, and it is likely that the 2 methods would depart from each other more with higher levels of calculus coverage.
A retrospective sample size analysis showed that QLF required fewer dogs (13 for average mouth calculation and 15 for weighted mouth) compared to over 30 dogs with the Warrick-Gorrel method to detect a 15% reduction in calculus accumulation between dogs fed a daily dental chew compared with no chew with 90% power. This supports recommendations to invoke the “3Rs” of the humane use of animals in scientific research. 58 In this case, reduction was accomplished in the number of animals used per experiment. Refinement was achieved in that it is quicker to obtain QLF images than to score using the Warrick-Gorrel method. This resulted in reduction of the duration of anesthesia. This finding is probably due to the increased sensitivity and precision of QLF compared to the Warrick-Gorrel method. In this study, all the dogs had higher levels of calculus when fed the dry diet compared to the dry diet combined with a daily dental chew when using QLF. However, when calculus was scored using the Warrick-Gorrel method, some of the dogs were contradictory to the treatment effect and therefore to each other.
In conclusion, QLF is a sensitive and precise method for quantifying the amount of calculus on dogs’ teeth following the removal of plaque by tooth brushing. As the method appears to measure a greater reduction in calculus accumulation than the Warrick-Gorrel method, the VOHC standard of a 20% reduction in calculus accumulation may need to be reviewed to account for the different methodologies used. The QLF has the added advantage that it is automated and therefore removes the subjective element of the human examiner. It has greater accuracy and reduced variability through the continuous nature of the data and the use of image analysis software. Fewer dogs are required for product efficacy trials supporting the 3Rs principle of humane animal research, and the capturing of photographic images of the teeth provides a permanent record of the study. It may also be feasible to quantify the amount of calculus in conscious dogs, as has been demonstrated for plaque measurements using QLF.
Footnotes
Acknowledgments
The authors would like to acknowledge all the staff and dogs at WALTHAM, without whom this study would not have been possible.
Declaration of Conflicting Interests
The author(s) declared no potential conflicts of interest with respect to the research, authorship, and/or publication of this article. Corrin Wallis, Judi Allsopp, Alison Colyer, and Lucy Holcombe however, were employees of the WALTHAM Centre for Pet Nutrition (Mars Petcare) at the time of this study. Mars Petcare has been filed a patent based on information from a previous study by Wallis et al. (2016) and the data in this manuscript may be used to support the patent. The patent is entitled “Methods for quantifying plaque in pet animals” (Publication Number WO/2016/075492).
Funding
The author(s) disclosed receipt of the following financial support for the research, authorship, and/or publication of this article: This study was funded by the WALTHAM Centre for Pet Nutrition (Mars Petcare).