
Abstract
Keywords
Introduction
Engagement in physical activity (PA) may help preserve cognitive function in older adults by promoting neuro-resilience and exerting anti-inflammatory effects, which regulate body weight, cytokines, insulin sensitivity, and endothelial function (Mahalakshmi et al., 2020). Age-related neuropsychological diseases are expected to increase significantly as the United States (US) older population grows. PA is a protective factor of cognitive function that may slow cognitive decline or reduce the risk of neurodegenerative diseases.
However, the relationship between PA and cognitive function may vary based on individual demographic characteristics, health conditions, and behavior factors, many of which have not been fully accounted for in previous research. The factors affecting PA and cognitive outcomes include but are not limited to sex, age, education, marital status, income status, employment status, smoking status, levels of social engagement, alcohol consumption, depressive symptoms, and sleep disturbance (Amini et al., 2021; Duffner et al., 2023; Liu et al., 2019; Lövdén et al., 2020; Pearce et al., 2022; Pieh et al., 2020; Sewell et al., 2021; Steptoe & Zaninotto, 2020). Understanding how other factors influence the association between PA and cognition in subgroups is essential for designing targeted PA interventions that maximize cognitive benefits for diverse subgroups of older adults. Unlike previous studies that relied on self-reports or non-population-level data (e.g., from a single study sample), this study employed performance-based cognitive assessments (neuropsychological tests) and device-based measures of PA (using accelerometers). It also focused on a nationally representative sample of older adults aged ≥60 years, enhancing the validity of the findings.
Existing studies that seek to characterize the associations between PA and cognition often applied different cognitive measurement tools or only captured a single cognitive domain (Blondell et al., 2014; Volders et al., 2021). The heterogeneity of cognitive measures makes comparisons between studies challenging and sometimes leads to mixed conclusions due to the absence of a standard or integrative cognitive outcome. For example, there is noticeable age-related cognitive decline that varies across cognitive domains, with attention and memory being most severely affected by aging, followed by executive functions and processing speed (Glisky, 2007). However, findings focusing on a single cognitive domain may not be replicated by other studies that assess different cognitive domains. To address this potential issue, the current study analyzed NHANES data and employed standardized tools from the Mobile Examination Center to create a composite cognitive score that comprises an individual’s performance in the memory, executive function, and processing speed domains. Our approach will facilitate comparison between studies by adopting a more comprehensive view of cognitive function.
Similarly, relying on subjective measures to assess PA levels can introduce biases in estimating the association between PA and cognition. Most observational studies have utilized self-reported measures, such as moderate to vigorous PA (MVPA), step counts, and metabolic equivalents (METs), to evaluate the PA-cognition association (Tudor-Locke & Aguiar, 2019; Wei et al., 2021). To address this limitation, this study utilizes the outcomes from the accelerometer-based measure, which employs the device-independent Monitor Independent Movement Summary (MIMS) unit to quantify PA levels across all intensities objectively (John et al., 2019). This approach captures MVPA and lower-intensity movements, particularly important for accurately describing the activity levels of older adults who primarily engage in light physical activity daily (Amireault et al., 2019). The MIMS units were calculated using the ActiGraph wrist-worn research-grade accelerometer, which is considered less interruptive during sleep and has higher user compliance (Kamada et al., 2016).
Following the standard approach to calculating two MIMS outcomes, this study first examined the associations between total PA levels (mean daily MIMS) and higher-intensity PA levels (mean Peak-30 MIMS) with cognitive function in subgroups of older adults (Zheng et al., 2022). Second, to provide a more nuanced contribution beyond the existing literature, the current study conducted a comprehensive analysis examining the associations among different percentiles of daily physical activity, Peak-30, and cognitive function. This approach allowed us to delineate how varying levels of PA are linked to cognitive outcomes. Lastly, this study also compared the PA-cognition associations among older adults with varying cognitive abilities. This analysis will advance our understanding of whether the positive PA-cognition association holds consistently regardless of older adults’ current cognitive status.
Methods
Study Design and Sample
The current study used data from two NHANES cycles, 2011−2012 and 2013−2014, including 2,547 older adults aged 60 or older with physical activity (2011–2012: wwwn.cdc.gov/Nchs/Data/Nhanes/Public/2011/DataFiles/PAXMIN_G.htm; 2013–2014: wwwn.cdc.gov/Nchs/Data/Nhanes/Public/2013/DataFiles/PAXMIN_H.htm) and cognitive function measures (2011–2012: wwwn.cdc.gov/Nchs/Data/Nhanes/Public/2011/DataFiles/CFQ_G.htm; 2013–2014: wwwn.cdc.gov/Nchs/Data/Nhanes/Public/2013/DataFiles/CFQ_H.htm). NHANES is a complex, multi-stage, stratified, clustered probability sampling survey for a nationally representative sample of the civilian, non-institutionalized US population at the Centers for Disease Control and Prevention. The 2011–2014 cycle included device-based PA recorded by a wrist-worn accelerometer and performance-based cognitive function measures from the Mobile Examination Center. The wrist-worn accelerometer recorded the participants’ 24-hour movements, awake and asleep, for seven consecutive days. The Mobile Examination Center assessed memory, executive function, processing speed, and attention by the Consortium to Establish a Registry for Alzheimer’s Disease Word List Memory Task (CERAD-WL), the Digit Symbol Substitution Test (DSST), and the Animal Fluency Test (AFT), respectively.
Measurement of Physical Activity (Peak-30 Minutes of MIMS and Daily Total MIMS)
The actigraphy model GT3X+ measured PA in Monitor Independent Movement Summary Units (MIMS), a device-independent summary metric of raw data. Data from the first and the last wearing days were removed as the actigraphy was in transit. Participants who wore accelerometers for at least 4 days with at least 10 hours of awake-wearing time and fewer than 17 hours of sleep-wearing time were eligible for the study. Daily PA was the average of MIMS across the valid wear days, which we refer to as the mean daily PA (MIMS/day). Peak-30 MIMS was the average of the highest 30 minutes of PA intensity recorded per day across all valid wear days, representing the relatively higher-intensity PA using the MIMS/min unit. Both daily PA and Peak-30 were classified into four percentile-based categories, based on the distribution of PA intensity at “<25%,” “25%–50%,” “50%–75%,” and “>75%” quartiles.
Measurement of Cognitive Function
The Consortium to Establish a Registry for Alzheimer’s Disease Word List Memory Task (CERAD-WL) assessed both immediate and delayed recall of memory (Fillenbaum et al., 2008). For immediate recall, participants were asked to recall as many words as possible after three trials of word presentations in different orders. The score values assigned for trails 1, 2, and 3 were 0 to 9, 0 to 10, and 0 to 10, respectively. Trail 4 assessed delayed recall, where participants recalled the learned words repetitively after completing Digit Symbol Substitution Test (DSST) and the Animal Fluency Test (AFT). The score value for the delayed recall in trial 4 was from 0 to 10. The intrusion word counts were the number of incorrect words recalled during immediate and delayed memory recall, ranging from 0 to 4, 0 to 3, 0 to 5, and 0 to 10 for trails 1, 2, 3, and 4, respectively. The final recall scores were calculated as the sum of scores across the four trials (0–39) minus the number of incorrect words (0–22).
The DSST assessed processing speed, attention, and working memory by measuring corresponding matches between symbols and numbers (Ryan & Lopez, 2001). Before the DSST, a preliminary test was administered to determine the eligibility of participants, where participants who matched the symbols and numbers correctly were eligible for the DSST. During the DSST, the participants spent 2 minutes matching the corresponding symbols in the 133 boxes that adjoin the numbers. Scores ranged from 0 to 105 based on the number of correct matches. AFT measured verbal fluency, which was closely related to executive function (Carone et al., 2007). Before the AFT, a pre-test was delivered to ensure participant eligibility. Participants who correctly named three clothing items were eligible for the AFT. In the AFT, participants were asked to name as many animals as possible in 1 minute, receiving one point for each correctly named animal. The scores for AFT ranged from 1 to 40.
Impaired verbal fluency has been linked to Mild Cognitive Impairment (MCI) or Alzheimer’s disease (AD), where the categorical fluency evaluates the semantic memory and letter fluency tasks assess frontal executive function (Canning et al., 2004; Monsch et al., 1992; Murphy et al., 2006; Nutter-Upham et al., 2008; Rascovsky et al., 2007). Poor performance in verbal fluency can serve as a predictor of disease progression stages (Cintoli et al., 2024). The AFT is widely used to distinguish between normal cognitive function, MCI, and AD by measuring both semantic memory and executive function (Clark et al., 2009; Hanyu et al., 2009; Henry et al., 2004; Spreen & Strauss, 1998). The AFT is particularly advantageous for large-scale NHANES surveys for its time efficiency, lower educational bias, and cultural bias. Furthermore, poor performance on AFT is strongly associated with a higher risk of AD, compared to other cognitive assessments. According to the short standardized mental status examination for MCI and AD, older adults with an AFT score ≤14 were classified as having AD or MCI, while those with a score >14 were considered to have healthy cognitive function (Hanyu et al., 2009). Thus, a binary outcome was created to analyze whether daily PA or Peak-30 is associated with the risk of developing Alzheimer’s disease (AD) or Mild Cognitive Impairment (MCI).
Beyond the outcomes measured from each cognitive test, a global Z-score was calculated to represent overall cognitive function. The scores across cognitive outcomes can be compared or aggregated by standardizing data to a standard scale. Specifically, the test-specific Z scores were generated for the DSST, CERAD-WL, and AFT tests. They were calculated by subtracting each individual’s cognitive score from the sample mean of different specific tests, divided by the standard deviation. The global Z score of cognitive function was the sum of standardized test-specific Z scores.
Measurement of Covariates
Demographic variables that might confound or attenuate the association between PA and cognitive function were collected for adjustment in our analysis. These variables comprised sex, age, race and ethnicity, education, marital status, income, employment status, smoking, social engagement, alcohol consumption, depression, sleep duration, and sleep disturbance. Age was coded as 0 for 60–69, 1 for 70–79, and 2 for 80 years and above, respectively. Sex was coded as 0 for men and 1 for women. Race and ethnicity were coded as 0 for Hispanic, 1 for non-Hispanic Black, 2 for non-Hispanic White, and 3 for other races. Education was coded as 0 for lower than 11th grade, 1 for high school, and 2 for some college or higher. Marital status was coded as 0 for never married, separated, divorced, or widowed, and 1 for married or partnered.
The index of the ratio of monthly income to poverty can evaluate the income levels, which was coded as 0 for <1.30 (higher income) and 1 for index ≥1.3 (lower income), according to the standard poverty guideline (United Way of Connecticut, 2024). Employment status was coded as 0 for individuals not currently working or seeking work, and 1 for those currently working at a job or business. Smoking status was coded as 0 for individuals who never smoked and 1 for individuals who smoked every day or some days. Social engagement was coded as 0 for individuals who had no difficulties in social engagement and 1 for those who had difficulties in social engagement, were unable to, or did not engage socially. Alcohol consumption was coded as 0 for individuals who had fewer than 12 drinks per year and 1 for those who had at least 12 drinks per year. Self-reported sleep duration was categorized as 0 for ≤6 hours (short sleep duration), 1 for 6–9 hours (normal sleep duration), and 2 for ≥9 hours (long sleep duration) (Grandner & Drummond, 2007). Self-reported sleep disturbance was coded as 0 for no sleep disturbance and 1 for disturbance. Similarly, self-reported sleep disorders were coded as 0 for not having disorders and 1 for having disorders.
Depression symptoms was assessed using nine questions, including “Have little interest in doing things,” “Feeling down, depressed, or hopeless,” “Trouble sleeping or sleeping too much,” “Feeling tired or having little energy,” “Poor appetite or overeating,” “Feeling bad about yourself,” “Trouble concentrating on things,” “Moving or Peaking slowly or too fast,” and “Thought you would be better off dead.” Participants must have answered all nine questions to be included. Each question was scored as follows: 0 for no symptoms at all, 1 for symptoms lasting several days, 2 for symptoms lasting more than half the days, and 3 for symptoms occurring nearly every day, resulting in a total score range of 0–27. Depression was coded dichotomously, with scores of 0–4 indicating no depression and scores of 5–27 indicating depression (Kroenke et al., 2001).
Systolic blood pressure (SBP) and diastolic blood pressure (DBP) determine the hypertension status, which was coded as 1 for normal hypertension (SBP < 120 mmHg and DBP < 80 mmHg) and 2 for elevated hypertension (120 mmHg ≤ SBP ≤ 129 mmHg and 80 mmHg ≤ DBP ≤ 89 mmHg), stage 1 hypertension (130 mmHg ≤ SBP ≤ 139 mmHg and 90 mmHg ≤ DBP ≤ 99 mmHg), or stage 2 hypertension (140 mmHg ≤ SBP and 100 mmHg ≤ DBP). Diabetes was coded as 1 if glycohemoglobin ≥6.5% and plasma fasting glucose (PFG) ≥126 mg/dL were reported in laboratory data, or if the individual was taking insulin or had a doctor’s diagnosis. Otherwise, it was coded as 0. BMI was evaluated by a person’s weight in kilograms divided by the square of height in meters from the examination data, coded as 1 for underweight (BMI < 18.5 kg/m2) or normal weight (18.5 kg/m2 ≤ BMI <25 kg/m2), and 2 for overweight (25 kg/m2 ≤ BMI < 30 kg/m2), or for obesity (BMI ≥ 30 kg/m2). Self-reported cardiovascular disease (CVD) was assessed based on the presence of grade 1 or grade 2 angina. Grade 1 angina was coded as 1 for participants who experienced chest pain in the upper or lower sternum, or in both the right arm and chest, within 10 minutes of walking uphill or in a hurried manner, with symptoms alleviated by standing. Grade 2 angina was coded as 2 for those experiencing similar chest pain at an ordinary pace on level ground.
Statistical Analysis
From the NHANES cycles of 2011–2014, 6,677 participants were eligible with accelerometer records, and 2,934 adults completed all four cognitive tests. After excluding those without accelerometer or cognitive test data, the final sample for analysis consisted of 2,547 participants. Normality tests were conducted for the parametric diagnosis of Peak-30 (MIMS/min) and daily PA (MIMS/d) (Mishra et al., 2019), where a normal distribution was found. A quantile regression model was employed to classify Peak-30, daily PA, and overall global cognition into four quantiles, representing increasing levels of PA and cognitive function: “<25%” (Level 1), “≥25%–<50%” (Level 2), “≥50%–<75%” (Level 3), and “≥75%” (Level 4).
For the demographic characteristics, this study employed the ANOVA test to assess whether the overall cognition, daily PA, and Peak-30 varied significantly across the demographic subgroups of sex, age, race and ethnicity, education, marital status, income, smoking, social engagement, drinking behaviors, hypertension, diabetes, body mass index, CVD, depression, sleep duration, sleep disturbance, and sleep disorders. Subsequently, sample weight-adjusted multivariable linear regression using the Least Squares Means (LSMEANS) procedure was employed to analyze how changes in other subgroups compared to the reference level were associated with overall global cognition and PA. The same methodology was also applied to investigate the relationship between PA and cognition, as measured by the AFT, DSST, immediate recall, delayed recall, overall cognition, and the risk of MCI or AD. Furthermore, the association between Peak-30 or daily PA and overall cognition, as well as the association between PA and increasing cognitive abilities from Level 1 to Level 4, was examined in subgroups to explore potential disparities. All analyses were conducted using SAS 9.4, with a two-sided P-value <0.05 considered statistically significant.
Results
The Variations of PA and Cognitive Function in Demographic Subgroups
Cognitive Function and Physical Activity Stratified by Demographic Characteristics of the Study Population in the NHANES 2011–2014.
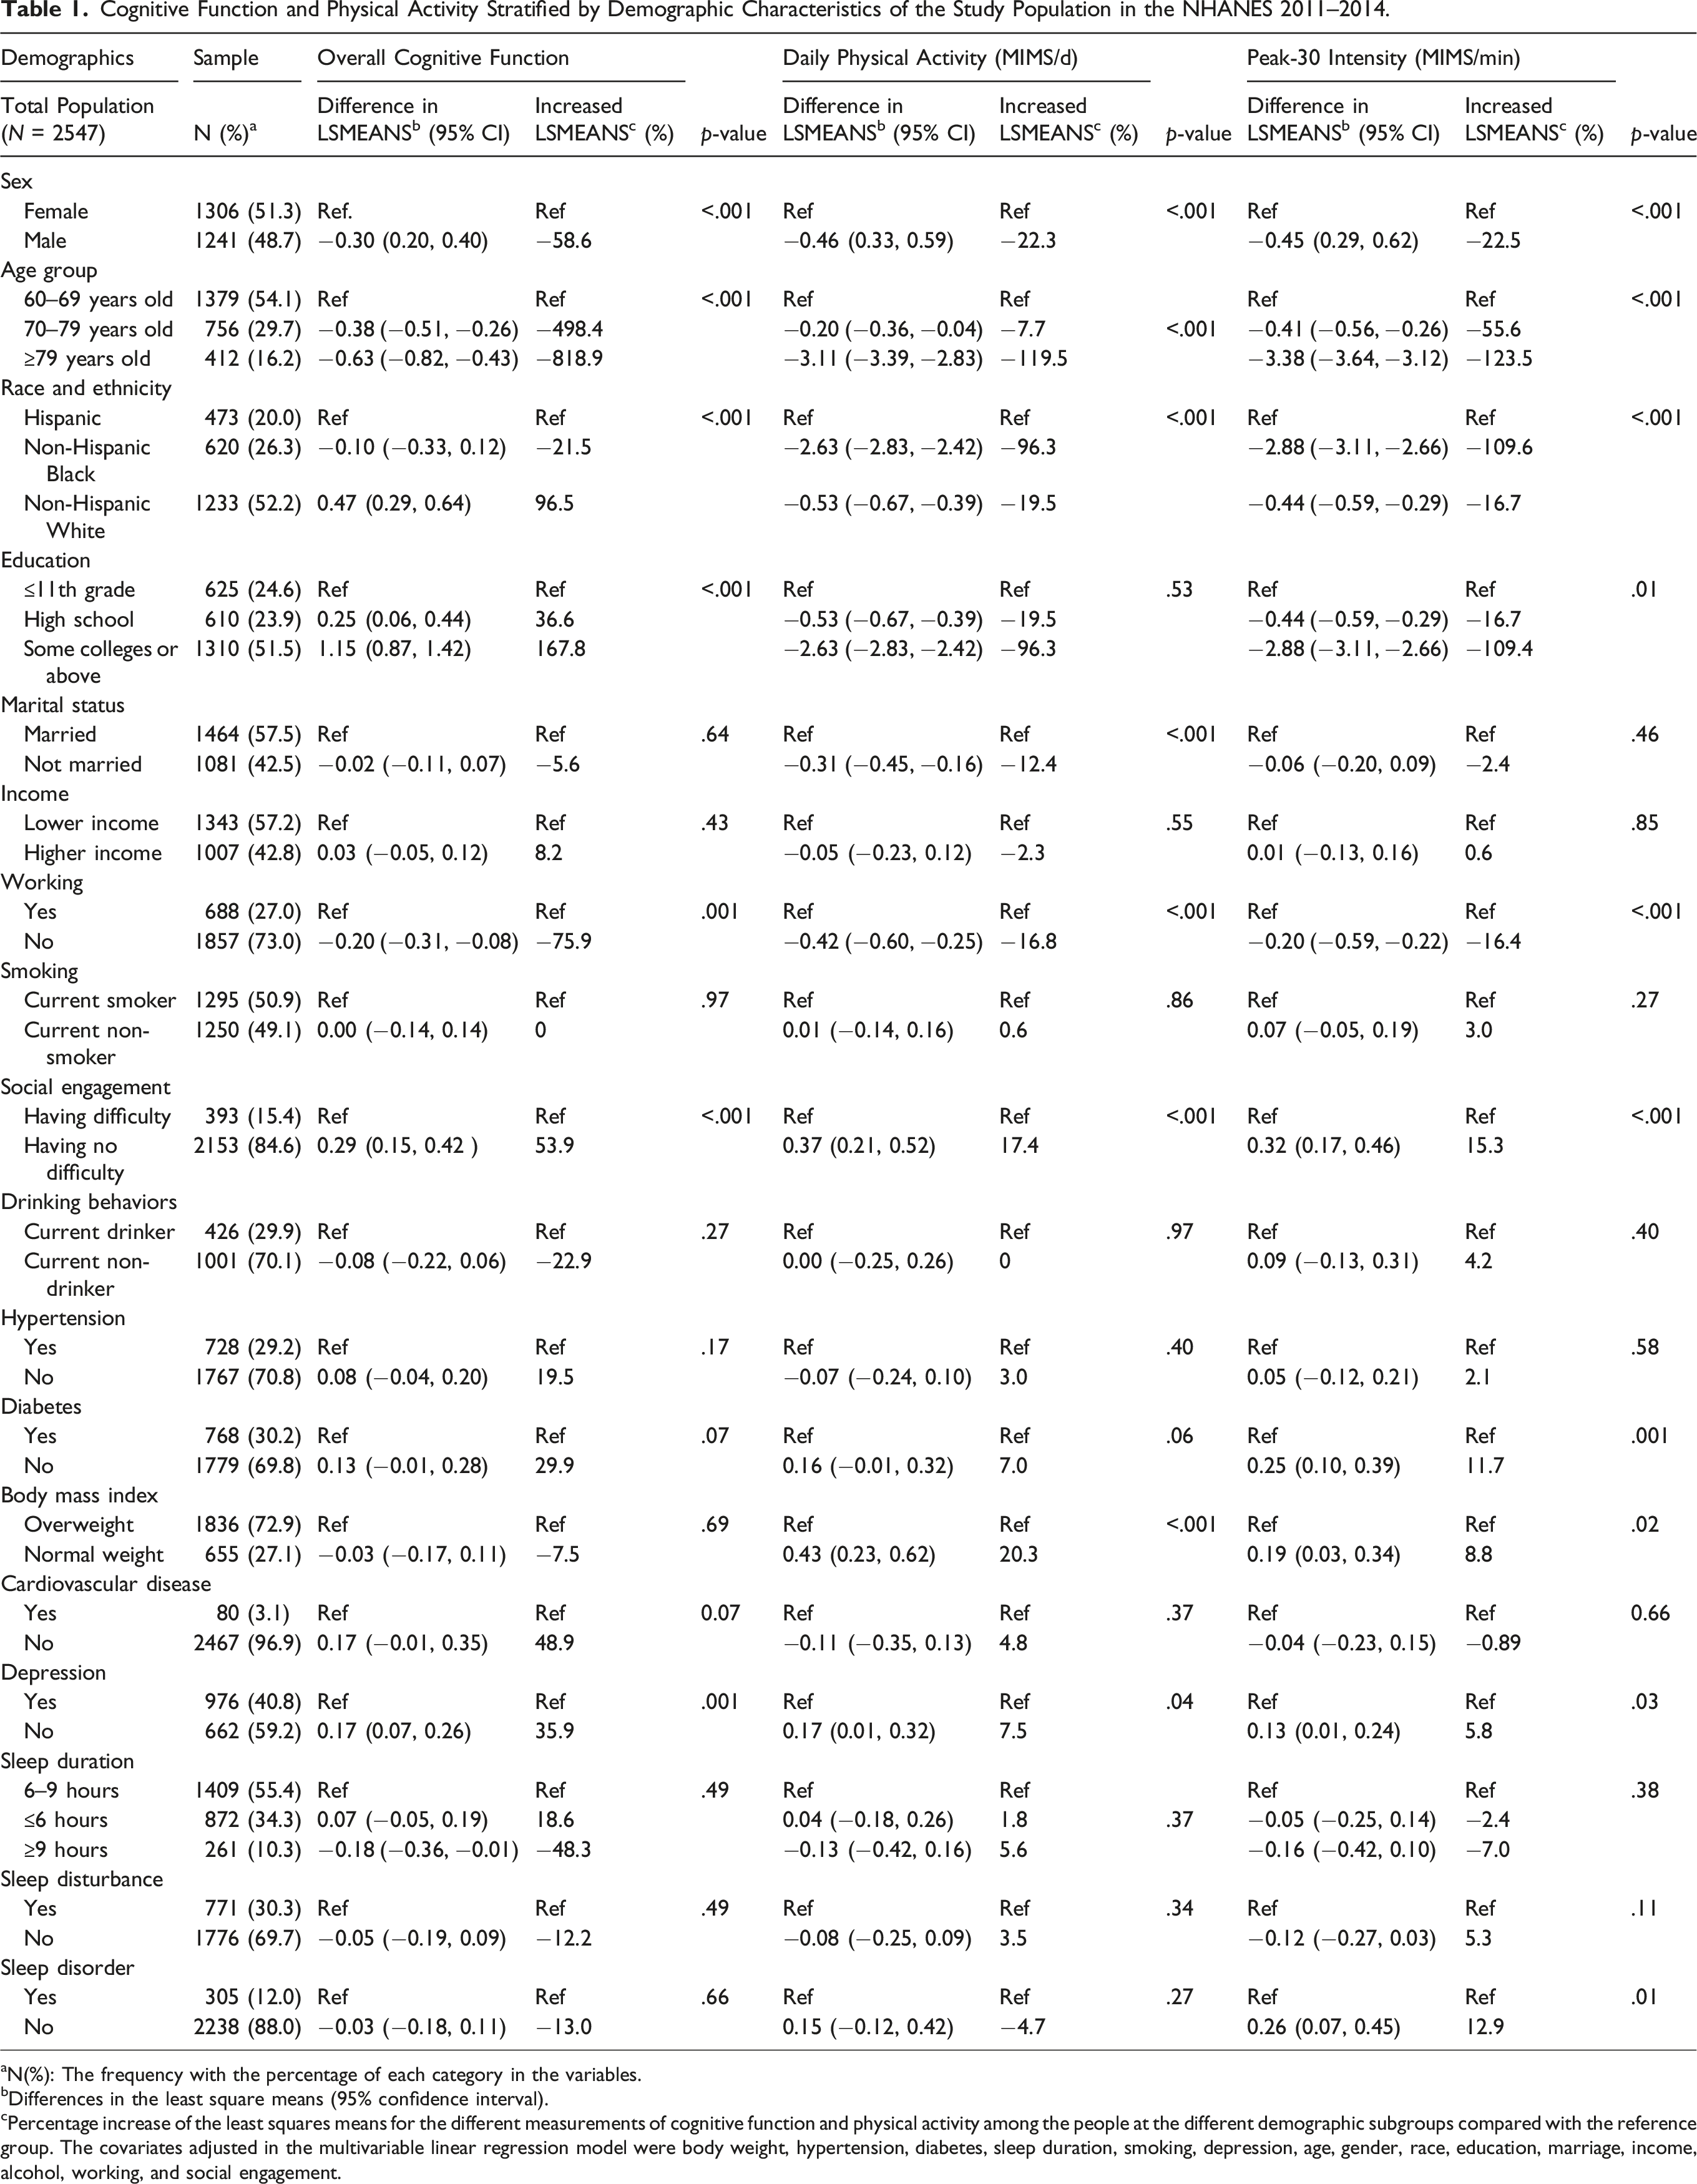
aN(%): The frequency with the percentage of each category in the variables.
bDifferences in the least square means (95% confidence interval).
cPercentage increase of the least squares means for the different measurements of cognitive function and physical activity among the people at the different demographic subgroups compared with the reference group. The covariates adjusted in the multivariable linear regression model were body weight, hypertension, diabetes, sleep duration, smoking, depression, age, gender, race, education, marriage, income, alcohol, working, and social engagement.
Percentage change of cognitive function is positively associated with physical activity for the entire sample and subgroups
The Association Between Physical Activity and Cognitive Function Under Different Cognitive Tests.
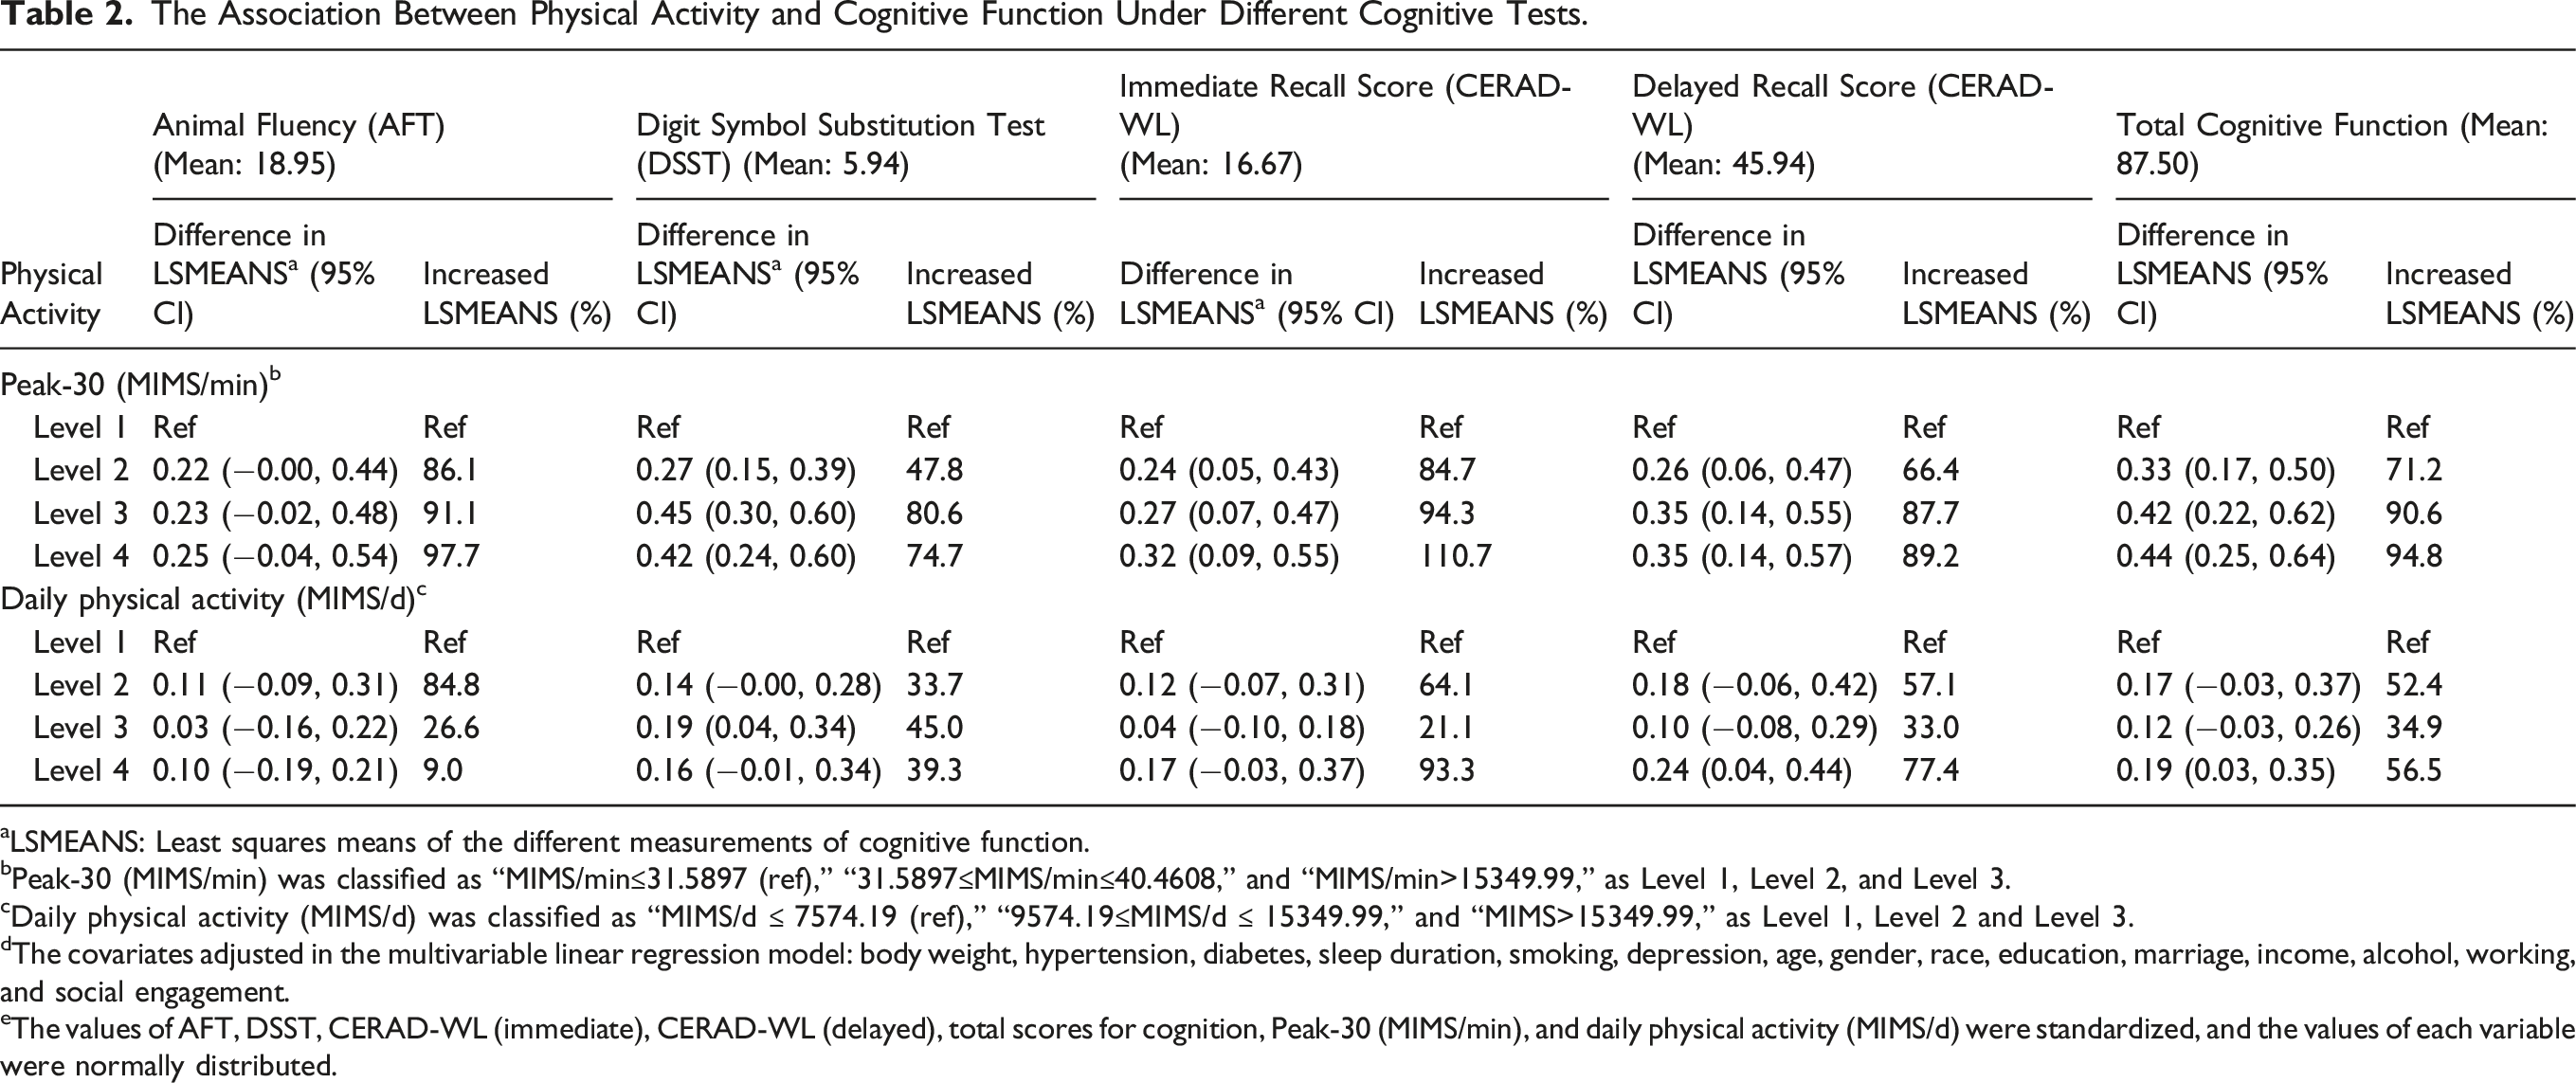
aLSMEANS: Least squares means of the different measurements of cognitive function.
bPeak-30 (MIMS/min) was classified as “MIMS/min≤31.5897 (ref),” “31.5897≤MIMS/min≤40.4608,” and “MIMS/min>15349.99,” as Level 1, Level 2, and Level 3.
cDaily physical activity (MIMS/d) was classified as “MIMS/d ≤ 7574.19 (ref),” “9574.19≤MIMS/d ≤ 15349.99,” and “MIMS>15349.99,” as Level 1, Level 2 and Level 3.
dThe covariates adjusted in the multivariable linear regression model: body weight, hypertension, diabetes, sleep duration, smoking, depression, age, gender, race, education, marriage, income, alcohol, working, and social engagement.
eThe values of AFT, DSST, CERAD-WL (immediate), CERAD-WL (delayed), total scores for cognition, Peak-30 (MIMS/min), and daily physical activity (MIMS/d) were standardized, and the values of each variable were normally distributed.
The Association of Physical Activity with Mild Cognitive Impairment and Alzheimer’s Disease.
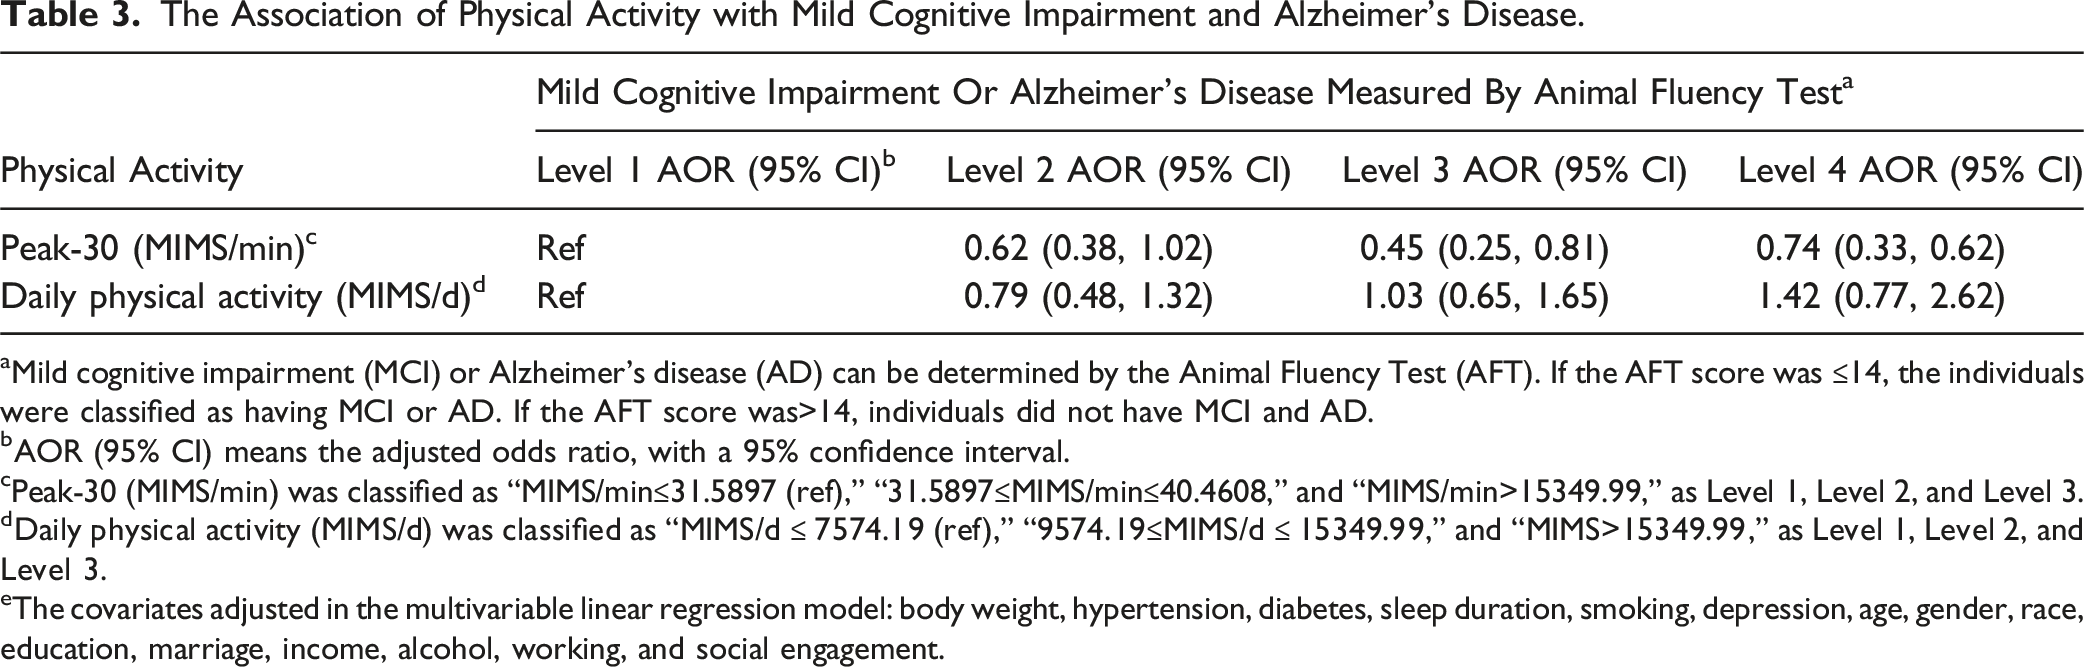
aMild cognitive impairment (MCI) or Alzheimer’s disease (AD) can be determined by the Animal Fluency Test (AFT). If the AFT score was ≤14, the individuals were classified as having MCI or AD. If the AFT score was>14, individuals did not have MCI and AD.
bAOR (95% CI) means the adjusted odds ratio, with a 95% confidence interval.
cPeak-30 (MIMS/min) was classified as “MIMS/min≤31.5897 (ref),” “31.5897≤MIMS/min≤40.4608,” and “MIMS/min>15349.99,” as Level 1, Level 2, and Level 3.
dDaily physical activity (MIMS/d) was classified as “MIMS/d ≤ 7574.19 (ref),” “9574.19≤MIMS/d ≤ 15349.99,” and “MIMS>15349.99,” as Level 1, Level 2, and Level 3.
eThe covariates adjusted in the multivariable linear regression model: body weight, hypertension, diabetes, sleep duration, smoking, depression, age, gender, race, education, marriage, income, alcohol, working, and social engagement.
Increased Percentage of Cognitive Function Scores Associated with the Effect of Peak-30.
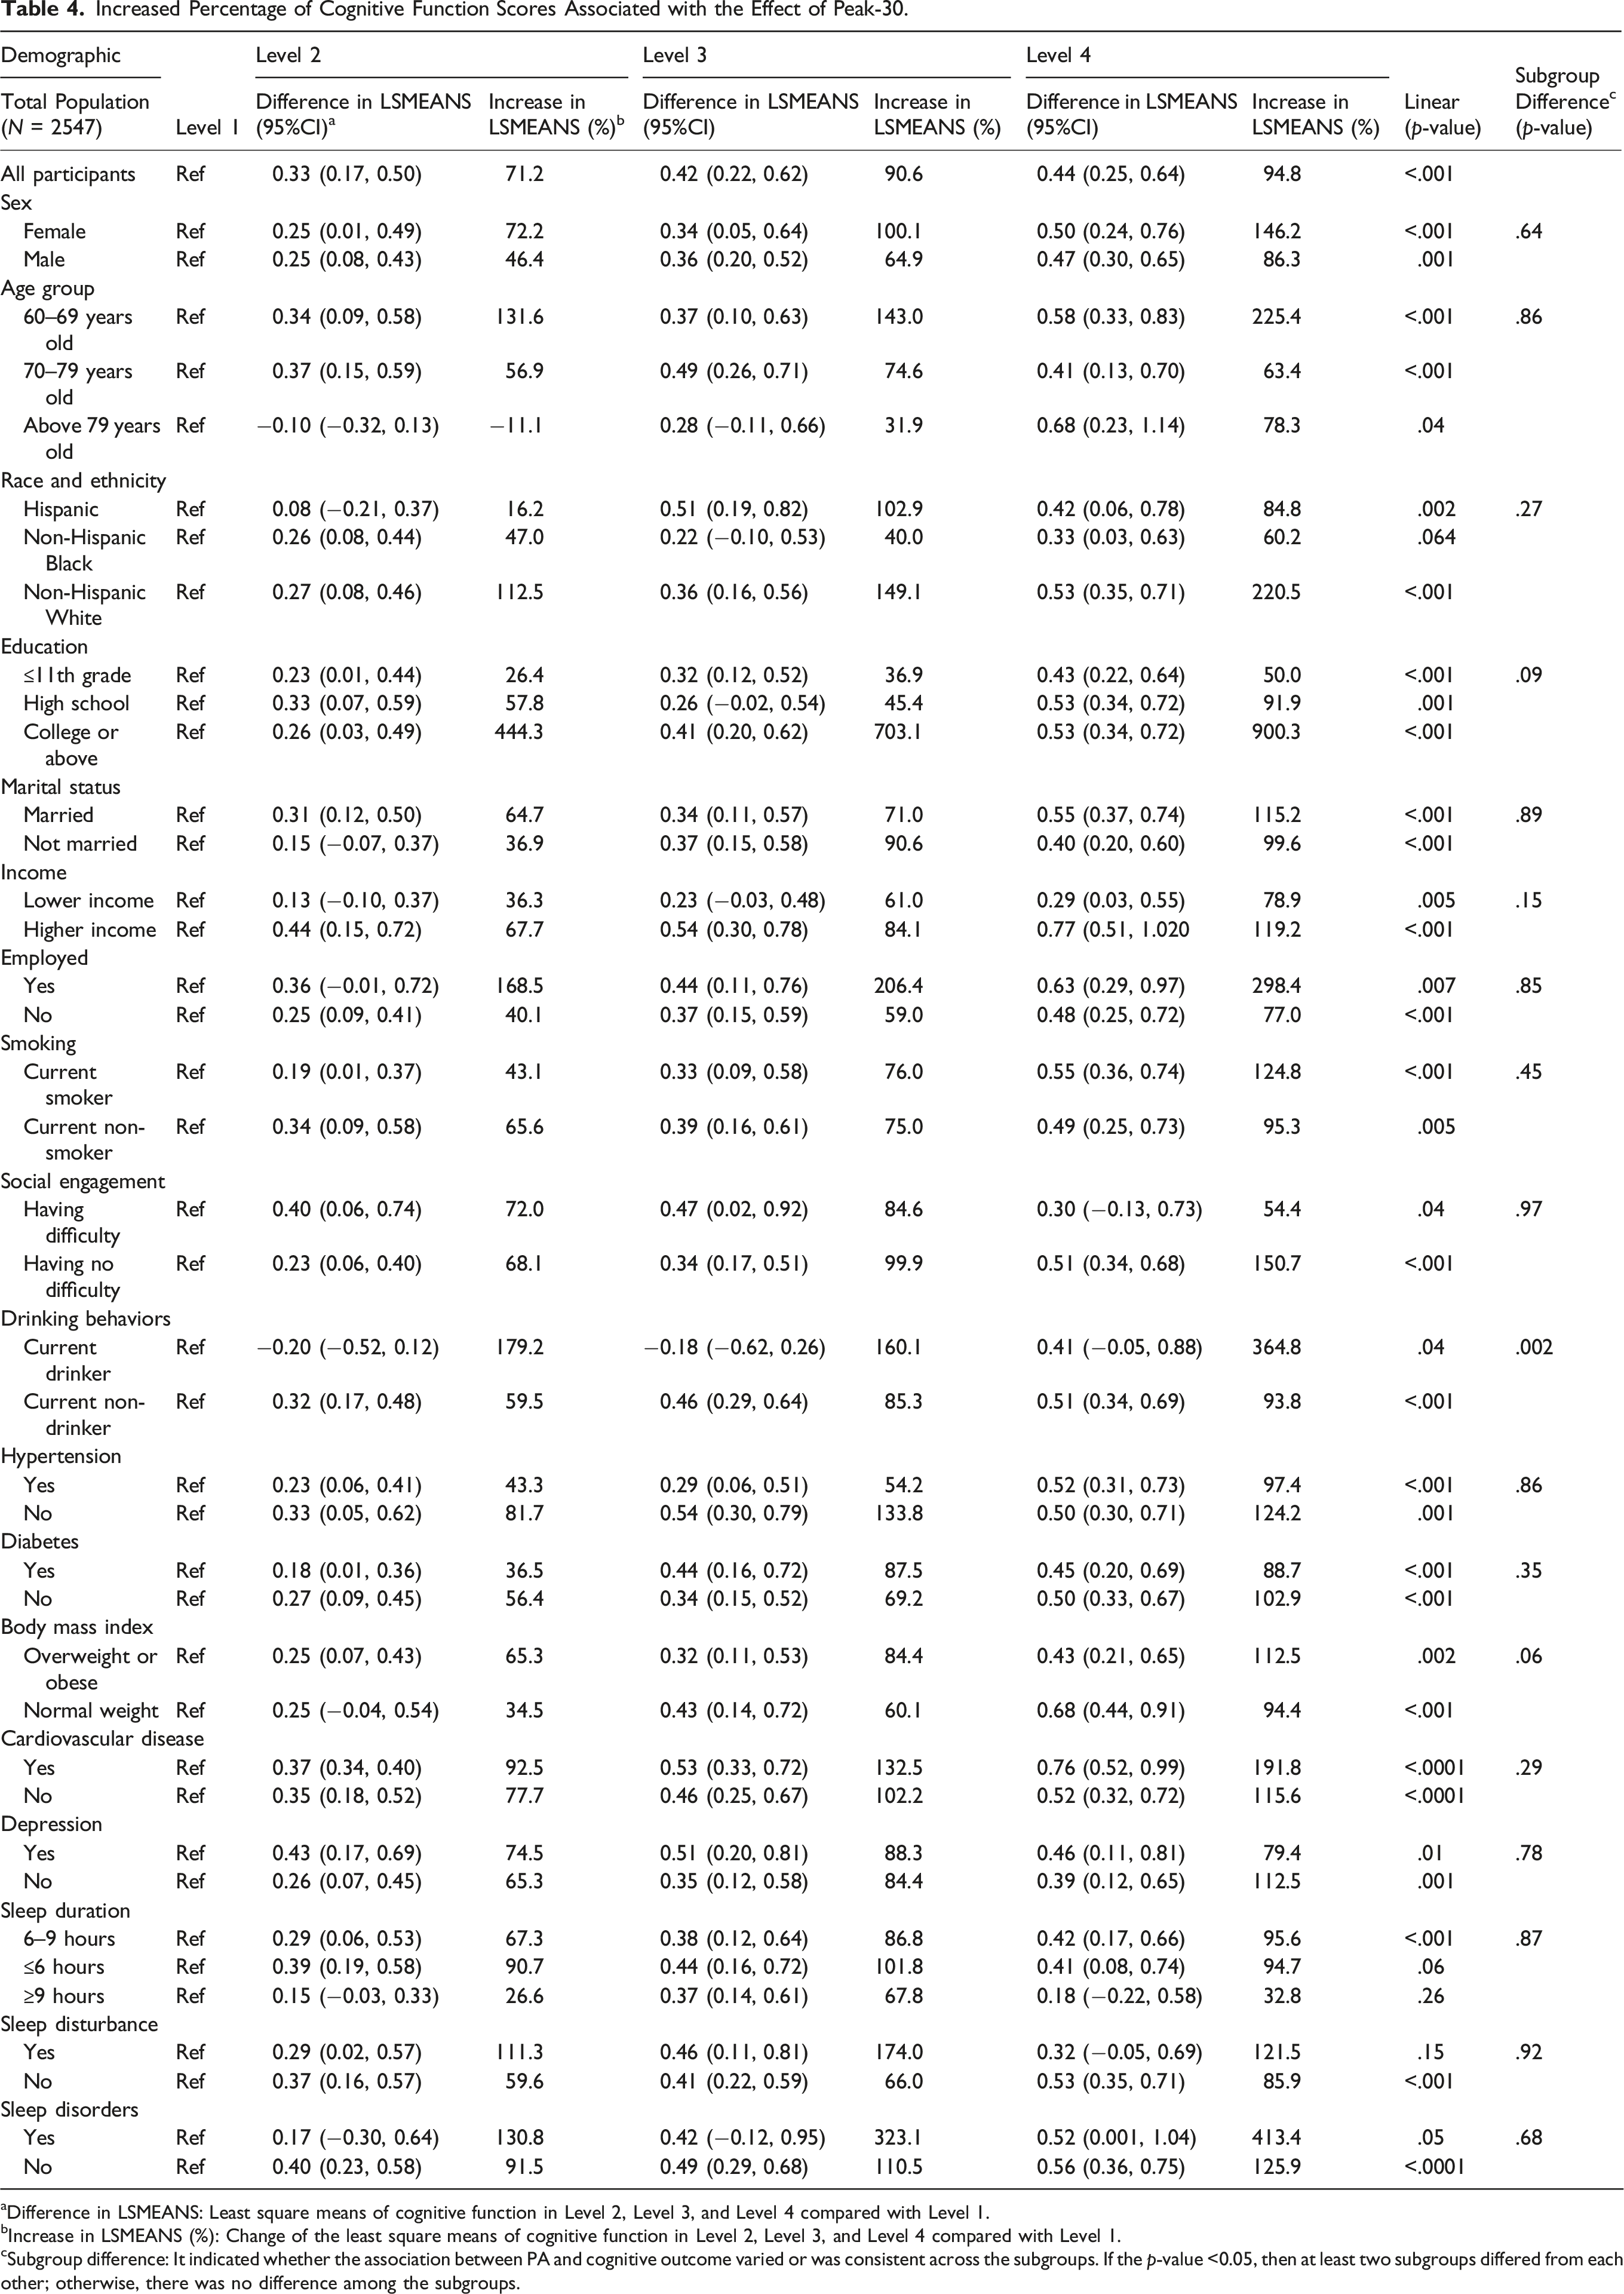
aDifference in LSMEANS: Least square means of cognitive function in Level 2, Level 3, and Level 4 compared with Level 1.
bIncrease in LSMEANS (%): Change of the least square means of cognitive function in Level 2, Level 3, and Level 4 compared with Level 1.
cSubgroup difference: It indicated whether the association between PA and cognitive outcome varied or was consistent across the subgroups. If the p-value <0.05, then at least two subgroups differed from each other; otherwise, there was no difference among the subgroups.
Additionally, Level 4 of Peak-30 was associated with better cognitive outcomes for overweight or obese individuals (112.5%, p = .002) compared to those with a healthy weight at Level 4 of Peak-30 (94.4%, p < .001). Similarly, smokers with a Level 4 Peak-30 have a stronger association with cognitive performance (124.8%, p < .001) compared to non-smokers with a Level 4 Peak-30 (95.3%, p < .01). These findings suggest that Peak-30 may be relatively beneficial for populations with risk factors for cognitive decline.
Increased Percentage of Cognitive Function Scores Associated with the Effect of Daily PA.
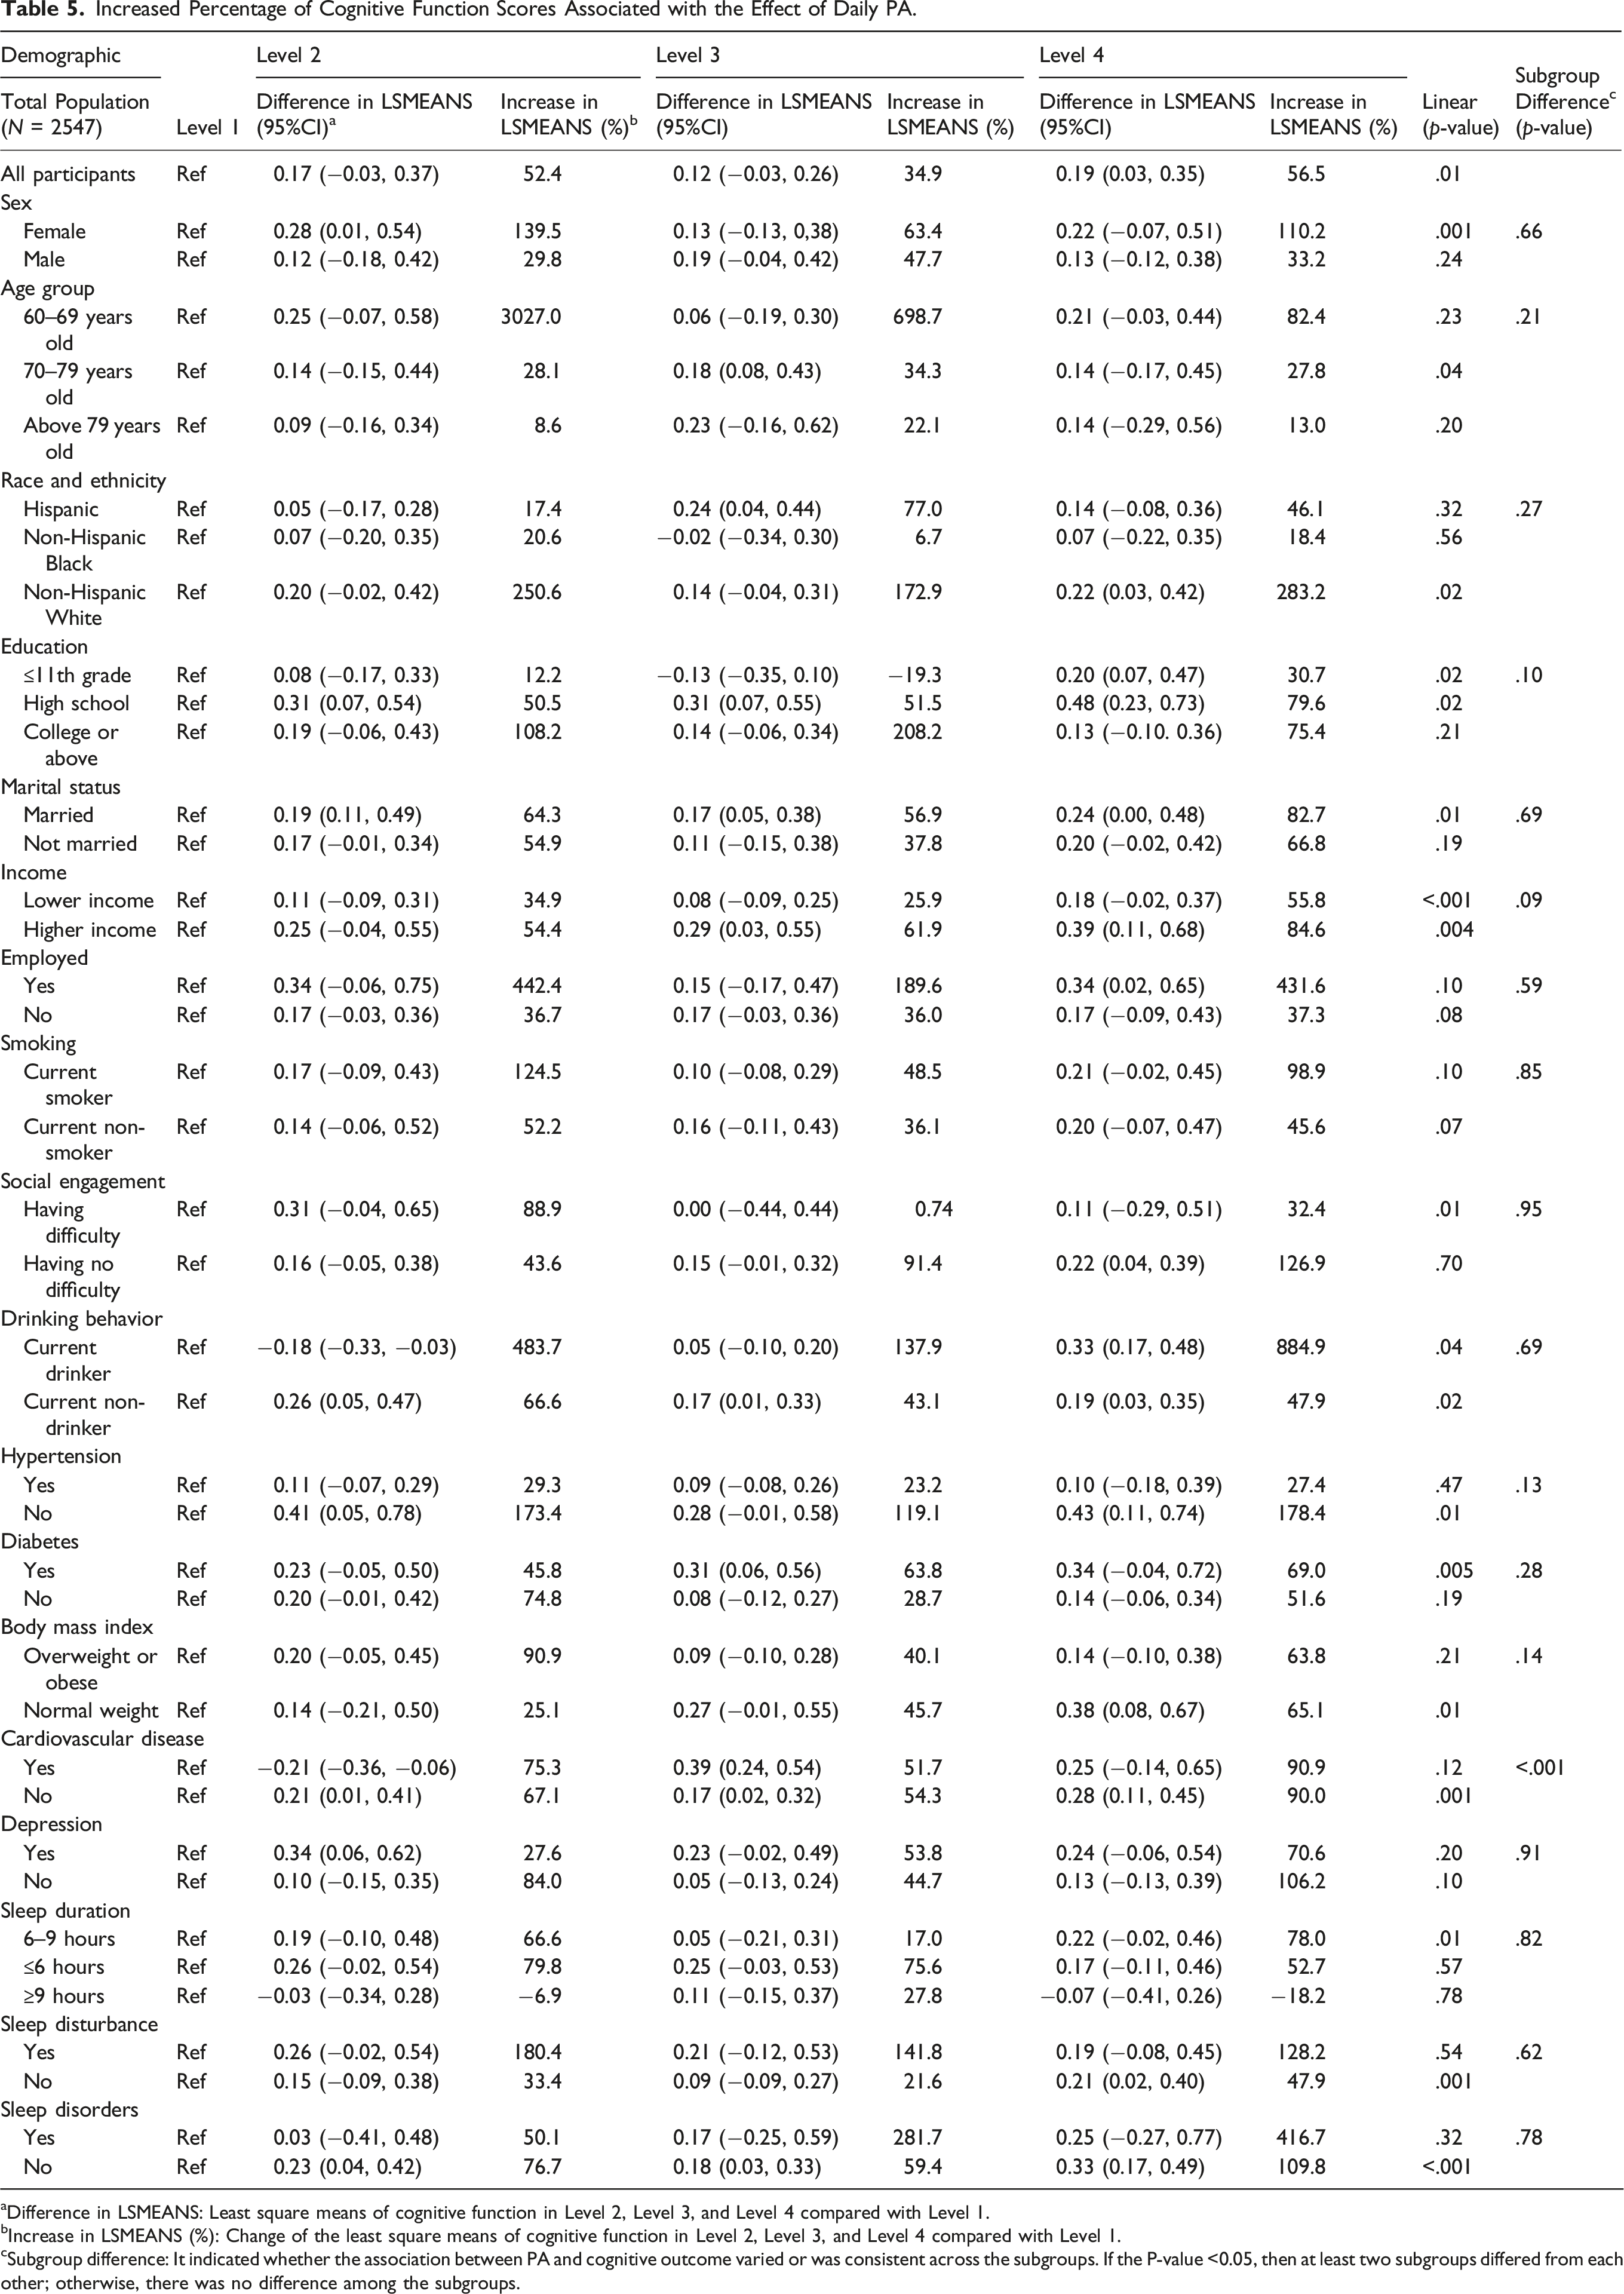
aDifference in LSMEANS: Least square means of cognitive function in Level 2, Level 3, and Level 4 compared with Level 1.
bIncrease in LSMEANS (%): Change of the least square means of cognitive function in Level 2, Level 3, and Level 4 compared with Level 1.
cSubgroup difference: It indicated whether the association between PA and cognitive outcome varied or was consistent across the subgroups. If the P-value <0.05, then at least two subgroups differed from each other; otherwise, there was no difference among the subgroups.
The Association Between Cognitive Function and Physical Activity Among the Participants in the Different Quantiles of Cognitive Function.
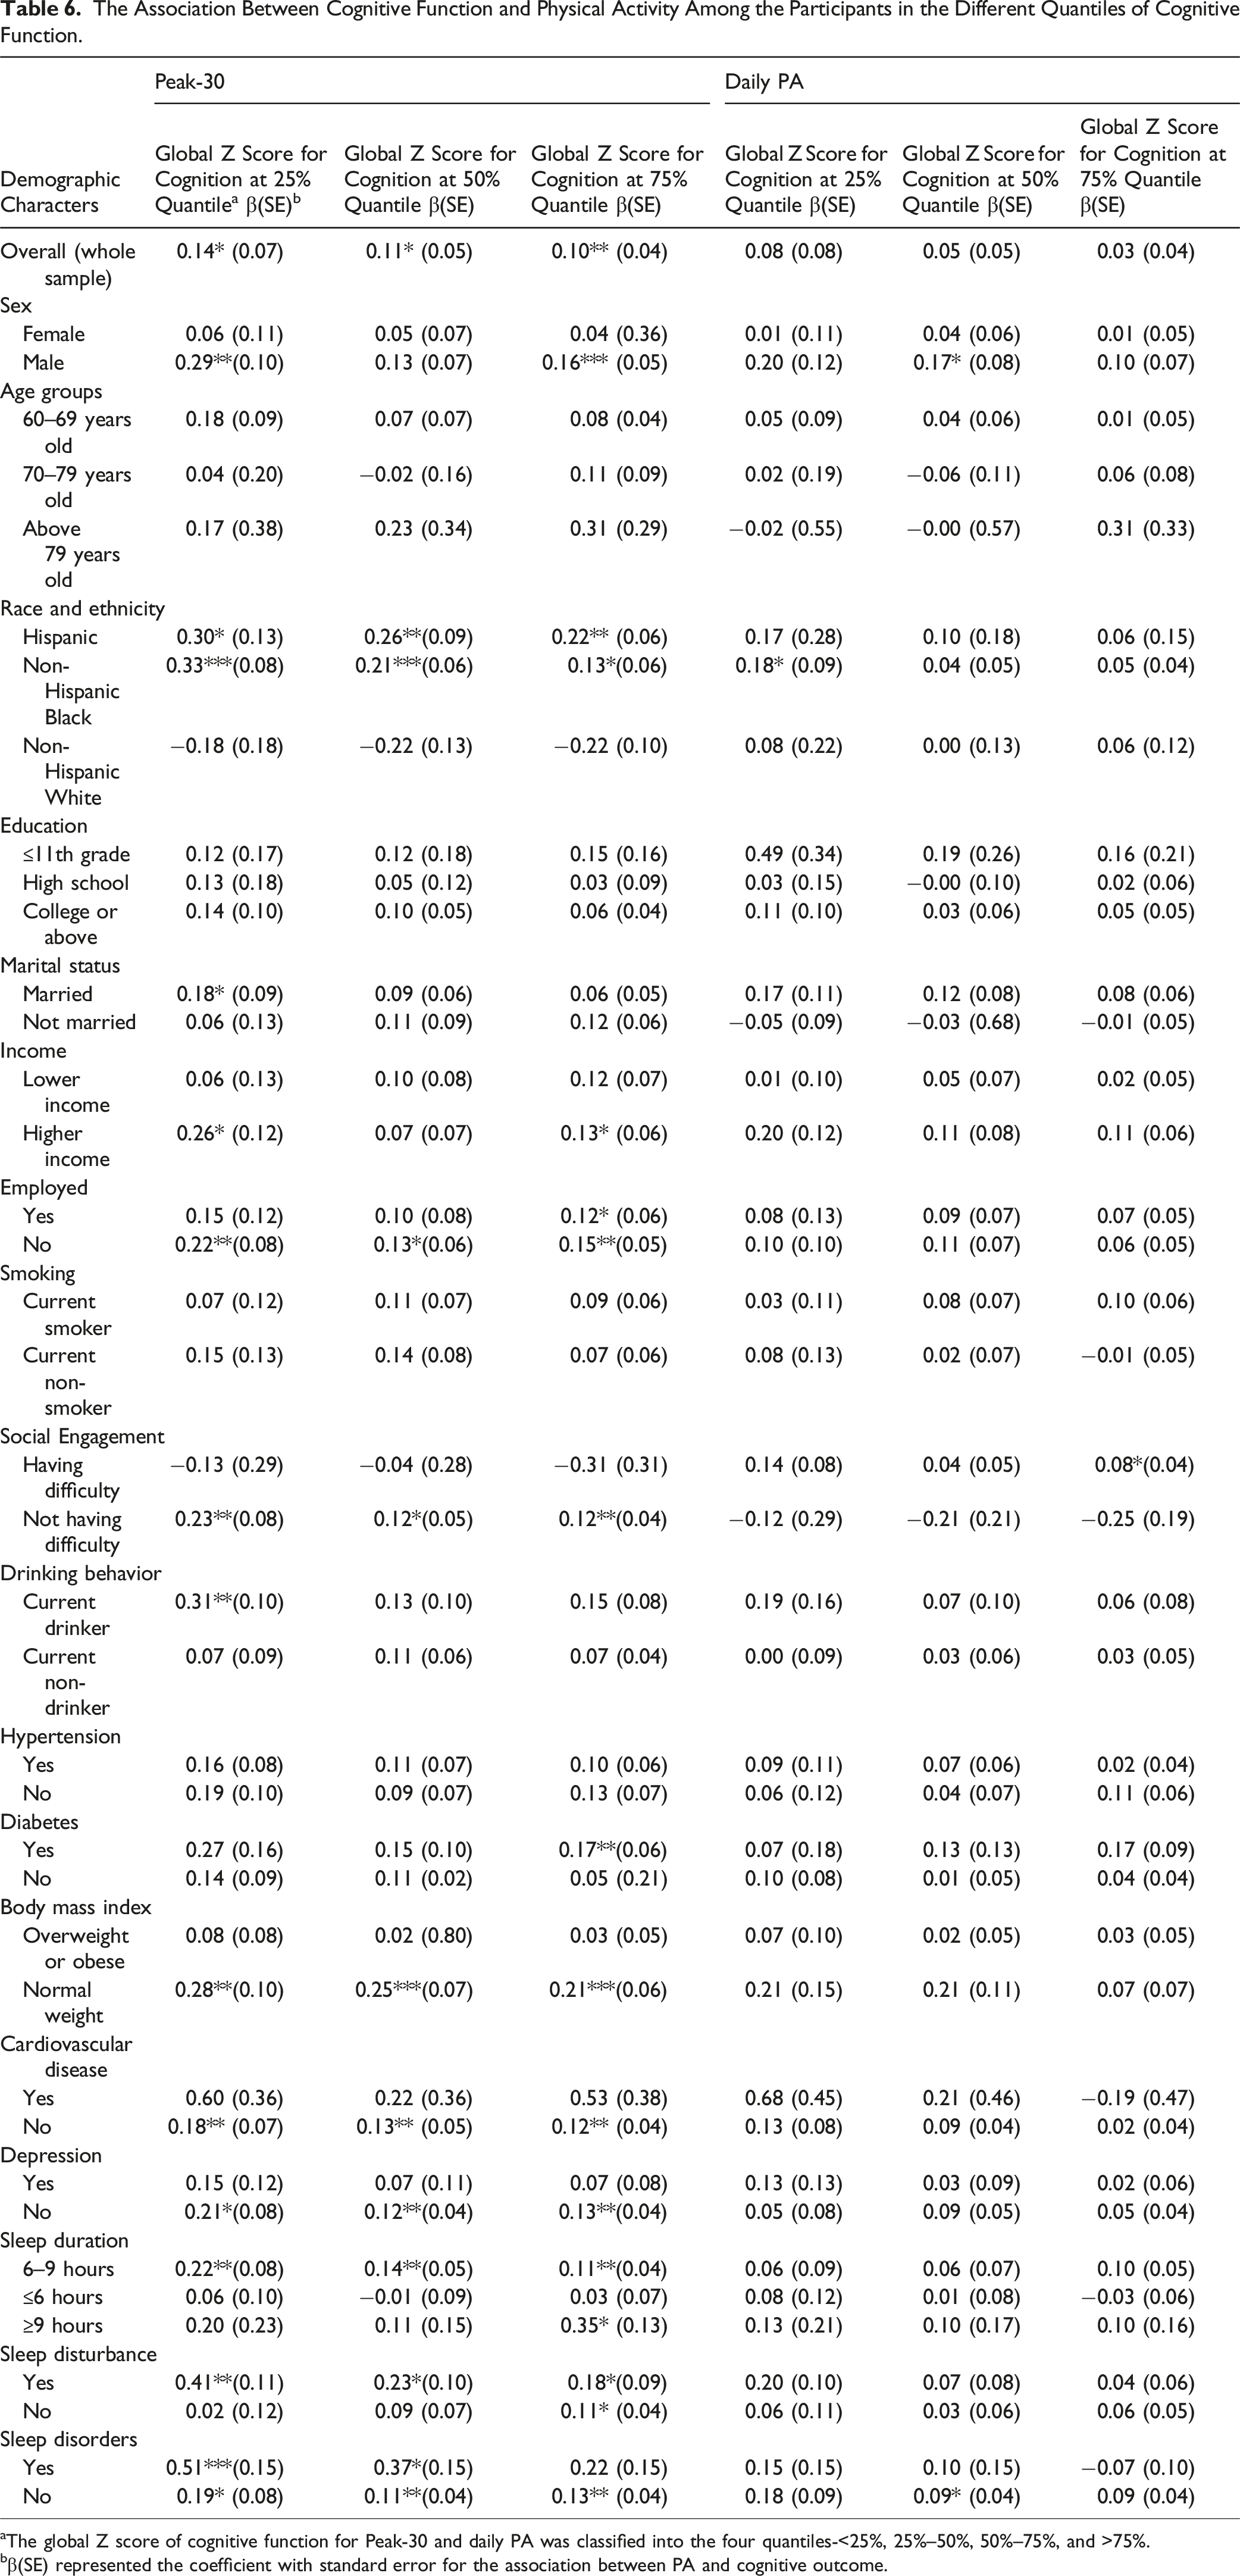
aThe global Z score of cognitive function for Peak-30 and daily PA was classified into the four quantiles-<25%, 25%–50%, 50%–75%, and >75%.
bβ(SE) represented the coefficient with standard error for the association between PA and cognitive outcome.
Discussion
Using a nationally representative US older population, higher PA levels were associated with better cognitive outcomes and a lower risk of MCI or AD. Even though Peak-30 had more pronounced associations with cognitive outcomes among individuals with better demographic, health, and socioeconomic status, Peak-30 exhibited broader benefits across all subgroups, with notable effects among individuals with poorer baseline cognition. While Peak-30 generally outperformed daily PA in most subgroups, daily PA had a more significant impact on cognitive performance among non-Hispanic whites and individuals with drinking behavior.
Our subgroup analysis provided insights into demographic variations in the PA-cognition relationship, enabling the development of tailored PA interventions. Across specific cognitive domains, the benefits of PA were most pronounced in memory, aligning with a prior review (Mandolesi et al., 2018). However, another study suggested that PA enhanced response speed in working memory but was detrimental to memory accuracy (McMorris et al., 2011). This study supported previous research linking Peak-30 with improved processing speed and executive function (Zheng et al., 2022). However, we found no significant association between daily PA and executive function, contrary to Zheng’s study, which reported a slight increase in executive function scores related to daily PA (Zheng et al., 2022). The discrepancy may be due to the inclusion of more comprehensive covariates adjusted for in this study, which attenuates the marginal effect of daily PA on executive function.
The use of Monitor Independent Movement Summary (MIMS) metrics is device-free, allowing for cross-study comparison of PA values and the development of scales representing various dosages of PA using different accelerometers (John et al., 2019). Unlike the previous studies that focused on mean values of PA (e.g., daily PA and mean of Peak-30) and the linear association with cognitive outcomes, this study employed a quadrants scale (“< 25%,” “≥25%–< 50%,” “≥50%–< 75%,” and “≥75%”) for both daily PA and Peak-30 that offers a more nuanced examination of the associations between various levels of PA and cognitive outcomes (Zheng et al., 2022). We observed an optimal positive association when exceeding a PA level of>75%, particularly for Peak-30. To date, no study has explored whether the associations between PA and cognitive function vary across cognitive levels. However, our approach revealed that older adults with poorer cognitive function may benefit most from a higher PA level. The quadrant-scaled analysis has identified the PA level that yielded optimal cognitive benefits and highlighted the most cognitively vulnerable subgroups, supporting a more targeted approach to cognitive health promotion in the aging population.
To date, no studies have provided guidance on the direct translation between the MIMS unit and specific PA intensity levels. However, recent efforts have been made to support that Peak-30 is more indicative of moderate to vigorous PA among adults in free-living settings (Aguiar et al., 2024). The relationship between Peak-30 and cognitive function is significantly stronger than that of daily PA, which may reflect the advantages of higher PA intensities that increase blood flow, boost neurotrophic factors, improve glucose metabolism, and enhance insulin sensitivity (Wu et al., 2024; Zlatar et al., 2019). Additionally, higher-intensity and shorter PA durations are more likely to achieve time-efficient gains in brain function, compared to longer durations of lower-intensity activity (Duzel et al., 2016; Li et al., 2018; Tsukamoto et al., 2016). Acute higher-intensity PA bouts also promote greater neuroplastic changes (Chen et al., 2016). From a public health perspective, although the exact intensity captured by Peak-30 has not been fully characterized, encouraging individuals to engage in their best sustained effort at higher-intensity physical activity in daily life may promote optimal cognitive health.
Compared to the role of daily PA, our study shows that the associations of Peak-30 with cognitive outcomes may be more pronounced in several subgroups, including individuals with vulnerable characteristics (Table 4 vs. Table 5). Our findings suggest that the highest Peak-30 (Level 4) has a stronger association with cognitive function than the highest daily PA (Level 4) among vulnerable subgroups of individuals aged 60 and older, unmarried, Hispanic, and non-Hispanic Black, unemployed, smokers, with hypertension, obesity, CVD, and diabetes. This is likely due to the increased insulin resistance, poor glucose metabolism, and vascular inflammation associated with these health conditions, which can be mitigated through a higher magnitude of PA (Erickson et al., 2019; Mandolesi et al., 2018). Additionally, these high-risk populations are prone to have poorer baseline cognition and may demonstrate greater plasticity when a more intensive PA is given. Notably, participants with a college education or higher degree experienced greater cognitive improvement, with the highest Peak-30 level (Level 4) compared to the other subgroups.
Conversely, individuals with the highest overall daily PA (Level 4) appeared to confer more significant cognitive benefits than those with the highest Peak-30 (Level 4) for some subgroups, including non-Hispanic White, employed individuals, those without hypertension, and alcohol consumers. This was primarily contributed to their better baseline health and resilience, so that light to moderate daily PA may provide more sustainable cognitive benefits than that of Peak-30 (Hao et al., 2024). Although Peak-30 encourages time-efficient cognitive gains, daily physical activity (PA) may promote long-term improvements in metabolic regulation, vascular health, and brain health (American Psychiatric Association, 2025; Illinois Department of Public Health, 2025; The Vascular Care Group, 2025).
Previous research also showed that PA levels may yield greater cognitive benefits for individuals with preexisting health conditions or unhealthy habits. Overweight adults and those who consume alcohol or smoke exhibited stronger cognitive benefits from higher PA levels than their healthier counterparts (Ashdown-Franks et al., 2020; Coll-Padrós et al., 2019). Similarly, daily PA has been associated with more enhanced cognitive outcomes among alcohol consumers, while those with optimal baseline cognition had less room for improvement due to a ceiling effect (Lyu et al., 2024). Moreover, depression, sleep quality, and cognitive function are closely interconnected. More frequent exercise has been linked to improved sleep quality, reduced depressive symptoms, and enhanced cognition (Yuan et al., 2020). Our study shows supportive findings that higher PA intensity (Peak-30) is positively associated with cognitive function among individuals who sleep between 6–9 hours, without sleep disorders or disturbance, and without depression, compared to their counterparts.
Notably, the relatively greater cognitive benefits of Peak-30 are found in those with the poorest cognitive function, primarily due to the ceiling effect. However, this effect was only observed in Peak-30, suggesting its stronger cognitive influence compared to daily PA. Additionally, individuals with cognitive impairment often experience social isolation, while structured PA routines increase social interaction and cognitive resilience among them (Woods et al., 2023). Furthermore, the associations varied across demographic and health subgroups. Vulnerable populations, such as Hispanic, non-Hispanic Blacks, unemployed individuals, and older adults with sleep disturbance, were likely to experience more cognitive gains when their baseline cognition was low. This may be explained by the benefits of PA on compensatory brain mechanisms that they heavily rely on, and poorer systemic health (Cabeza et al., 2002). In contrast, those who engaged well in social activities, maintained a healthy weight, and exhibited good cardiovascular, mental, and sleep health, showed enhanced cognitive outcomes compared to the initial poorest baseline. This improvement stems from the synergistic effects of a protective lifestyle along with Peak-30. Notably, the significant cognitive benefits of Peak-30 among individuals with sleep disturbance were only restricted to those without sleep disorders.
Strengths and Limitations
Our study has several notable strengths. We employed individual and composite measurements of cognitive function, encompassing memory, executive function, sustained attention, and processing speed, while focusing on accelerometer-based physical activity (PA) measures. This facilitates study comparisons and provides a more detailed understanding of the associations of PA with overall cognition or specific cognitive domains. Additionally, we include critical covariates related to PA and cognition in our modeling to minimize potential biases in estimating the associations. Moreover, this study is one of the first attempts to describe the association between PA and cognitive outcomes among older adults with varying cognitive abilities across different subgroups.
One primary limitation of the current study was its cross-sectional design, which precluded the establishment of a causal relationship, as in a randomized controlled trial (RCT). Despite the study’s use of a composite score to assess integrative cognitive function, it may not fully capture all aspects of cognitive function. Additionally, the APOE genotype and other dementia risk variants are not available in the public-use NHANES dataset, which limits the ability to control them in our analysis. Further, specific measures of air pollution, toxins, or neurotoxicant exposure were absent from the dataset, which might modify the relationship between PA and cognition. Although some dietary information is included, a full micronutrient panel is missing, which is critically important for cognitive function. Individuals’ sleep quality is partially captured without including daily napping time, and their major life events are not recorded. Despite the presence of diagnostic status for health conditions, a lack of information on medication use, disease duration, and management quality are noticeable limitations to the findings. Lastly, the findings are limited to older American adults aged 60 and above, thereby restricting their applicability to other aging populations.
Conclusion
This study generally supports the existing literature by highlighting the positive association between PA and cognitive health in older adults, demonstrating that higher levels of PA are linked to better cognitive outcomes—older adults’ daily PA and higher-intensity PA (Peak-30) exhibit overlapping positive associations with cognition. However, the strength of these positive associations varies across subgroups of older adults with similar demographic and health profiles. These findings can help guide the tailoring of PA interventions to address the specific needs of different older adult subgroups to promote cognitive health and reduce the risk of neurodegenerative diseases.
Footnotes
Acknowledgment
Chelsea Richard contributed to merging the initial data and processing the current study. ChatGPT and Grammarly were used only to shorten the abstract word count and check grammar.
Ethical Considerations
This study received ethical approval from the NCHS Ethics Review Board (ERB) Approval (Protocol #2011–2017). This is an ERB-approved cross-sectional study.
Consent to Participate
All patient information was de-identified, and patient consent was not required. Patient data will not be shared with third parties. There is no informed consent available.
Author Contributions
Fanli Yi was responsible for this project’s study design, data analysis, and manuscript writing. Longgang Zhao contributed to the study design and manuscript editing. Carlos Avalos and Jongwon Lee contributed to the manuscript editing. Chih-Hsiang Yang contributed to the research topic, question development, and manuscript editing.
Funding
The authors disclosed receipt of the following financial support for the research, authorship, and/or publication of this article: This project is supported by the USC Big Data Center Pilot Research Grant (BDHSC-PP2022-10).
Declaration of Conflicting Interests
The authors declared no potential conflicts of interest with respect to the research, authorship, and/or publication of this article.
Data Availability Statement
The data is available on the National Health and Nutrition Examination Survey cycles of 2011–2014.