
Abstract
Introduction
There is great inter-individual variability in cognitive ageing. It has been shown that the degree of impairment experienced depends not only on genetic factors but also on a range of modifiable risk factors (Livingston et al., 2020). The level of socioeconomic (dis-)advantage a person experiences is one such factor. Socioeconomic status (SES), defined by education, income and/or occupation, has been found repeatedly to relate to cognitive health in older adults, in that higher SES is associated with better cognitive health (Lyu & Burr, 2016; Marden et al., 2017).
However, the SES construct has been criticised as being of limited relevance, particularly to older adults, who are less dependent on ongoing employment and income (Steptoe & Zaninotto, 2020). Indeed, additional facets of disadvantage not covered by the SES construct have been found to be relevant to cognition in this group. For instance, access to healthcare is increasingly important with older age and is directly associated with risk of cognitive impairment, which might be the result of more successful monitoring and management of risk factors such as cardiovascular risk (Mullins et al., 2021). Moreover, wealth in older adulthood has been shown to be more strongly associated with dementia risk than education (Cadar et al., 2018) or income (Glei et al., 2022). Indeed, the significance of wealth has been found to increase with age, as accumulated resources are increasingly relied on and reflect financial security across the life course more comprehensively than income (Glei et al., 2022). There also is an association between cognition and neighbourhood quality, which likely reflects the access to important resources such as recreational spaces (Clarke et al., 2015).
The Social Deprivation Index was developed as a more comprehensive measure reflecting these additional domains (SoDep Index; Hofbauer & Rodriguez, 2021a). It has been shown that the SoDep Index score relates to cognitive functioning and decline (Hofbauer & Rodriguez, 2021, 2021b), as well as dementia risk (Hofbauer & Rodriguez, 2023) in that those with higher scores experience poorer cognitive function and a higher risk of dementia. As resources fundamentally determine whether an individual is able to adhere to a lifestyle conducive to good health (Link & Phelan, 1995), one can expect the lifestyle behaviours of those more deprived to be less favourable to cognitive health than those of individuals low in social deprivation are. In the context of brain health, such favourable behaviours would include the participation in stimulating activity, resulting in the building or maintenance of a greater resistance to loss of cognitive functioning under age-related pathological load (‘Cognitive Reserve Theory’, Song et al., 2022), as well as factors relevant for cardiovascular health (e.g. physical activity; Livingston et al., 2020).
Indeed, previous research supports a gap in brain-healthy lifestyle behaviours between those with and without marked social deprivation. For instance, in U.S. adults of all ages, those with lower education have been found to engage in less physical and cognitive activity, which mediated the association with episodic memory (Liu & Lachman, 2019). Using the LIfestyle for BRAin health’ (LIBRA) score, Deckers and colleagues (2019) showed in an older adult (50+ years) English sample that higher wealth was associated with a more brain-healthy lifestyle. The LIBRA score takes health risk/protective behaviours (smoking, physical inactivity, low-to-moderate alcohol use, healthy diet) and protective lifestyle activity (high cognitive activity) into account. Moreover, LIBRA assesses the presence of a number of high-risk conditions (e.g. coronary heart disease, diabetes). The LIBRA mediated around half of the difference in dementia risk between those highest and lowest in wealth (Deckers et al., 2019). Conversely, in an older adult German sample, the LIBRA score accounted for only around 13% of the variation in cognitive functioning explained by SES (Röhr et al., 2022). Thus, findings support the idea that lifestyle may play a mechanistic role in the association between socioeconomic disadvantage and cognition; yet, the size of the effect remains uncertain and warrants further investigation.
Moreover, it would be informative to expand the definition of brain-healthy activities. Since the LIBRA’s construction, a number of activities have gained attention as protective of cognition, such as hobbies (Sala et al., 2019), social activities (Duffner et al., 2022; Sommerlad et al., 2019), and volunteering (Guiney & Machado, 2017). These may be particularly important to the older adult population, who may struggle with physical or cognitive activities, but still entertain hobbies suited to their capabilities. What is more, previous research has found some associations between socioeconomic indicators and participation in such broader lifestyle activities (Bone et al., 2022). Therefore, it is conceivable that these broader lifestyle activities may account for additional variance in the association between socioeconomic disadvantage and cognition. Yet, a detailed look at participation frequency across activities and social deprivation status is lacking, as is a mediation analysis that includes such a wider range of lifestyle activities.
Specifically, it would be valuable to evaluate such a mediation longitudinally. Previous investigations largely assessed socioeconomic variables and lifestyle variables at the same measurement instance. For plausibility of causation in mediation analysis, it would be necessary to introduce time lags between measurement of the predictor, mediator, and outcome of interest (Cain et al., 2018). Using longitudinal data also allows for the investigation of the effect of lifestyle on not only cognitive status but also cognitive decline. Previous work has shown that social deprivation’s association with cognition is limited to cognitive status with negligible effect on rate of decline (Hofbauer & Rodriguez, 2021, 2021b). If lifestyle activity were found to slow decline, this would be an important finding in terms of preventing impairment.
Aims
Therefore, our first aim was to assess the association between social deprivation and participation in a wider range of lifestyle activities. Our second aim was to explore the role of social deprivation and lifestyle in cognition across time. Our third aim was to analyse whether lifestyle activities longitudinally mediate the association between social deprivation and cognitive function. We expect an association between social deprivation and a range of lifestyle activities, so that those higher in deprivation are less likely to partake in brain-healthy lifestyle activities. Further, we anticipate a negative association between social deprivation and cognition as well as a positive association between brain-healthy lifestyle activities and cognition. Finally, we expect the association between social deprivation and cognition to be partially mediated by lifestyle.
Method
Sample
Sample Characteristics.
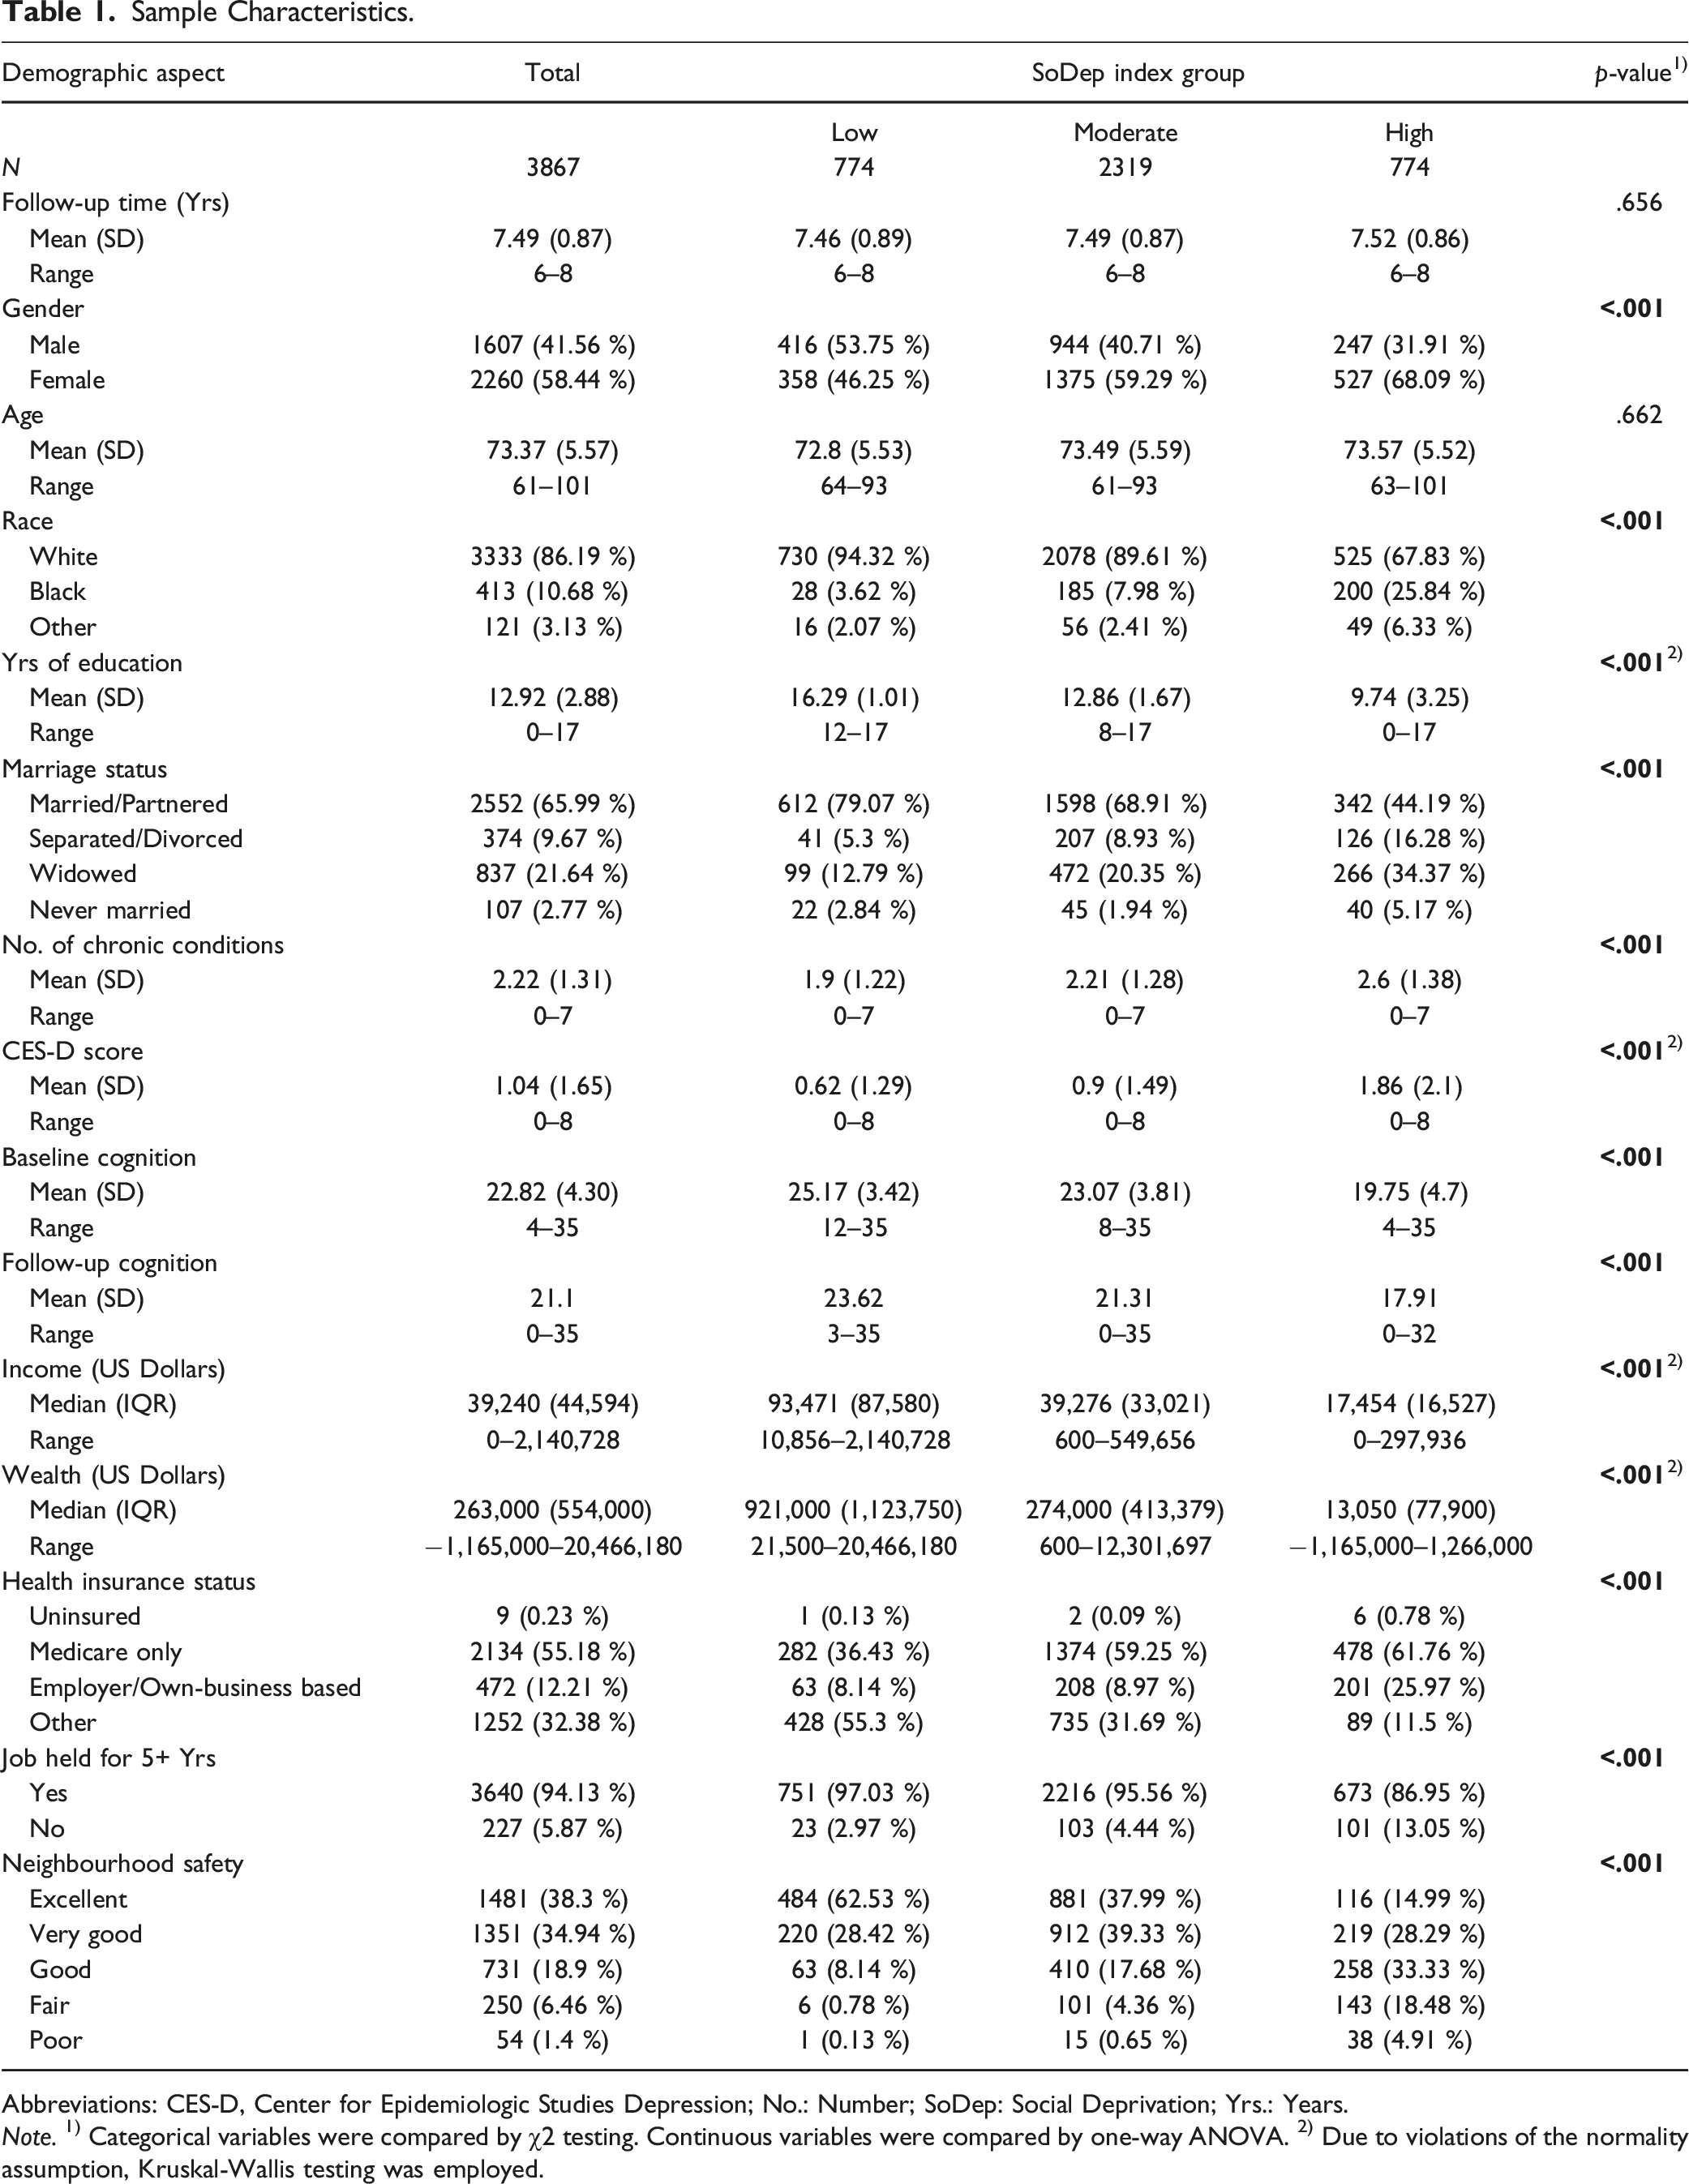
Abbreviations: CES-D, Center for Epidemiologic Studies Depression; No.: Number; SoDep: Social Deprivation; Yrs.: Years.
Note. 1) Categorical variables were compared by χ2 testing. Continuous variables were compared by one-way ANOVA. 2) Due to violations of the normality assumption, Kruskal-Wallis testing was employed.
Social Deprivation Index (SoDep Index) Score
The SoDep Index was calculated based on responses at baseline (i.e., in 2010). Details on the construction of the SoDep Index are reported elsewhere (Hofbauer & Rodriguez, 2021a). In short, domains included in the index are education (in years), job stability (ever having held a job for 5+ years), health insurance status (uninsured/medicare only/employer or business-based/other), self-rated neighbourhood safety (excellent to poor), income (sum of all sources of income including government transfers), and wealth (sum of all wealth components other than primary residence less all debt components). Wealth and income were adjusted for household size. Scoring was reversed so that a higher SoDep Index Score indicates greater deprivation. Domain scores were weighted according to weights determined at index construction (Hofbauer & Rodriguez, 2021a). For the purpose of group comparison, we subdivided respondents into (1) those with extremely low SoDep Index scores (20th percentile), (2) those with extremely high SoDep Index scores (80th percentile). These percentiles are commonly operationalised as indicating ‘high’ and ‘low’ socioeconomic position (e.g., Stenberg et al., 2019). The remaining participants were considered to have a moderate SoDep Index ore (21st-79th percentile).
Lifestyle Index Score
Estimated Weighted Prevalence for Lifestyle Indicators by Social Deprivation Index Group.
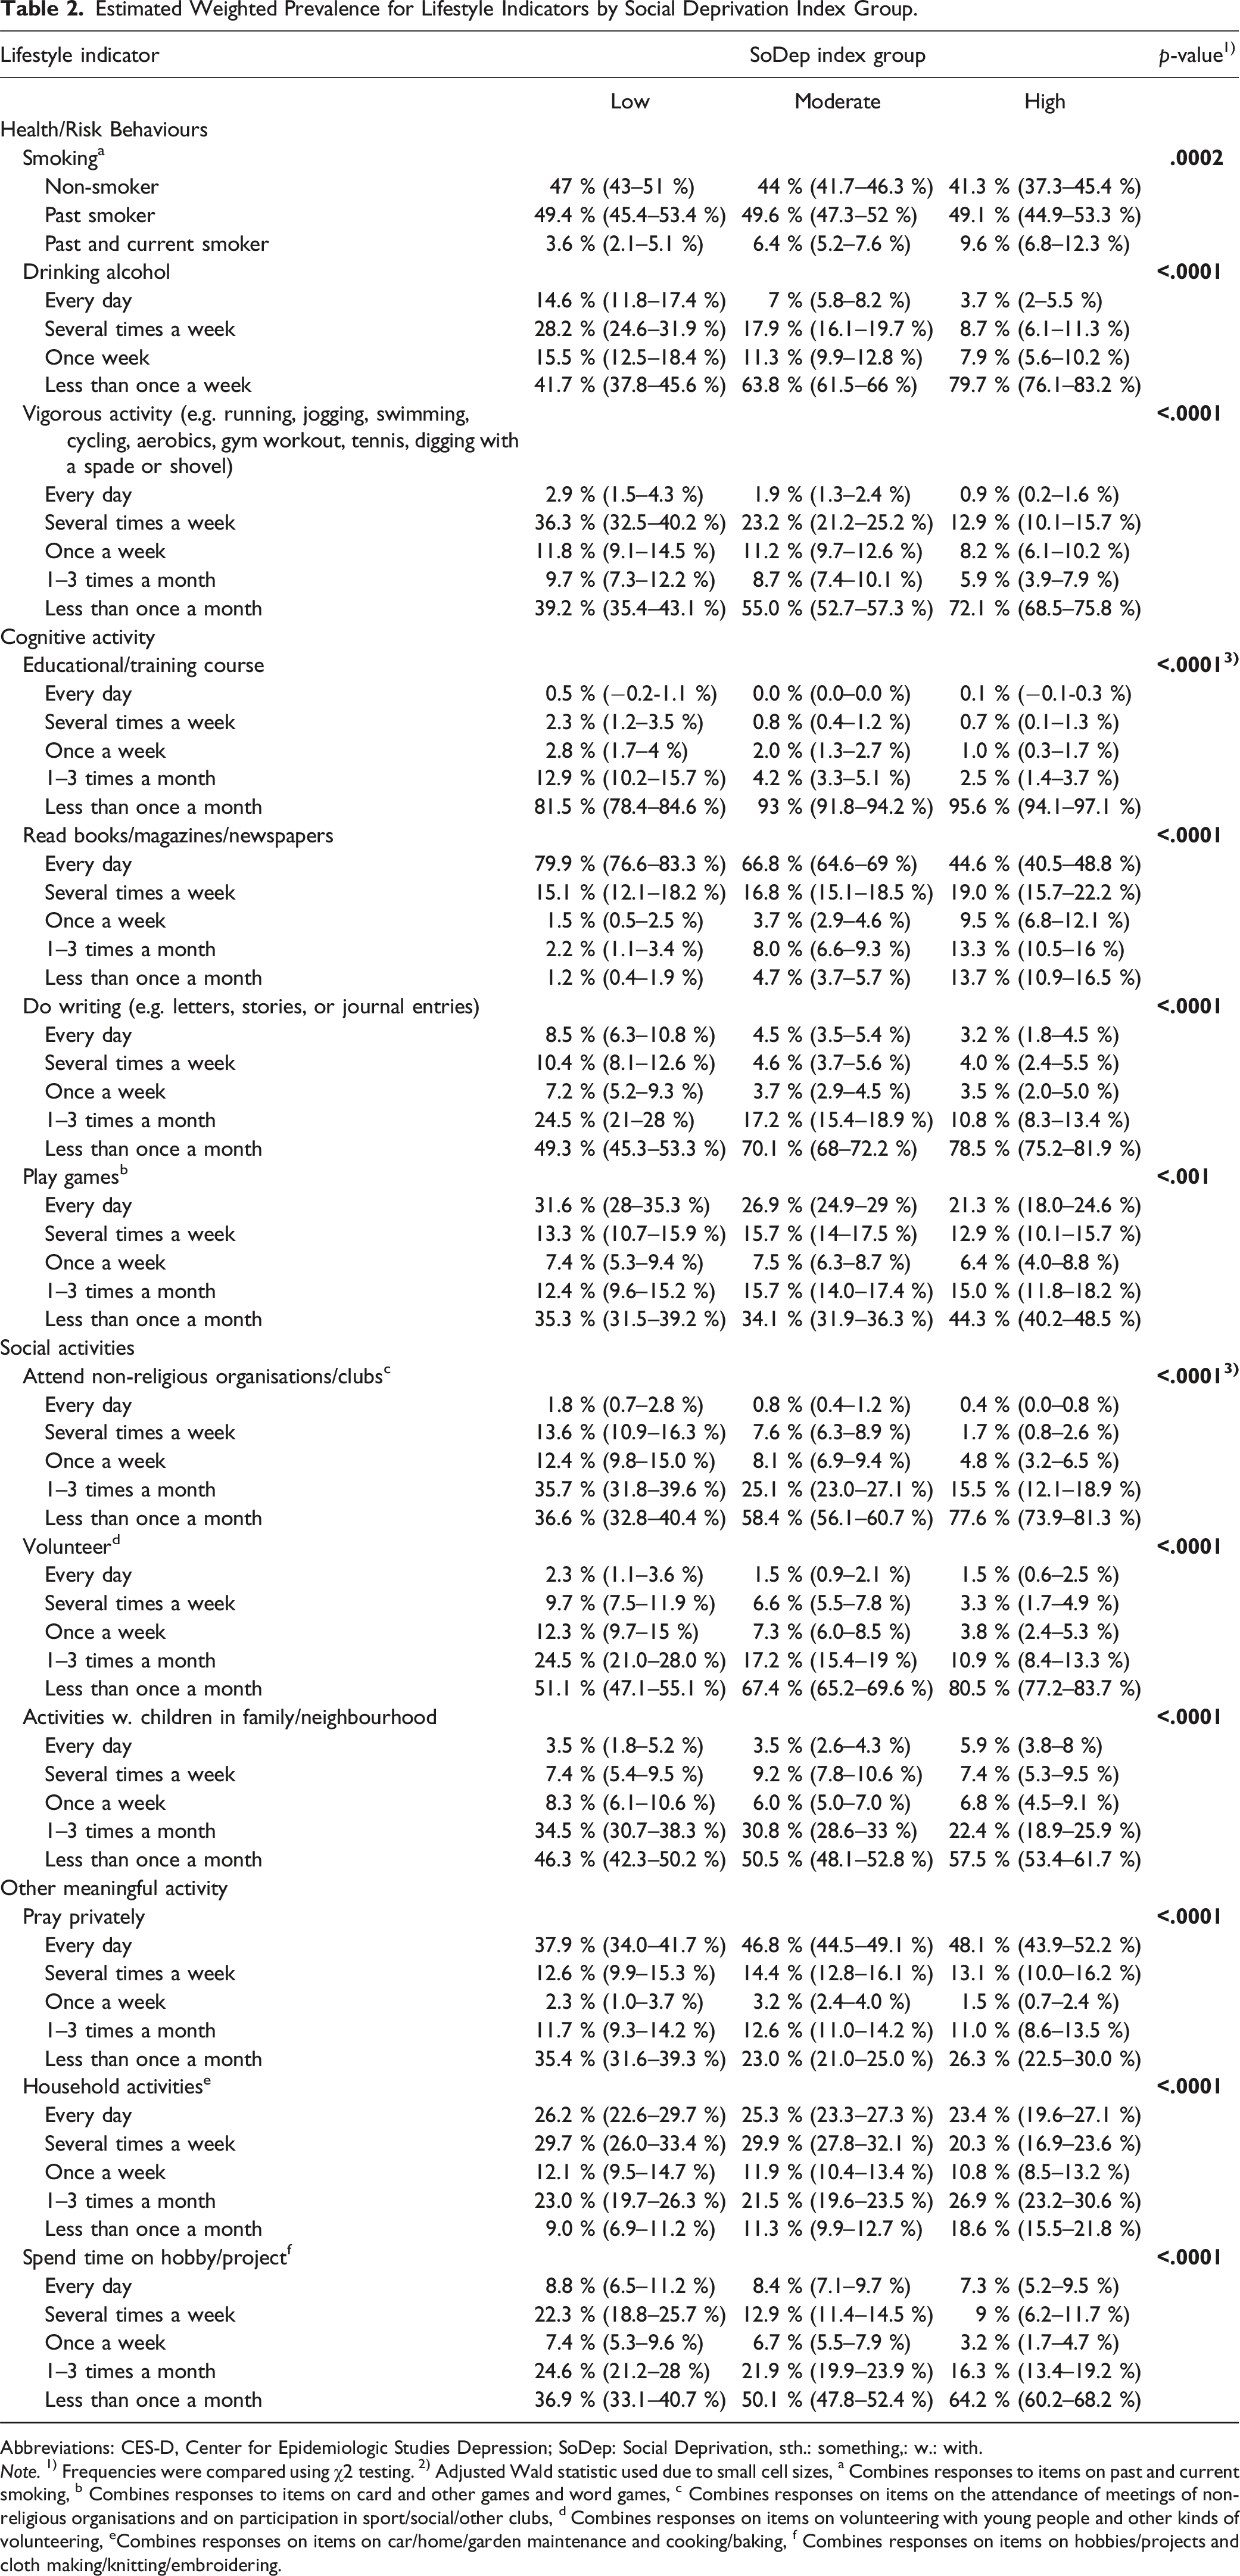
Abbreviations: CES-D, Center for Epidemiologic Studies Depression; SoDep: Social Deprivation, sth.: something,: w.: with.
Note. 1) Frequencies were compared using χ2 testing. 2) Adjusted Wald statistic used due to small cell sizes, a Combines responses to items on past and current smoking, b Combines responses to items on card and other games and word games, c Combines responses on items on the attendance of meetings of non-religious organisations and on participation in sport/social/other clubs, d Combines responses on items on volunteering with young people and other kinds of volunteering, eCombines responses on items on car/home/garden maintenance and cooking/baking, f Combines responses on items on hobbies/projects and cloth making/knitting/embroidering.
We used structural equation modelling (SEM) using lavaan in R to build the index. Specifically, this SEM is a confirmatory factor analysis in which all lifestyle activity items loaded onto a single latent ‘lifestyle’ variable. This approach to combining indicators into a compound measure has the advantage providing a weighting for each indicator without researchers making any a priori decisions about their relative importance. It is commonly used in health and social sciences to reduce dimensionality, avoid issues of multicollinarity among indicators, and achieve an intuitively interpretable score (e.g., Ivaldi et al., 2016; Yanuar et al., 2010). For the construction of the index, we initially included all lifestyle activity indicators. We reverse coded smoking and drinking alcohol so that a higher Lifestyle Index score would indicate a ‘healthier’ lifestyle.
We made stepwise adjustments to the SEM, removing variables with loadings <.04 in each step (see Supplemental Table 1). We evaluated fit using multiple indices (Comparative Fit Index (CFI), the Root Mean Square Error of Approximation (RMSEA), and the Standardized Root Mean Square Residual (SRMR)). Given a CFI >0.95, a RMSEA of <0.06 and a SRMR <0.05 adjustments were not necessary after the fourth iteration (Hooper et al., 2008). The final Lifestyle Index score for each participant is a weighted summary of the frequency at with respondents attend educational/training courses (weight: 0.57), read (weight: 0.42), do writing (weight: 0.53), participate in non-religious organisations or clubs (weight: 0.53), volunteer (weight: 0.62), and spend time on a hobby/project (weight: 0.41).
Cognitive Outcome
Cognitive testing in the HRS consists of a battery of tests (word recall, serial 7s, counting backwards, naming, orientation). This testing is administered to first-hand respondents only, never to proxy respondents (Ofstedal et al., 2005). In the word recall task, respondents were asked to reproduce a list of 10 words, once immediately and after a 5 min delay. Each correctly recalled word was worth one point at each instance (range: 0–20). In the serial 7s test, respondents had to subtract 7s from 100 in five consecutive steps (range: 0–5). The counting backwards task required counting backwards from 20 to 10. A score of two or one was assigned for a successful first or second attempt, respectively (range: 0–2). In the naming task, respondents had to name two objects after description (range: 0–2). In addition, they were asked the day of the week, month, day, and year (range: 0–4), and the President and Vice-President (range: 0–2). The total cognition score, which is the sum of these sub-test scores, thus ranges between 0–35. Where scores for respondents were missing, RAND provides imputations. No imputations are made for non-respondents, including in cases where proxies were interviewed (Mccammon et al., 2022). At baseline in 2010, cognitive testing scores were available for all respondents. At the follow-ups in 2012, 2014, 2016, and 2018, cognitive testing data were available for 99.41%, 99.74%, 99.50%, and 74.65% of respondents, respectively.
Covariates
Time-invariant covariates used were gender and race. Age, marital status, number of chronic health conditions, and the Center for Epidemiologic Studies Depression (CES-D) Scale score were used as time-variant covariates.
Analysis
All analyses were conducted using R (Version 4.2.2.) in RStudio (Rstudio Team, 2020). Unless otherwise indicated, we used the significance level α < .05.
Comparison of Lifestyle Indicators by SoDep Index Group
Using population weights in the data provided by RAND, we estimated the prevalence of each frequency of activity per SoDep Index group at baseline. Subsequently, using χ2 tests with Rao-Scott correction, we compared activity frequencies between SoDep Index groups. When cell sizes were too small to achieve reliable χ2 estimates, adjusted Wald testing was used. We used the Bonferroni-adjusted significance level of α < .004 (α < .05/13). No post-hoc testing was used, as the high number of comparisons would have rendered results highly susceptible to Type II error.
Association of Lifestyle Index and SoDep Index Group with Cognitive Status and Decline
We conducted growth curve modelling using the nlme package in R. All models included a random intercept and slope allowing for the initial cognitive status and the association between time and cognitive score to vary randomly. Age was used as the time variable and re-centred at 50. Given a significant quadratic association between age and cognitive score, we included the quadratic age term in the model. The first model included the age terms and SoDep Index group as predictors. The second model further included Lifestyle Index score. In the third model, we included the interaction between Lifestyle Index score and the squared age term to test the association between Lifestyle Index score and cognitive change over time. A fourth model included demographic covariates (gender, race, marriage status). The final fifth model included demographic covariates as well as health covariates (chronic conditions, CES-D score).
Mediation Analysis
Path modelling was completed using lavaan in R. The main exposure was the SoDep Index group (measured in 2010) and the Lifestyle Index score (measured in 2012/2014) was the mediator. The outcome of interest was the cognitive function at last assessment (‘follow-up cognition’, in 2016/2018). The model was designed specifically to test the following paths: (1) the direct path from baseline SoDep Index group to follow-up cognition, (2) the indirect path from baseline SoDep Index group via the Lifestyle Index score to follow-up cognition, and (3) the direct path from Lifestyle Index score to follow-up cognition. We report standardized coefficients. We took the product of coefficients approach to mediation (Mackinnon & Dwyer, 1993). We evaluated the bootstrap confidence interval (5000 samples) to determine the significance of the indirect effects (Hayes & Scharkow, 2013). Follow-up cognition was additionally predicted by baseline cognition. Covariates at follow-up were controlled for and predicted by the corresponding baseline predictor (e.g., a path from chronic conditions at baseline to chronic conditions at follow-up was included; see Supplemental Table 2). We assessed model fit according to CFI, RMSEA and SRMR. Given an insufficient model fit, we consulted modification indices and let CES-D score at follow-up be additionally predicted by of chronic conditions at follow-up. This resulted in satisfactory model fit (see Supplemental Table 2).
Results
Descriptive Analysis and Comparison of Lifestyle Activities by SoDep Index Group
SoDep Index groups did not differ in age at baseline and follow-up duration. However, compared to those in the low/moderate SoDep Index group those in the high SoDep Index group were more likely to be female, non-White, and not married/partnered. They had higher baseline CES-D scores and more baseline chronic conditions. Moreover, they exhibited lower cognitive function at both baseline and follow-up, compared to those in the moderate/high SoDep Index group (see Table 1). Chi-square comparison of the weighted frequencies of lifestyle activities (see Table 2) indicated that SoDep Index groups differed in the frequency of all 13 activities. Those in the high SoDep index group were most frequently smoking and least frequently partaking in vigorous physical activity. They were also drinking alcohol least frequently. Further, those in the high SoDep Index group participated less frequently in education/training courses, in reading books/magazines/newspapers, and in doing writing. Additionally, they were less frequently engaged in attending non-religious organisations and clubs, volunteering, in activities with children in the family/neighbourhood, and playing games. Finally, they reported the lowest frequency of household activities and time spend on hobbies but the highest of praying.
Association of SoDep Index Group and Lifestyle Index with Cognitive Status and Decline
Results From Growth Models of the Associations Between SoDep Index Group, Lifestyle Index Score and Cognitive Scores.
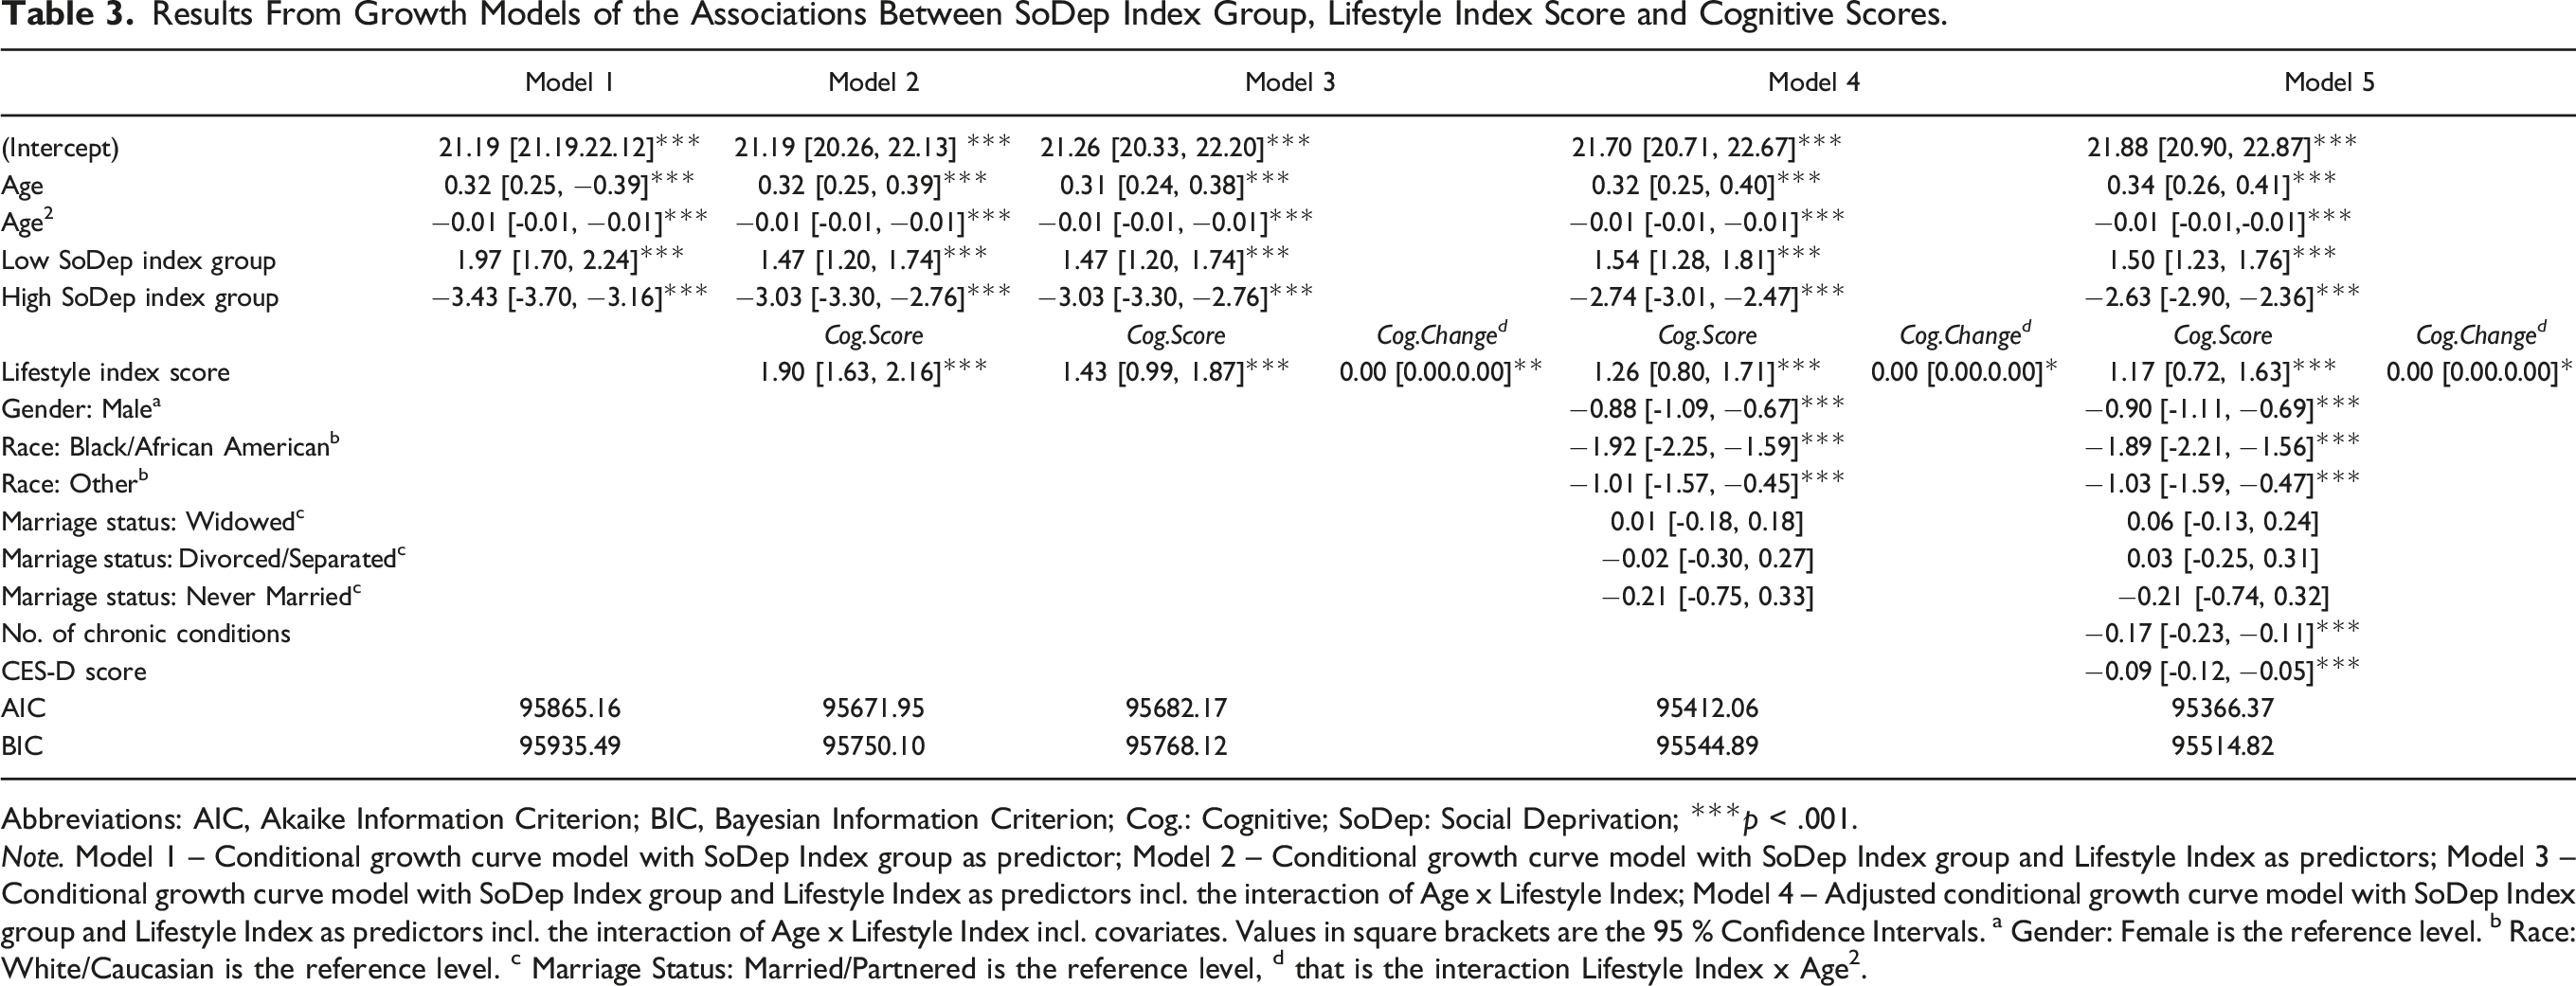
Abbreviations: AIC, Akaike Information Criterion; BIC, Bayesian Information Criterion; Cog.: Cognitive; SoDep: Social Deprivation; ***p < .001.
Note. Model 1 – Conditional growth curve model with SoDep Index group as predictor; Model 2 – Conditional growth curve model with SoDep Index group and Lifestyle Index as predictors; Model 3 – Conditional growth curve model with SoDep Index group and Lifestyle Index as predictors incl. the interaction of Age x Lifestyle Index; Model 4 – Adjusted conditional growth curve model with SoDep Index group and Lifestyle Index as predictors incl. the interaction of Age x Lifestyle Index incl. covariates. Values in square brackets are the 95 % Confidence Intervals. a Gender: Female is the reference level. b Race: White/Caucasian is the reference level. c Marriage Status: Married/Partnered is the reference level, d that is the interaction Lifestyle Index x Age2.
The Lifestyle Index score was positively associated with cognitive performance (β = 1.90, [95 % CI: 1.63, 2.16], p < .001). To illustrate, as lifestyle activity weights range between 0.41 and 0.62 (see Supplemental Table 1) one may roughly equate a unit increase in Lifestyle Index with two units increase on a lifestyle items’ frequency scale (see Table 2), provided that item is included in the index. This could, for instance, signify that a respondent attends a club not only 1–3 times a month but several times a week or reads not once a week but daily. A significant interaction between Lifestyle Index score and the squared age term took a positive value near zero (β = 0.00, [95 % CI: 0.00, 0.00], p = .010) indicating that higher Lifestyle Index scores were associated with a negligible attenuation in cognitive decline over time (‘Model 3’). All effects survived adjustment for demographic covariates (‘Model 4’) and for additional health-related covariates (‘Model 5’).
Figure 1 shows the predicted cognitive performance across time for four respondent types: (1) someone in the high SoDep Index group with a high Lifestyle Index score, (2) someone in the high SoDep Index group with a low Lifestyle Index score, (3) someone in the low SoDep Index group with a high Lifestyle Index score, and (4) someone in the low SoDep Index group with a low Lifestyle Index score. Estimated cognitive scores based on the adjusted growth curve model. Abbreviations: Lifestyle Ind: Lifestyle Index score, SoDep Ind.: Social Deprivation Index score. Note: Cognitive scores estimated using model coefficients of Model 5 (see Table 3). Scores estimated for a hypothetical individual with (1) a low Social Deprivation index score and a high Lifestyle index score, (2) a low Social Deprivation index score and a low Lifestyle index score, (3) a high Social Deprivation index score and a high Lifestyle index score, and (3) a high Social Deprivation index score and a low Lifestyle index score. As a ‘low’ score, we chose the respective index score marking the 20th percentile; as a ‘high’ score the index score marking the 80th percentile. For all estimations, we kept categorical covariates at the reference level (gender: female; marriage status: married/partnered) and used the average values for the number of chronic conditions and EURO-D score.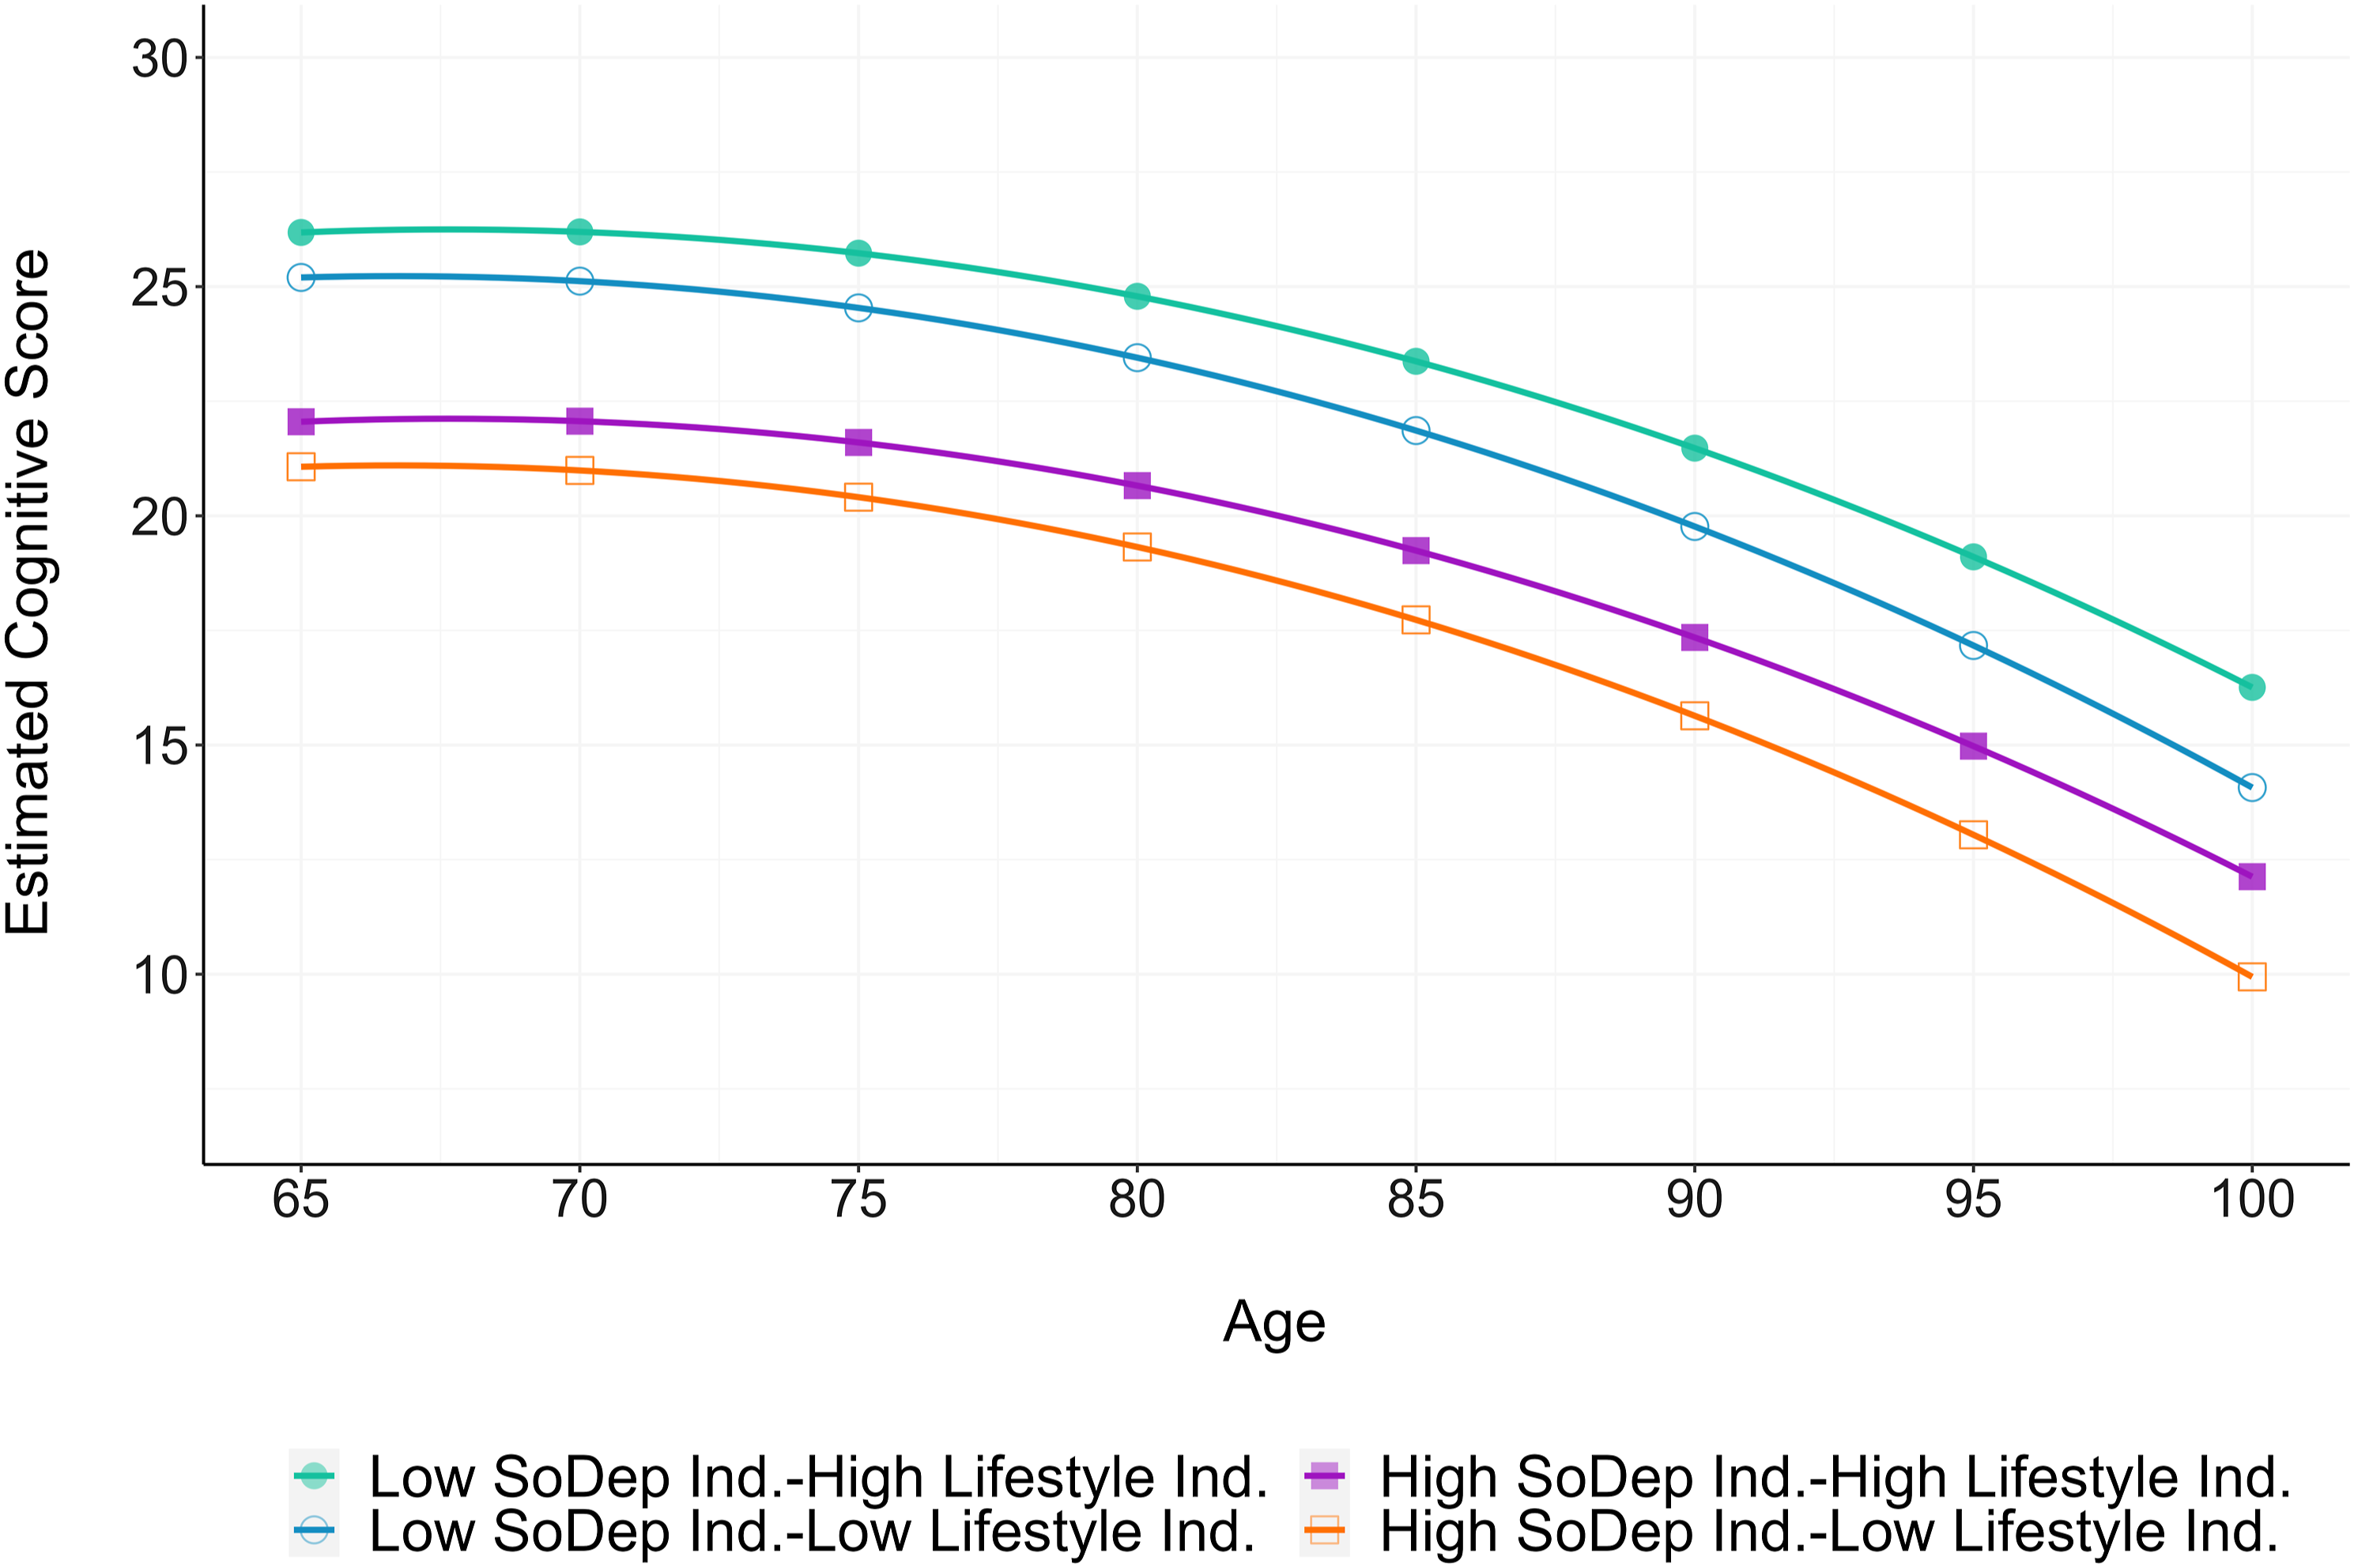
Mediation Analysis
Fit indices of the path model of the mediation effect of lifestyle in the association between social deprivation and follow-up cognition indicated good model fit (CFI: 0.98, RMSEA: 0.05, SRMR: 0.04). Figure 2 shows the path diagram with standardised coefficients (full model output in Supplemental Table 3). There was a significant direct associations between SoDep Index group as well as the Lifestyle Index score and follow-up cognition, and a significant indirect association of SoDep Index group via Lifestyle Index Score. As the bootstrapped confidence interval of the indirect path coefficient excludes zero (Std. β = −0.03, [95 % CI: −0.04, −0.02], p < .001), we can conclude that the effect of SoDep Index group was partially mediated by Lifestyle Index score. The total effect of SoDep Index group on follow-up cognition was significant and negative (Std. β = −0.11, [95 % CI: −0.14, −0.09], p < .001). Thus, the indirect effect via Lifestyle Index Score accounted for 27% of the total effect of SoDep Index group on follow-up cognition. Path diagram showing paths between social deprivation and cognition as mediated by lifestyle with standardised coefficients. Abbreviations: SoDep: Social Deprivation Index group, Lifestyle: Lifestyle Index score; FollowCog: Cognitive score at last follow-up; ***p < .001. Note: Paths involving covariates are not displayed. Refer to Supplemental Table 2 for coefficient estimates. Curved arrows indicate the error variance.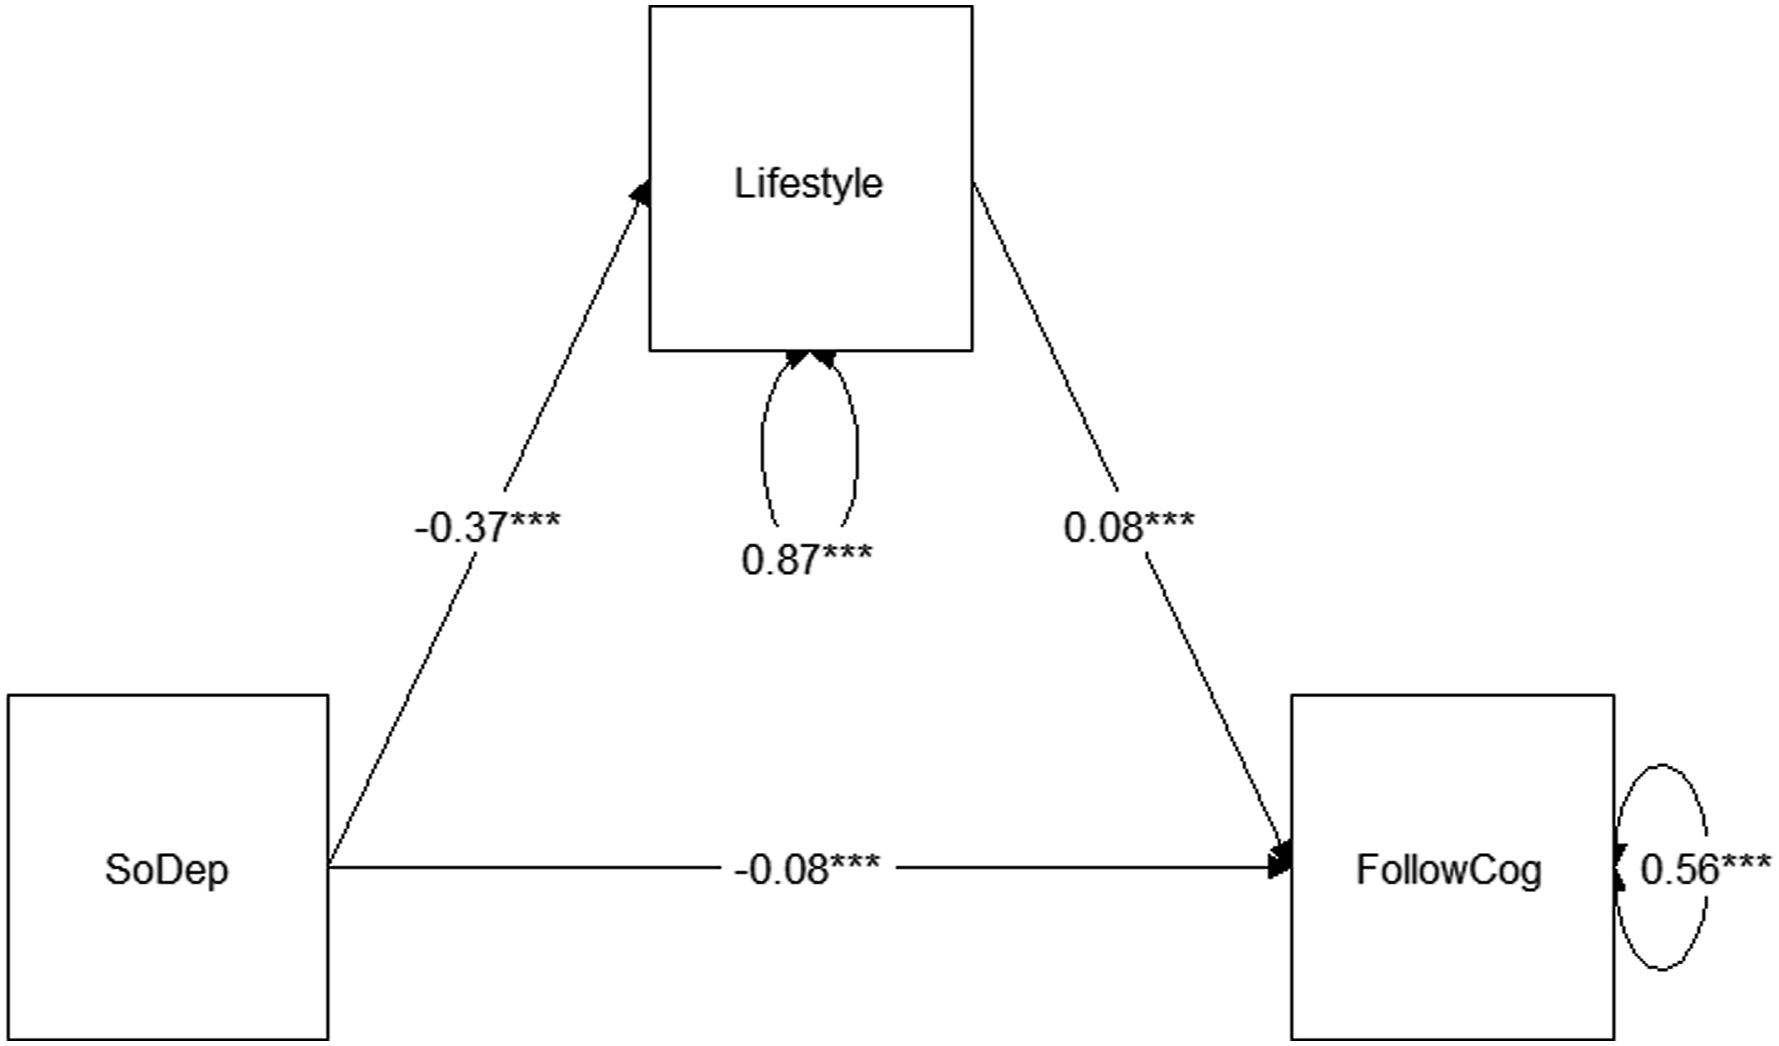
Discussion
In this work, we set out to assess the association between social deprivation and participation in a broader range of lifestyle activities, evaluate the association between social deprivation and lifestyle behaviours with cognition across time, and to assess whether the lifestyle activities mediate the association between social deprivation and cognitive function.
We found that those with higher social deprivation are less likely to frequently engage in a range of stimulating activities (e.g., reading, volunteering) but more likely to frequently engage in some health risk behaviours (e.g. smoking, physical inactivity). This expands on previous findings of lifestyle disparities based on wealth and SES (Deckers et al., 2019; Röhr et al., 2022). Reasons for reduced engagement with stimulating activities may include lack of access to the appropriate environments (e.g. lack of spaces for physical exercise) and lack of social capital (i.e. lower social cohesion and trust) (Chen & Miller, 2013). Stress may also be relevant, particularly to engagement in health risk behaviours, as perceived stress has been shown to be associated with such behaviours in individuals in deprived neighbourhoods (Algren et al., 2018). While the frequency of alcohol consumption was lower in those with higher deprivation, this may mask a higher probability of engaging in high-risk drinking (i.e. high intake in a single instance), as has been found previously (Beard et al., 2019).
As observed previously (Hofbauer & Rodriguez, 2021, 2021b), social deprivation was negatively associated with cognitive function in longitudinal growth curve models. This association was attenuated when adding the lifestyle indicator. In line with previous results (Sommerlad et al., 2019), lifestyle activity participation was positively associated with cognitive status in longitudinal growth curve analysis. While there also was an association of higher Lifestyle Index scores with slowed cognitive decline, the size of this effect was negligible. This is reminiscent of the associations between education and cognition (Lövdén et al., 2020) and social deprivation and cognition (Hofbauer & Rodriguez, 2021, 2021b), which are notable for the level but not the rate of change of functioning. Taken together, this indicates that life experiences may influence the risk of significant cognitive decline only in as far as they influence the likelihood of reaching a threshold for notable impairment.
We found a partial mediation of the association between social deprivation status and cognition via lifestyle. This highlights lifestyle aspects as promising intervention targets. Indeed, multicomponent lifestyle intervention trials have successfully reduced cognitive decline in healthy (Ngandu et al., 2015) and at-risk (Andrieu et al., 2017) individuals. However, it is important to note the magnitude of the observed mediation; the indirect effect via lifestyle made up only 27% of the total effect of social deprivation on follow-up cognition. This underlines that, rather than focusing too heavily on individual lifestyle, broader social context needs to be considered (Daly, 2023). The exposure to multiple, converging risk factors likely is responsible for a large proportion of variance in health outcomes associated with socioeconomic status (Evans & Kim, 2010). Thus, guidelines for the prevention of cognitive decline and dementia need to go beyond individual behaviour and acknowledge the role of deprivation in cognitive health (Daly, 2023).
Strengths of the present analysis include the large, extensively described sample with longitudinal data on a timeline suitable for causal interpretation of mediation analysis. Still, there are limitations to our results. By selecting only respondents who completed at least two cognitive tests and were not institutionalised at baseline, we likely ended up with an analysis sample that was healthier than the overall sample and healthier than the general older population. This may have led us to underestimate the associations between SoDep Index group and Lifestyle Index Score on cognition. Further, as the Lifestyle Index contains cognitive activities (adult education, reading, and writing) there is a risk of circularity in our analysis. However, this is mitigated by the fact that follow-up cognition was measured after the lifestyle assessment.
Conclusion
In conclusion, our results emphasize an association between higher social deprivation and lower cognitive function that persists when accounting for lifestyle activities. A greater participation in lifestyle activities is associated with better cognition and mediates the effect of social deprivation on cognition. While lifestyle thus remains an interesting target for interventions, the effects of systematic disadvantages should be explored further and addressed in efforts to prevent cognitive decline.
Supplemental Material
Supplemental Material - The Mediating Role of Lifestyle Activities in the Association Between Social Deprivation and Cognition in Older Adulthood: Results From the Health and Retirement (HRS) Study
Supplemental Material for The Mediating Role of Lifestyle Activities in the Association Between Social Deprivation and Cognition in Older Adulthood: Results From the Health and Retirement (HRS) Study by Lena M. Hofbauer, and Francisca S. Rodriguez in Journal of Aging and Health
Footnotes
Acknowledgements
We want to thank the Health and Retirement Study (HRS) Staff as well as the RAND Corporation for making the data available for analysis.
Author Contributions
Lena M. Hofbauer and Francisca S. Rodriguez contributed equally to conception of this work. Data preparation and analysis were performed by Lena M. Hofbauer and checked by Francisca S. Rodriguez. The first draft of the manuscript was written by Lena M. Hofbauer and both authors commented on previous versions of the manuscript. Both authors read and approved the final manuscript.
Ethics Approval
This work is based on secondary analysis of data without any identifying information and does as such not require ethical approval. The original data collection by the Health and Retirement Study (HRS) was performed in line with the principles of the Declaration of Helsinki. Approval was granted by the University of Michigan Institutional Review Board.
Data Availability Statement
Supplemental Material
Supplemental material for this article is available online.
References
Supplementary Material
Please find the following supplemental material available below.
For Open Access articles published under a Creative Commons License, all supplemental material carries the same license as the article it is associated with.
For non-Open Access articles published, all supplemental material carries a non-exclusive license, and permission requests for re-use of supplemental material or any part of supplemental material shall be sent directly to the copyright owner as specified in the copyright notice associated with the article.