
Abstract
Keywords
Introduction
Background: Research on Self-Rated Health
Self-rated health (SRH) is arguably the most used single indicator of (generic) health in survey research. As such, it is routinely used both as a dependent as well as an independent variable for cross-sectional and longitudinal analyses in many scientific disciplines. This predominance of SRH as a health measure in survey research is typically motivated by its concise and standardized form, comprehensiveness and inclusiveness, universal availability in existing data sources, strong relationship with other health indicators, and its ability to predict mortality (e.g., Benyamini, 2011; Idler & Benyamini, 1997; Jylhä, 2009).
Despite its popularity in applied research, there are concerns that SRH is not sensitive to health changes due to its strong temporal stability even when health changes occur over time (e.g., Galenkamp et l., 2012; Spuling et al., 2017). On the other hand, there are also studies that find a strong association between declining health (e.g., more chronic health conditions or worse functioning) and worsened SRH (e.g., Galenkamp et al., 2013; McCullough & Laurenceau, 2004). In between these positions, some studies with a focus on the moderation of the impact of health changes on SRH by age found that the strength of this association might decrease with age (e.g., Heller et al., 2009; Galenkamp et al., 2012).
Along with these inconsistent results, models explaining (changes in) SRH in previous research were typically limited to only few aspects of health such as functioning or chronic conditions while excluding other possibly relevant health domains such as pain, mental health, or health behaviors.
Analytical Model: Modeling Health Ratings
A more comprehensive analytical model, specifically, comprising more health domains, of the cognitive process of answering the SRH-question is depicted in Figure 1. This model was synthesized by Lazarevič (2019) from a general model of the cognitive process of answering questions by Tourangeau (1984) and its extension by Strack and Martin (1987) along with models specific to answering SRH-questions (i.e., Knäuper & Turner, 2003; Jylhä, 2009). In short, it postulates that respondents base their health rating on (known) information about (changes in) their latent health, that is, the complex, multidimensional “true” underlying health status of the respondents. To enable an analysis of the possibly changing composition of SRH, we differentiate between the effects of five latent health domains on SRH, namely functioning, diseases or chronic conditions, pain and its intensity, mental health or depression, and health-relevant behaviors or their (not necessarily tangibly health affecting) consequences (solid arrows). Due to a variety of reasons, for example, different health aspirations or typical group-specific health problems, these influences can also be moderated by sociodemographic aspects like gender or age (dashed arrows). For example, as women are typically more often confronted with disabling non-lethal health conditions than men (Crimmins et al., 2010), this health dimension might be more important for their health ratings. A more in-depth derivation, description, and discussion of this model in English is provided by Lazarevič and Brandt (2020). Analytical model of influences of (changes in) health domains on (changes in) SRH.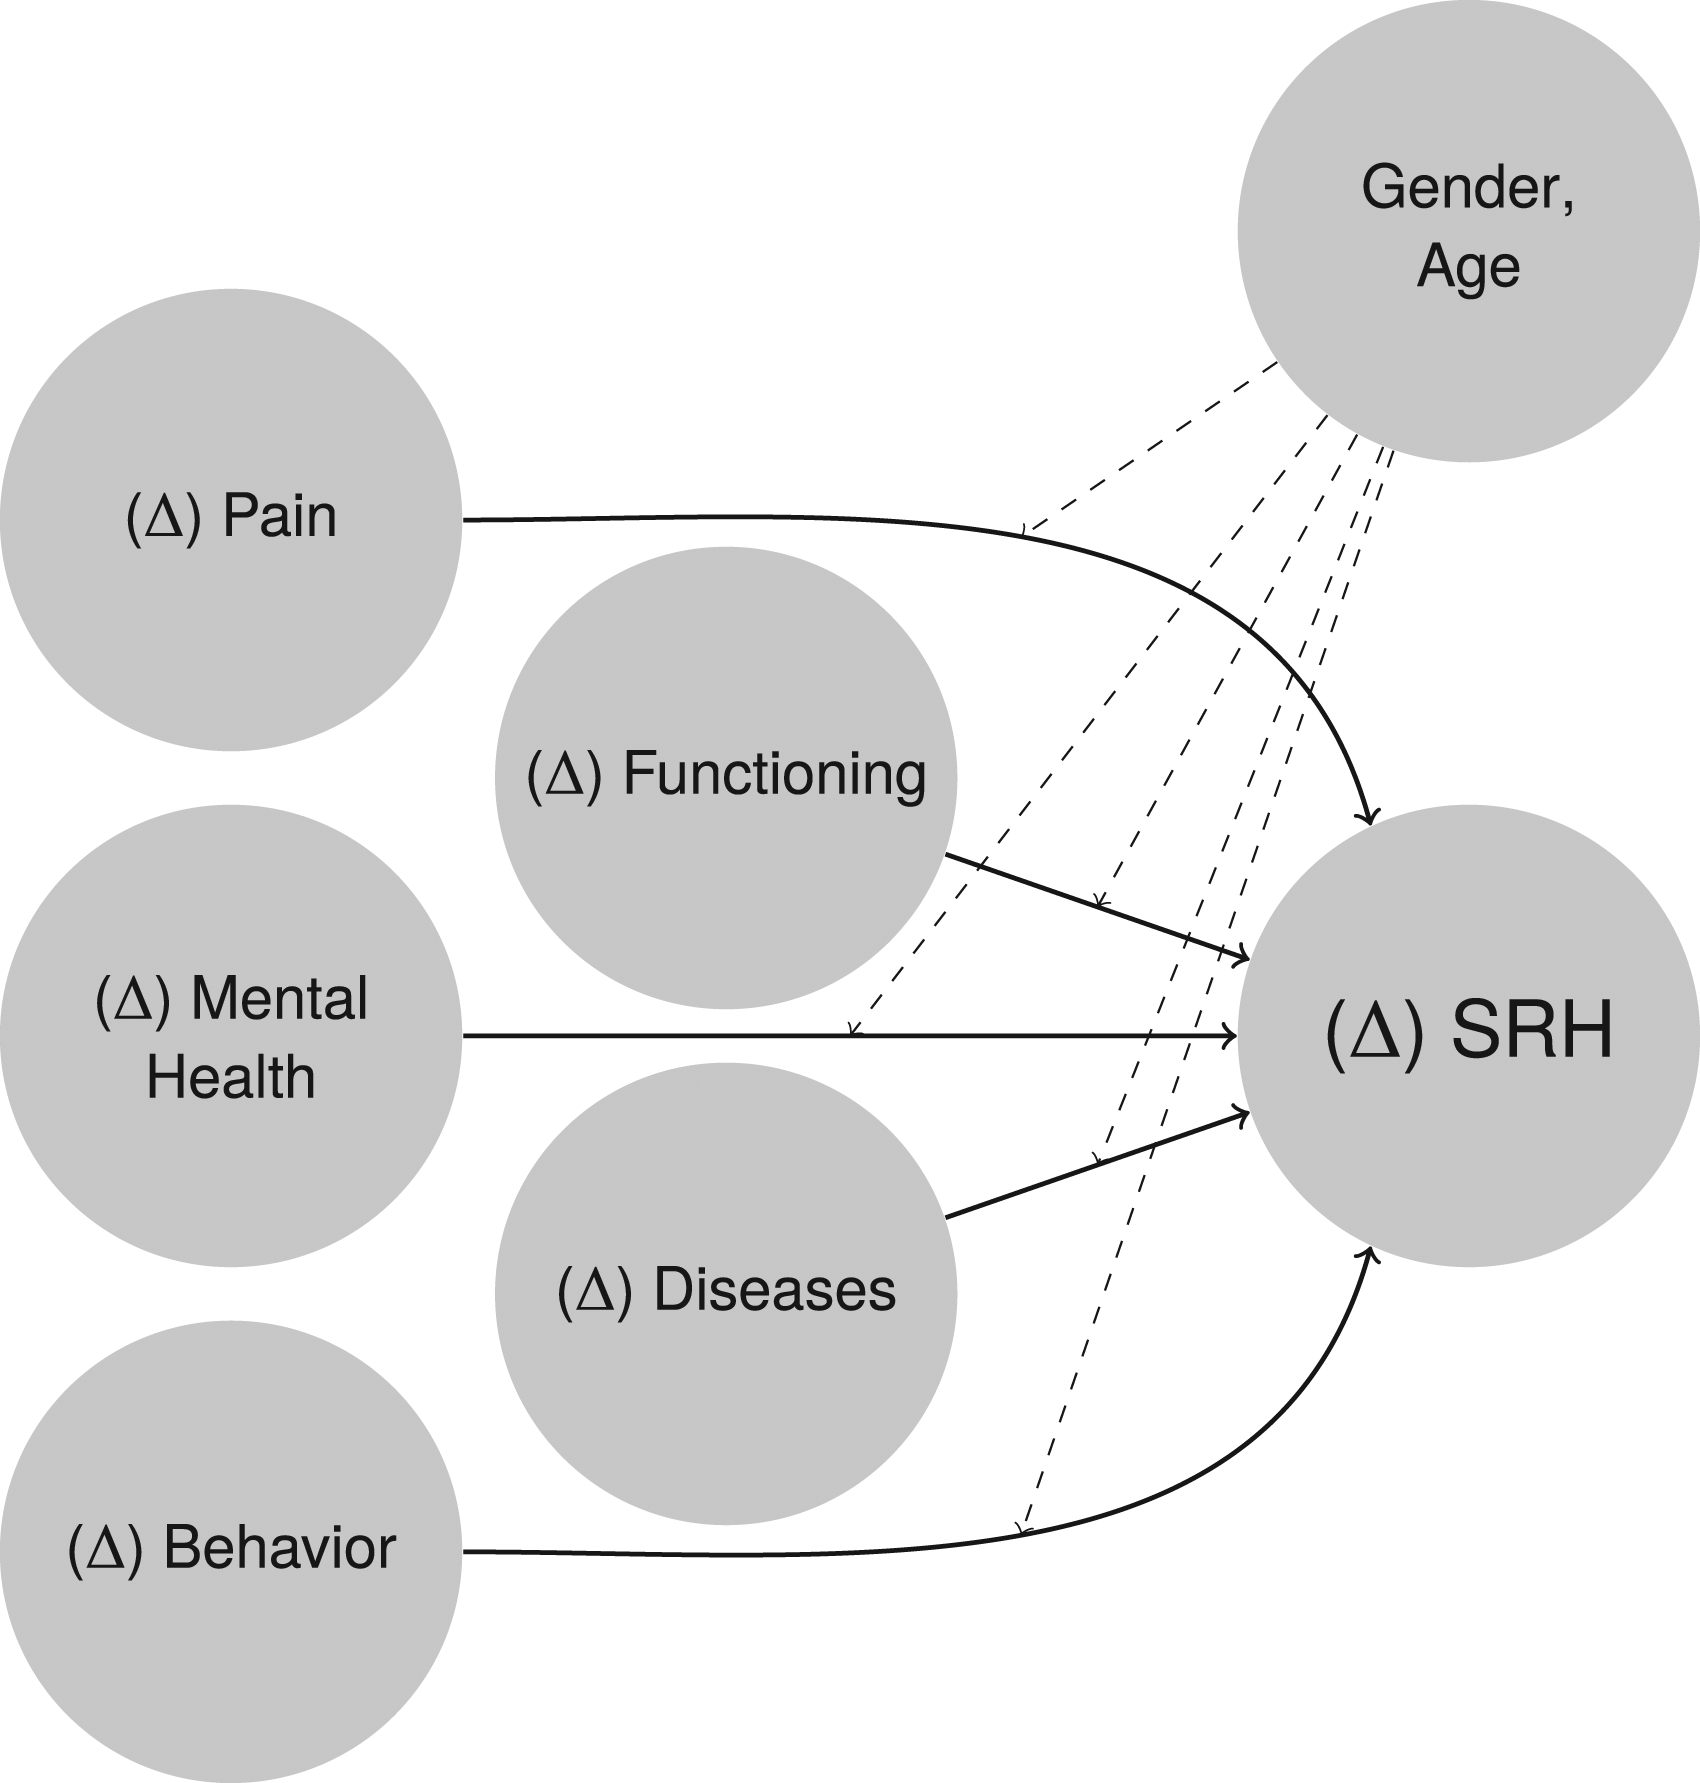
Succinctly, in analytical terms, the solid arrows correspond to the effects of the five latent health domains on SRH or the effect of health changes on changes of SRH (Δ SRH) for cross-sectional and longitudinal analyses, respectively. Hence, examining the strength of these relationships shows the extent to which (Δ)SRH is determined by (changes in) health characteristics. As the dashed arrows depict moderating effects of respondents’ sociodemographic characteristics, that is, differences in the strengths of the previous health effects, their examination provides a valuable insight into gender- or age-specific response behaviors—including the putative weakened influence of health changes in older age.
In addition to the more comprehensive view in examining the relationship of (changes in) health characteristics and SRH (and its changes), this paper aims to close two other research gaps. First, prior studies did not explicitly focus on the relative influence of health dimensions on SRH, nor on the association between changes in these two concepts. Thus, it is currently unclear to what extent these dimensions differ in their relative weight on the respondents’ ratings of health and its changes. Second, earlier research on longitudinal influences on SRH did not simultaneously attempt to compare cross-sectional and longitudinal effects of (changes in) health characteristics on SRH. Consequently, it is unknown whether the same health dimensions are relevant for the respondents’ ratings of health at a point in time (cross-sectional) as for changes in SRH between survey waves (longitudinal).
Importantly, this paper deliberately focuses only on how health characteristics are reflected in SRH without any consideration for what determines these health characteristics, such as socioeconomic status. Thus, determinants of health are not reflected in the models of this paper to focus on how health information known to the respondents are used to construct the health rating given in a survey interview. Put bluntly, our goal is to identify how respondents come to an overall rating from a given state of health, not how they came to that state.
In the remainder of this paper, we first shortly describe the data set and variables we used including a short description on how the independent variables correspond to the five latent health domains as well as some methodological considerations. The following analyses focus on a decomposition of the explained variance of SRH in regression analyses by the five latent health domains over five birth cohorts. As we are interested in differences in the relevance of these domains at a moment in time as well as in regards to health changes, we employed both cross-sectional and fixed effects (FE) regression models. Finally, we discuss the results, limitations, and possible future directions in this field of research based on our findings.
Data and Methods
Data: The National Population Health Survey
We used data from all nine waves of the Canadian National Population Health Survey (NPHS) collected between 1994 and 2011 in which year data collection for this survey concluded. The NPHS as a nationally representative panel study enables us to operationalize the model in Figure 1 in order to compare the importance of the five health domains for both SRH at a point in time (cross-sectionally) as well as its changes (longitudinally). The NPHS is exceptionally well-suited for this purpose as it provides a wide array of health information enabling a broad operationalization of our theoretical model, has a great number of panel waves spanning one and a half decades providing a valuable basis for longitudinal modeling, and a large enough sample to carry out age-specific analyses both cross-sectionally and longitudinally. Overall, we were able to use cross-sectional data from 15,178 respondents (8,346 women and 6,832 men) and longitudinal data from 14,096 respondents (7,680 women and 6,416 men) and 85,316 person years (46,799 from women and 38,517 from men) for our analyses. All analyses were weighted with post-stratification weights and the longitudinal analyses were additionally weighted with longitudinal weights, all provided by Statistics Canada.
The NPHS collected SRH in its US-format, meaning the response options were excellent/very good/good/fair/poor. In all our analyses, we treated SRH as (quasi-)metric, meaning we assumed the level of measurement of this variable to be metric in order to utilize linear regression modeling. This was done in spite of SRH being considered to be ordinal by some researchers due to having five fully labeled answer categories (Manor et al., 2000). This use of SRH is justified according to Urban and Mayerl (2011, p. 275) as this variable has five ordered categories that can be seen as describing points of continuous concept (in this case, latent health) and their equidistance can be assumed as SRH is approximately normally distributed (for example, its skewness in the first wave was −0.52). Further, similar research by Lazarevič and Brandt (2020), which also modeled SRH via latent health indicators, demonstrated that ordinary least squares (OLS) regression models and generalized ordered logit models, which do not assume the dependent variable to be (quasi-)metric (Williams, 2006), yielded strikingly similar results (full documentation of these results can be found in Lazarevič, 2019). As an additional robustness check, we attempted to replicate all cross-sectional analyses of this paper as generalized ordered logit models. While the models stratified by age and gender did not converge, likely due to lower frequencies in some subgroups, the models by gender yielded strikingly similar results as the OLS models. The results by gender can be found in the supplementary material of this paper (Figure 4).
The five health dimensions and corresponding variables used here as health determinants of SRH are listed below. Some descriptive statistics for the cross-sectional and longitudinal samples can be found in the supplemental materials in Tables 2 and 3. • Functioning: Any restrictions in daily life (i.e., at home, in school, at work, or other area), the number of restrictions in daily life (using an (instrumental) activities of daily living scale based on works by The Staff of the Benjamin Rose Hospital (1959) and expanded by Lawton and Brody (1969)), and the number of activities needed help with (based on the Health Utilities Index Mark 3 (HUI3) by Feeny et al. (1995)). • Diseases: Being affected by any chronic health-conditions (that is, self-reporting to have any “long-term disabilities or handicaps”) and the number of self-reported diagnoses (19 health conditions available in all waves: food allergies; other allergies; asthma; arthritis or rheumatism, excluding fibromyalgia; back problems, excluding fibromyalgia and arthritis; high blood pressure; migraine headaches; chronic bronchitis or emphysema; diabetes; epilepsy; heart disease; cancer; intestinal or stomach ulcers; effects of a stroke; urinary incontinence; alzheimer’s disease or any other dementia (senility); cataracts; glaucoma; any other long-term condition that has been diagnosed by a health professional). • Pain: Being affected by chronic pain and its intensity (with the options no, mild, moderate, and severe). • Mental health: The number of symptoms of a major depressive episode in line with the definition of the Diagnostic and Statistical Manual of Mental Disorders and the corresponding scale by Kessler et al. (1998). • Behavior: Being under-/overweight or obese based on the respondents’ self-reports for height and weight according to the body mass index (BMI) classification established by the WHO (2000), and self-reports on smoking.
All count variables, that is, the number of restrictions in daily life, number of activities needed help with, number of diagnoses, and number of symptoms of a major depressive episode, were transformed using an inverse hyperbolic sine transformation
In order to stratify by age, we used five birth cohorts, specifically, 1965–1977, 1950–1964, 1930–1949, 1915–1929, and 1892–1914 corresponding to the following age groups in the first wave of the survey: 18–29, 30–44, 45–64 65–79, and 80–102 years old. For the sake of comparability, we applied the same models to these birth cohorts individually.
Method: Regressions and Dominance Analyses
To model the influences the respondents’ health characteristics have on their SRH cross-sectionally, that is, how they rated their health based on their current health status, we utilized OLS regression models. The explained variance (R2) of these regressions can be interpreted here as the amount of the respondents’ variance in health ratings that can be explained by the health characteristics they reported in the survey. To analyze the influence of health changes on changes in SRH, we used FE regression models and, more specifically, the explained within variance
As we aimed to compare the importance of health dimensions in SRH, we conducted dominance analyses to quantify each health dimension’s contribution to the overall R2 of a regression model explaining SRH via its health determinants using the Stata-module domin (Luchman, 2013). Simply examining this by comparing the explained variance for each health domain or the increase of R2 due to successively adding health domains to a model would not suffice here as the health domains are highly correlated, which would make it impossible to isolate each domain’s individual contribution to the SRH. Dominance analyses, however, compare the added explained variance for all possible subsets of variables (i.e., combinations of the five health dimensions) to estimate each of these sets’ contributions to the R2 of the full model (Budescu, 1993; Luchman, 2014, 2015). Thus, this approach allows for a decomposition of R2 into individual contributions of each health domains while at the same time controlling for any other domain. As the resulting dominance statistics are additive, each statistic represents the amount of explained variance in the full model that is due to the health domain in question. Consequently, this statistic can be understood as a quantification of the relevance each health domain has for the overall health rating.
Accordingly, the interpretation of the results of this paper is also conceptually different from, for example, the practice of comparing health characteristics’ effect sizes in regression models between different cohorts as a measure of their relevance. Apart from allowing the combination of multiple variables to health domains, our approach quantifies the contribution of health characteristics to the overall construct of SRH while effect sizes only compare the influence they have on an individual’s health rating. This distinction is especially relevant whenever there are marked differences between the compared groups in the share of respondents exhibiting the health characteristic(s) in question, that is, if their incidence is age-related. While a health characteristic that is relatively rare in younger ages, such as diabetes, might have a strong impact on the affected individual’s health rating (i.e., effect size), the resulting coefficient would not reveal much about the characteristic’s general relevance for this group’s health ratings. Dominance statistics, however, quantify each characteristic’s overall contribution to the dependent variable in question.
Using this approach also enables a comparison of different groups, in this case gender and birth cohorts, regarding their weighting of health dimensions in their health ratings. As to enable a more robust comparison of potential differences, we calculated confidence intervals via bootstrapping with 10,000 samples for each model. These confidence intervals are our main criterion for evaluating substantial differences regarding the importance of health dimensions in SRH between the examined subgroups.
Results
Figure 2 displays the results of a decomposition of the explained variance by gender, five birth cohorts, and five health dimensions cross-sectionally with data of the first wave of the NPHS (full regression results by gender can be found in the supplemental material in Table 4). Looking firstly at gender, the only clear trend was a greater explained variance for most health dimensions for women, except in the (highly selected) oldest birth cohort. These gender differences were stronger and more consistent for diseases and pain, at least in the four younger age groups, but also for functioning in some age groups. However, these differences should be viewed cautiously as the confidence intervals, especially in the oldest age group, strongly overlap in all cases. Results from cross-sectional analyses (absolute contributions of health domains to 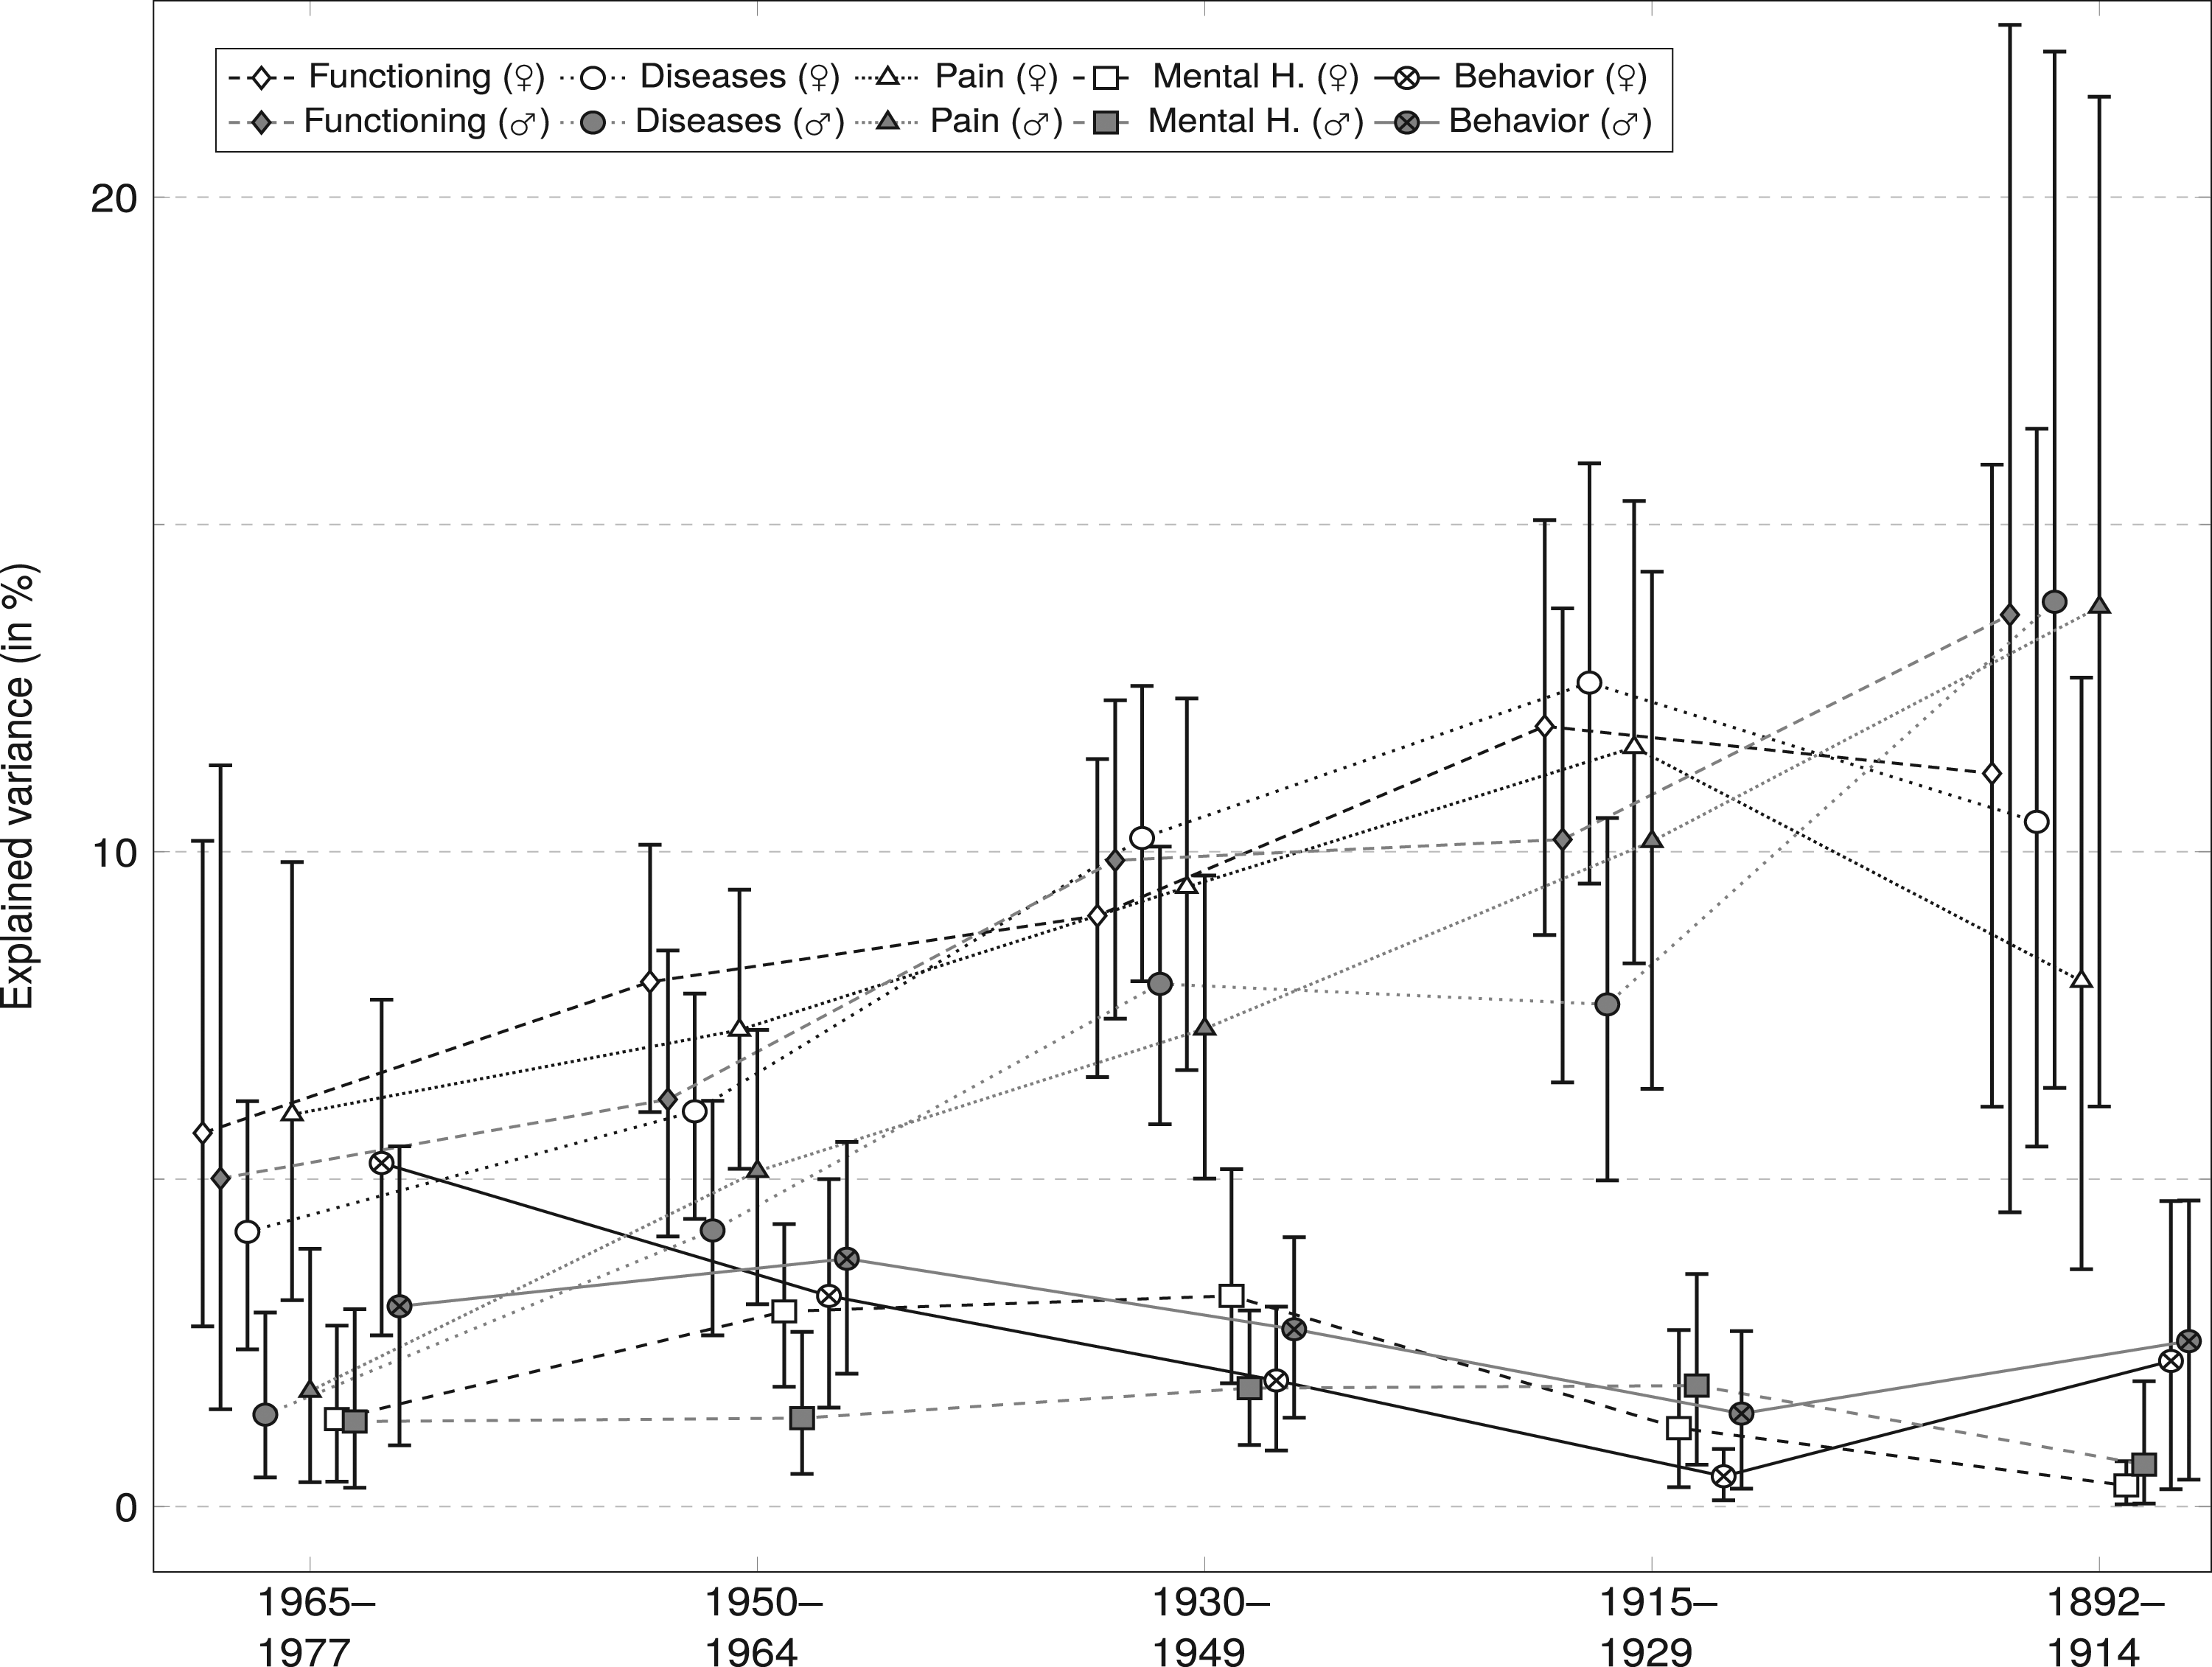
Second, when looking at age differences, two distinct trends emerge. On the one hand, the importance of functioning, diseases, and pain for SRH strongly increased with age as these health dimensions had a much greater influence on SRH in older cohorts. This was especially the case after age 45 where confidence intervals of these health domains did not overlap with those of mental health and behavior. On the other hand, the importance of mental health and health behaviors appeared to have a decreased influence on subjective health in older cohorts, albeit in this case with overlapping confidence intervals. From another perspective, these results might also correspond to a broader and more equal incorporation of all health dimensions in younger respondents while their older counterparts’ ratings were more strongly focused on physical and concrete health problems.
Results from FE regression models that replicate the previous models with longitudinal data are shown in Figure 3 (full regression results by gender can be found in the supplemental material in Table 5). Due to this method, the results in this figure can be interpreted as the influence that changes of the five health domains have on changes on SRH for each age group separately. Gender differences were, like in the cross-sectional analyses, rather low in these FE models with minor exceptions like functioning being more relevant for women in the youngest cohort while the opposite was evident in the oldest age group. Results from longitudinal analyses (absolute contributions of health domains to 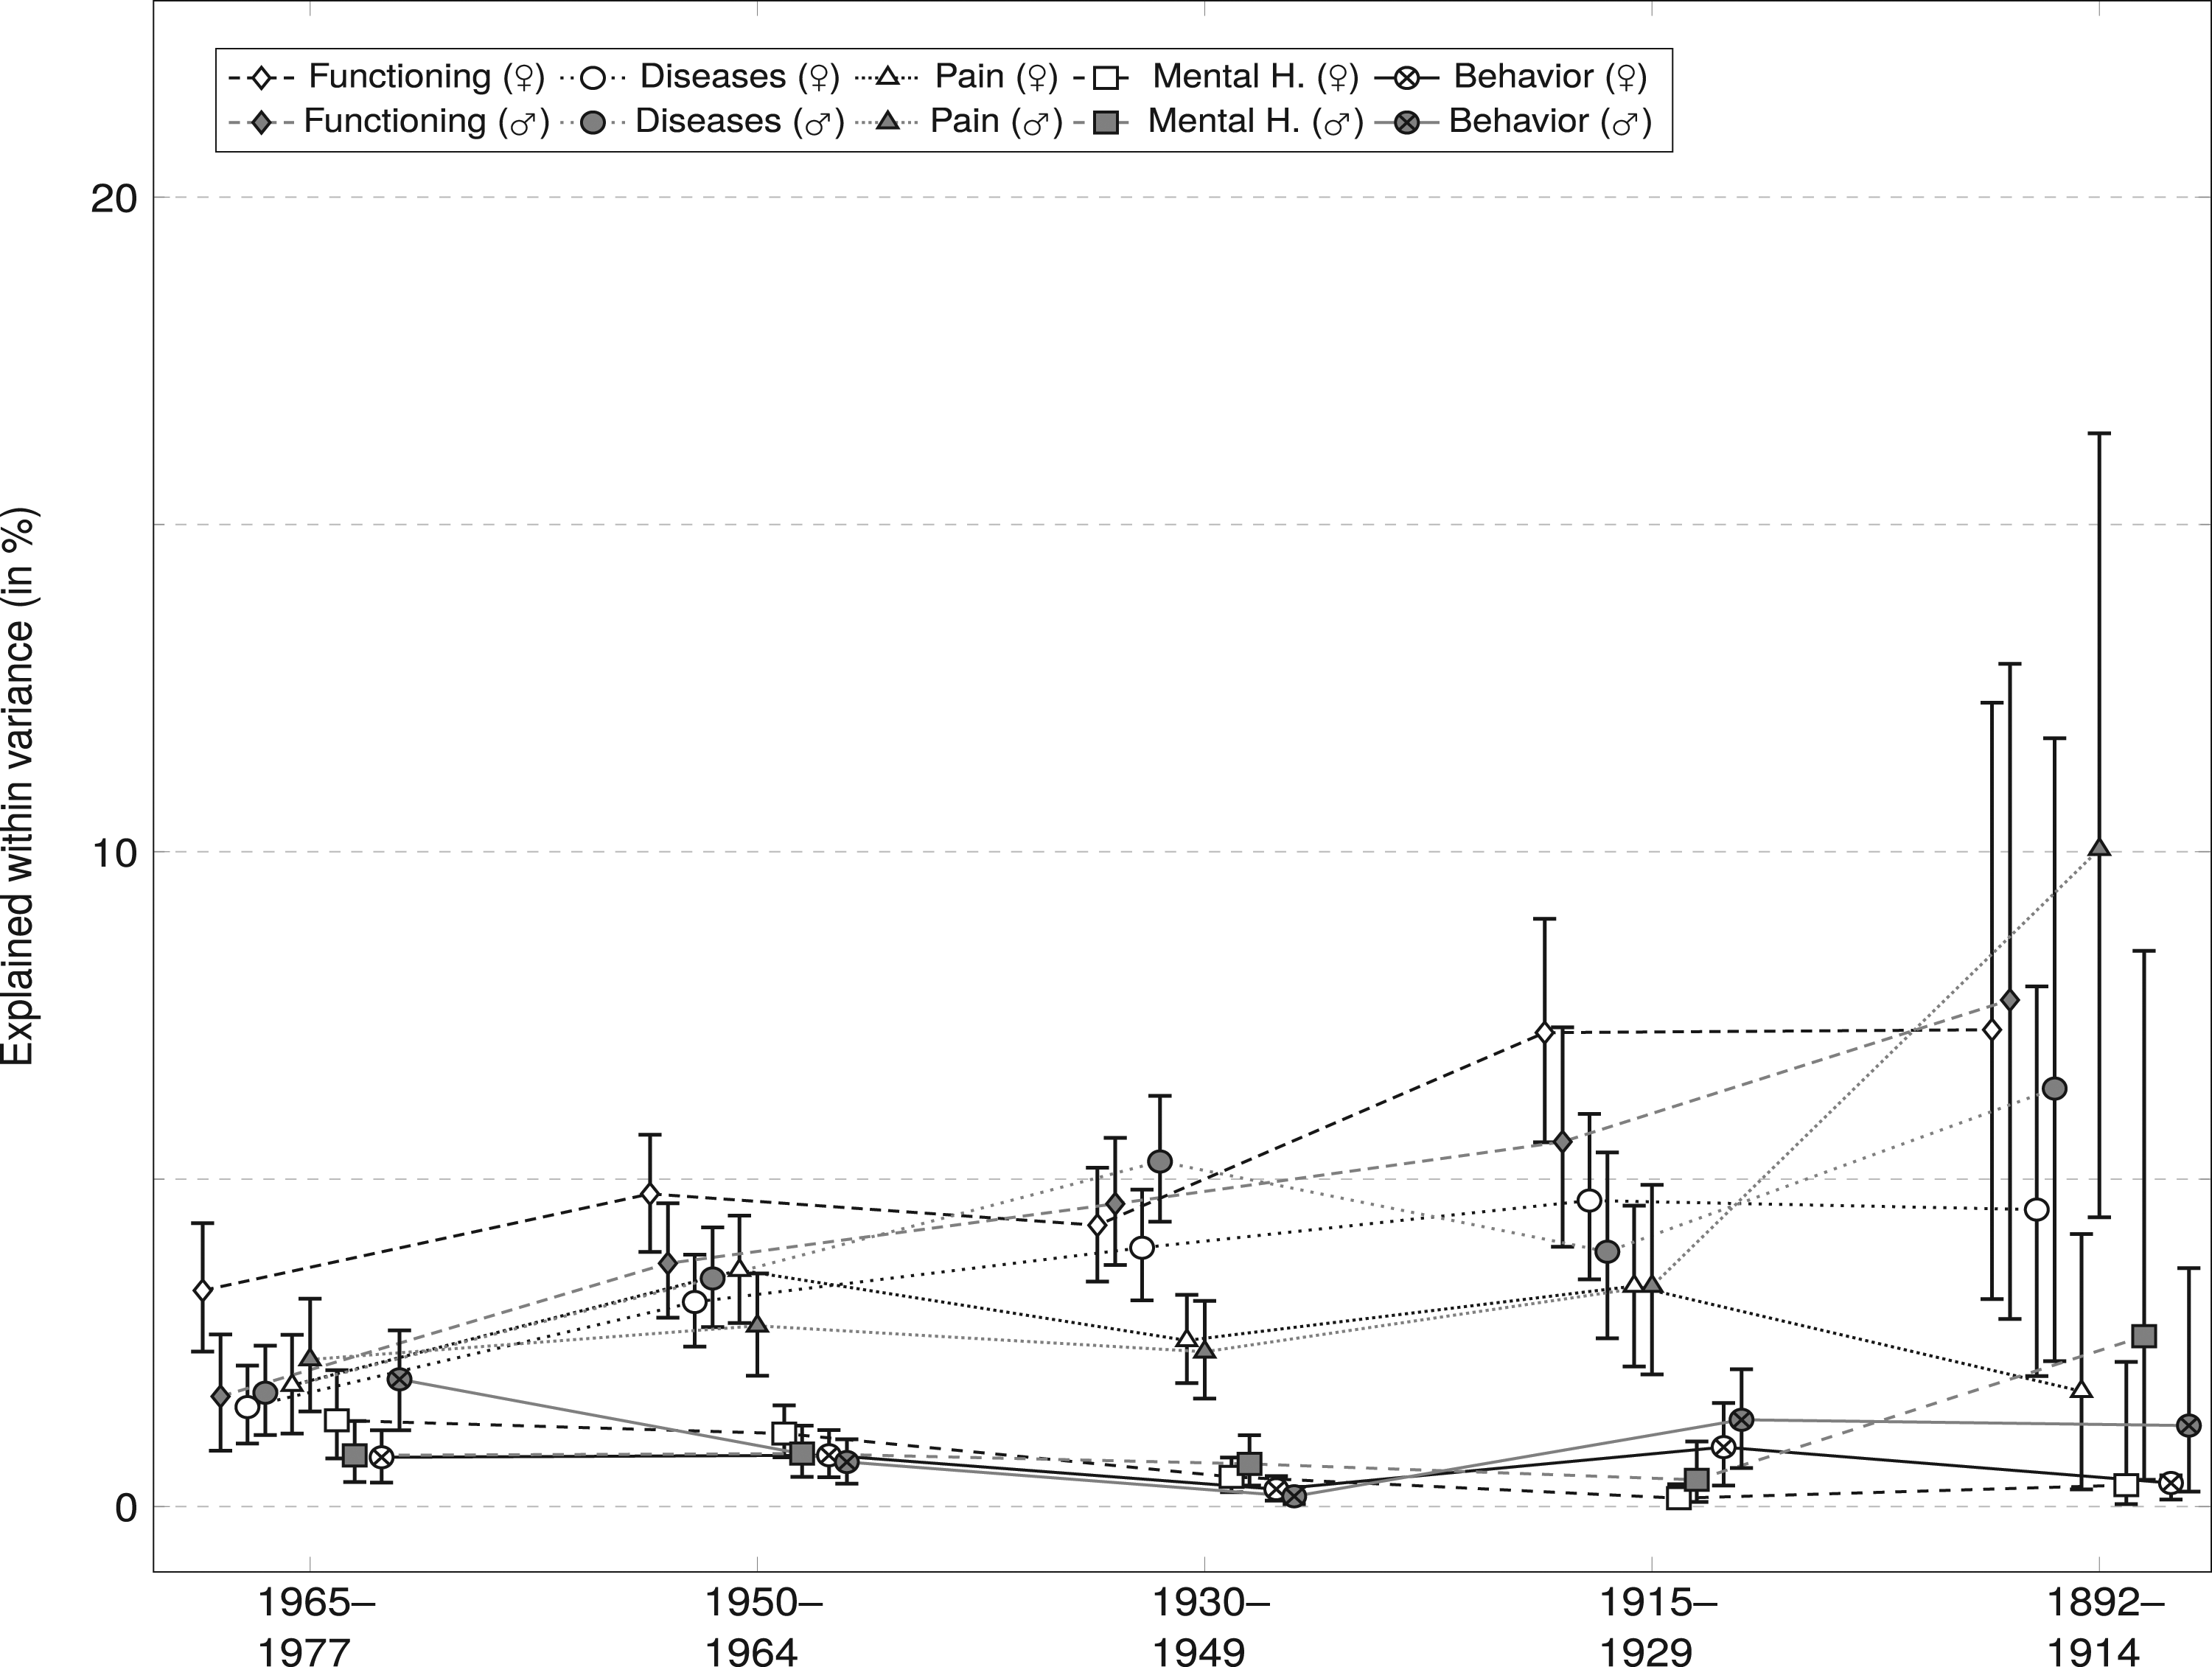
As for age differences, as can be seen in this figure, results are generally in line with the results of the cross-sectional analyses in the sense that there are no clear differences between the health dimensions’ contribution to
Adj. R2 and n for Models by Gender and Birth Cohort.
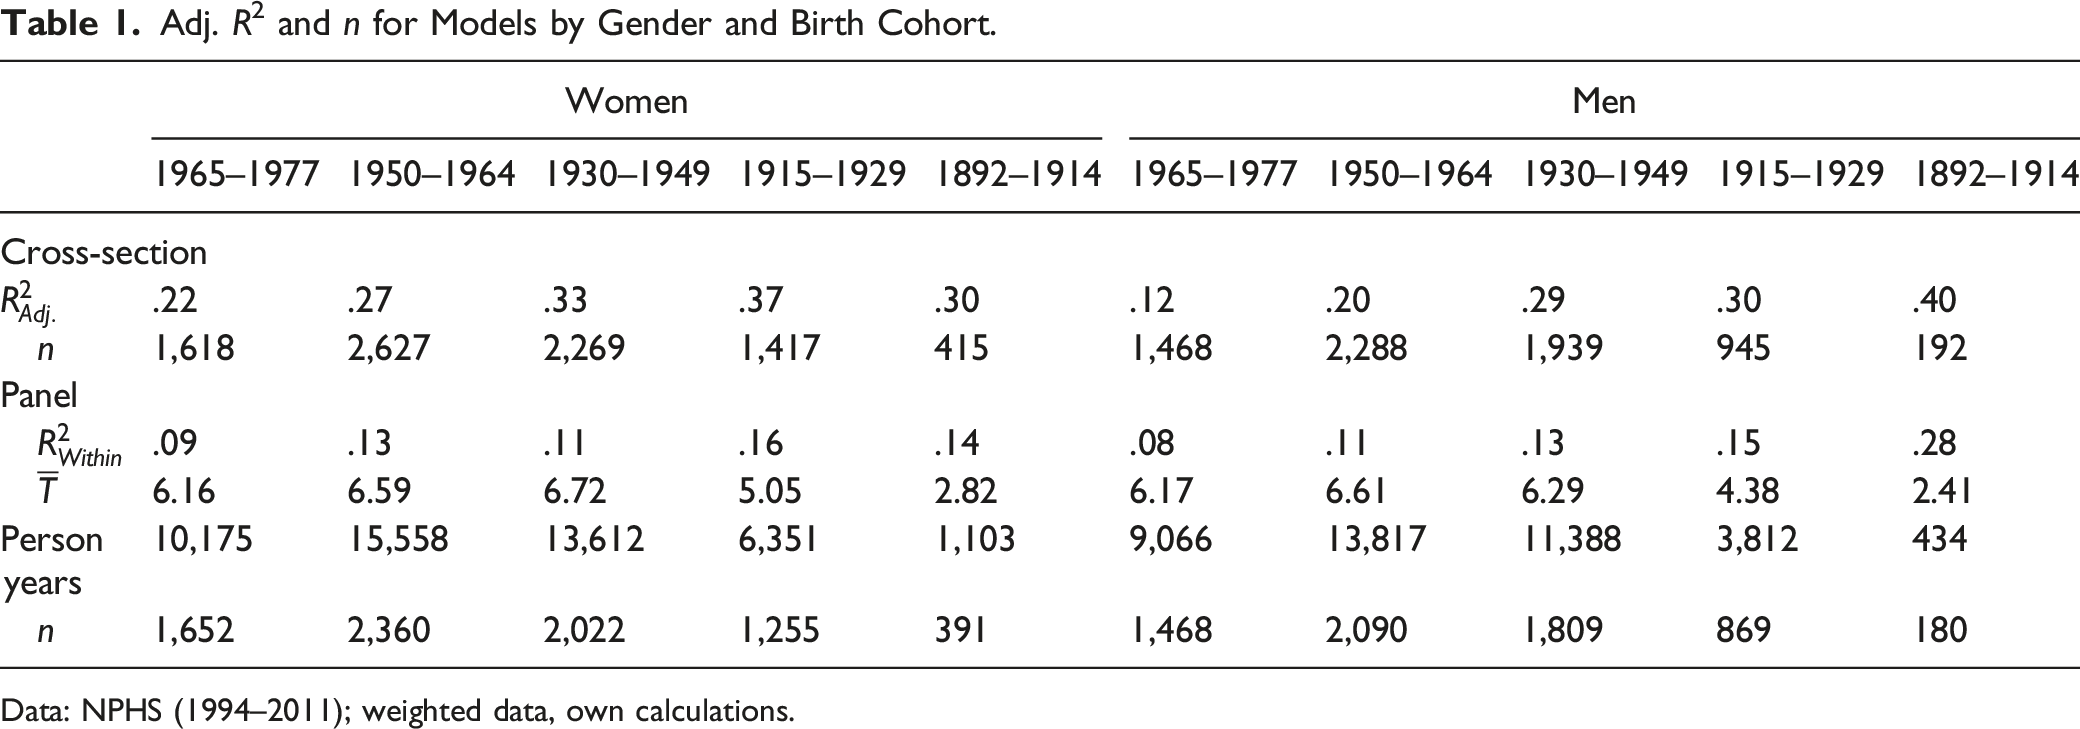
Data: NPHS (1994–2011); weighted data, own calculations.
Discussion
Self-rated health (SRH) is the most widely used single indicator of generic health and has many applications in survey research. However, what exactly is measured and how is still rather unclear. For this reason, we undertook efforts to deepen our understanding of this indicator in this paper. The main focal point of our paper was to quantify the extent to which SRH and its changes are determined by five health dimensions, namely, functioning, diseases and chronic health conditions, pain, mental health, and health behaviors, both cross-sectionally and longitudinally. Beyond a better understanding of the determinants of (changes in) SRH, these findings also allow us to answer the question of whether SRH is sensitive towards changes in health determinants at all and whether the same health dimensions are responsible for health ratings at a moment in time and through changes. Last, carrying out our analyses separately by gender and age allows for an evaluation of potential differences between these groups.
In our cross-sectional analyses of the general population using data from the NPHS, we have generally shown that SRH is most strongly determined by functioning, chronic diseases, and pain. With around a third of the variance of SRH being explained by these available indicators alone, it can be considered a useful indicator of generic health. This mostly mirrors previous results of a cross-sectional investigation by (Lazarevič & Brandt, 2020) analyzing data from Europeans aged 50+ that were collected as part of the SHARE project. The main difference is the role of mental health, which only played a minor role in our analyses while it was of moderate relevance for SRH in the SHARE data. This might be explained by differences in the possibilities of operationalizing this health dimension between the two surveys as the NPHS collected data on major depressive episodes and SHARE used a more inclusive measure of depression risk.
Our longitudinal analyses provided a similar picture in the sense that changes in functioning, diseases, and pain were the driving force behind changes in SRH. However, it should be noted that the explained variance of these models was considerably lower than that of the cross-sectional models with
As for group comparisons, we found that women and men rated their health in a remarkably similar fashion, which mirrors results from a previous study with European data (Lazarevič & Brandt, 2020). However, there were clear age trends for both types of analyses with the major determinants of SRH, specifically, functioning, diseases, and pain, increasing in relevance almost linearly with age groups. This might also explain why changes in these dimensions of health are relevant for changes in SRH: as the related health characteristics typically deteriorate with age (McCullough & Laurenceau, 2004), they might become increasingly relevant in evaluating one’s health. In that sense, SRH is primarily determined by health challenges people face at different stages in their life. This, however, also means that the foundation of SRH can remarkably differ between different age groups. While it appears that younger people have a more inclusive basis for their health ratings, older respondents of these cohorts exhibit a narrower view of health that is more focused on the health domains mentioned above. This finding might be explained by cohort differences in incorporating mental health into one’s rating or even considering mental health as a concept relevant to “health.” For example, younger generations might be more accepting of considering the relevance of mental health or attaching less stigma to it (Morano & DeForge, 2004). However, it is also possible that older adults who more frequently experience manifest physical health problems are more likely to base their judgments on these aspects, similar to the availability heuristic described by (Tversky & Kahneman, 1973).
Further, and unsurprisingly considering these age trends, for both types of models explained variances were considerably higher for older respondents. This points to a general problem in standardized health research that can be considered deficit-oriented. Almost all questions that are typically used in health surveys concern health problems, meaning that “good health” can only be measured by the absence of these problems. In the interest of a better health measurement for younger respondents, new instruments that measure “good health” would be desirable.
The lack of explanatory power of the available health indicators for younger respondents can also be considered a major limitation of this paper. Generally, our models were limited to the available indicators in the NPHS. Thus, while we are able to conclude from these analyses that younger respondents are less likely than older respondents to base their SRH ratings on functioning, diseases, and pain, we are however unable to point to the potential alternative sources for their health ratings. To balance out this focus on older age health in contemporary health surveys, further research into finding health characteristics explaining this group’s health perceptions seems to be warranted. Suitable instruments emerging from this research would certainly aid studying the development and prevention of health problems in a younger age.
Last, it is worth pointing out that data collection for the NPHS ended in 2011 and the results from our analyses cannot be generalized beyond the cohorts and time frame of the available data. Hence, a replication of these analyses with newer data and other cohorts might be desirable in order to evaluate whether the results presented in this paper are persistent in current cohorts and to shed light on the question whether this paper’s findings are due to age or cohort effects. The Canadian Longitudinal Study of Aging (CLSA), for instance, might be a valuable resource for this endeavor when sufficient waves are available.
Supplemental Material
Supplemental Material - Rating Health and Rating Change: How Canadians Rate Their Health and Its Changes
Supplemental Material for Rating Health and Rating Change: How Canadians Rate Their Health and Its Changes by Patrick Lazarevič and Amélie Quesnel-Vallée in Journal of Aging and Health
Footnotes
Acknowledgments
The analysis presented in this paper was conducted at the Quebec Interuniversity Centre for Social Statistics which is part of the Canadian Research Data Centre Network (CRDCN). The services and activities provided by the QICSS are made possible by the financial or in-kind support of the Social Sciences and Humanities Research Council (SSHRC), the Canadian Institutes of Health Research (CIHR), the Canada Foundation for Innovation (CFI), Statistics Canada, the Fonds de recherche du Québec and the Quebec universities. The views expressed in this paper are those of the authors, and not necessarily those of the CRDCN, the QICSS or their partners.
Declaration of Conflicting Interests
The author(s) declared no potential conflicts of interest with respect to the research, authorship, and/or publication of this article.
Funding
The author(s) disclosed receipt of the following financial support for the research, authorship, and/or publication of this article: This work was supported by the European Research Council (ERC) under the European Union’s Horizon 2020 research and innovation programme (grant agreement No. 725187). Amélie Quesnel-Vallée holds the Canada Research Chair in Policies and Health Inequalities.
Supplemental Material
Supplemental material for this article is available online.
References
Supplementary Material
Please find the following supplemental material available below.
For Open Access articles published under a Creative Commons License, all supplemental material carries the same license as the article it is associated with.
For non-Open Access articles published, all supplemental material carries a non-exclusive license, and permission requests for re-use of supplemental material or any part of supplemental material shall be sent directly to the copyright owner as specified in the copyright notice associated with the article.