
Abstract
Objectives
Limited evidence exists regarding the reasons for secular changes in cognitive functioning over historical time. Thus, we examined potential explanatory factors for changes in cognitive speed, a central dimension of cognitive functioning.
Methods
Population-based data of middle-aged and older adults from Germany (N = 5443) was used with baseline participants from 2002 to 2014, comparing the time periods 2002–2014.
Results
Cognitive speed improved in middle-aged adults (40–65) and older adults (66+). In both age groups, increases were partly explained by education, employment status, volunteering status, routine activities, and physical functioning. Changes in education were more important in explaining increases in older than in middle-aged adults, whereas changes in health were more important for explaining increases in middle-aged adults.
Conclusions
Cognitive speed increased in both age groups over historical time. Education, employment, volunteering, routine activities, and health were all important in explaining these changes, but their importance differed between age groups.
Cognitive functioning—a person’s mental abilities—represents an important aspect of overall health and is one of the many health-related aspects declining with increasing adult age. In population-based studies, cognitive functioning has been associated with well-being, limitations in daily functioning, overall morbidity, and mortality risk (Langa et al., 2008). Cognitive functioning itself, on the other hand, has been found to be determined by a multitude of factors: Early education, occupation, health status, and later-life regular activities like visiting friends have been found to be associated with cognitive functioning (Grasshoff et al., 2021; Kelly et al., 2017; Llewellyn et al., 2008; Menec, 2003; Walsemann & Ailshire, 2020). Hence, cognitive functioning represents a key prerequisite of human health and it is vital for successful aging.
Several studies have analyzed inter-individual trends or changes in cognitive functioning over time, whether cognitive functioning has improved, remained stable, or declined over time in the general population (e.g., Henchoz et al., 2020; Hessel et al., 2018; Weuve et al., 2018). In analyses like these, one is interested in the between-person changes in cognitive functioning over historical time in the general population, as opposed to the within-person changes in cognitive functioning across age. If levels of cognitive functioning have increased and will continue to increase, future older adults may be able to maintain their overall health and daily functioning for a longer time—a scenario which has been described as a compression of morbidity (Fries, 1980; Fries et al., 2011; Langa et al., 2008). Contrarily, if cognitive functioning is decreasing in the face of increasing life expectancy, overall health and daily functioning of future cohorts of older adults might decrease—a scenario that was described as expansion of morbidity (Gruenberg, 1977; Kramer, 1980). Evidence for increasing levels of cognitive functioning has been reported in the literature, with few exceptions (Hale et al., 2020; Trahan et al., 2014).
However, to date, only some studies have empirically examined potential reasons for these historical trends in cognitive functioning. Studies that have analyzed potential explanations, were mostly focused on the role of school education. Weuve and colleagues found that improvements in cognitive functioning were accompanied largely by increasing educational levels in later cohorts (Weuve et al., 2018). The authors assumed that increasing levels of education might have led to higher levels of cognitive functioning. In another study, it was investigated whether trends in cognitive functioning might be explained by health status in addition to early education (Hessel et al., 2018). It was found that both partially explained increases in cognitive functioning over time. However, to our knowledge, no studies to date have examined how the overall life situation of older adults—including their education, health status, occupational status, and regular activities—might explain trends in cognitive functioning in a multivariate design. This will be examined in the current investigation: We analyze how cognitive speed has changed over historical time in the general population by comparing two population-based samples from different time point, and potentially important explanatory factors of these historical changes in cognitive speed between samples are examined. We ask: How can secular trends in middle-aged and older adults’ cognitive speed, a central dimension of cognitive functioning, be explained?
Methods
Sample
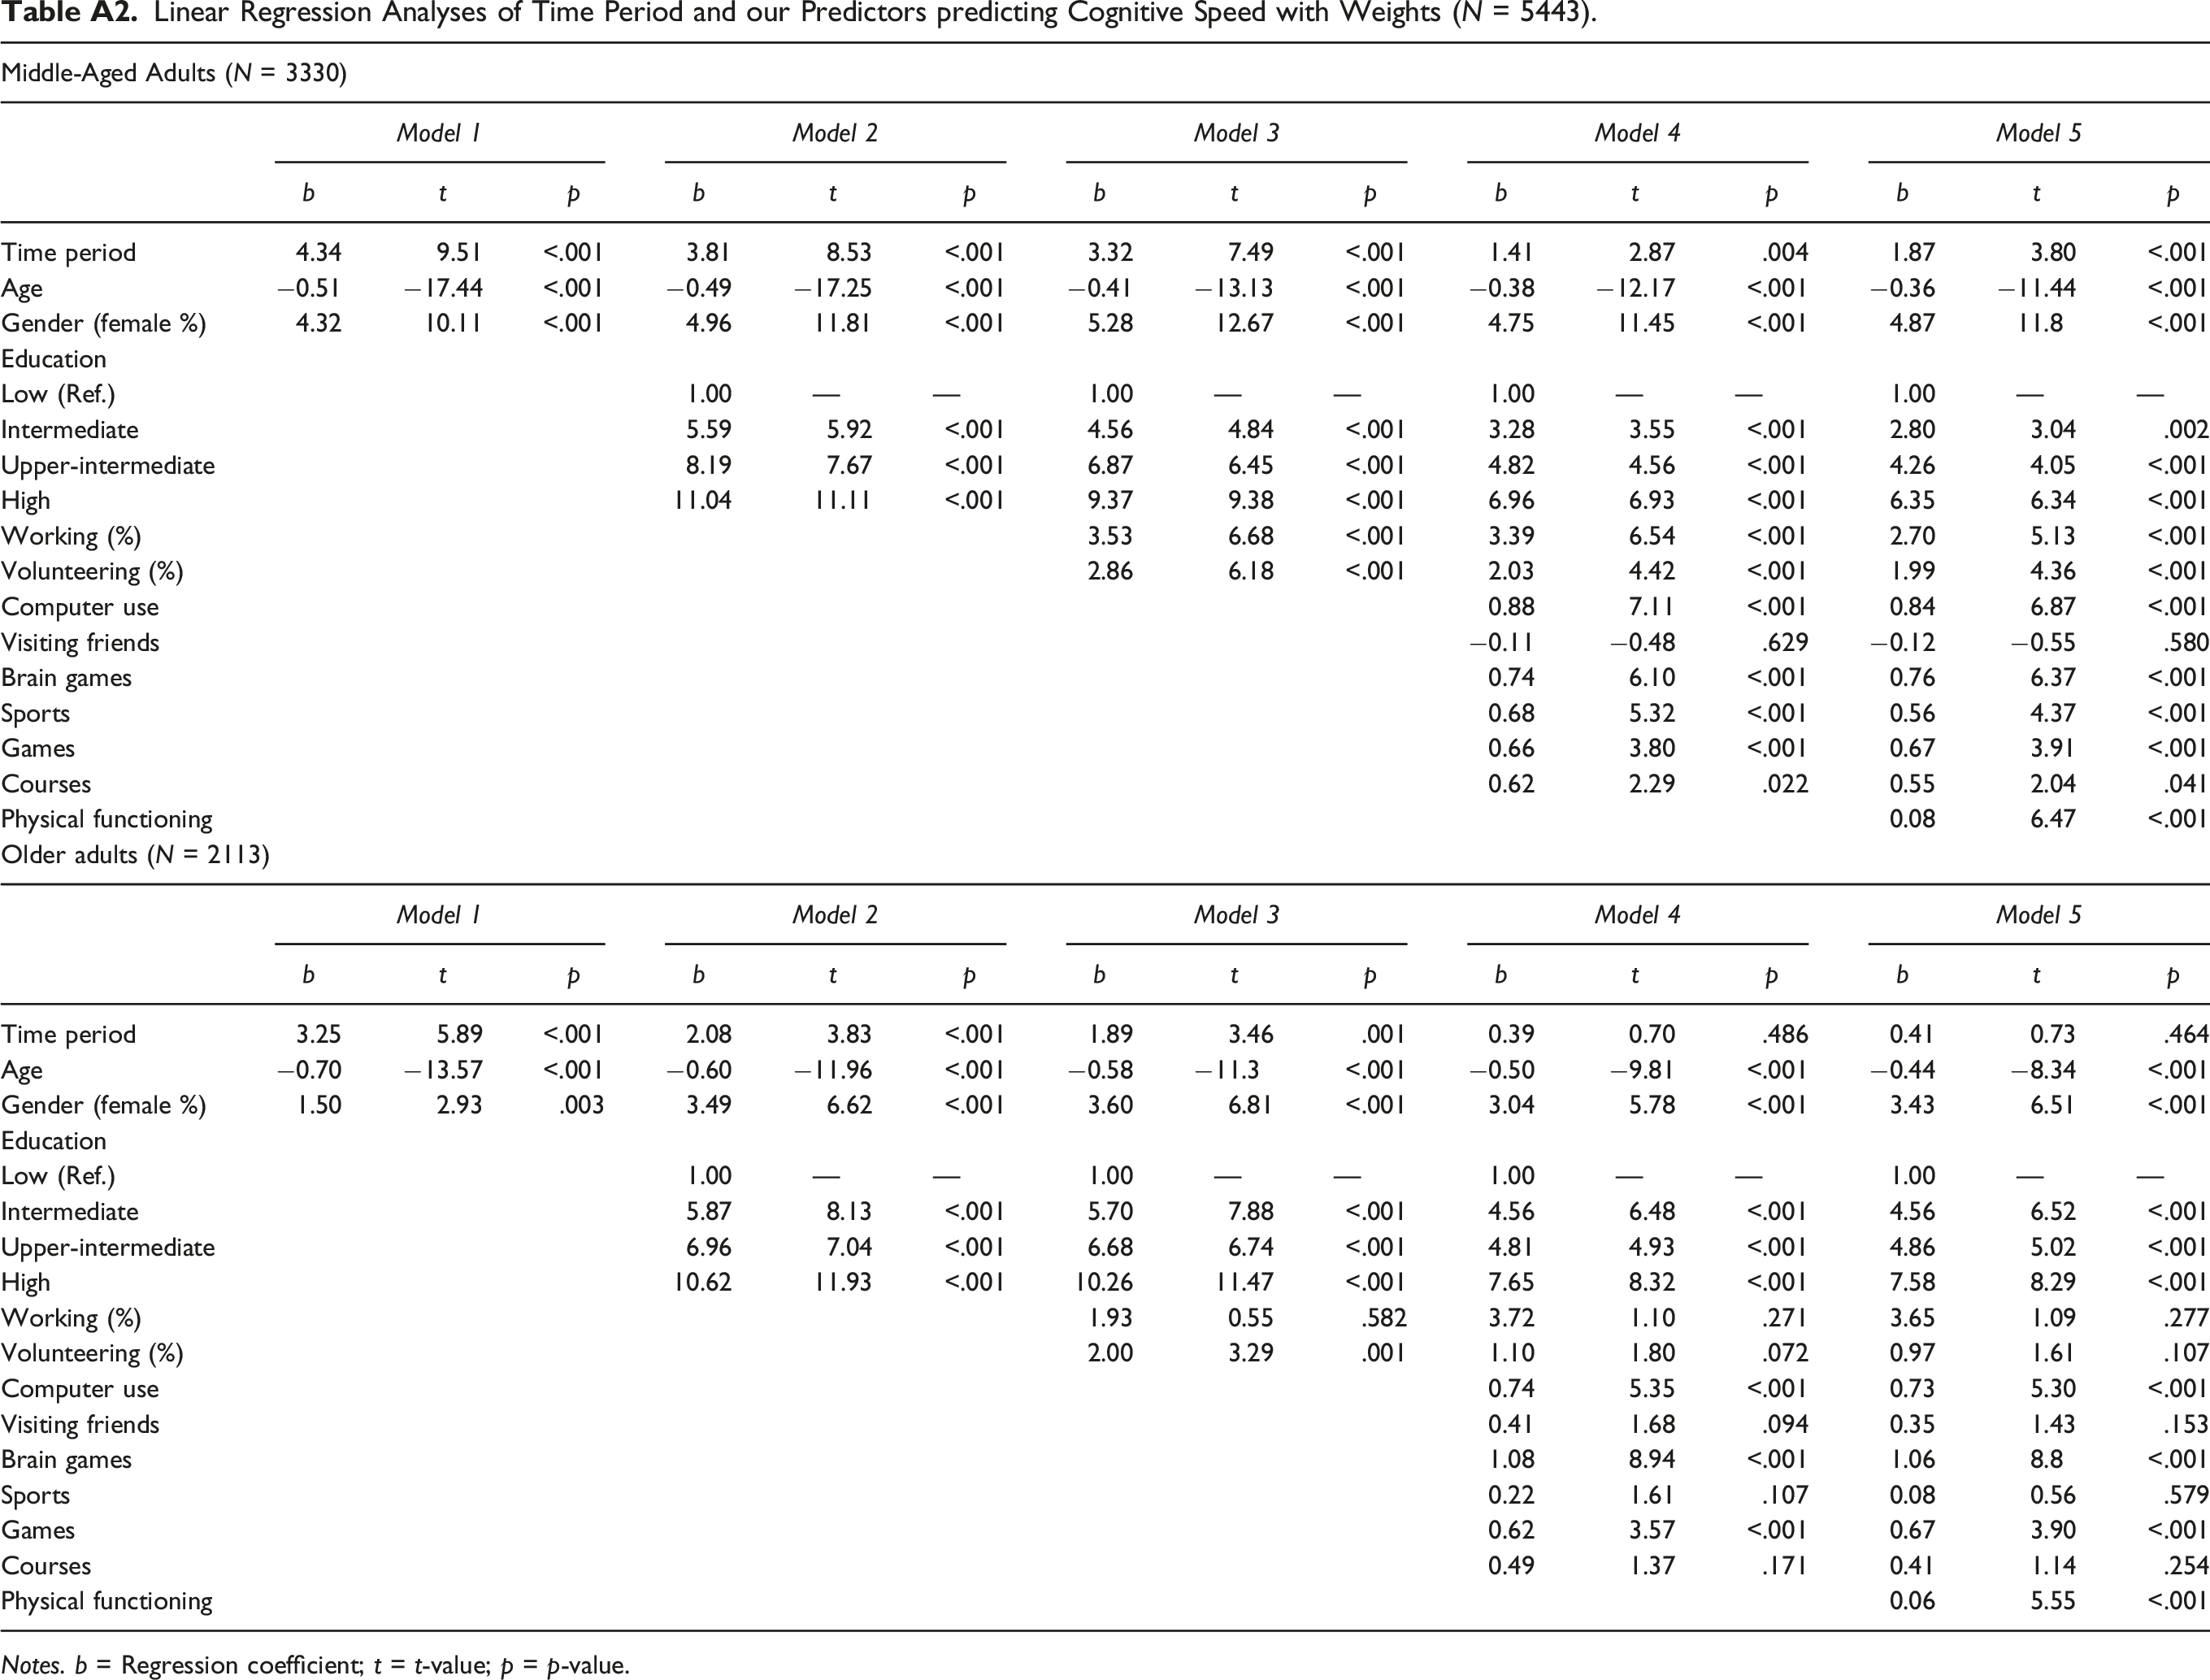
We used baseline data from the public release of the 2002 and the 2014 wave of the German Aging Survey (Deutscher Alterssurvey; DEAS), a cohort-sequential longitudinal, population-based study on Germans aged 40 years and older, provided by the Research Data Center of the German Center of Gerontology (Klaus et al., 2017; Mahne et al., 2020; Motel-Klingebiel et al., 2016). For the German Aging Survey, participants were drawn randomly by probability sampling in 2002 and 2014 and interviewed face-to-face in their residence. We used data from all baseline participants in 2002 and all baseline participants in 2014 who filled out a drop-off questionnaire, resulting in a sample size of N = 7136. After deleting missing values (about 24%) listwise, a final sample size of N = 5443 resulted (N2002 = 1874; N2014 = 3569). The degree to which cognitive speed has changed over time in the general population can be estimated by comparing the average cognitive speed between these two population-based samples, as the difference in cognitive speed between those two samples corresponds to the changes in cognitive speed over historical time. The sample was split according to age in a sample of middle-aged adults (40–65 years old) and older adults (66+ years old). However, as can be seen in the Appendix Table A1, our main findings are replicated even after imputing missing values by means of the non-parametric missForest algorithm, that has been developed for imputing mixed-type data where traditional assumptions like normality cannot be ascertained (Stekhoven & Buhlmann, 2012). Additionally, as can be seen in the Appendix Table A2, our main results are also replicated when applying weights provided by the German Aging Survey, with which the sample can be adjusted to mirror the German population in certain socio-demographic characteristics (Klaus et al., 2017). All participants provided informed consent.
Measures
The German version of the Digit Symbol Substitution Test, obtained via a face-to-face interview, was used as the dependent variable. This test was derived from the Wechsler Intelligence Test. In the paper-and-pencil test, the respondents are presented with a table containing the Arabic numerals 1 to 9, each of which is assigned a simple geometric character. Participants then have 90 seconds to insert the appropriate character on a sheet of paper with rows of digits one after the other. Thus, the participant must match symbols to numbers using a reference at the top of the page. Theoretically the scores can range from 0 (no symbol is matched correctly to the Arabic numerals) to 93, the maximum number of provided Arabic numerals (all symbols are matched correctly to the Arabic numerals). However, it is generally not possible to match all characters correctly, since the Digit Symbol Substitution Test is a speed test, and the average correctly matched characters are thus typically much lower. The total number of correctly filled in characters was used as the indicator of cognitive speed. The Digit Symbol Substitution Test is one of the most commonly used tests in neuropsychology. It has been found to cover a wide range of cognitive abilities including visual-motor coordination, attention, associative learning, and working memory (Jaeger, 2018). The test has been employed in survey research on cognitive abilities and is well validated for this use (Hoyer et al., 2004). In cognitive aging research, this well-established measure of basic cognitive processing speed has been shown to explain a large proportion of the variance in older adults’ performance in a range of higher-order cognitive functions (Salthouse, 1996). Several indicators that were assessed in the 2002 and the 2014 wave were used to measure possible explanatory variables for inter-individual trends in cognitive speed: Educational level, employment status, volunteering status (whether the person executes an honorary office in the groups or organizations in which he is a member), computer use frequency, visiting friends frequency, brain sport frequency, sports frequency, game playing frequency, taking courses frequency and physical functioning. Educational level was coded taking both school education and professional training/academic training into account, resulting in a four-level classification scheme: [1] Participants without completed vocational qualification and up to a maximum of a graduation degree, [2] participants with vocational qualifications or qualifications for university entrance, [3] participants with finished upgrading training (e.g., as a master craftsman), and [4] participants with completed university studies. Employment status was operationalized by whether participants were currently working [1] or not working [0]. Computer use frequency, visiting friends frequency, brain game frequency, physical exercise frequency, game playing frequency, and taking courses frequency were operationalized by inquiring about the frequency with which one has done these respective activities within the last year ([1] = “never,” [2] = “less than monthly,” [3] = “1 to 3 times a monthly,” [4] = “weekly,” [5] = “multiple times per week,” [6] = “daily”). Physical functioning was measured with the subscale Physical Functioning of the German version of the Short Form 36 Health Survey (Bullinger, 1995), with scores raging theoretically from 100 (best physical functioning) to 0 (worst physical functioning). Additional covariates included time period ([0] = “2002” vs. [1] = “2014”), age (in years) and gender ([0] = “male” vs. [1] = “female”).
Data Analysis
Mean comparisons and Spearman correlation analyses were calculated to provide basic descriptive statistics of inter-individual changes between the 2002 and 2014 samples. Additionally, multiple linear regression analyses were used to examine the degree to which cognitive speed changed over time in middle-aged and older adults inter-individually from 2002 to 2014 and whether these changes could be explained by our predictor variables. For this purpose, five models with increasing complexity were calculated based on theoretical considerations: The first model only included time period, age, and gender. The second model also included education to examine how the effect attributable to the time period changes once differences in educational status between survey waves are controlled for. The third model additionally includes employment status and volunteering status. The fourth model includes the six variables relating to frequency of routine activities: Computer Use, Visiting Friends, Brain Games, Doing Sports, Playing Games, and Taking Courses. Lastly, the fifth model also includes Physical Functioning. Changes in the effect size of the regression coefficient for time period between models indicate that the changes in cognitive speed across time might be attributed to the factors added in the respective model (MacKinnon, 2000). As such, the main predictor of interest “time period” constitutes the average difference in cognitive speed between the 2002 sample and the 2014 sample, controlled for a varying number of covariates. By comparing the size of the effect of “time period” (the average difference in cognitive speed between the 2002 sample and the 2014 sample) between different models with varying cofounders controlled for, we can estimate the degree to which these confounders explain the observed historical time period differences.
Results
Descriptive Statistics of our Variables between 2002 and 2014 in Middle-Aged and Older Adults (N = 5443).
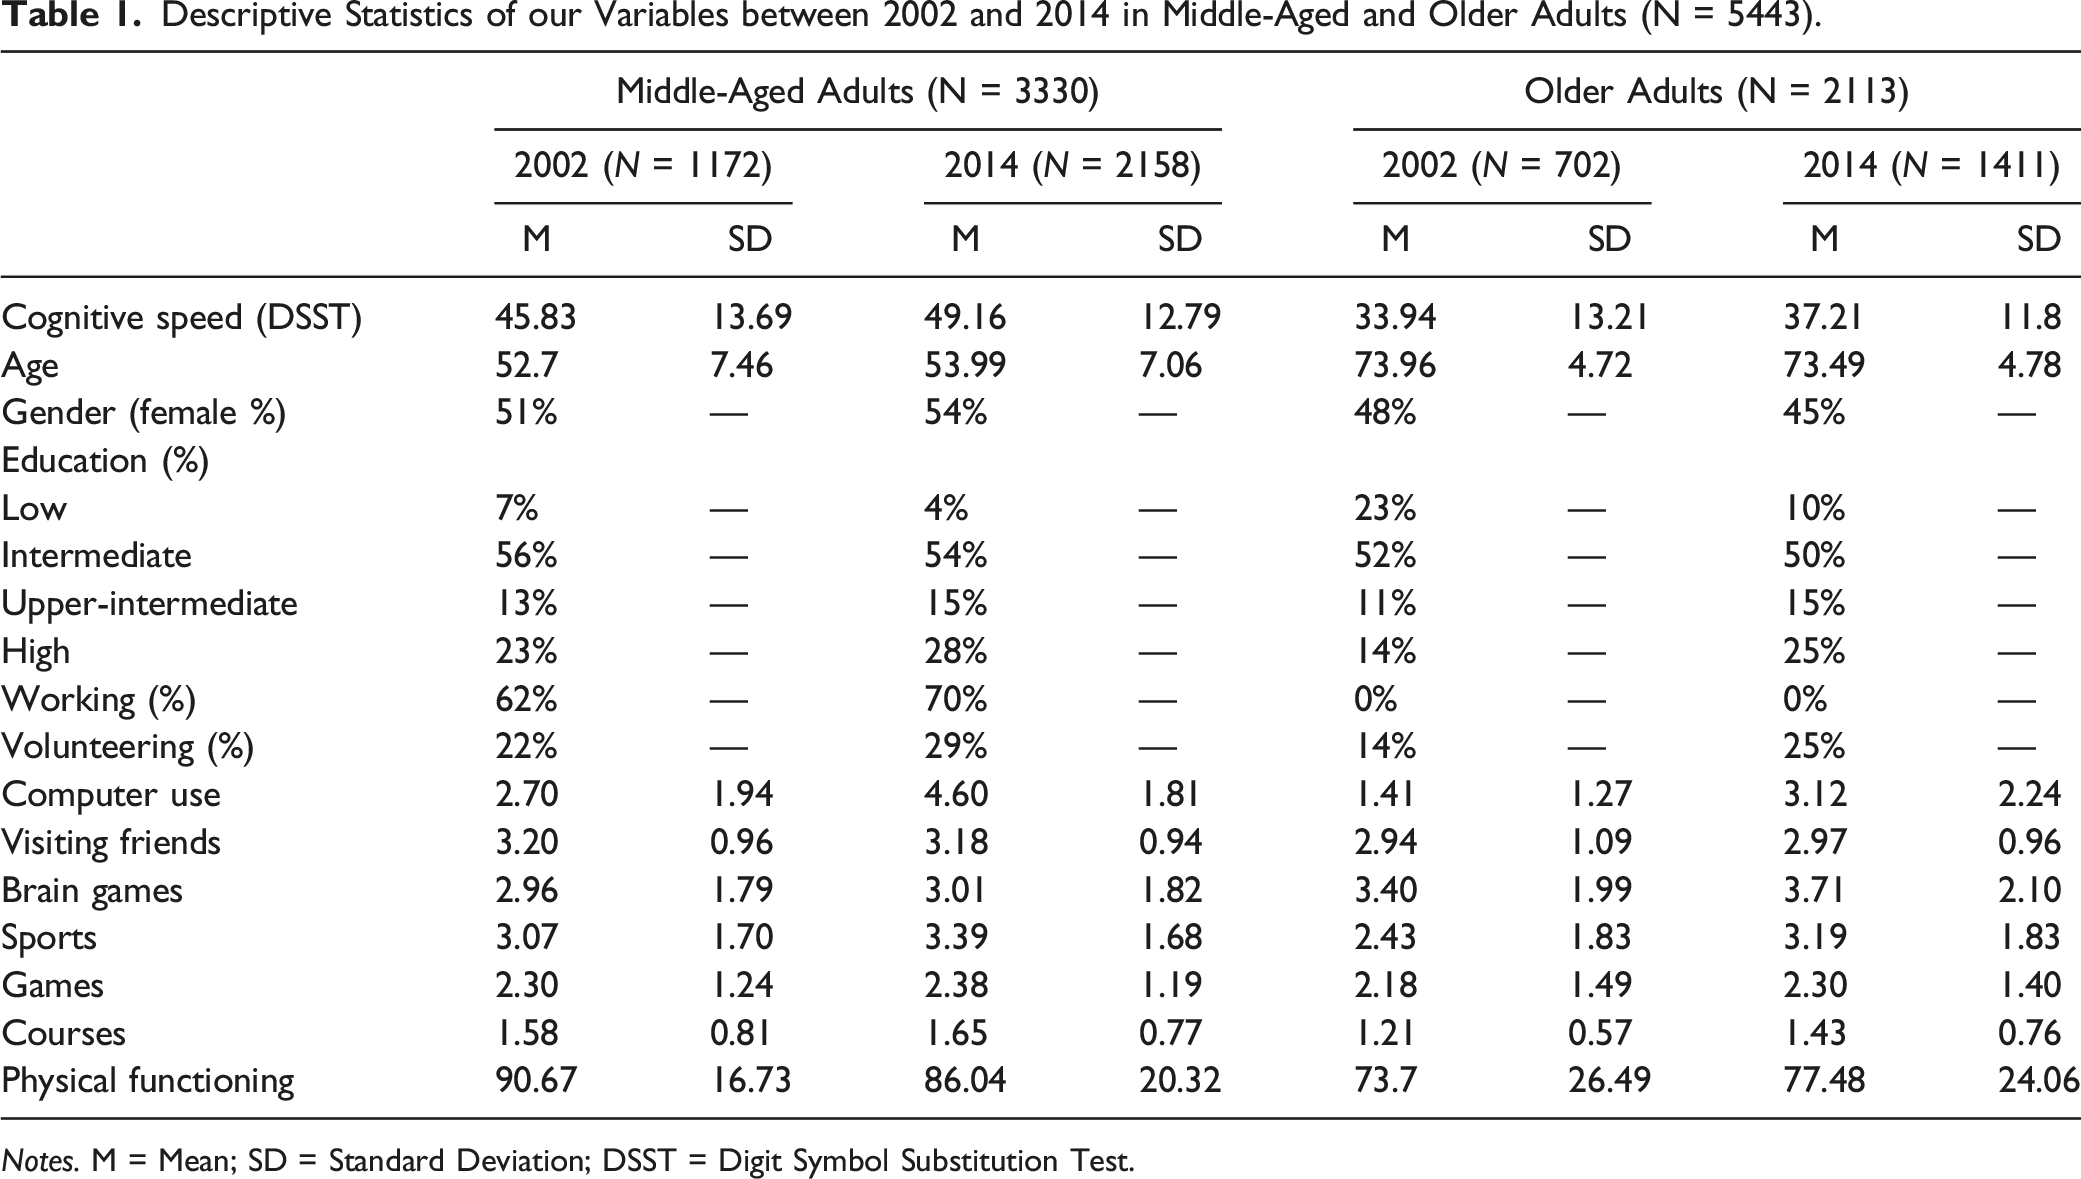
Notes. M = Mean; SD = Standard Deviation; DSST = Digit Symbol Substitution Test.
Intercorrelations (Spearman) of the Study Variables for Middle-Aged adults and Older Adults (N = 5443).
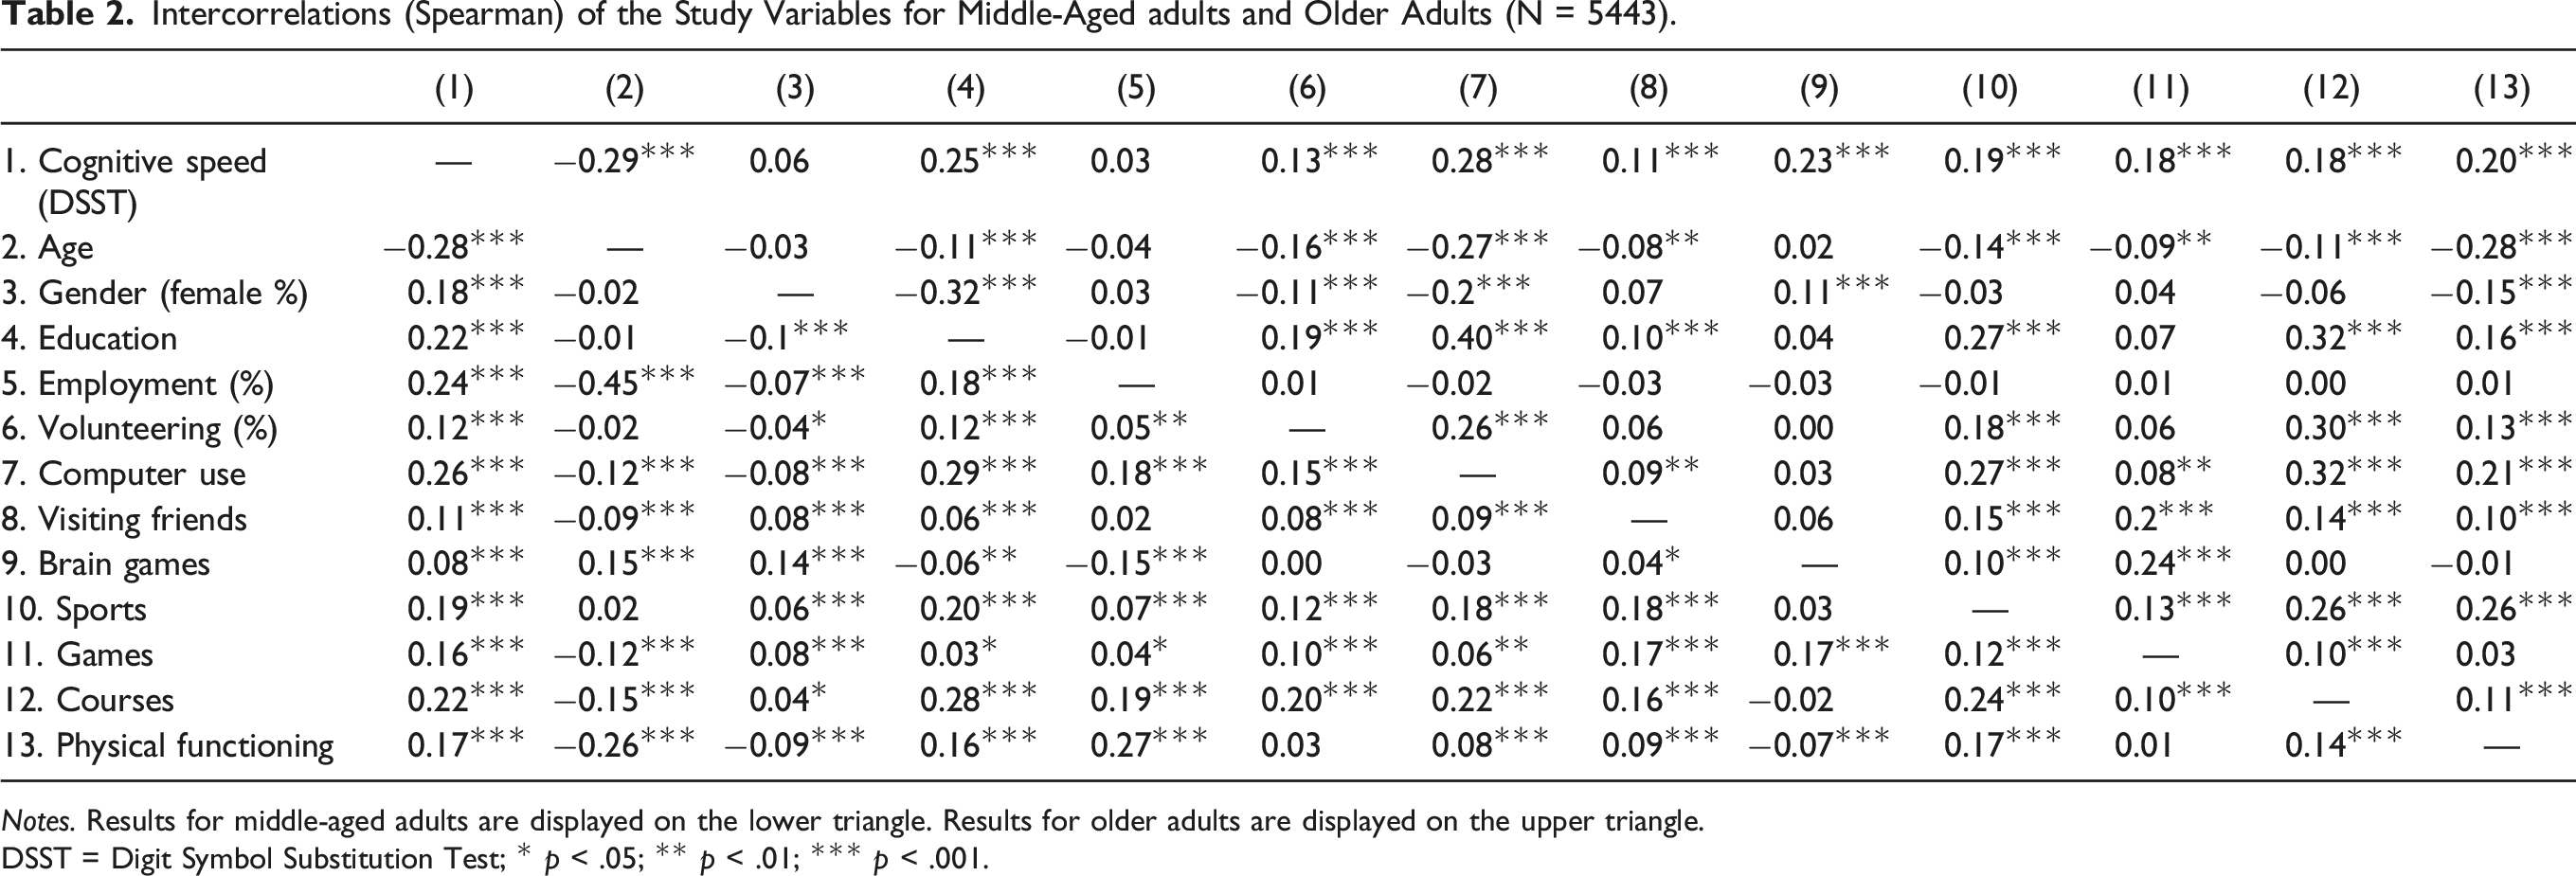
Notes. Results for middle-aged adults are displayed on the lower triangle. Results for older adults are displayed on the upper triangle.
DSST = Digit Symbol Substitution Test; * p < .05; ** p < .01; *** p < .001.
Linear Regression Analyses of Time Period and our Predictors predicting Cognitive Speed (N = 5443).
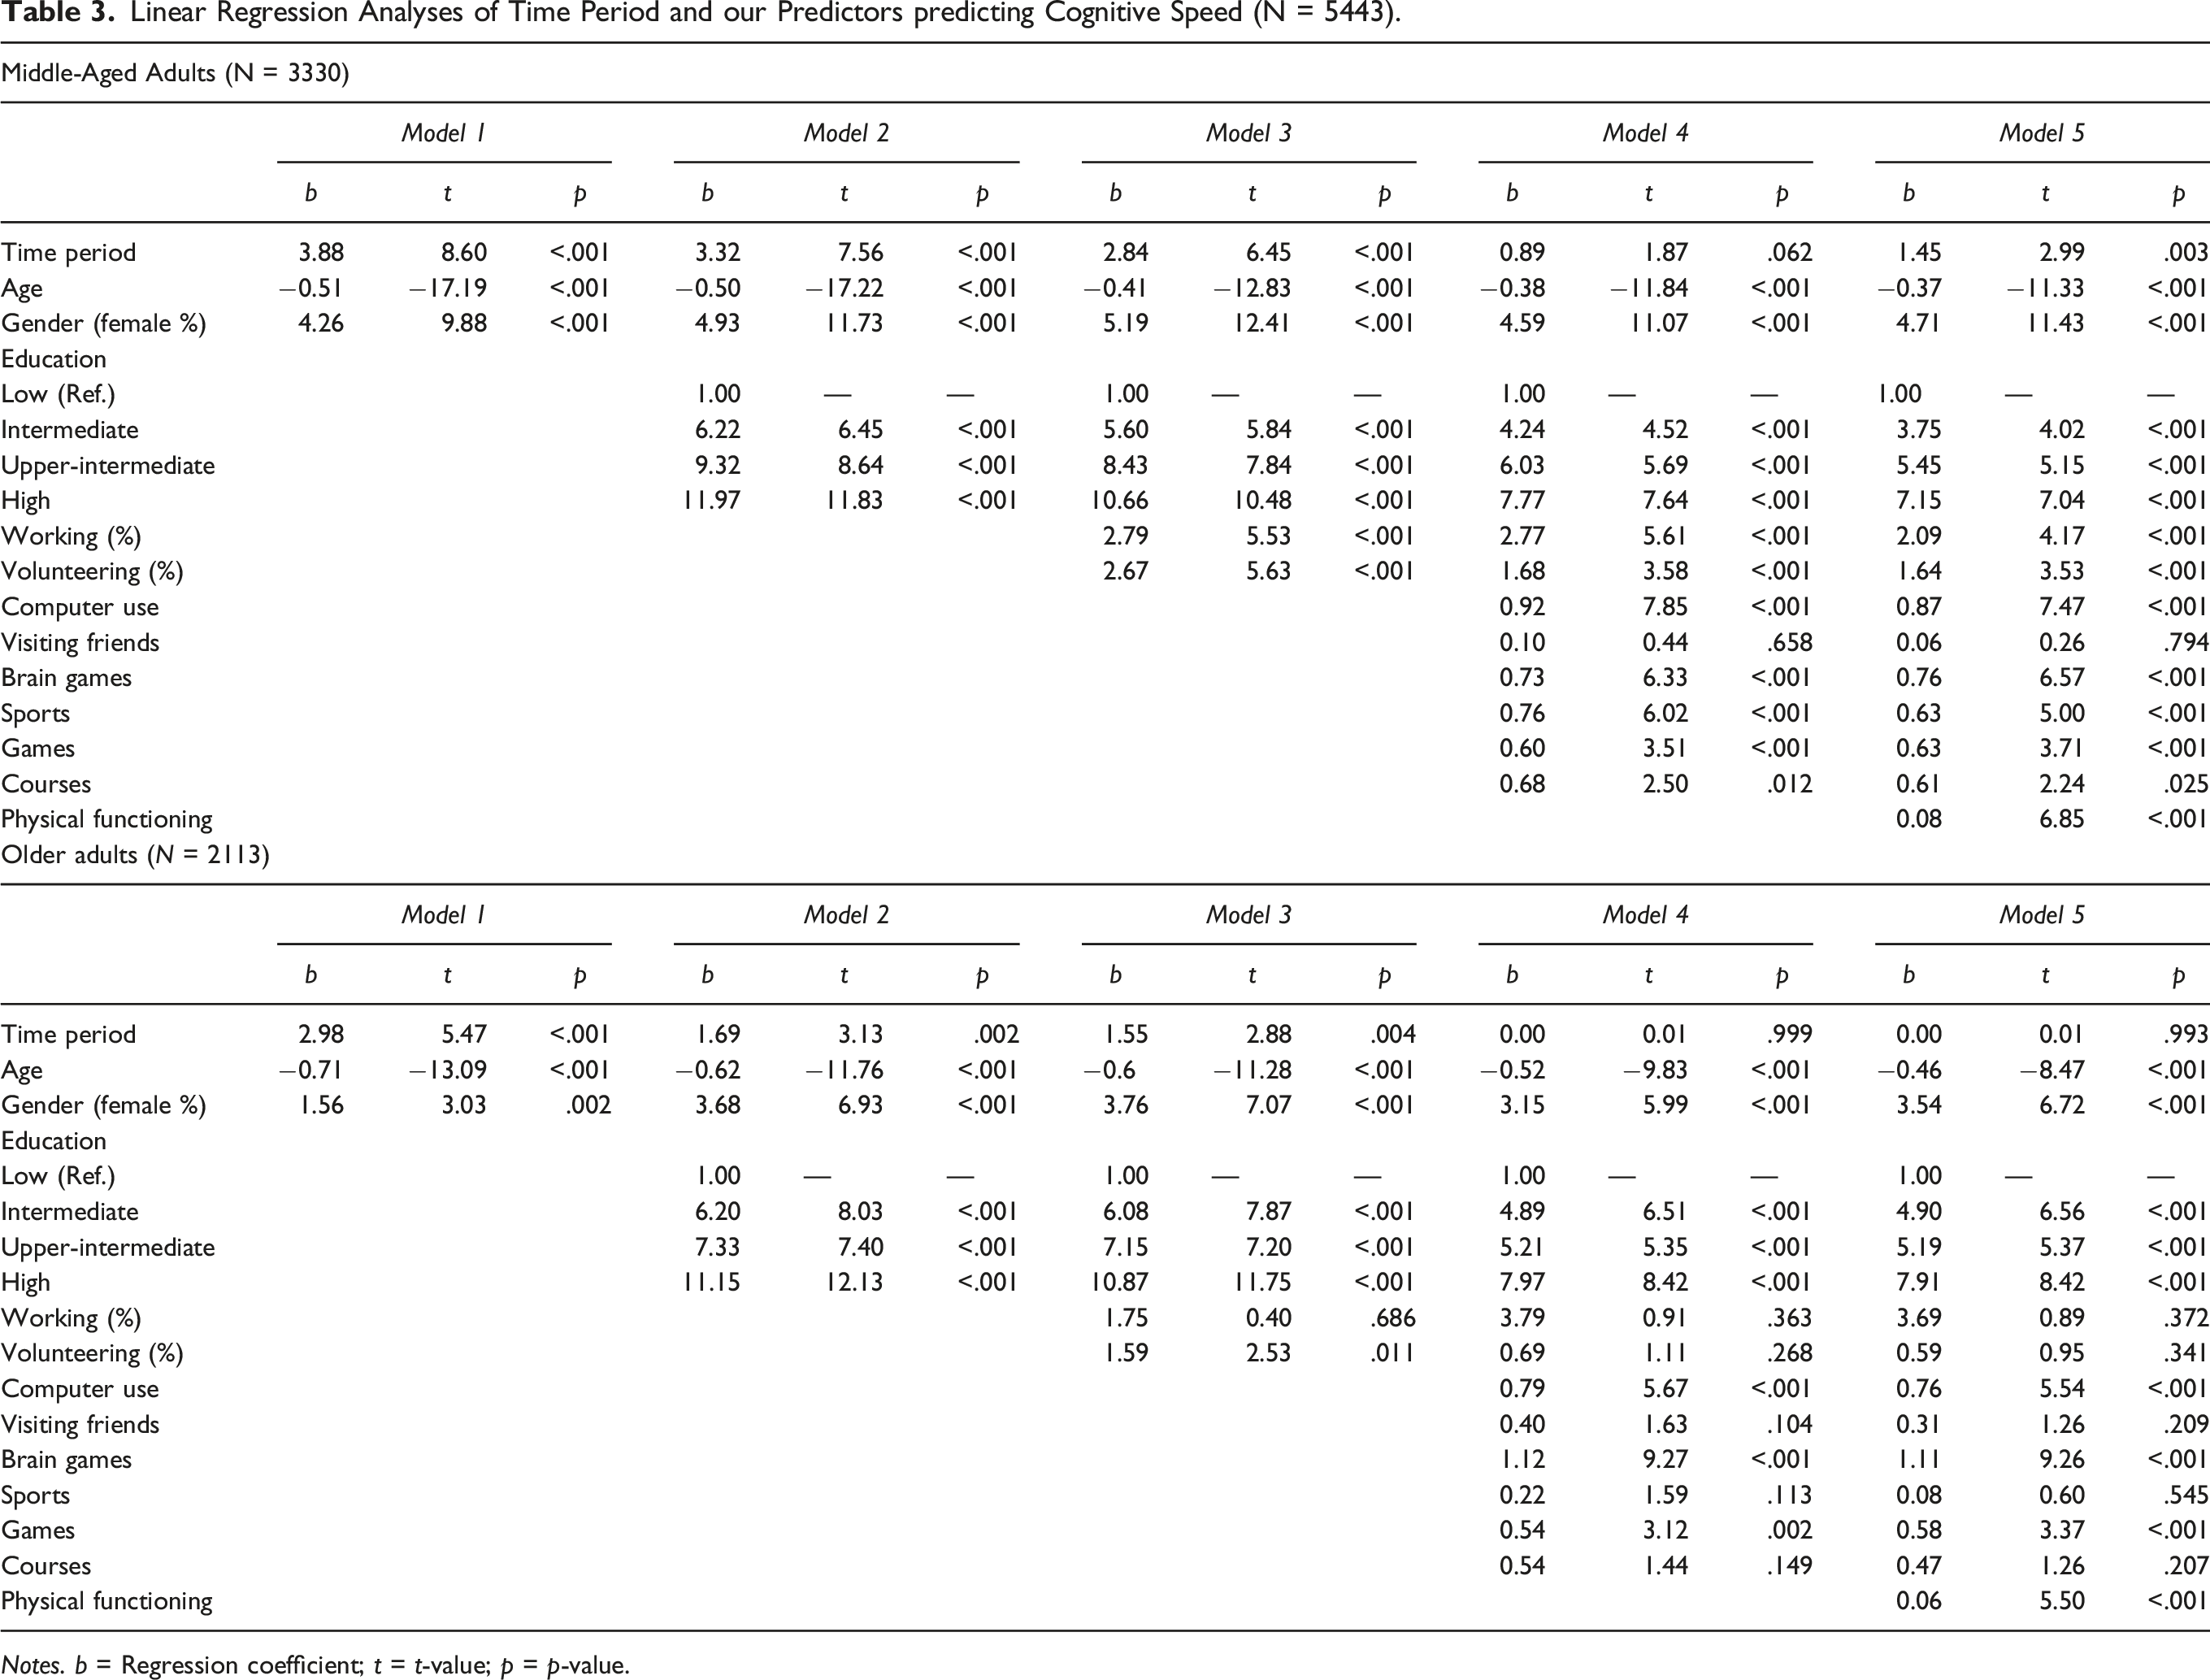
Notes. b = Regression coefficient; t = t-value; p = p-value.
Discussion
We investigated potential explanatory factors for changes in cognitive functioning among middle-aged and older adults in the general population over historical time. We found that cognitive speed, a central dimension of cognitive functioning, improved in both middle-aged and older adults over time periods, from 2002 to 2014. Relative to their base values, increases in cognitive speed were slightly larger in older adults (increased mean cognitive speed scores of about 7% in 2014 relative to 2002) than in middle-aged adults (increased mean scores of about 10% in 2014 relative to 2002). In both age groups, these trends were partially explained by education, employment/volunteering status, and routine activities. However, physical functioning seemed mostly important only in explaining time trends in middle-aged adults (14% change in predicted time period differences in cognitive speed in middle-aged adults vs. 0% in older adults when controlling for physical functioning). Additionally, changes in education seemed more important to explain changes in older adults than in middle-aged adults (14% change in predicted time period differences in middle-aged adults vs. 43% in older adults when controlling for education). Thus, cognitive speed improved in both the middle-aged and older age group over time, and todays’ middle-aged and older adults exhibit higher degrees of cognitive functioning than middle-aged and older adults a decade ago. However, the relative descriptive importance of determinants for these increases differed between both age groups (Langa et al., 2008).
These results advance upon and are in line with those of previous studies. Longitudinal studies have reported increases of cognitive functioning over time (Trahan et al., 2014), but not much evidence is available on the relative strength of effects of potential factors contributing to these improvements. Most studies only focused on educational level (e.g., Weuve et al., 2018). Going beyond these previous studies, our findings add to this knowledge by considering multiple potentially important predictors that might explain improvements of cognitive speed, including employment status, volunteering status, routine activities, and health status. Several studies had already demonstrated that these factors might protect cognitive functioning in longitudinal studies (Kelly et al., 2017; Llewellyn et al., 2008; Menec, 2003; Walsemann & Ailshire, 2020). But, to our knowledge, this is the first study that examined whether these factors might also explain trends in cognitive functioning. We found that, indeed, education, occupational/volunteering status, and routine activities explained population-based improvements in cognitive speed over time. However, in contrast to previous studies, we found that the health status, as measured by physical functioning, explained trends in cognitive speed only among the middle-aged group. Interestingly, including physical functioning increased the trend coefficient of cognitive speed in middle-aged adults. This suggests that, had physical functioning not declined in middle-aged adults, even greater increases in cognitive speed would have been expected to occur. One potential explanation for the difference in the explanatory power of health status in our as compared to other studies might be that we included physical functioning as an indicator for health status, whereas some previous studies had included other health aspects like obesity (Hessel et al., 2018). Consequently, future studies are needed that examine the contribution of several different aspects of health to trends in cognitive functioning.
The results are also relevant from a theoretical perspective. Previous studies had hypothesized that an educational expansion was mostly responsible for improvements in cognitive functioning (Reimer & Pollak, 2010). We found this to be only partly true. Adding education to our regression models did indeed explain the observed increases strongly in older adults, but only to a smaller degree in middle-aged adults. This suggests that further explanatory factors are needed, especially those focusing on changing behavioral patterns and health over time, as suggested by our results.
Additionally, the results are important from a practical perspective. Increases in cognitive functioning that could be explained by education have mostly been obtained in older cohorts. In middle-aged cohorts, the improvements in cognitive speed due to education can only be described as small. This suggests that education should not be expected to automatically lead to further increases in cognitive functioning in future younger cohorts. Instead, it seems that behavioral patterns of regular activities are much more important in explaining trends in middle-aged participants and potential future cohorts. These routine activities should thus be emphasized in future research and intervention studies. Further, it seems worrying that physical functioning has decreased over time in middle-aged adults—a finding that has also been reported in some previous studies—,pointing to a possible expansion of cognitive morbidity in the future (Beller et al., 2019, 2020, 2021; Beller & Epping, 2020; Gruenberg, 1977; Kramer, 1980). Future studies should examine the reasons for this decline in physical functioning among middle-aged adults.
Despite the novelty of our findings and the strengths of this study, a number of limitations must be acknowledged. First, the current study focused only on a single indicator of cognitive functioning, cognitive speed as measured by the Digit Symbol Substitution Test (Jaeger, 2018). Results might differ when other, more specific aspects of cognitive functioning like short- and long-term memory were to be analyzed, which should be done by future studies. However, it must also be noted that the Digit Symbol Substitution Test represents one of the most widely used and acknowledged cognitive tests and it has been shown to correlate strongly with a broad range of higher cognitive functions (Salthouse, 1996). Second, this study only analyzed data from middle-aged and older adults of one country, Germany. Although findings regarding changes in cognitive functioning have generally been consistent across countries, some differences also emerged in previous studies. Thus, our analyses should be replicated in other countries. In a similar vein, other complementary methodological approaches like the analysis of trajectories in cognitive functioning across cohorts could be used. Third, although the German Aging Survey has been widely used by scientists as a data source to study how people age in Germany, we cannot rule out that selectivities in the sample might have led to biased trends, such as an underestimation of the effect of education on changes in cognitive speed (Klaus et al., 2017). Fourth, our explanatory factors focused on variables related to socio-demography and routine activities. Future studies should include further predictors that have been linked to cognitive performance, such as loneliness, sleep patterns, nutrition, and working activities (Andel et al., 2015; Beller & Wagner, 2018; Gehlich et al., 2019a, 2019b; Virta et al., 2013). Last, our statistical analyses are only based on observational regression methods, and thus causality cannot be ascertained. To attenuate this problem, more evidence regarding the explanations of health trends is needed.
Footnotes
Appendix
Linear Regression Analyses of Time Period and our Predictors predicting Cognitive Speed with Weights (N = 5443).
| Middle-Aged Adults (N = 3330) | |||||||||||||||
| Model 1 | Model 2 | Model 3 | Model 4 | Model 5 | |||||||||||
| b | t | p | b | t | p | b | t | p | b | t | p | b | t | p | |
| Time period | 4.34 | 9.51 | <.001 | 3.81 | 8.53 | <.001 | 3.32 | 7.49 | <.001 | 1.41 | 2.87 | .004 | 1.87 | 3.80 | <.001 |
| Age | −0.51 | −17.44 | <.001 | −0.49 | −17.25 | <.001 | −0.41 | −13.13 | <.001 | −0.38 | −12.17 | <.001 | −0.36 | −11.44 | <.001 |
| Gender (female %) | 4.32 | 10.11 | <.001 | 4.96 | 11.81 | <.001 | 5.28 | 12.67 | <.001 | 4.75 | 11.45 | <.001 | 4.87 | 11.8 | <.001 |
| Education | |||||||||||||||
| Low (Ref.) | 1.00 | — | — | 1.00 | — | — | 1.00 | — | — | 1.00 | — | — | |||
| Intermediate | 5.59 | 5.92 | <.001 | 4.56 | 4.84 | <.001 | 3.28 | 3.55 | <.001 | 2.80 | 3.04 | .002 | |||
| Upper-intermediate | 8.19 | 7.67 | <.001 | 6.87 | 6.45 | <.001 | 4.82 | 4.56 | <.001 | 4.26 | 4.05 | <.001 | |||
| High | 11.04 | 11.11 | <.001 | 9.37 | 9.38 | <.001 | 6.96 | 6.93 | <.001 | 6.35 | 6.34 | <.001 | |||
| Working (%) | 3.53 | 6.68 | <.001 | 3.39 | 6.54 | <.001 | 2.70 | 5.13 | <.001 | ||||||
| Volunteering (%) | 2.86 | 6.18 | <.001 | 2.03 | 4.42 | <.001 | 1.99 | 4.36 | <.001 | ||||||
| Computer use | 0.88 | 7.11 | <.001 | 0.84 | 6.87 | <.001 | |||||||||
| Visiting friends | −0.11 | −0.48 | .629 | −0.12 | −0.55 | .580 | |||||||||
| Brain games | 0.74 | 6.10 | <.001 | 0.76 | 6.37 | <.001 | |||||||||
| Sports | 0.68 | 5.32 | <.001 | 0.56 | 4.37 | <.001 | |||||||||
| Games | 0.66 | 3.80 | <.001 | 0.67 | 3.91 | <.001 | |||||||||
| Courses | 0.62 | 2.29 | .022 | 0.55 | 2.04 | .041 | |||||||||
| Physical functioning | 0.08 | 6.47 | <.001 | ||||||||||||
| Older adults (N = 2113) | |||||||||||||||
| Model 1 | Model 2 | Model 3 | Model 4 | Model 5 | |||||||||||
| b | t | p | b | t | p | b | t | p | b | t | p | b | t | p | |
| Time period | 3.25 | 5.89 | <.001 | 2.08 | 3.83 | <.001 | 1.89 | 3.46 | .001 | 0.39 | 0.70 | .486 | 0.41 | 0.73 | .464 |
| Age | −0.70 | −13.57 | <.001 | −0.60 | −11.96 | <.001 | −0.58 | −11.3 | <.001 | −0.50 | −9.81 | <.001 | −0.44 | −8.34 | <.001 |
| Gender (female %) | 1.50 | 2.93 | .003 | 3.49 | 6.62 | <.001 | 3.60 | 6.81 | <.001 | 3.04 | 5.78 | <.001 | 3.43 | 6.51 | <.001 |
| Education | |||||||||||||||
| Low (Ref.) | 1.00 | — | — | 1.00 | — | — | 1.00 | — | — | 1.00 | — | — | |||
| Intermediate | 5.87 | 8.13 | <.001 | 5.70 | 7.88 | <.001 | 4.56 | 6.48 | <.001 | 4.56 | 6.52 | <.001 | |||
| Upper-intermediate | 6.96 | 7.04 | <.001 | 6.68 | 6.74 | <.001 | 4.81 | 4.93 | <.001 | 4.86 | 5.02 | <.001 | |||
| High | 10.62 | 11.93 | <.001 | 10.26 | 11.47 | <.001 | 7.65 | 8.32 | <.001 | 7.58 | 8.29 | <.001 | |||
| Working (%) | 1.93 | 0.55 | .582 | 3.72 | 1.10 | .271 | 3.65 | 1.09 | .277 | ||||||
| Volunteering (%) | 2.00 | 3.29 | .001 | 1.10 | 1.80 | .072 | 0.97 | 1.61 | .107 | ||||||
| Computer use | 0.74 | 5.35 | <.001 | 0.73 | 5.30 | <.001 | |||||||||
| Visiting friends | 0.41 | 1.68 | .094 | 0.35 | 1.43 | .153 | |||||||||
| Brain games | 1.08 | 8.94 | <.001 | 1.06 | 8.8 | <.001 | |||||||||
| Sports | 0.22 | 1.61 | .107 | 0.08 | 0.56 | .579 | |||||||||
| Games | 0.62 | 3.57 | <.001 | 0.67 | 3.90 | <.001 | |||||||||
| Courses | 0.49 | 1.37 | .171 | 0.41 | 1.14 | .254 | |||||||||
| Physical functioning | 0.06 | 5.55 | <.001 | ||||||||||||
Notes. b = Regression coefficient; t = t-value; p = p-value.
Declaration of Conflicting Interests
The author(s) declared no potential conflicts of interest with respect to the research, authorship, and/or publication of this article.
Funding
The author(s) disclosed receipt of the following financial support for the research, authorship, and/or publication of this article: This paper was funded by the DFG (German Research Foundation), reference number GE 1167/15-1.