
Abstract
Introduction
Type 2 diabetes mellitus is a common diagnosis seen in the outpatient setting seen in 37.3 million (11.3%) America in 2019, and management of this disease can be challenging for the primary care provider. 1 The landscape of therapies available has increased exponentially to include not only commonly known medications such as metformin, sulfonylureas, dipeptidyl peptidase-4 (DDP-4) inhibitors, and traditional insulins, but also glucagon-like peptide-1 (GLP-1) receptor agonists, sodium-glucose cotransporter-2 (SGLT2) inhibitors, and newer insulin formulations. 2 In addition to the vast number of medications, additional disease state (ie cardiovascular) indications has increased. It is well known that better glycemic control leads to better outcomes for patients, but it can be difficult to know which medications to select given the diversity in cost, route of administration, side effects, and benefits in comorbid conditions that would aid in individualizing therapy for patients. In addition, medications used to treat diabetes may result in adverse effects, especially if there is a disease-state contraindication.3,4 Furthermore, making this decision quickly based on time-constraints in a busy clinic can contribute to stress in attending and resident physicians.
Studies have been conducted evaluating techniques to reduce medication errors and adverse effects regarding medications used to treat hyperglycemia. The majority of these studies have been performed in the inpatient setting and focused on the use of insulin.5-7 The techniques utilized have consisted of a number of strategies that have ranged from continuous quality improvement, use of an order form, an electronic insulin order set, order restrictions, audits, provider education, and provider decision support tools. 5 Visual aids such as posters and medication sheets/aids are frequently seen in the workstations of physician offices. With a few exceptions, little has been published regarding the utility of such aides.8,9 The objective was to determine whether creating a diabetes medication poster that included costs, drug classification, adverse effects, and clinical outcomes/contraindications/cautions for use in an internal medicine/medicine-pediatric clinic improves resident and faculty knowledge, comfort, and awareness of those medications.
Materials and Methods
Design of this quality improvement project began with the development of SMART (specific, measurable, actionable, realistic, timebound) goals and the PDSA (plan, do, study, act) cycle as a blueprint to guide this project. (Appendix A). The diabetes medication poster used was developed to meet the objective of the project determined from SMART goals and PDSA cycle. The design of the poster was an overview of diabetes medications divided by medication class. Each classification included generic name and proprietary names, dosage, picture of the product, important cautions/contraindications and adverse effects. Symbols representing increases or decreases in cardiovascular events and heart failure, route of administration and relative cost among others were included (Appendix B). Cost was determined by calling a local pharmacy for cash prices. The poster was developed in PowerPoint and printed in color on 8.5″ by 11″ and 8.5″ by 14″ paper and the copies were displayed in the respective clinics. This study was classified as exempt by the Institutional Review Board.
Survey.
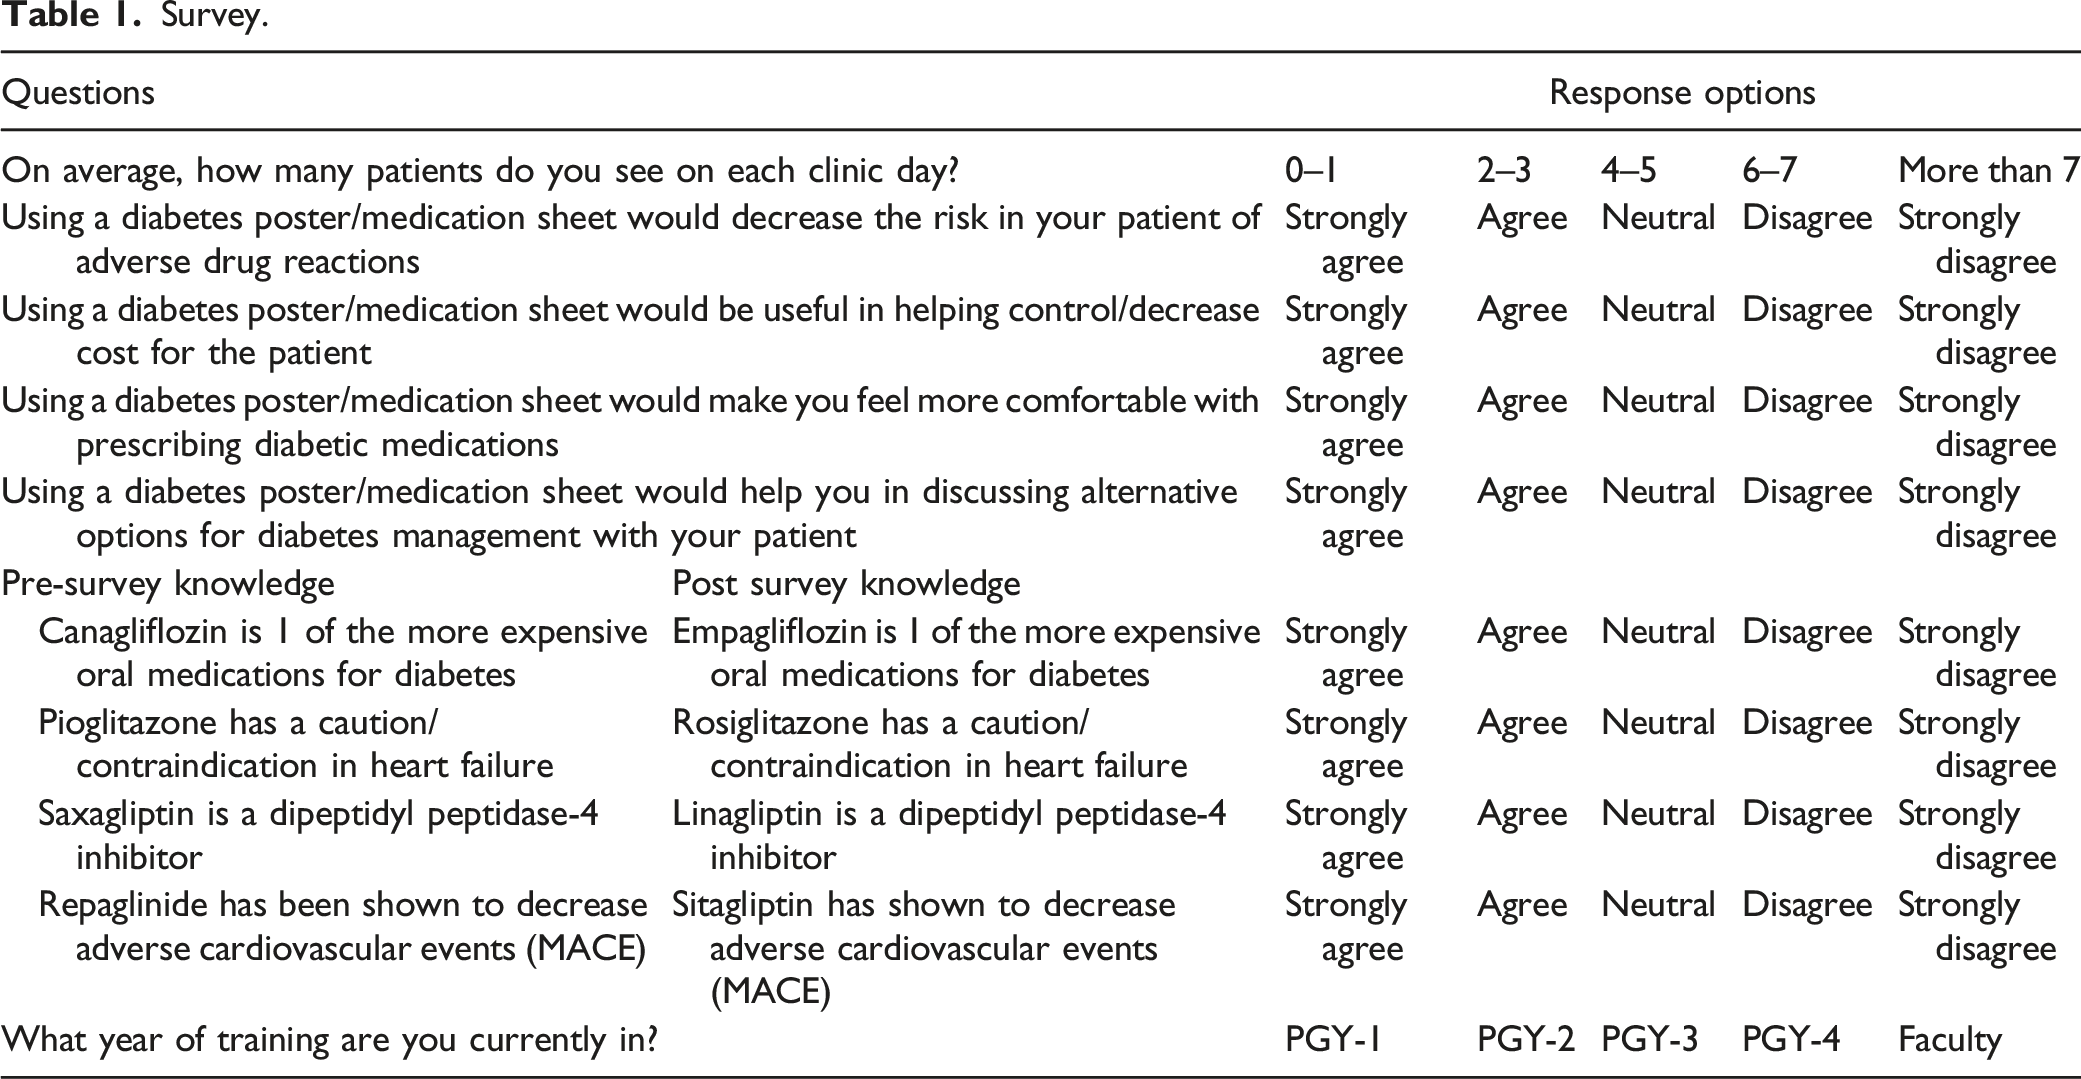
SAS v9.4 was used for all statistical tests. All descriptive results were reported, however statistical analysis was only preformed on those completing both the pre and post survey. A threshold of α = .05 was used to determine statistical significance. Knowledge questions from the pre survey were collapsed into 1 score and matched with the post survey median score. A Wilcoxon signed rank test was performed to compare the median knowledge score pre and post survey. The remaining questions from the pre and post survey were matched and individually compared using a Wilcoxon signed rank test. A Bonferroni multiplicity adjustment was implemented with the adjusted alpha of .05/4 = .0125. 10
Results
Thirty-one (47%) residents and attending physicians responded to both the pre and post survey. There was an almost even distribution of residents in their post graduate year of training [(PGY)-1 (N = 6), PGY-2 (N = 7), PGY-3 (N = 7)] who completed both surveys. Two PGY-4 residents and 9 attending physicians also completed both surveys. Most providers reported seeing 2 to 3 patients with type 2 diabetes mellitus in clinic per day (half-day clinics).
Raw Data Results of Pre and Post Survey.
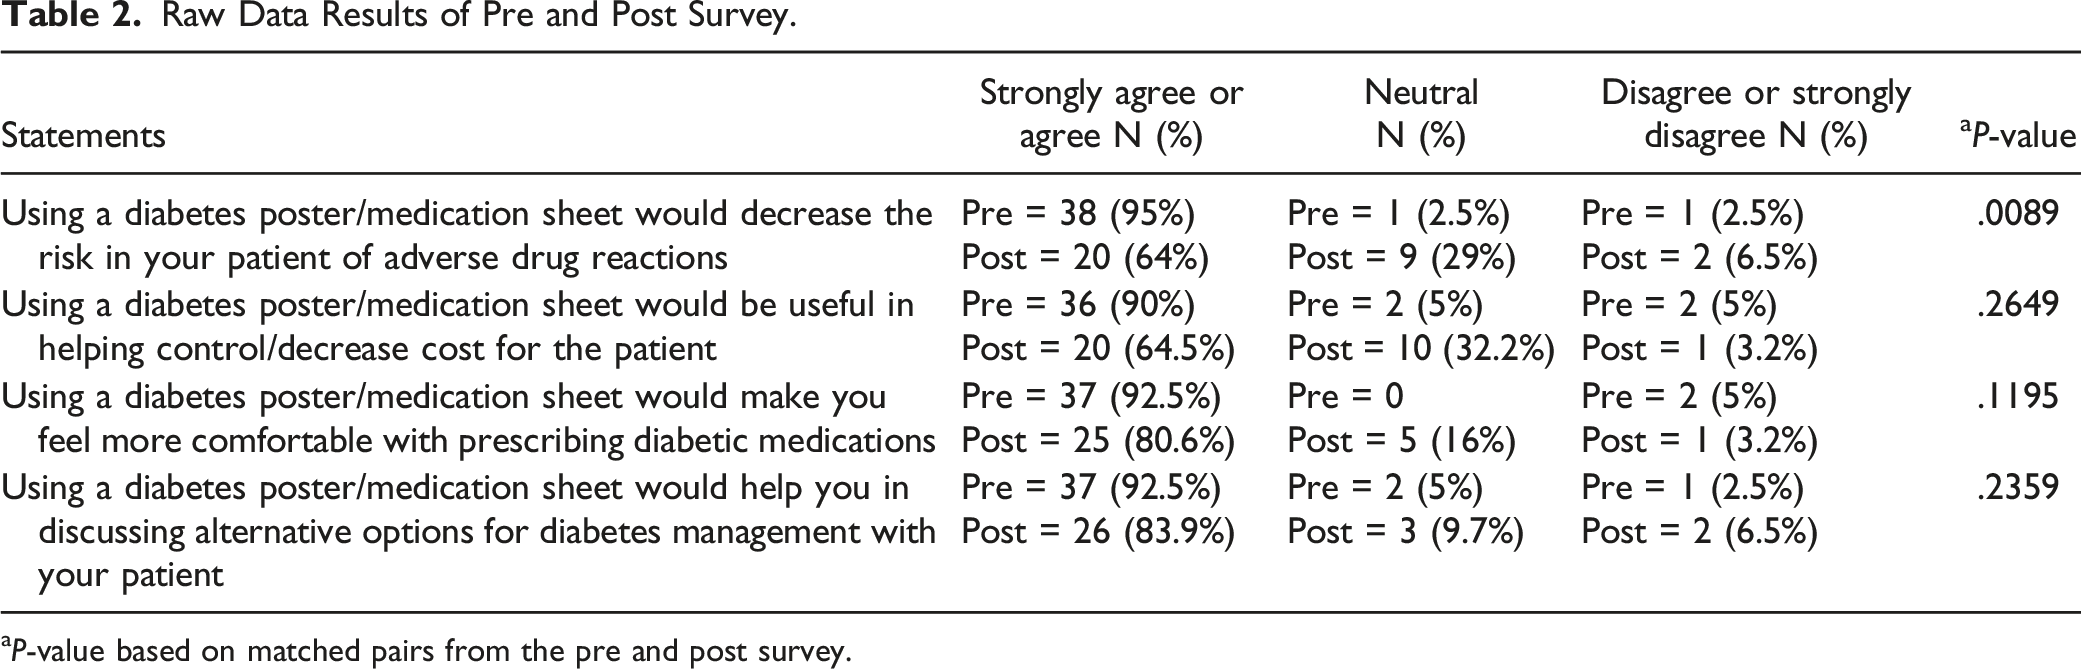
aP-value based on matched pairs from the pre and post survey.
Out of 20 possible points for the knowledge results, the providers had a mean score of 15.24 before the use of the medication poster and 16.68 after use, which was significantly higher after the implementation of the medication poster (P = .0398).
Discussion
Use of a Visual Aid
Visual aids in the form of protocols, clinical pathways, and algorithms have been used to increase clinical knowledge and improve patient care without taking away from the individual decision-making capacity of the provider. 11 Visual aids are not limited to these aforementioned formats. A recent study evaluated if using flashcards would have a large, positive impact on prescribing confidence of PGY-1 physicians. 8 In this study, a pocket-sized flashcard with commonly prescribed medications was given to 1 group of physicians and confidence was measured at week 4. The physicians who had received the flashcards reported a significantly higher level of prescribing confidence compared to the group that did not receive the flashcards (P < .05). In addition, the physicians who continued to use the flashcards reported that it saved time during the day and while on-call. The increase in prescribing confidence was similar in this study compared to our study reflected in both the pre survey and post survey provider responses. The limitation stated by the authors included the overall time used to assess the impact of the intervention could have been longer. This could also be stated for our study with the post survey administered 2 months after the intervention.
A second study evaluated the use of visual aids in the form of a poster. 9 The objective of the study was to evaluate if the visual aid would decrease errors and increase confidence with regards of administering epinephrine by staff in a radiology department in an event of a moderate to severe contrast media reaction. Measurements were taken during simulation scenarios. The use of the visual aid decreased errors from 40% to 18.2% (P = .35) and decreased epinephrine administration time from 152 s to 97 s (P = .04) compared to the control group. When surveyed, the participants stated that the visual aid would positively help in the decision to administer the correct dose and route of the medication (97.8% strongly agree or agree) and that it would improve time to administration (86.9% strongly agree or agree). The utilization of a poster format as a visual aid was similar to our study. In addition, the potential for decreasing adverse outcomes was comparable. However, the poster used in the epinephrine study was more in-line with an algorithm approach as a visual aid compared to our poster. The type and layout of the poster was considered a possible limitation by the authors because they did not study different layouts for effectiveness. The authors also did not compare different designs of the poster.
Limitations
In addition to the above-mentioned limitations, our sample size was hampered by a limited number of providers in the academic clinic. However, a 31% response rate provided insightful results. A second limitation was a limited budget. Making the posters larger may have had a greater impact on the effectiveness of the intervention. Future studies would need to study number, style, and size of visual aids for maximum impact. Lastly, a plan to update the poster was not put into place before the project was initiated. A follow-up plan has now been developed. This will be conducted every 2 years at the direction of the attending physician involved with this project and the medical director of the ambulatory care clinic.
Conclusion
A significant number of medications used to treat diabetes have been approved over the past several years. In a busy academic internal medicine/medicine-pediatric clinic, having quick references can save valuable time and potentially decrease medication errors and improve both prescriber and patient compliance. There are a myriad of tools that can be utilized to help navigate complex diseases, including diabetes. Visual aids, such as algorithms, have been used to improve patient care. A poster containing pertinent information regarding diabetes medications was viewed by physicians as favorable and valuable tool. Other areas where visual aids could be effective in improving knowledge and patient care while decreasing adverse effects without overwhelming providers should be explored.
Footnotes
Acknowledgment
The authors thank the Western Michigan University Homer Stryker MD School of Medicine Department of Epidemiology and Biostatistics for their assistance in preparing this article.
Declaration of Conflicting Interests
The author(s) declared no potential conflicts of interest with respect to the research, authorship, and/or publication of this article.
Funding
The author(s) received no financial support for the research, authorship, and/or publication of this article.
Appendix A
The SMART goals were: • • • • •
The PDSA cycle included: • • • •
Appendix B