
Abstract
Introduction
Type 2 diabetes is a major public health issue, which disproportionately affects the Medicaid population. In 2017, overall US expenditures associated with diabetes topped 237 billion dollars in direct and 90 billion in indirect costs, respectively. 1 Low income individuals bear a disproportionate share of the diabetes burden. Individuals with low incomes are more likely to suffer diabetes-related morbidity and mortality. 2 A large proportion of this population is covered by Medicaid. As of 2013, roughly 14% of the estimated 12.9 million non-elderly adults covered by Medicaid, suffered from diabetes. 3 According to the Centers for Disease Control and Prevention the prevalence of diabetes in the general population is 13%. 4
Despite having health insurance coverage, patients with diabetes and Medicaid contend with persistent barriers to health care that reduce cardiovascular risk factor control and result in high levels of diabetes-related morbidity and mortality. Specifically, Allen et al found that individuals with Medicaid coverage often misunderstood their insurance coverage, had ongoing cost-of-care concerns, had low health literacy and lacked self-management knowledge. 5 Consequently, the medication adherence rate for patients with diabetes and Medicaid coverage has been found to range anywhere from 36% to 67%.6-8 Using Behavioral Risk Factor Surveillance System data (2008-2018) and a Difference-In-Differences study design Yan et al. found that Medicaid expansion was not associated with any changes in treatment or self-management among newly Medicaid-eligible patients with diabetes, residing in expansion states, relative to those residing in non-expansion states. 9 Using all state hospital discharge records in Pennsylvania, Fisher and Ma found that the numbers of emergent/urgent diabetes-related hospital admissions among patients with diabetes and Medicaid coverage and with diabetes without insurance were not statistically different. 10
The literature is replete with examples of pharmacist-led interventions improving outcomes among patients with diabetes in the general population. A meta-analysis conducted by van Eikenhorst et al. of 27 studies found that pharmacist-led interventions were associated with a .71% and 5.20 mmHg improvement in HbA1C and systolic blood pressure, respectively. 11 Studies of pharmacist-led interventions among patients with diabetes and Medicaid insurance coverage are sparse. Results from a limited number of studies suggest that primary care-based pharmacist-led management, a delivery system design intervention that uses clinical pharmacists to address care quality, as well as patient self-management behavior, may be an effective strategy for improving cardiovascular risk factor control among patients with diabetes and Medicaid coverage. Rothman et al. found that patients with diabetes (43% covered by Medicaid), randomized to an intervention in which clinical pharmacists provided patient education, addressed barriers to care, and managed cardiovascular risk factors using algorithms during monthly visits, had reductions in HbA1c and systolic blood pressure (SBP) of .8% and 9 mmHg, respectively, after 12 months. 12 However, it is not clear that such strong effects will be observed in the real-world setting in which patients will be potentially less motivated and the treatment protocol less rigidly defined. 13
While extant studies suggest benefit of pharmacist-led management interventions among patients with diabetes and Medicaid coverage, additional evaluation is warranted due to the minimal number of studies on this topic and the updates to diabetes management since the last study on this topic (2001-2003). Additionally, adherence to intervention protocol is typically much stricter in RCTs than it is in every day practice. 13 Consequently, the performance of primary care-embedded pharmacist-led management interventions among patients with diabetes and Medicaid coverage in a recent, real world context, remains uncertain. The objective of this study is to examine the impact of a primary care-embedded clinical pharmacist-led intervention on hemoglobin A1C and blood pressure control, relative to usual care, among patients with Type 2 diabetes (TD2) and Medicaid, in a large healthcare system. To achieve this objective, we employ a Difference-in-Differences approach with a propensity-matched comparison group that takes advantage of the variability in exposure to a primary-care embedded pharmacist-led intervention (UCMyRx) across patients.
Methods
This study was approved by the University of California Institutional Review Board.
Setting
The University of California Los Angeles (UCLA) is an academic medical center comprised of four hospitals and more than 200 medical practices and 50 primary care clinics throughout Southern California. The UCLA Health System has a staff of more than 2000 physicians, including 1500 full time physicians employed at Ronald Regan UCLA Medical Center. UCLA Health System hospitals and clinics have over 2.5 million annual patient visits and 100 000 hospital admissions annually. The service area for Ronald Regan UCLA Medical Center includes 18 cities/communities in Los Angeles County. The population of the service area is 656 039, 69.7% of which are adults, ages 18-64; and 14.3% of the population are seniors, ages 65 or above. With respect to the racial/ethnic breakdown, 60.2% of the service area population is White; 16.5% of residents are Hispanic/Latino; 13% are Asian; 6.2% are African American; and 4.1% are, American Indian/Alaskan Native, multiple, or other race/ethnicity. English is spoken in the home among 64.4% of the service area population. Spanish is spoken at home among 13.3% of the population; 8.1% of the population speak an Asian language; and 11.8% of the population speaks an Indo-European language at home. In the service area, 11.9% of the population is at or below 100% of the federal poverty level (FPL). Close to one-quarter (24%) of the population in the service area is considered low-income, living at or below 200% of FPL. 14
In 2013 SB 493 was signed into law in California which designates pharmacist as “healthcare providers” who are authorized to provide healthcare services. 15 Under this designation, pharmacist can participate in multidisciplinary review of patient progress, including appropriate access to medical records and provide consultation, training, and education to patients about drug therapy, disease management, and disease prevention. Additionally, advanced practice pharmacist under a collaborative practice agreement, are able to perform patient assessments, order and interpret drug therapy-related tests, initiate, adjust or discontinue drug therapy, refer patients to other healthcare providers and participate in the evaluation and management of diseases and health conditions in collaboration with other healthcare professionals.
Data Extraction
The electronic health record system (EHR) was implemented at UCLA in March of 2013. We obtained EHR data for all patients in the exposure and usual care groups. The abstracted data included medical encounter types, demographics, diagnoses, vital signs, laboratory test results, prescription medications and health insurance coverage variables.
Exposure: UCMyRx Visit
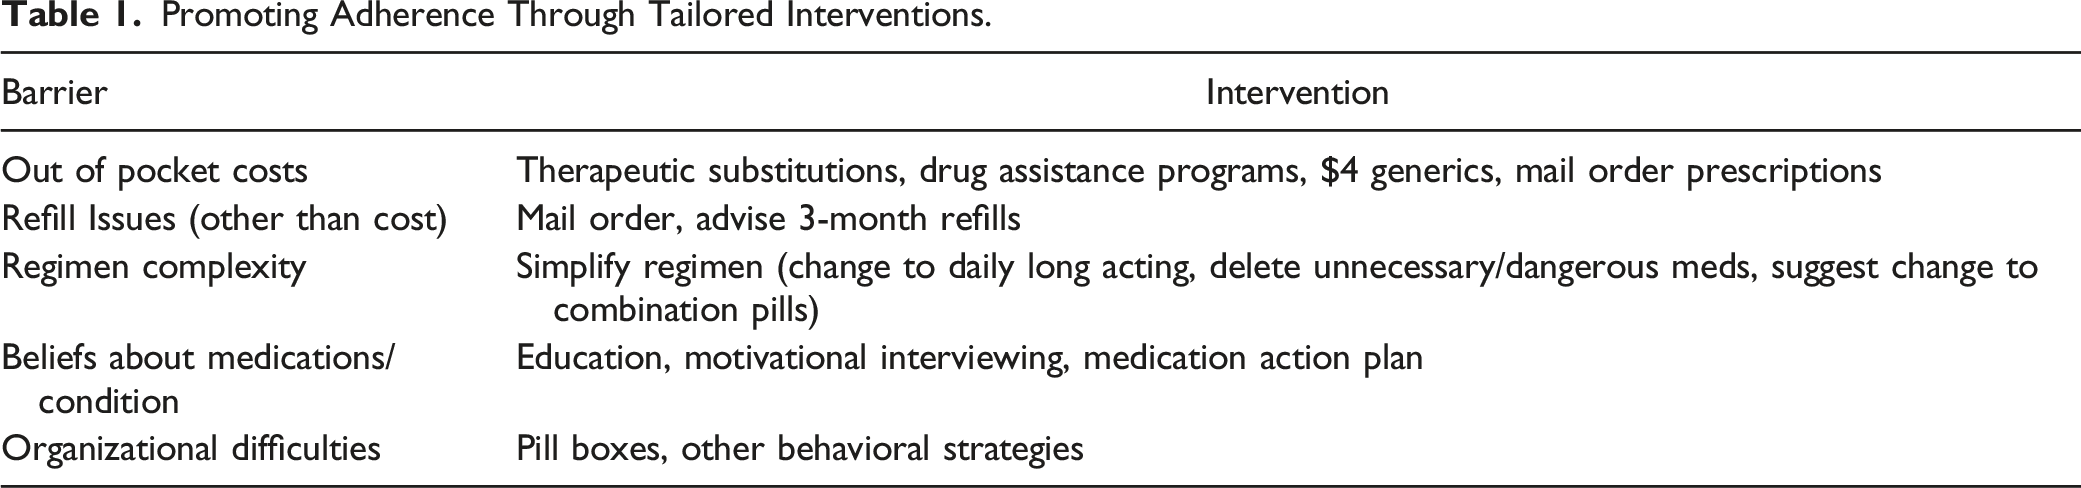
Promoting Adherence Through Tailored Interventions.
The exposure group included adults with any instance of ICD-9/10 diagnosis code for Type 2 diabetes, Medicaid insurance coverage (± Medicare coverage) and ≥18 years of age that had at least one face-to-face with a UCMyRx clinical pharmacist, during the study window (03/02/2013-12/31/2018). Additionally, the exposure population for the HbA1c analyses was limited to adults that had a HbA1C ≥8%, at least once, anywhere between 365 days before and 14 days after the UCMyRx visit and a follow up HbA1c measure within 120 to 365 days of the visit. The SBP population was limited to adults that had a SBP ≥140 mmHg at least once, between 365 days before and 14 days after the UCMyRx visit, that had a follow up SBP measure within 120 to 450 days after the visit. The longer duration for the SBP measure, relative to the HbA1c measure, allowed the time to obtain three separate SBP measures and calculate the average of these measures, increasing the validity of the SBP results. The index date for the exposure population was the date of the first UCMyRx visit.
Usual Care
The usual care group was drawn from all UCLA patients, with any instance of ICD-9/10 diagnosis code for Type 2 diabetes, identified in the EHR as having Medicaid coverage that were ≥18 years of age, that had at least 2 visits to one or more UCLA primary care clinics, ≥2 years apart, during the study window. The outcome measurement windows were the same as above with the exception that the index date was a randomly generated date between the two primary care visits. Usual care patients were drawn from clinics both with and without UCMyRx pharmacist; however, they did not have a visit with a UCMyRx pharmacist.
Propensity-Score Matching Analysis
Since it is not possible to randomize patients to the UCMyRx program, we use propensity score matching to create comparable cohorts of UCMyRx and usual care patients. 22 Logistic regression models were used to generate propensity scores. Variables choices for the propensity scores were informed by the extant literature and included pre-index (HbA1c and SBP levels, age, gender, race/ethnicity, language, Charlson Co-morbidity Index (CCI), Diabetes Severity Index (DSI), 23 presence of serious mental illness (bipolar disorder, schizophrenia, major depression), having seen an endocrinologist (yes/no), number of diabetes medications, total number of prescription medications and health insurance status (Medicaid vs Medicaid + Medicare)).24-26 Each UCMyRx patient was matched to two comparable usual care patients using the Nearest Neighbor Matching propensity score matching method.27,28 Separate propensity score matching was done for each outcome.
Outcomes
Our primary outcomes were pre to post-index changes in HbA1c and SBP levels. The pre-index HbA1c was the closest value to the index date with a window of 365 days before the index date and 14 days after. The pre-index SBP was the mean of the 3 values closest to the index date with 365-day window before and a 14-day window after. The post-index HbA1c was the closest value to 180 days after the index date with a window of 120 to 365 days after the index date. The post-index SBP was the mean of the 3 values closest to 365 days after the index date with 120 to 450 day window after the index date. 26
Statistical Analysis
R version 4.0.3 statistical software was used for all analyses. 29 The unit of analysis was the patient. We calculate descriptive statistics for all variables in the models, across treatment status, using t-test and chi-squared test to compare continuous and dichotomous/categorical variables, respectively. To evaluate the effect of the UCMyRx program on HbA1c and SBP, we performed Difference-In-Differences (DID) analyses. The DID study design is particularly-suited to assess the effects of the UCMyRx intervention given that it is able to remove the influence of other potential interventions such as a system-wide diabetes care quality improvement initiative, provided both the UCMyRx and usual care groups are exposed to the intervention and both groups are affected by the intervention in the same way. The use of propensity score matching helps ensure that the UCMyRx and usual care groups are balanced on observable factors that may influence how they would respond to a given intervention. 30 We used linear mixed effects models that include an indicator for time (post-index vs pre-index) that was coded as “1” if the observation was from the post-index period and coded “0” otherwise, an indicator for group (UCMyRx vs usual care) that was coded as “1” if the observation was from the UCMyRx group and coded as “0” otherwise and the interaction between time and group, among our matched samples. 31 Specifically, the between-group differences in the change of the outcome variables, post-index, were estimated by the interaction effects. The models also included random effects to take into account data clustering within each pair of matched UCMyRx and usual care patients and data clustering within each patient. 32 The “patient” random effects were nested within the “cluster” random effects. With a sample size of 504 for the HbA1c sample (168 treatment and 336 comparison) and a pooled HbA1c standard deviation of 1.3% in the matched sample, we have 80% power to detect a HbA1c change of .34% across the UCMyRx and usual groups. With a sample size of 600 for the SBP sample (200 treatment and 400 comparison) and a pooled SBP standard deviation of 15.9 mmHg in the matched sample, we have 80% power to detect an SBP change of 3.9 mmHg, across the UCMyRx and usual care groups.
Sensitivity Analyses
To assess for UCMyRx effect size differences, across populations with more controlled or less controlled risk factors at baseline, we repeated analyses with the entire matched sample and included a risk indicator coded as “1” if the patient had worse risk factor control (HbA1c ≥9 for the HbA1c outcome and SBP ≥150 for the SBP outcome) and coded “0” otherwise. A statistically significant interaction between the time (post-index vs pre-index), group and risk indicators would indicate statistically significant differences in UCMyRx effects, across patient populations, with more or less controlled risk factor control. To assess the impact of UCMyRx across patients with different levels of co-morbidity, we ran analyses stratified by Charlson Co-morbidity Index (CCI) tercile (tercile1:0-4; tercile2:5-7; tercile3 ≥ 8). To assess for differential effects across Medicare coverage status, we conducted separate analyses for the Medicaid only and Medicaid + Medicare populations.
Results
Patient Characteristics
Our sample sizes for the HbA1c and the SBP outcomes were 504 and 600, respectively. Descriptive statistics for each of our unmatched and matched analytic samples are shown in Supplementary Table 1 (HbA1c sample) and 2 (SBP sample). With the exception of baseline HbA1c (7.4% control vs 7.9% UCMyRx) (HbA1c sample), no statistically significant differences remained across the treatment and comparison samples post matching. Descriptive statistics for each of our unmatched and matched analytic samples used in our sensitivity analyses are shown in Supplementary Tables 3-12.
UCMyRx Characteristics
Over the time period covered by the study window, the mean and standard deviation for face-to-face visits with clinical pharmacist for the HbA1c and SBP groups were 4.4 (7.1) and 4.3 (6.8), respectively. The mean and standard deviation for total contacts (face-to-face visits, telephone and email) with the clinical pharmacist for the HbA1c and SBP groups were 6.9 (10.6) and 6.7 (10.1), respectively.
Post UCMyRx Visit Change in HbA1c and SBP
Effect of UCMyRx among all Medicaid Recipients.
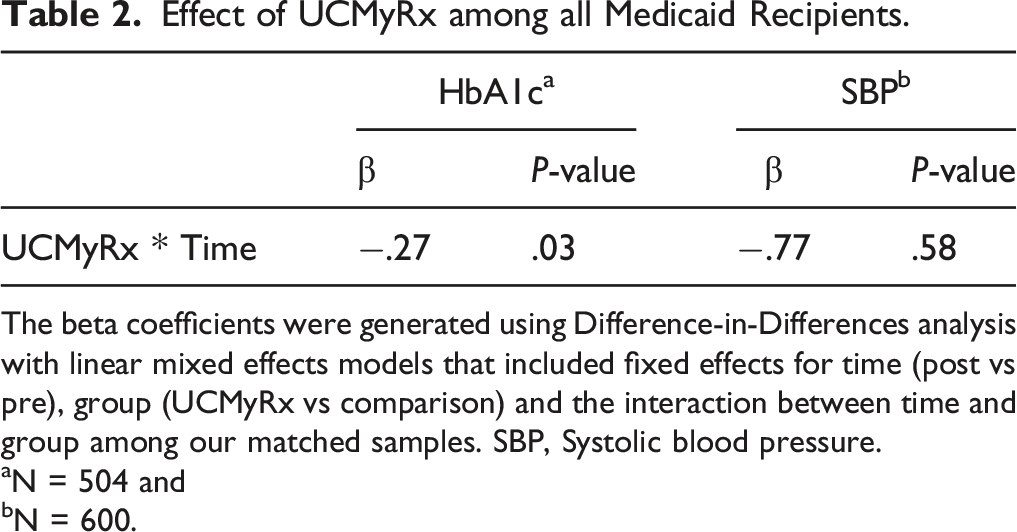
The beta coefficients were generated using Difference-in-Differences analysis with linear mixed effects models that included fixed effects for time (post vs pre), group (UCMyRx vs comparison) and the interaction between time and group among our matched samples. SBP, Systolic blood pressure.
aN = 504 and
bN = 600.
Sensitivity Analyses
Effect of More UCMyRx Across Co-morbidity Tercile.
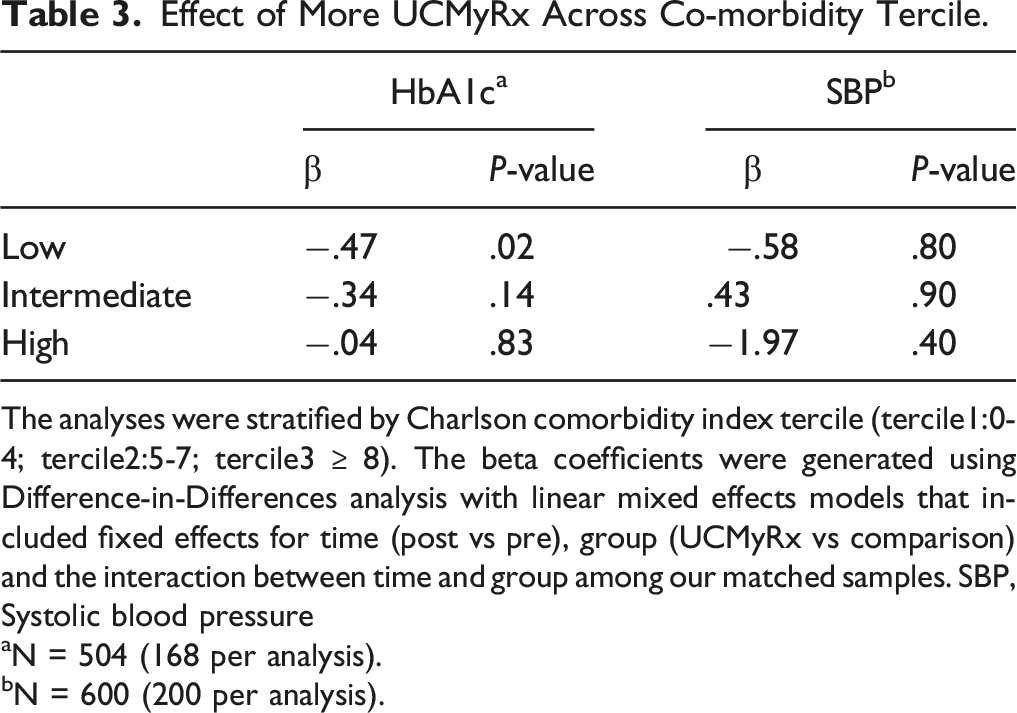
The analyses were stratified by Charlson comorbidity index tercile (tercile1:0-4; tercile2:5-7; tercile3 ≥ 8). The beta coefficients were generated using Difference-in-Differences analysis with linear mixed effects models that included fixed effects for time (post vs pre), group (UCMyRx vs comparison) and the interaction between time and group among our matched samples. SBP, Systolic blood pressure
aN = 504 (168 per analysis).
bN = 600 (200 per analysis).
Effect of UCMyRx Across Medicare Status.
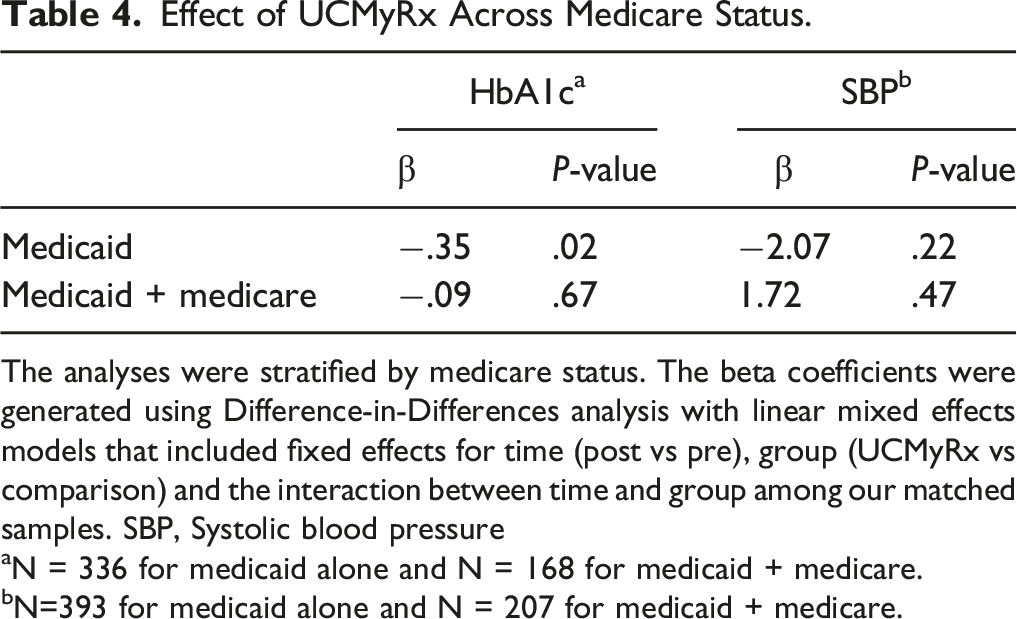
The analyses were stratified by medicare status. The beta coefficients were generated using Difference-in-Differences analysis with linear mixed effects models that included fixed effects for time (post vs pre), group (UCMyRx vs comparison) and the interaction between time and group among our matched samples. SBP, Systolic blood pressure
aN = 336 for medicaid alone and N = 168 for medicaid + medicare.
bN=393 for medicaid alone and N = 207 for medicaid + medicare.
Discussion
We conducted the first effectiveness study of a primary care-embedded clinical pharmacist-led intervention in a large healthcare system, among patients with diabetes and Medicaid coverage and found a statistically significant .27% reduction in HbA1c among the UCMyRx population and no impact on SBP, relative to usual care. We find an even stronger HbA1c effect among individuals with low levels of co-morbidity and individuals without Medicare coverage.
The effect on HbA1c that we find (.27% HbA1c reduction) is less than what has been observed in efficacy studies. 12 Several factors may account for that. One factor may be that the mean HbA1c in our analytic sample is lower relative to that of other study populations (7.4% vs11%). 12 We also have an older study population than what has been found in other studies, with a mean age of 64, relative to a mean age of 54 in the Rothman et al study. 12 Consequently, less stringent HbA1c treatment goals for some older patients may have manifested in a smaller mean HbA1c change associated with the UCMyRx intervention. 33 Lastly, relative to other studies, our treatment populations had much less contact with clinical pharmacists. In the Rothman et al study the diabetes management team had a median of 45 contacts/care-related activities per patient, relative to 6.9 in this study for the HbA1c subsample. This differential contact was likely driven primarily by relatively better controlled of HbA1c among our study population and the lack of prescribed monthly contact that was embedded in the Rothman et al. intervention. 12 Lastly, our total contact measure does not reflect the co-management with physicians that occurred over the study period.
While the HbA1c reduction observed among the total population is modest, the .47% reduction observed among individuals with low co-morbidity is larger than the change observed with continuous glucose monitoring and insulin initiation.34,35 It is also relatively close to the HbA1c change that has been observed with the initiation of some diabetes medications (−.5%). 36 Furthermore, this HbA1c change is nearly double what has been observed for diabetes self-management education alone (−.24%). 37 Economic models have predicted that a .4% decrease in HbA1c would substantially decrease microvascular and macrovascular complications among diabetics, over 25 years. 38 Given that individuals with low SES suffer disproportionate diabetes-related morbidity and mortality, these findings are extremely important. 39
Null effects among the subpopulation with higher levels of co-morbidity may reflect adherence to guidelines that suggest relaxing the stringency of glucose control among individuals with high levels of co-morbidity and limited life expectancy. 40 Inability to find significant UCMyRx effects on the HbA1c population with both Medicare and Medicaid may be attributable to the overlap between UCMyRx and Medicare-specific programs such as Medicare Part D and Medication Therapy Management (MTM) which may reduce UCMyRx effects. Specifically, Medicare part D coverage in combination with Medicaid coverage may reduce the out-of-pocket costs burden for dually-eligible individuals. Additionally, some members of this population will likely have access to MTM through Medicare Part D. 41 While MTM through Medicare is nowhere as comprehensive as UCMyRx, these programs do offer some overlapping benefits such as pharmacist medication therapy review and communication with the primary care provider regarding such medication related problems as medication underutilization through various communication modalities such as mail. 42 In combination, Medicare Part D and MTM may limit the potential impact of UCMyRx observable for the outcomes considered in this particular study. In contrast, patients with diabetes and Medicaid coverage alone and low co-morbidity appear to derive substantial benefit from UCMyRx.
These findings must be interpreted in the context of important study limitations. Our DID analysis with propensity score-matched comparison group will only remove the influence of secular time trends from our UCMyRx effect-estimates if the secular time trends for the UCMyRx and usual care groups are the same. 30 Propensity score matching helps to ensure the similarity of secular time trends across groups by matching study participants on observable characteristics; however, this approach does not address non-observable differences such as patient activation. 43 We do not control for clustering at the clinic level. We are also unable to comment on any differences in adverse outcomes across the groups. Another limitation is that this analysis only looks at the short-term effects of the UCMyRx intervention. Lastly, this study was done in a large academic healthcare system, therefore findings may be different in other types of settings.
This study makes a number of contributions to the literature. Foremost, this study shows that even when delivered at an intensity-levels lower than what has been observed in RCTs and among patient populations not meeting stringent selection criteria, primary care-embedded clinical-pharmacist led intervention leads to meaningful improvements in HbA1c levels, among patients with diabetes and Medicaid coverage, relative to usual care. Specifically, the effect of UCMyRx on HbA1c among patients with low co-morbidity was commensurate with what has been observed for interventions such as insulin and oral diabetes medication initiation. Additionally, interventions such as UCMyRx may prove more financially feasible for a diverse range of medical practices to adopt, relative to the intervention strategies used in the RCTs. Along these same lines, it will be important for Medicaid plans to reimburse appropriately for these interventions. According to a 2015 survey conducted by the American Medicaid Pharmacy Administrators Association of 25 states, only 56% had supported or are still supporting a Medicaid-MTM initiative. 44 Another benefit of interventions like UCMyRx is the ability to help unburden physicians while improving the quality of diabetes care for patients. 21 Lastly, UCMyRx increases patient self-management opportunities by addressing structural barriers that preclude engagement in care, which are highly prevalent among the population covered by Medicaid. Consequently, interventions such as UCMyRx may help reduce diabetes disparities among individuals with low socioeconomic status. 39
Conclusion
Using a Difference-In-Differences study design with a 2:1 propensity matched comparison group we found that a primary care-embedded clinical pharmacist-led intervention in a large healthcare system led to a significant reduction in HbA1c among patients with diabetes and Medicaid coverage, relative to usual care.
Supplemental Material
Supplemental Material - An Effectiveness Study of a Primary Care-embedded Clinical Pharmacist-Led Intervention Among Patients With Diabetes and Medicaid Coverage
Supplemental Material for An Effectiveness Study of a Primary Care-embedded Clinical Pharmacist-Led Intervention Among Patients With Diabetes and Medicaid Coverage by Kimberly Danae Cauley Narain, Chi-Hong Tseng, Douglas Bell, Amanda Do, Rob Follette, O. Kenrik Duru, Gerardo Moreno, and Carol Mangione in Journal of Pharmacy Practice.
Footnotes
Acknowledgments
The authors would like to acknowledge Janet Chon for her program expertise.
Authors’ Contributions
All authors made substantial contributions to the conception or design of the work; or the acquisition, analysis, or interpretation of data for the work; and drafting the work or revising it critically for important intellectual content; and final approval of the version to be published; and agreement to be accountable for all aspects of the work in ensuring that questions related to the accuracy or integrity of any part of the work are appropriately investigated and resolved.
Declaration of Conflicting Interests
The author(s) declared the following potential conflicts of interest with respect to the research, authorship, and/or publication of this article: Dr Carol M. Mangione received support from the University of California at Los Angeles (UCLA), Resource Centers for Minority Aging Research Center for Health Improvement of Minority Elderly under National Institutes of Health (NIH)/NIA under Grant P30AG021684, and the Delivery System Reform Incentive Pool (DSRIP) under a Grant from the Centers for Medicare & Medicaid Services (CMS). Dr Mangione holds the Barbara A. Levey and Gerald S. Levey Endowed Chair in Medicine, which partially supported her work. Dr Carol M. Mangione is a member of the United States Preventive Services Task Force (USPSTF). This article does not necessarily represent the views and policies of the USPSTF.
Funding
The author(s) disclosed receipt of the following financial support for the research, authorship, and/or publication of this article: This research was supported by the Centers for Disease Control and Prevention (Division of Diabetes Translation) and the National Institute of Diabetes and Digestive and Kidney Diseases as part of the Natural Experiments for Translation in Diabetes (NEXT-D) study (grant number DP002722); and NIH National Center for Advancing Translational Science (NCATS) UCLA CTSI Grant Number UL1TR001881.
Supplemental Material
Supplemental material for this article is available online.
References
Supplementary Material
Please find the following supplemental material available below.
For Open Access articles published under a Creative Commons License, all supplemental material carries the same license as the article it is associated with.
For non-Open Access articles published, all supplemental material carries a non-exclusive license, and permission requests for re-use of supplemental material or any part of supplemental material shall be sent directly to the copyright owner as specified in the copyright notice associated with the article.