
Abstract
From the climate crisis to biodiversity loss, interrelated crises of society–nature relations are linked to global growth in resource use, extractive expansion, and unequal distribution. Next to critical research on the socioeconomic issues of (de)globalization, a sociometabolic perspective on the extraction and trade of material and energy resources is therefore needed. Material extraction has surged dramatically since 1970, tripling from 31 Gigatons (Gt) to 96 Gt by 2019. The share of that extraction destined for trade has also increased. Fossil fuel usage in the global energy system has continued to rise, reaching a staggering 490 Exajoules in 2019. Because fossil fuels are not ubiquitously available, maintaining the fossil energy system requires trade. From a sociometabolic perspective, globalization is not in decline. Recently, however, global growth has coincided with new patterns in income-based country groupings, which this article details. But even as these patterns change, material and energy use remain globalized.
Introduction: Understanding Globalization in More Than Monetary Terms
Multiple, interrelated crises of society–nature relations—the climate emergency, the loss of biodiversity, the disruption of global biogeochemical cycles, for example—threaten or even outright eradicate human and more-than-human life on the Earth. Against this backdrop, interdisciplinary sustainability sciences 1 increasingly seek to understand the conditions under which destructive forms of societal organization emerged and interrogate whether these conditions present obstacles to socioecological transformations.
Globalization represents one such form of societal organization which has been discussed critically within the social sciences, especially in terms of its socioeconomic impacts. It has also been noted that the various elements of neoliberalization for which ‘globalization’ often serves as a catch-all term are essential in maintaining the growth-based capitalist system (Harvey, 2006). The role of the pursuit of economic growth in driving the expansion of extractive activities and the generation of wastes and emissions has been documented both conceptually and empirically (Haberl et al., 2020; Wiedenhofer et al., 2020). Such empirical analyses of the relation between socioeconomic variables and measures of resource use have relied, in part, on what I will refer to as a sociometabolic perspective. That is, a perspective that focusses on the material and energy inputs, stocks, and outputs required to sustain and reproduce a particular societal form (Fischer-Kowalski and Haberl, 1998). This perspective and the corresponding accounting for the material dimensions of economies crucially demonstrate that monetary indicators are only a poor proxy for environmental impact. Furthermore, by focusing solely on what is measurable financially, we may not be getting the full socioeconomic picture, either. My motivation in contributing a sociometabolic perspective to the discussion on globalization and deglobalization (cf. Olivié and Gracia, 2020; Postelnicu et al., 2015) is to offer insights on material and energy patterns that do not replace but are complementary to the in-depth analyses of monetary (trade) patterns. The sociometabolic perspective can aid us in determining whether contracting monetary trade (Van Bergeijk, 2009), as one of the commonly considered indicators of deglobalization (Abdal and Ferreira, 2021; García-Herrero, 2019; Postelnicu et al., 2015), coincides with declining material or energy trade. The sociometabolic perspective additionally provides insights on whether greater awareness around planetary boundaries or limits to growth, widespread resistance to expanding extractivism (Temper et al., 2015), and the climate emergency (Richards et al., 2021) have led to changes in global resource extraction and use.
This article builds on previous analyses of international patterns of resource use (e.g. Schaffartzik et al., 2014; Steinberger et al., 2010) including the question of the role that trade and production for trade play therein (Plank et al., 2018; Schaffartzik and Pichler, 2017). The empirical foundation is the United Nations Environment Program’s (UNEP) dataset on material resource use and the International Energy Agency’s (IEA) data on energy use for 1970 to 2017. While this period does not cover the Russian invasion of Ukraine or the COVID-19 pandemic, it does reach from the intensifying globalization of the 1990s, including the changing role of the Chinese economy, to the Great Recession of 2007/2008 and its aftermath. This empirical work forms the basis for a discussion of whether we are embarking on a new form of globalization or even de-globalization from a sociometabolic point of view. The approach is essentially quantitative and material, providing a basis for further integration with, on the one hand, quantitative studies focused on monetary indicators and, on the other hand, qualitative work on the subject of (de)globalization and the environment. Many of these aspects are covered in detail in other contributions to this special issue.
Revisiting Sociometabolic Research on Globalization
Empirical investigations into international resource use patterns are strongly informed by world-systems theory and aimed to expand the understanding of core and periphery through a sociometabolic perspective. In contributing to this research tradition, social metabolism research acknowledges that international inequalities, including ecologically unequal exchange (Dorninger et al., 2021) are not a product of the last few decades, but are rooted in colonialism and imperialism. Social metabolism studies were guided, in particular, by the understanding that resource extraction for export (extractivism) has been widely and violently required of the countries of the periphery (Bunker, 1984, 1985) so that high levels of extractive activity coincide with low levels of domestic resource consumption (Jorgenson and Rice, 2005). A prominent finding from this sociometabolic perspective was that countries or regions of the periphery and semiperiphery provide raw materials and primary commodities for the high-value-added production of secondary commodities and services in the core economies (e.g. Eisenmenger and Giljum, 2007; Kander et al., 2017; Mukherjee and Chakraborty, 2016; Oulu, 2016; Weisz, 2007). This argument was commonly made on the basis of three indicators: 1) income (measured as GDP per capita) as an indicator of relative monetary poverty or wealth, 2) the physical trade balance (PTB = imports minus exports) 2 as an indicator of whether a country was a source of or a sink for resources in the global economy, and 3) domestic material consumption (DMC = domestic extraction plus PTB) per capita as an indicator of relative material poverty or wealth. The core countries are characterized by net imports and high income, the periphery by net exports and low income (Dorninger et al., 2021; Schaffartzik and Krausmann, 2022; Schaffartzik and Pichler, 2017).
In this article, I develop a sociometabolic perspective on globalization and on whether that globalization is in decline. In so doing, I am concerned with a form of globalization that has nothing to do with producing where environmental impacts are lowest and distributing to where goods and services are needed most (which would require an intense and highly collaborative form of globalization) and has everything to do with the assertion of power over people and places as prerequisite to the making of profit and the accumulation of wealth (Fernández, 2018): capitalist globalization. Capitalist globalization corresponds to an extreme intensification of relations across levels of spatial scale (Sassen, 2007) that has been, often violently, imposed on human and more-than-human life (Valencia, 2018). Capitalist globalization leaves many people without protection against international imposition and forced to move (inter)nationally as they flee the consequences of these impositions (cf. Uhde, 2019). The current form of capitalist globalization entails not only the international mobility of commodities, capital, and labor, but—and this forms the basis for this mobility—the global transition to a fossil energy system (Pérez Orozco, 2022b; Schaffartzik and Fischer-Kowalski, 2018). The capitalist system requires fossil energy, just as the particular patterns of fossil energy use only ‘make sense’ under capitalism (Daggett, 2019). Fossil capitalist globalization relies on a deepening metabolic rift, that is, a widening chasm between extraction and production on the one hand and consumption on the other, which leads to a disruption of the reciprocity of society–nature relations (Kimmerer, 2013; Salleh, 2010; Schneider and McMichael, 2010).
This understanding of globalization, as fossil and capitalist, also applies to how we might study deglobalization. Does what is observed as deglobalization continue to support a capitalist economic system? There is a crucial difference between the shortening, regionalization, or even localization of supply and use chains in the spirit of a decomplexification of the global economy that allows for greater popular control over production and consumption (Pérez Orozco, 2022a) and the crises-induced obstacles to international trade and the ‘free flow’ of capital that perhaps lend themselves to securing the globalized (!), capitalist regime through other means. Undoubtedly ‘territory is in dispute’, but it matters very much what that dispute is operationalized in favor of and, if deglobalization does occur, then under whose control (Acker, 2004; Pérez Orozco, 2022b: 129, 132). Likewise, we must raise the question of whether what we study as deglobalization is characterized by a continuity in the structure of power relations, even if the actors who are in power change. In this sense, globalization is not in decline because it has ceased to uniformly favorable for all economies in the Global North (Pérez Orozco, 2022b: 76). Finally, what about the material and energy relations that have underpinned fossil capitalist globalization so far? Whether, in what we consider as a possible decline in globalization, these have fundamentally changed is the aspect on which I hope to shed light with my research.
The aim therein is not just to satisfy an academic curiosity, but—much more importantly—to contribute to informing activism and to supporting much-needed transformation (Capstick et al., 2022; Gardner et al., 2021). The strategy to overcome globalized capitalism with its far-reaching environmental destruction and rampant social inequalities depends on what globalization is (Salleh, 2010). The distance between the status quo and its alternatives depends on where we are now. Correspondingly, one of the underlying intentions of the research presented here is to offer a take on (de-)globalization that can further inform activism and movements in the space around alternatives to fossil capitalism, such a degrowth (Akbulut, 2021) or environmental justice movements (Ammons and Roy, 2015).
On the Analysis of Quantitative Material and Energy Data
The results presented and discussed in this article rest on the notion that society—in an analogy to a living organism—has a metabolism (Fischer-Kowalski and Haberl, 1998) and that this metabolism, that is, the material and energy inputs, throughputs, and outputs required to sustain a society, can be measured. For the purposes of this research, data freely available from the United Nations Environmental Program (UNEP) and the International Energy Agency (IEA) was used to calculate national physical trade balances and total energy supply at the national level.
Data Sources
Data on material extraction and trade were gathered from UNEP’s (2023) World Environment Situation Room. At the subglobal level, the most recent update provides data until 2019. However, compared to UNEP data up until 2017 (as published in 2021) and to Eurostat (2023) data for the member states of the European Union, several data points for 2018 and 2019 do not seem plausible. The analysis therefore considers global data for 1970–2019, keeping in mind that corrections to the two most recent years may be necessary in the future, and national data for 1970–2017.
A conundrum in environmental accounting, and in monetary national accounts as well (The Economist, 2011), is the mismatch between export and import data at the global level. Theoretically speaking, all reported exports should wind up as imports somewhere and, if it were not for the temporal scope, global imports should equal global exports. With the exception of those flows that are exported in one calendar year and not imported until the following year because of the amount of time it takes to transport them and/or because they are intermittently and internationally stored (as is the case for heavy fuel oil bunkered on carrier ships, for example) what one country reports as exports should be reported by another as imports (Schaffartzik et al., 2019). In the UNEP data set, the differences are most pronounced for fossil fuels which does suggest that, in fact, there are underlying real-world reasons (the bunkering of fuels) for these discrepancies. Nonetheless and even at the global level, it makes a difference whether we consider reported data on material exports or imports, and in this article, the difference between the two measures will be explicitly described where applicable.
For the purposes of my investigation into (potentially shifting) patterns of globalization, I will also revisit the current state of the global transition to a fossil energy system (cf. Schaffartzik and Fischer-Kowalski, 2018), relying on the IEA’s (2022) World Energy Balances. These offer fair coverage for the period 1990 to 2020 3 but only for OECD member and association countries. The difference in the samples for material and energy resources has been considered in the interpretation of the results. Overall, energy balances are available for 49 countries as well as a world aggregate, which provides some contextual information on the missing country-level data.
Data Manipulation and Aggregation
The UNEP data on imports and exports were used to calculate national physical trade balances in tons per year (t/a) at the national level by subtracting exports from imports. This calculation was performed for total trade as well as for products mainly from biomass, fossil fuels, metals, and non-metallic minerals. The IEA data on total energy supply were aggregated to reflect the contributions of fossil (coal, peat, oil shale, oil and natural gas liquids, natural gas), nuclear, renewables, and waste, as well as that form of energy for which the primary source could not be defined (source undefined) and acquired in the shape of the import of electricity or heat. A fossil energy physical trade balance (in Exajoules per year, EJ/a) was additionally calculated at the national level based on IEA data on imports and exports.
Some of the results in this article are presented for income-based country groupings. This is based on the initial assumption that while not a perfect match there may be a notable—if partial—overlap between the low-income countries and the periphery and the high-income countries and the core (see ‘Revisiting sociometabolic research on globalization’ section). These country groupings are operationalized following the World Bank’s (2016) definitions of high, upper middle, lower middle, and low income for the year 2010, based on gross national income (GNI) per capita. These groupings should not be interpreted to mean that high income corresponds to higher well-being, neither of the economy nor of its inhabitants, or that the development trajectory of the largest countries in terms of per capita GNI is to be emulated by others. In addition, and as this analysis will show, the groupings are not internally homogeneous.
Not Going With the Flow
The research presented here uses material flow accounting (MFA) as a tool operationalizing the social metabolism concept. MFA is well established within the system of national accounts and has relatively recently been harmonized internationally (Fischer-Kowalski et al., 2011). While I acknowledge the importance of this tool and the insights to be gained from its application, I have reservations when it comes to the term ‘material flow’. According to the Cambridge Dictionary, the verb flow means ‘to move in one direction, especially continuously and easily’ and the noun refers to ‘the movement of something in one direction’ as illustrated by the flow of a river, of blood, or of traffic (when it is not congested). Resources, 4 however, do not flow easily from the earth: It takes immense amounts or energy and force, often also violence (Navas et al., 2018), to accomplish the extraction. To enable imports and exports, likewise, requires energy, infrastructures, global power relations and their institutions as well as, again, violence. So, while I do rely on the tool of material flow accounting, I have sought to avoid the word flow, considering this precision of language to be part of the responsibility of the researcher in the communication of findings.
Results: A Global Look at Materials and Energy
Material Extraction and Trade
We may have more knowledge than ever before about the environmental and social repercussions of extractive expansion, but, globally, the extraction of resources is being increased incessantly (Figure 1, left). From a total of approximately 31 Gt in 1970, annual material extraction more than tripled by 2019—the last year for which consistent global data are available at the time of writing—and reached 96 Gt. The data in Figure 1 show that this tremendous growth has also involved a shift in the type of materials extracted for societal use. Globally, we are moving toward what has been termed the industrial metabolic regime (Schaffartzik et al., 2014), with decreasing shares of biomass and fossil fuels and increasing shares of metal ores and non-metallic minerals. The 2007/2008 Great Recession, with its profound but also differing impacts on the economies of the Global North (for an analysis of the European Union during this crisis see Schaffartzik and Duro, in press), was most noticeable as a single year of stagnation in nonmetallic mineral extraction, that is, mainly in the extraction of construction minerals used in bulk. These materials experience renewed stagnation between 2015 and 2018, but their extraction resumes growth until 2019. It will be very instructive to see what happens around the COVID-19 pandemic and its aftermath to assess whether there is any kind of more long-lasting structural change underpinning this pattern. Based on the time coverage currently available, the trend across all material categories is that of linear growth, strongest for the nonmetallic minerals, followed by biomass, fossil fuels, and metal ores.
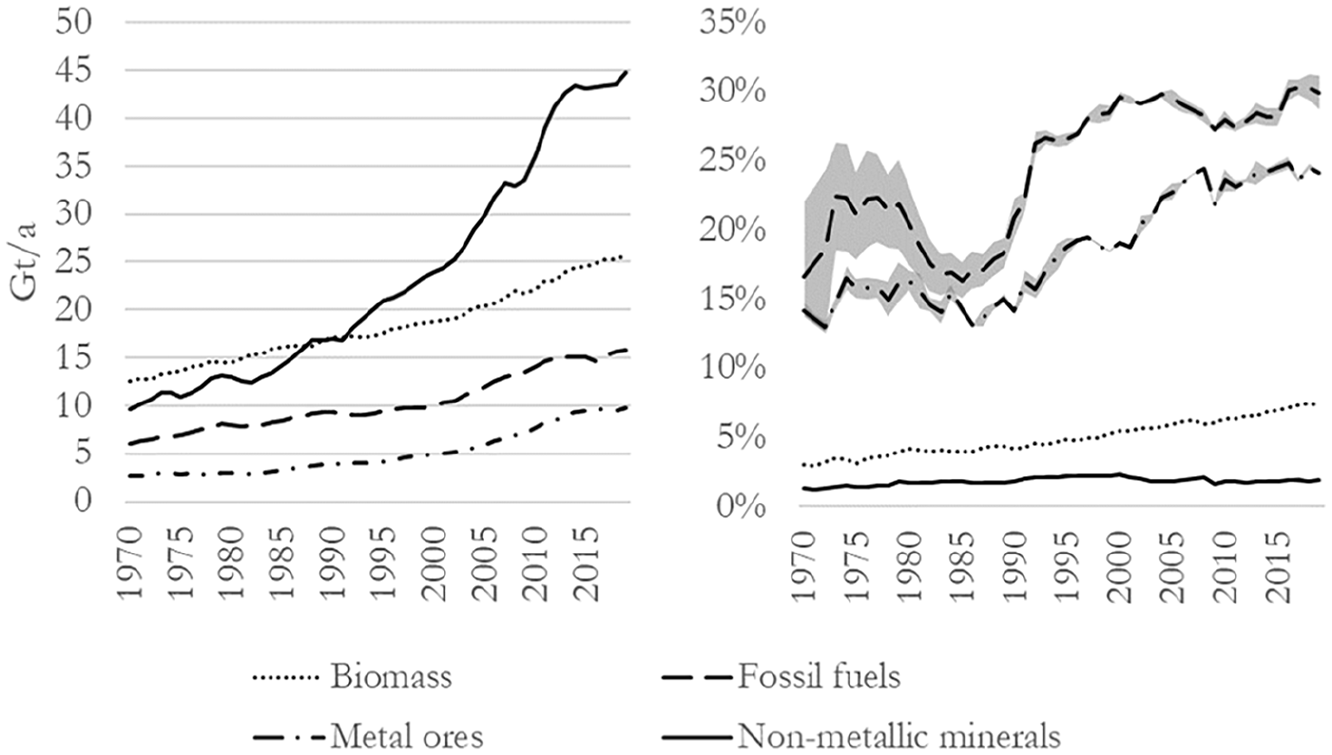
Left: Global extraction of nonmetallic minerals, biomass, fossil fuels, and metal ores in Gigatons (1 Gt = 109 tons) per year (Gt/a) between 1970 and 2019. Right: Share of global extraction traded (as average of imports and exports with range indicated in gray shading).
Especially fossil fuels and metal ores extracted are likely to be destined for trade (Figure 1, right). In 2019, almost one-third (29%–31%) of fossil fuels mined were trade; the same was true for approximately one quarter of metals ores (24%). Of all the biomass harvested, 7% was traded, and for nonmetallic minerals, this share was lowest at 2%. For both biomass and nonmetallic minerals (construction materials, in particular), this corresponds to what might be expected given the relatively ubiquitous production or availability of these materials and their comparatively low average prices. Here, it seems important to point out that at the global level considered here, we lose sight of the differences between countries dedicating almost all their extraction to export and those relying almost exclusively on imports for the same material. What is important in terms of the ongoing investigation of possible shifts in globalization patterns is the result that for all aggregate material groups, not only is the amount of material extracted increasing (Figure 1, left), but also the share of that increasing amount that is traded (Figure 1, right).
In contrast to what the global data might suggest, growth across the past half century was not an internationally homogeneous, much less harmonized, endeavor. Instead, the observed trajectory in material extraction and trade coincided with deepening international inequalities (Schaffartzik et al., 2019) and corresponding cementation of but also shifts in power relations and dependencies (Sassen, 2007). In material terms, globalization across this period meant different things for different economies (and of course also for the different segments of the population within those economies, which is, unfortunately, beyond the scope of this article). These differences become apparent even when considering four highly aggregated and heterogeneous income-based country groupings.
For metals (Figure 2, bottom left) and fossil fuels (Figure 2, bottom right), net-imports on the part of the high-income countries are enabled by net-exports from both the lower middle- and upper middle-income countries for most of this period. However, the high-income countries became net-exporters of metals in 2009 from when on the upper middle-income countries were the only net-importing country grouping. From 2006 onward, the trade in fossil fuels between the income-based country groupings has been decreasing markedly. Trade in fossil fuels and metals also tends to form a focal point for research as well as policy initiatives, acknowledging not just their material but also their geopolitical, strategic importance. Biomass and nonmetallic minerals are, of course, of extremely high importance to certain (sectors within) economies, but are generally more ubiquitously available and, on average, traded at lower prices. This, however, does not mean that their patterns are not of relevance to an analysis of the (changing) trajectory of globalization. Biomass followed the previously identified pattern of net-exports from middle-income countries for consumption in high-income countries only until 1979 (Figure 2, top left). For nonmetallic minerals, the high-income countries did not, as a group, become net-importers until the early 1980s (Figure 2, top right). As an interim result, there certainly seems to be evidence for something shifting in the international distribution of material extraction and trade since the early 21st century.
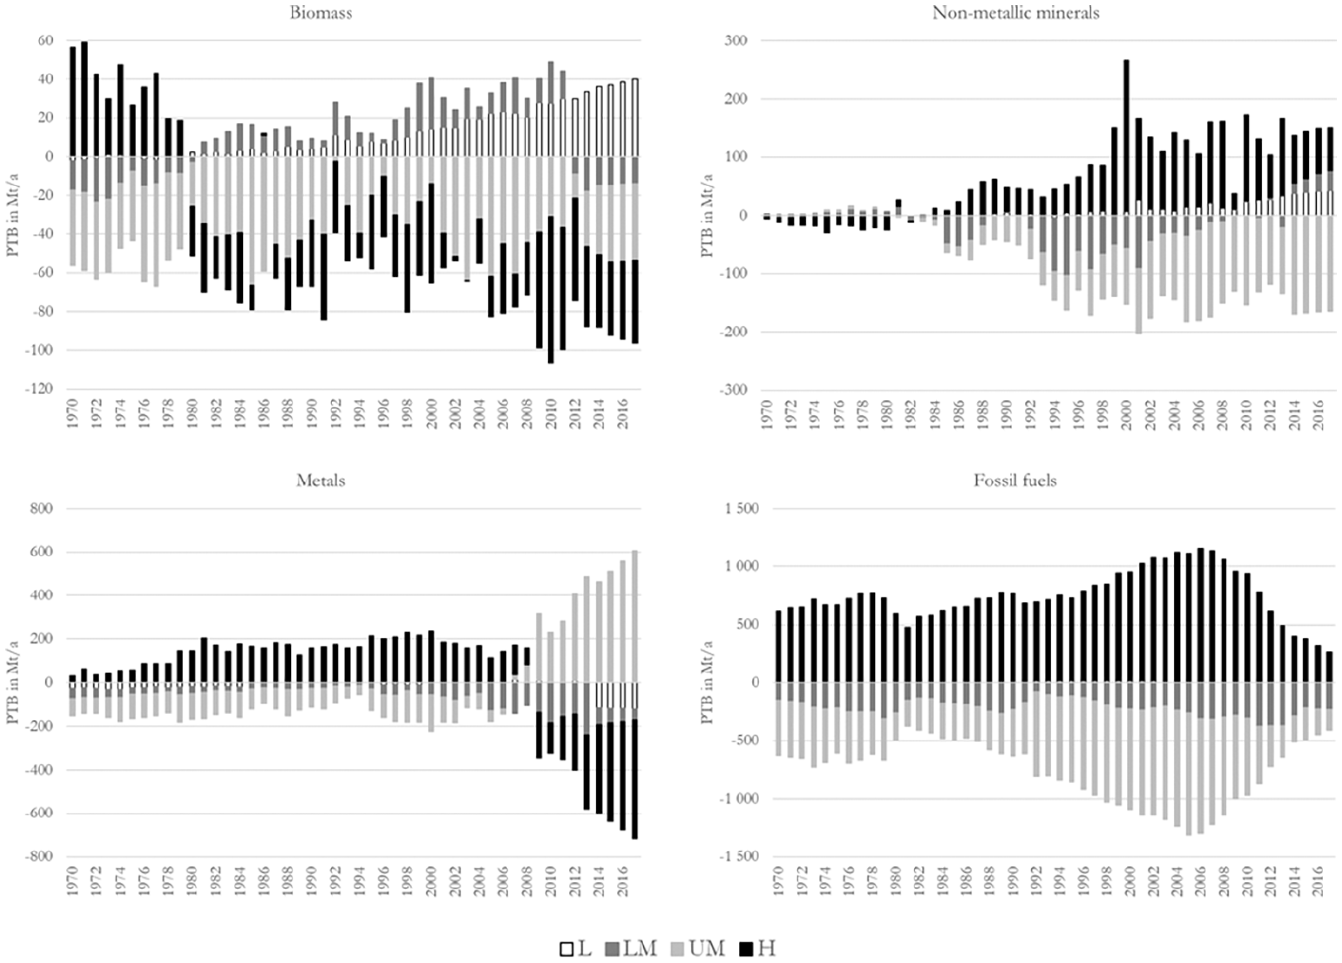
The physical trade balance (PTB = imports minus exports) in Megatons per year (Mt/a) by income-based country groupings, according to the World Bank (2016) definitions for the year 2010, and by four broad material categories for 1970–2017. Please note the differences in the scale of the y-axes.
Biomass
Of the four aggregated material categories, net trade of biomass has the lowest mass, meaning that its trends do not have much of an impact on the overall physical trade balance. This is due on the one hand to agriculture and forestry being relatively ubiquitous so that almost no country relies just on imports and on the other to the close links between population and biomass consumption (especially for nutrition) so that no country exports everything it produces. This is in addition to the importance of trade within the income-based country groupings which increasingly affects all materials. Just like the global trends (Figure 1) are the result of heterogeneous developments at the subglobal level, the trends observable at the level of income-based country groupings are the result of heterogeneous developments at the country level. By 2017, biomass was exported mainly by the United States, Brazil, and Canada; and these three countries together accounted for 28% of global biomass exports. The United States was also the second largest biomass importer, with China claiming the largest imports in this category and Germany coming in third. In terms of the trade balance, the rapid growth of exports of biomass from Brazil, especially since the turn of the century, is what results in the upper middle-income countries remaining a net-exporter, despite the growth of China’s imports.
The low-income countries, although at lower levels than the countries in the other country groupings, almost all experienced growth in their biomass imports. This occurred either consistently across the period of time under investigation or took off from the late 1990s. By 2017, approximately 25% of all biomass imports into the low-income countries were destined for Bangladesh, which imports mainly cereals and crop commodities, for example, flours or plant-based oils (Arman et al., 2023). In terms of its population, Bangladesh is a large and growing economy, in which even reduced growth in agricultural production (as other sectors are invested in more heavily) necessitates increased imports. While biomass exports also increased in the low-income countries, this occurred less rapidly than for imports and from 1980 onward, the low-income countries remained, as a group, net-importers of biomass. Together, Myanmar, Tanzania, and Uganda accounted for almost 40% of all exports from low-income countries. Myanmar features extremely low levels of material consumption (below 5 t/cap/a), more than half of the country’s energy supply is biomass-based and traditional use of biomass for energy (wood fuel) is highly prevalent (Tun and Juchelková, 2019). Nonetheless, the country has been increasingly exporting biomass, especially from 2000 onward and preceding the process of liberalization. While it has been suggested that in Tanzania, expansion of agricultural area is mainly due to subsistence uses, the country does rely on exported ‘cash crops’ including cashews, groundnuts, and tobacco (Doggart et al., 2020), and Tanzania’s exports have also been increasing quite steadily since the early 2000s. A similar trend can be observed in Uganda, where coffee is a financially important export crop (Sridharan et al., 2020).
At the same time, the lower middle-income countries also went from acting as net-exporters of biomass to net-importers around the same time as the low-income countries. However, from 2012 onward, they—as a group—once again acted as net-exporters. Extremely rapid growth of biomass exports from India from 2009 onwards, Indonesia from the early 1980s onward, and Ukraine from 2011 onward (together, these three countries account for over 60% of biomass exports from lower middle-income countries) are dominant in this shift, with rapidly increasing exports outstripping even these (and other lower middle-income) countries’ relatively significant imports.
Fossil Fuels
The Russian Federation emerged from the dissolution of the Soviet Union as the largest global exporter of fossil fuels and remained in this position across the period of time under investigation here. The European economies, in particular, are heavily reliant on Russian coal, oil, and natural gas. Indonesia, as a lower middle-income country, was the world’s largest exporter of coal during this time, followed by Australia. Up until 2010, when it was overtaken by China, Japan accounted for the largest fossil fuel imports. It was only in the early 2000s, however, that China’s imports began growing more strongly than India’s, which became the second largest importer of fossil fuels in 2017. Within the income-based country groupings, however, the Russian exports have remained larger than the Chinese imports, and the Indonesian exports have remained larger than the Indian imports, causing both the upper and the lower middle-income countries to appear as net exporters (Figure 2, bottom right).
Low-income countries are hardly involved in fossil fuel trade (to the extent that their very moderate and (since 2010) declining net-imports are not readily visible in Figure 2)—an impressive documentation of the degree to which the fossil fuel system is still expanding and the transition to fossil fuels constitutes the dominant currently ongoing energy transition. Kenya and Bangladesh together account for almost 30% of fossil fuel imports into the low-income countries. Only three low-income countries report significant fossil exports (and, together, account for 95% of this grouping’s exports): the DPR Korea, Myanmar, and Mozambique. Both the DPR Korea and Myanmar export fossil fuels mainly to China: In all likelihood refined petroleum (from crude petroleum imported from China) in the case of the DPR and oil as well as natural gas from Myanmar.
Among the lower middle-income countries, India’s imports of fossil fuels (crude petroleum and coal) have been growing, especially since the early 2000s, as have Indonesia’s (since the early 1990s, although at much lower levels by comparison). Important exporters among the lower middle-income countries are Indonesia, Iraq, and Nigeria. The upper middle-income countries’ imports of fossil fuels are shaped by what is imported into China, especially since the early 1990s. By 2017, China accounts for almost half of all fossil fuel imports into this country grouping. The most important exporter among the upper middle-income countries (accounting for over 40% of exports) is the Russian Federation.
The high-income countries have, for the most part, steadily increased their fossil fuel imports up until the early 2000s and then held them relatively constant at a high level by international comparison since. Or, fossil imports continued to grow across the entire period (e.g. Australia, the Netherlands, Republic of Korea). The biggest single-country impact on the high-income countries stems from the United States’ reduction in fossil fuel imports since the Great Recession of 2007/2008 (which coincided with a tremendous rise in the extraction of so-called ‘tight oil’ through hydraulic fracturing or fracking). Across the whole period, high-income countries such as Australia, Canada, and the Netherlands increased their fossil exports. Exports from the United States of America have been growing since the early 2000s, that is, before the onset of the Great Recession. Exports from Saudi Arabia remained relatively constant since the early 1990s. These trends at the national level show that trade in fossil fuels has not necessarily declined, as might be interpreted based on Figure 2 (bottom right). Instead, fossil fuels have increasingly been traded between the high-income countries (and the surge in second-tier fuels in North America, in particular, has been associated with a rise in extraction both for domestic consumption and export).
Metals
For metals trade, a rather dramatic shift between the income-based country groupings can be observed: Between 2006 and 2007, the upper middle-income countries went from net-exporting to net-importing at the same time that the high-income countries became net-exporters; during the final years of the time series, the low-income countries also became net-exporters (Figure 2, bottom left). At the country level (Figure 3), it can be discerned that the 2006–2007 shift is the result—not only but to quite some extent—of the tremendous growth of China’s imports not matched by equal growth in the country’s nor by Brazil’s growing exports. The 2008–2009 shift of high-income countries from net-importers to net-exporters rests in large part on the growth of Australia’s exports, which, in 2017, reached a level corresponding to 70% of China’s imports. 5 By 2017, almost 60% of metal exports from high-income countries stemmed from Australia (with the remaining 44 countries in the group all contributing at the level of 4% or less). And, despite the group overall acting as a net-exporter, there are also high-income countries which rely heavily on imports. Approximately half of all metal imports into high-income countries go to just four of them: Japan, the Republic of Korea, Germany, and the United States. Brazil, China, and South Africa account for over 70% of exports of metals from upper middle-income countries but China’s imports (corresponding to 84% of imports of metals into upper middle-income countries), in particular, shape the role of this grouping as a net-importer. Almost 80% of the metal exports from lower middle-income countries, which acted as suppliers to the high-/upper-middle countries across the time series, stem from just four countries in 2017: the Philippines, Ukraine, Indonesia, and India. The exports that drive the shift in the role of the low-income countries (Figure 2, bottom left) mainly stem from Mozambique and, to a lesser extent, from Guinea. Mozambique exports a variety of metals, including gold, aluminum, and tantalum, to Europe (including the United Kingdom) and Singapore.
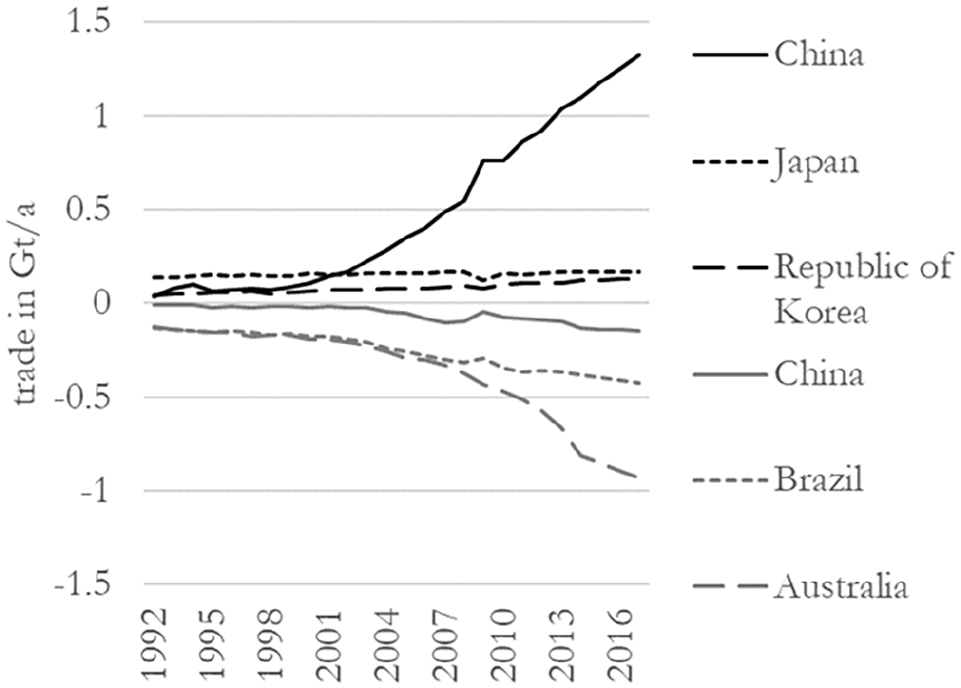
Metal trade flows between 1992 and 2017 at the country level for the top three importers (China, Japan, and the Republic of Korea) and the top three exporters (Australia, Brazil, and China) in 2017. Trade is depicted in Gigatons per year (Gt/a) and the exports are represented as negative values.
Nonmetallic Minerals
For nonmetallic minerals, that is, mainly construction materials used in bulk, trade is on the rise, with industrialization and the associated buildings and infrastructures requiring increasing access to these materials. The peak in the high-income countries’ net-imports of nonmetallic minerals that can be observed in 2000 (Figure 2, top right) is due to the peak in the data on imports into Singapore in that same year. While it will be necessary to test this data point, it is true that there was a frenzy of construction activity in the city during that time (buildings, transportation infrastructures), the materials for which had to be imported. Other main importers of nonmetallic minerals are Russia and Canada. The major exporter of nonmetallic minerals, especially since 2001, has been China, followed by the United Arab Emirates and Germany. While China experts a diversity of nonmetallic minerals, some of which are also used in construction, but in smaller amounts, the other two countries’ industries in this area are more clearly dominated by cement production for export.
As the data on income-based country groupings (Figure 2) suggested, there have been some remarkable shifts in terms of national economies that act either as global suppliers or consumers of specific materials. At this level of observation, the large extractive economies, whether they are classified as middle-income, such as Brazil, China, India, Indonesia, and Russia or as high-income, such as Australia, Canada, and the United States, have the strongest impacts on (changing) trade patterns. Generally, the picture is not one of decreasing trade flows but, to some extent, of greater trade flows within the income-based groupings (which are not visible when trade balances are computed at this level of aggregation as was done for the results presented in Figure 2).
The Global Fossil Energy System
So far, the environmental destruction with which the previous path of capitalist globalization was associated has not led to a curbing of resource extraction (Figure 1). Likewise, the climate emergency, induced in large parts by the combustion of fossil fuels, has not led to a global energy transition. Because fossil fuels are not ubiquitously available, the maintenance or expansion of a fossil energy system presupposes continued trade relations between those countries that have fossil fuels on their territory and those that do not. In this sense, the persistence of the fossil energy system is an important indicator for whether or not we can expect to see a decline in globalization.
In fact, energy supply from fossil fuels is on the rise, reaching an all-time high of 490 EJ in 2019. As can be seen in Figure 4, fossil total energy supply (TES) was slightly lower in 2020 (at 470 EJ), but it remains to be seen whether this might be the beginning of an actual shift in the energy system or whether, like the slight dip around the 2007/2008 economic crisis, we will see renewed growth or sustained high levels of fossil combustion. TES from renewables and waste has exhibited linear growth across the period under investigation here, as has nuclear energy (but at a much slower rate than has been the case for fossil TES). Based on this rather cursory examination of global trends, it does not seem like any fundamental change to the global energy system is underway.
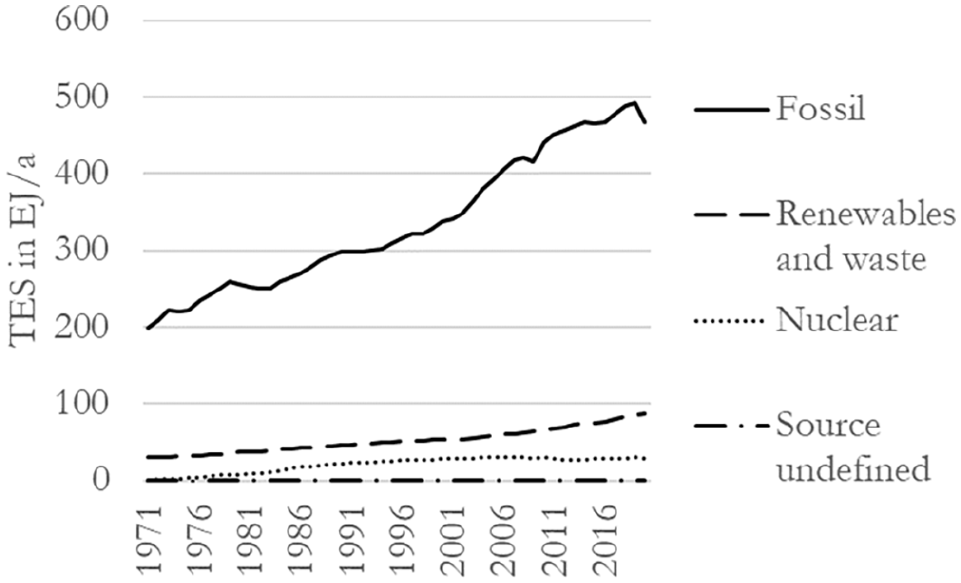
Global total energy supply (TES) that is production plus imports minus exports minus bunkers plus net additions to stock in Exajoules per year (EJ/a, 1 EJ = 1018 joules) by broad energy categories.
But surely, there must be a reason why the discourse around an energy transition in the Global North so clearly seems to focus on a (not globally ongoing) transition away from fossil fuels and to renewables rather than on the transition to an expanded fossil energy system for which there is in fact evidence at the global level? If we take a somewhat closer look at TES by broad energy categories and income-based country groupings, we find that while we should certainly be discussing the need for an energy transition in the high-income countries, their current trajectory does not merit the equation of the energy transition with a transition to renewables. Fossil energy supply in the high-income countries remains at a concerningly high level above 150 EJ/a across the decades under investigation here and only began to decline gradually after it had reached more than 181 EJ in 2007. Compared to almost 80% of TES that stem from fossil fuels in the high-income countries, renewables and nuclear make rather modest contributions of about 10% each in 2020 (Figure 5, top left). In the upper middle-income countries, fossil TES exhibits strong linear growth between 1990 and 2020 so that by the end of this time series, 84% of TES stems from fossil, 13% from renewables and waste, and 2% from nuclear. This corresponds to an increasingly dominant role of fossil fuels in TES and a reduction of the share of renewables (Figure 5, top right). The lower middle-income countries represent a similar trajectory to the upper middle-income countries, although at lower levels of total TES: TES reaches 54 EJ in 2020, of which ¾ stem from fossil sources (Figure 5, bottom left). The data on the rest of the world (Figure 5, bottom right), that is, those countries not included in the previously discussed three income-based country groupings, must be interpreted with caution, as it includes all the low-income countries, but also a number of middle- and high-income countries. What does become clear from this data, however, is that this very heterogeneous group is also not harboring a transition to renewable energy as the ongoing energy transition. Based on this look at energy supply patterns, it would certainly be amiss to conclude that the climate emergency (and other forms of environmental destruction) has led to a shift in the globalized fossil energy system. If anything, it seems that this system has continued to expand until at least the very end of the time period for which data are currently available. This also means that whatever (new) shape globalization takes on, it does seem to require an intensification of trade in fossil fuels.
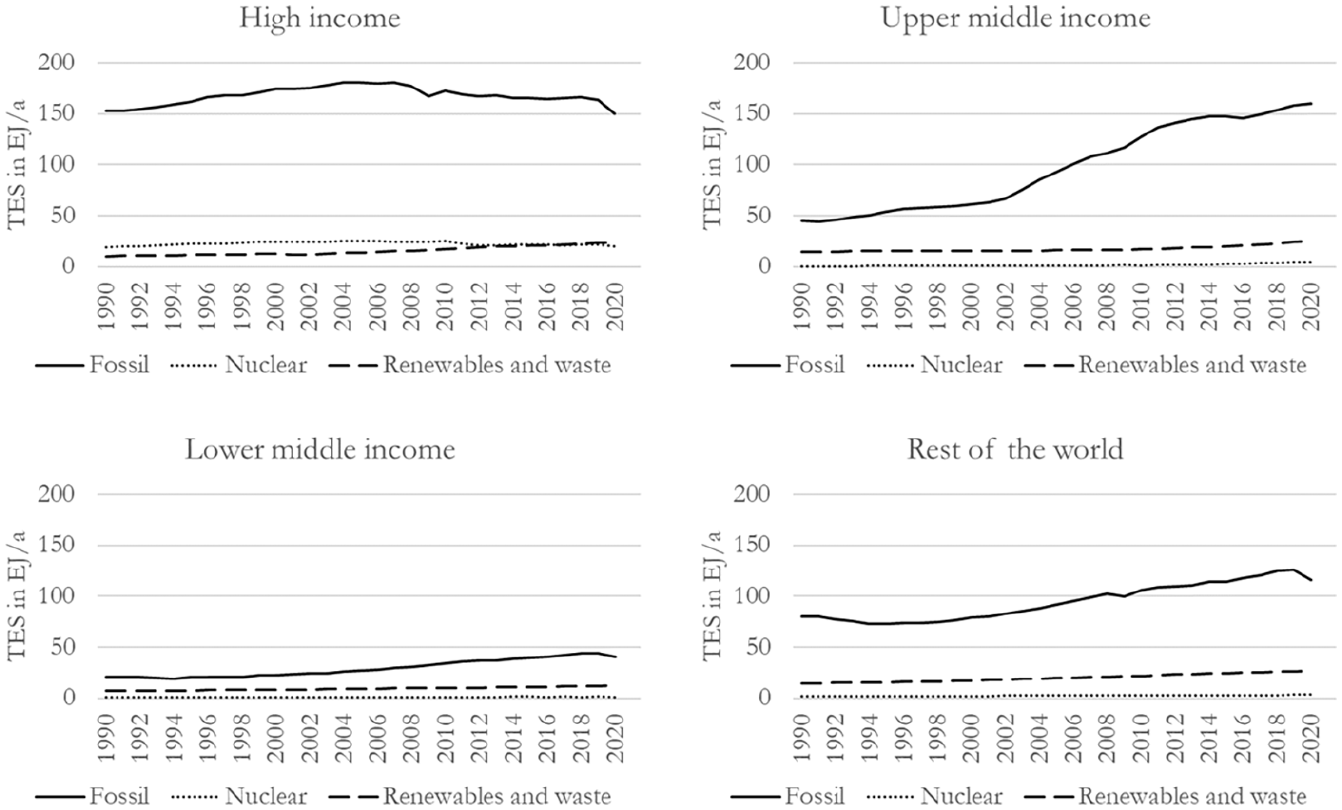
Total energy supply (TES) in Exajoules per year (EJ/a, 1 EJ = 1018 joules) by income-based country groupings and broad energy categories for 1990–2020. The scaling of the y-axes has been harmonized across country groupings. The rest of the world grouping contains all the low-income countries, but also a number of middle- and high-income countries which are not individually covered in this dataset.
In light of the globalized nature of the fossil energy system, it seems worthwhile to make an attempt to discern the international ties on which the presented levels of energy supply are based. Especially the high-income countries are heavily reliant on international trade to source their fossil TES and also to ‘sink’ their fossil energy production. Imports into this country grouping are higher than for any of the other three groups and the high-income countries have consistently acted as net-importers across the period under investigation here. The decline in the physical trade balance (PTB) for fossil energy during the last decade is largely due to an increase in exports, alongside a decrease in imports, that is, here, a relatively small PTB is the result of high imports and exports (Figure 6, top left). The PTB for the upper middle-income countries (Figure 6, top right) is slightly larger than that of the high-income countries but is the result of much smaller imports and exports, with especially the imports exhibiting significant growth across these four decades. The lower middle-income countries exhibit similar patterns, although at a slightly lower level and with a lower PTB (Figure 6, bottom left). Since all three income-based country groupings appear as net-importers (their PTBs are positive), net-exports must be coming from somewhere and that somewhere is, in this case, the rest of the world. Despite its heterogeneity, it is therefore important to consider this category. What these data reflect is that those countries which currently supply the world with fossil energy are not OECD members nor associates (and are therefore not individually included in this dataset compiled by the IEA). Even though trade within income-based country groupings, especially within the high-income countries, has become increasingly important since 1990, the global fossil energy system continues to be heavily reliant on those countries which act as net-exporters of fossil energy.
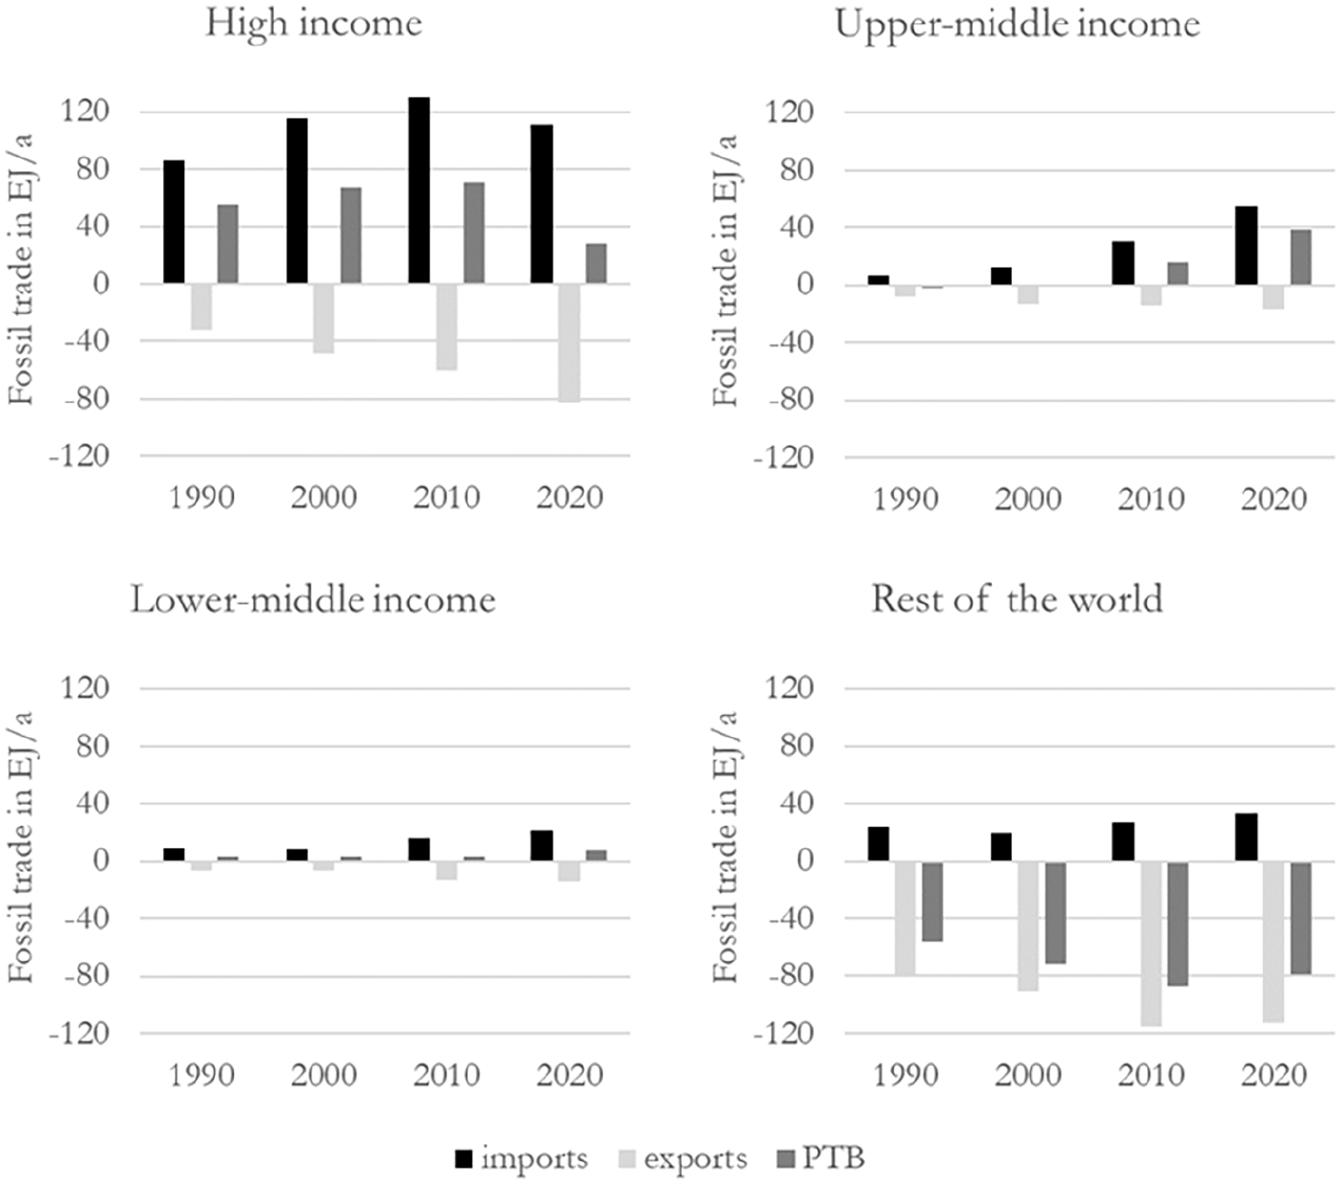
Trade (imports, exports, and physical trade balance PTB = imports minus exports) in fossil energy sources in Exajoules per year (EJ/a, 1 EJ = 1018 joules) by income-based country groupings. The rest of the world grouping contains all the low-income countries, but also a number of middle- and high-income countries which are not individually covered in this dataset.
Discussion and Conclusion
The discussion of the results offered here focuses on two aspects crucial to addressing the overall research aim associated with this article. The first is the question of what we can learn about (de)globalization from a sociometabolic perspective (and about international material and energy use patterns against the backdrop of (de)globalization). The second is what, if anything, can be gained from this discussion that might be useful for activism geared toward transformation.
What Can We Learn From Materials and Energy?
Globally, the data on material and energy use patterns are not indicative of any systemic transformation: not of reduction and not of fundamental redistribution, including through international trade. This is sobering, to say the least. Especially, if we take into account that much lower amounts of extraction (globally) were already contested with good reason (Temper et al., 2015), especially if we recognize the need to pivot away from a high-generation fossil energy system given the present climate emergency (Richards et al., 2021).
This is not to say, however, that from a sociometabolic perspective, nothing has changed. Especially since the Great Recession (or somewhere in that temporal vicinity), a shift in international trade patterns has occurred, as seen through the lens of income-based country groupings. Corresponding to their conceptual interpretation as the core countries of the world system (see ‘Revisiting sociometabolic research on globalization’ section), the high-income countries were net-importers of almost all materials and (fossil) energy for most of the time between 1970 and 2017/2020. The role of periphery is assigned to not the low-income but middle-income countries, which supplied the corresponding net-exporters. This is part of the material arrangement that allows the generally high-income countries of the core to focus on higher value-added production of secondary commodities and services (Eisenmenger and Giljum, 2007; Oulu, 2016). The shift that occurred was not a decline in trade (from a sociometabolic perspective) but that, as a group, the high-income countries became net-exporters of metals (and, to a lesser extent, biomass), while the middle-income countries became net-importers. A slightly more granular consideration of the countries within the income-based groupings suggests that while there may be a push for deglobalization on the part of individual high-income countries (the United States of America, in particular), this is not part of a systemic shift that may be interpreted as the decomplexification of the global economy that Pérez Orozco (2022a) discusses.
In ‘Revisiting sociometabolic research on globalization’ section, I argued that if there is no systematic and global shift away from the fossil energy system, it is doubtful that we can see something akin to deglobalization from a sociometabolic perspective. Aside from the trajectory of uninterrupted growth in global fossil energy supply that I outlined in ‘The global fossil energy system’ section, it is the interplay between material and energy use that makes me question such a shift, even in the last two years of the time series. As was made apparent in ‘Material extraction and trade’ section (Figure 1), significant growth can be observed in the global use of nonmetallic minerals, the majority of which consist of construction materials used in bulk. Decades of increasing extraction of such construction materials correspond to decades of building up the material stocks of which the fossil energy system (also) consists (Schaffartzik et al., 2021). These stocks include, but are not limited to, airports and runways, roads for individualized motor-vehicle transport, built-up areas more generally, and even the odd coal-fired power plant. It was years ago when simply using the fossil infrastructures that were already in place to the end of their planned lifetime would have put us well outside any chance to limit planetary heating to 1.5 degree Celsius (Tong et al., 2019)—and so much more has been built up since then. Certainly, the structural interlinkages between nonmetallic minerals on the one hand and not only fossil fuels, but also metals, on the other, merit further research in order to understand what it is that we are (quite literally) digging ourselves into.
While I have focused my analysis on a material and energy perspective, it is clear that, in order to better understand current capitalist globalization dynamics, this must not be disconnected from the monetary perspective. At the most basic level, the connection is given through (inter)nationally variable prices. These prices are shaped by global power relations and yield competitive advantages or disadvantages in global markets, with important implications not only for (national) economic trajectories but also for resource use patterns. Hence, new risks associated with the current phase of globalization might come into view when we consider that the contraction of (monetary) trade volumes coincides with extractivist expansion from sociometabolic perspective.
Finally, in considering the material and energy data from the perspective of (de)globalization research, we may also learn something new about sociometabolic patterns. The data presented in this article suggests that the previous sociometabolic narratives (high-income countries as net-importers, middle-income countries as net-exporters) no longer accurately represent globalization’s current phase. What the comparison of country grouping results with national-level trends shows is that growth patterns (those exporting export more, those importing import more or at least the same high amounts) have led to increasingly marked differences not just between but also within the income-based country groupings. This, too, merits further analysis.
What Insights for Transformative Activism?
This article is, of course and unfortunately in equal measure, unable to provide an effective strategy for transformative activism toward an alternative to globalized fossil capitalism. And yet, the insights that it offers, even at the very aggregate global and country-grouping levels, are not without consequences for how we might conceptualize a transformative way forward.
The first of these insights is that clearly, material and energy use patterns continue to be highly globalized, in the sense of globalization as capitalist, power-ridden, and environmental, as it was introduced in ‘Revisiting sociometabolic research on globalization’ section. These results remind us to not limit our understanding of the world of what we observe to be happening in (select) countries of the Global North. As researchers from these countries, we (and I include myself in this group) have made this mistake before: It is documented in all those articles which concluded that we have a limited window of opportunity in which we can affect purposeful change toward a transformation before crisis, conflict, and collapse force our hand. In those conclusions, we ignored, of course, that we were part of an extremely privileged minority which could leave this figurative window open. For the majority of the world population, crisis, conflict, and collapse were already right outside their door.
Second, and based on acknowledging that change will not come easy, a closer look at material and energy data also reveals to us where we might intervene to (eventually) curb global resource use. On the one hand, the build-up of further fossil-fueled infrastructures must cease, especially in and on behalf of the high-income countries. And, on the other hand, not only must global fossil energy use be reduced, but also be redistributed (in space and time). This might seem self-evident, but there is no evidence in the data of any form of implementation.
Given the amount of data gathered and processed and interpreted and described for this article, these insights for transformative activism are a meager harvest. But maybe sometimes this can also be the role of academia: to acknowledge that we do all of our reading and thinking and analyzing only to get to the point that environmental and climate justice movements were already at long ago, to acknowledge that we need to reduce and redistribute resource use.