
Abstract
The paper employs a multimethod approach to investigate shifts from globalization to deglobalization, presenting a novel economic theory grounded in recent data. It identifies two mechanisms driving structural deglobalization: escalating costs and diminishing benefits at the national level, hindering redistribution efforts and the challenge to sustain global public goods due to waning economic hegemony. The analysis integrates perspectives from international economics, history, hegemonic stability theory and world system theory through narrative review, descriptive statistics and econometric analyses. The multimethod examination emphasizes the complexities of deglobalization, involving international relations, history and economics. Democracy and trade composition emerge as significant factors influencing deglobalization, with varying impacts across historical contexts. Despite this, the resilience of world trade to deglobalization appears to have increased over time. The study underscores the necessity of blending methodologies from different disciplines for a comprehensive understanding of deglobalization and proposes avenues for further research in this complex, multidimensional phenomenon.
Keywords
Introduction
The critical debate on globalization and deglobalization is one of those instances where we can clearly see the ebb and flow of ideas in the social sciences. Post–Second World War generations by and large have lived in the era of globalization. The tide, however, seems to have turned following the Great Recession of 2008, with the lockdowns of the COVID-19 pandemic and the trade impact of the wars on Ukraine and Gaza strengthening the downturn. In this article, I will not be concerned with normative analyses and ideological content of deglobalization but with what in the spirit of Chase-Dunn et al. (2000) could best be labelled ‘structural deglobalization’, that is an assessment of the world economic system based on ‘objective’ data. 1 When I started to work on deglobalization (Van Bergeijk, 2009, 2010), I was not aware of the World Systems Approach and developed my analysis based on economic principles but a decade later I had recovered and was able to incorporate this perspective with some modifications in my work on the historical comparison of the 1930s and our current era, that I labelled Deglobalization 1.0 and 2.0, respectively (Van Bergeijk, 2019). Research in the field of World Systems Perspective continues to be a source of inspiration and provides a check on the plausibility and appropriateness of analyses in the economic domain also because deglobalization and globalization are clearly concepts that benefit from an analysis through different lenses. Quite a few methodological lessons from the World System Approach are taken to heart in this paper: the analysis evaluates both global and national levels, applies a long-run and comparative perspective and acknowledges the significant measurement issues in the economic domain (and follows some solutions suggested in this literature). Some elements are difficult to operationalize empirically for a sufficiently large sample (e.g. one would like to include income distribution and asset accumulation), but still, as will become clear we can learn much from the comparative analysis of the two major phases of deglobalization. This is a new perspective, indeed. For long and perhaps by necessity the 1930s were seen as a unique event that could only be studied as a subject of (economic) history. Even today the mainstream approach to the phenomenon of (de)globalization continues to be by and large focused on a single period, this time driven by the greater availability of data in the post–Second World War period (Van Bergeijk, 2018b) but also because of the perceived uniqueness of the Great Recession, for example, from a Global Capitalism Perspective (Robinson, 2012).
This paper adds to the expanding literature on globalization by providing, first, a historical comparison of global (socio)economic-political conditions akin to Kondratieff’s (1935) long-wave analysis. Second, focusing on the turning point (the onset of deglobalization), the paper econometrically analyses a country panel for the 1930s and the period following the Great Recession. Third, the paper observes the increasing resilience of the world economy to large structural deglobalization shocks.
This paper departs from the World Systems approach as it provides an economic theory that helps to understand the occurrence of structural deglobalization after a period of increasing openness. The focus is thus on the turning point (or phase) from globalization to deglobalization, offering two mechanisms that both relate to the same economic principle, namely that the intensity of structural globalization is determined by the marginal costs and marginal benefits of further globalization. At some intensity marginal costs of further globalization will exceed marginal benefits and this drives a reorientation of the world economic system. The theoretical basis for the occurrence of turning points is thus that phases of strong globalization carry the seeds of their own destruction. Indeed, phases of strong globalization generate two forces that ultimately set limits and force a retreat from globalization. The first mechanism works at the level of individual countries: the costs of globalization increase, the benefits decrease and redistributing the gains from further openness to the discontents of globalization (Stiglitz, 2002, 2018) becomes more difficult at higher levels of globalization. The World System Approach stimulates focus on the institutions behind these processes and motivates to look at the political system. Importantly processes of accesses of accumulation are uneven both between and within countries. In a democracy, distributional issues play a more important and open role, while in an autocracy, contestation of concentrated power, assets and income is difficult. The second mechanism operates in the international arena and is based on the theory of collective action (Olson, 1965, 1982) and also relates to theories of economic hegemonism (Kindleberger, 1981, 1986) and fits with the focus of the World System’s Approach on processes of uneven accumulation across nations. Globalization requires the presence of certain global public goods at a sufficient level and quality. The production of global public goods arguably requires an economic hegemon (in the sense of a leading nation that sets the rules of the game) with sufficient clout both to initiate and to maintain the norms, values, standards and so on that, at the same time, underpin the working of a globalizing world economy and in the longer run enable the rise of contestants that undercut the dominant position of the incumbent hegemon. Here my economic theory is inspired by the role that key actors (the hegemon) and the contestants (labelled ‘the Periphery’ in the 1930s and nowadays the ‘Global South’) play in World System discussions.
Although the argument is economic, it is, thus, not my intention to stay away from other fields of enquiry and remain in the economic domain, because deglobalization is at the interface of international relations, history and international economics. Indeed, it is already well recognized that globalization occurs in three interrelated arenas: economic, social and political (Gygli et al., 2019). The same is, of course, true for deglobalization.
The high tide of globalization and the low tide of deglobalization reach the shores of different epistemological communities at different moments in time. In international economics in the early 1990s when the world was in the flood tide of globalization observers were uncertain about where the world was going. For example, Paul Krugman (1996), surfing the globalization wave observed:
we read all the time about how modern transportation and communication have made it possible to ‘explode the value chain’ . . . Why doesn’t all this to-ing and fro-ing lead to vastly more trade than the more prosaic manufacturing processes of the late nineteenth century? (p. 212)
Currently, we seem to be in the ebb tide, but this is by no means certain and there is a wide-ranging debate. Indeed, there is considerable skepsis about the questions whether deglobalization is occurring and, if so, whether this matters (e.g. Bordo, 2017; Constantinescu et al., 2016; Lund and Tyson, 2018; Martin, 2018). Of course, observation and analysis around turning points of a cycle are difficult because data are contradictory giving rise to cognitive dissonance while new ideas – as they did and/or do not fit the prevailing paradigm – have difficulty to gain ground.
Figure 1, by way of illustration, shows the development of the openness of the world economy over the years 1880–2025 (incorporating the most recent International Monetary Fund (IMF) forecasts). 2 This graph typically is shown on social media with a starting date in 1950 and has been dubbed ‘the “lazy” peak globalisation narrative’ (Baldwin, 2022). 3 Baldwin argues that by focusing on international trade the debate misses large scale social economic and technological connectedness in international value chains and thus overlooks that structural globalization has changed in character, but still continues its pace in different modes of interaction.
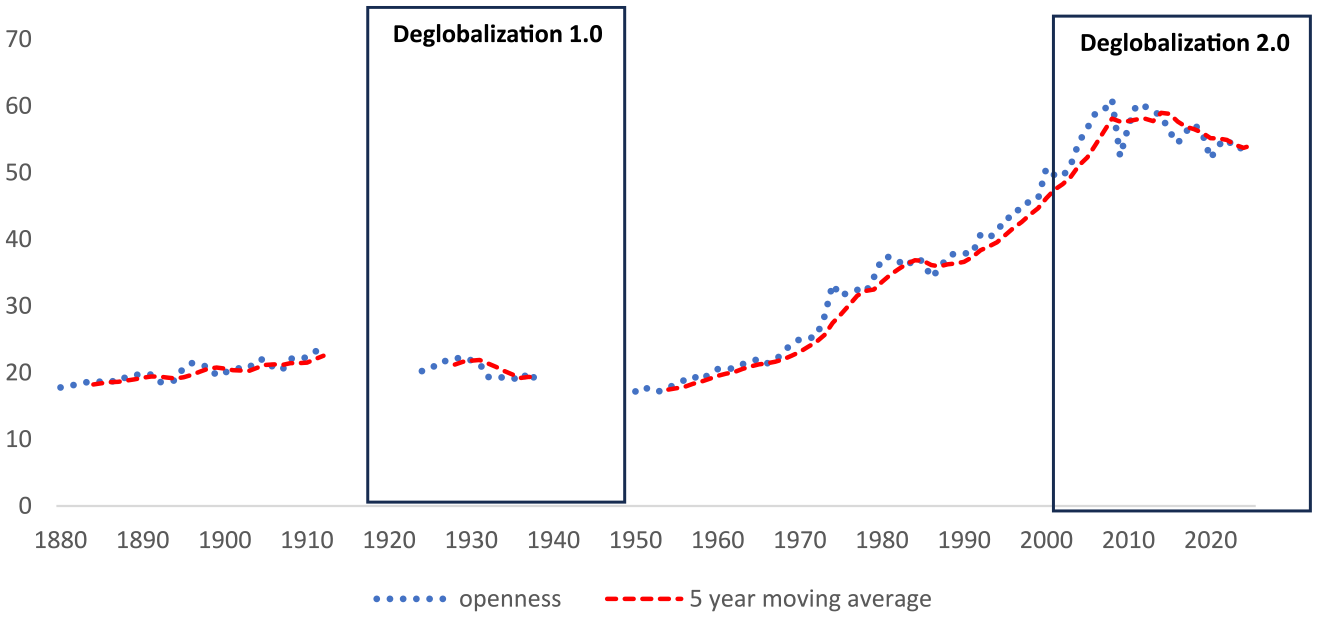
World trade in percent of world production (1880–2025).
My measure for openness has admittedly many drawbacks as it compares a turnover number (imports) with a value-added number (gross planet product or GPP) 4 and does not capture the detailed analysis of openness that is possible with sophisticated indicators for trade flows and barriers available for the post–Second World War period. 5 Consider Figure 2 that shows the most recent version of the comprehensive economic, social and political globalization indicators of large-scale international connectedness maintained by the Swiss KOF Konjunkturforschungsstelle of ETH Zurich covering 1970–2021. KOF measures globalization along many sub-dimensions and both on a de jure and de facto basis and uses a complex weighting scheme to arrive at overall measures of globalization in different arenas. The lines in Figure 2 report overall measures for three arenas: economic globalization stagnated since 2008, social globalization peaked in 2018 and political globalization continues although at a slower pace since 2008. The band in Figure 2 covers all sub-indicators and illustrates an important qualitative aspect, namely, the increasing heterogeneity of the underlying measures of different aspects of globalization since 2008.
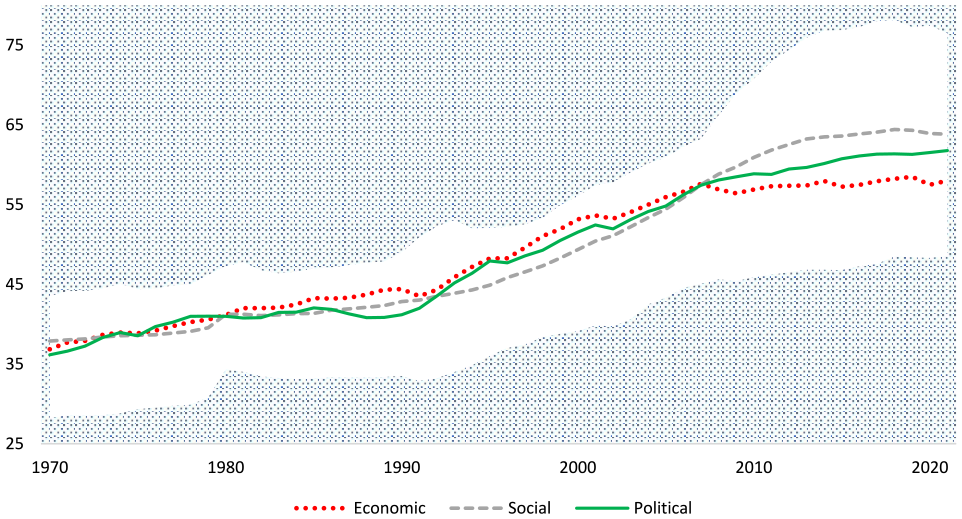
KOF globalization indicators 1970–2021.
In comparison with the KOF index, three benefits of Figure 1 should be noted. First, we know the direction of bias in the trade-to-GPP ratio: due to the fragmentation of international value chains, intermediate goods cross international borders many times and are registered each time in the trade statistics inflating the ratio. A reduction of the ratio is thus more informative than an increase. Second, the trade-to-GPP ratio is available for a much longer period, thus enabling a comparative analysis of periods of deglobalization. Third, to glean where the world economy heads, we can use IMF forecasts for the world economy that currently cover the years 2024–2025, inclusive, adding a new perspective on a recent paper by Chase-Dunn et al. (2023), that covers the period 1830–2021, inclusive. 6 IMF forecasts are inaccurate and uncertain as any economic data (Van Bergeijk, 2024), but to understand the economic debate on structural deglobalization it is useful to know what the economic profession thinks to see in its crystal ball. The fortune telling segment of Figure 1 reveals a downward hovering trade-to-GPP ratio. It is unrealistic to expect recovery to the previous peak level in the current decade. On balance, the price of using the simple trade-to-production-ratio seems worth paying for the broadening of the time perspective.
Deglobalization is a multidimensional phenomenon observed only over long timespans and therefore the use of different lenses and theories is important for its study. Blending best practices on measurement of structural deglobalization from different scientific fields (international economics, history and world system theory) the article therefore follows a multimethod approach. This introduction provides stylized facts. The ‘Mechanisms’ section discusses mechanisms. The ‘Globality and Deglobality’ section provides a narrative review of literature discussing the context of the turning points from globalization to deglobalization. The ‘Econometric Findings’ section summarizes an econometric analysis of these turning points. The ‘The Major Difference: Resilience of World Trade’ section provides comparative stylized facts for world trade’s resilience. The ‘Caveats, Conclusions and Outlook’ section discusses the costs of the approach and triangulation differentiates the trust that can have in the individual findings of this study. Issues for further research are suggested.
Mechanisms
World trade since 1880 was mostly on an upward trajectory and the reasons why firms expand their markets, economies integrate, and how this is facilitated and underpinned by policy views (such as the Washington Consensus) and political and class aspirations (transnational capitalism) are well understood. In contrast, contractions of world trade are infrequent: only 10% of annual real growth rates of world trade since 1880 are negative. Real annual contractions of world trade, have in line with this frequency been observed twice since the start of the millennium – during the Great Recession in 2008–2009 and the COVID-19 pandemic in 2020–2021; a third contraction in 2023–2024 is a realistic possibility. 7 These stylized facts by and large explain both why the literature on globalization is much more developed that the literature on deglobalization, as well as why the interest in deglobalization is recently growing.
The literature on globalization has already identified several phases starting with the Great Discoveries. There is of course discussion about the exact dating, but there is consensus that globalization comes in waves (Chase-Dunn et al., 2000). My contribution to this debate is the point that deglobalization may also come in waves, in particular in the form of a long wave of several decades. This hypothesis that phases of globalization and deglobalization alternate is illustrated by Figure 3 (the dashed red line is the long-run trend fitted to the data for 1880–1914 and extrapolated for later years). The high tides of globalization occur before the start of the First World War and the outbreak of the Great Recession; the 1950s are the low ebb of deglobalization. There is obviously a significant problem with these eye-o-metrics. We see the wave and that has a powerful impact on our thinking, but we need to realize that this is one wave only and for science one is simply not enough. So, we will have to see how the world economy and its openness develop in the next decades to see if the hypothesis makes sense or is to be refuted. From an economic perspective the increasing trend of globalization is thus not the actual research puzzle since the upward trend in openness reflects technological and logistic progress that has reduced trade and travel costs enormously. The challenge is to understand why the deviations from trend occur, especially why a globalization trajectory ends and turns into deglobalization and therefore a broader approach that allows for policies and institutions is important. Figure 3 identifies two turning points of special interest: 1928 and 2008. It is worth pointing out that these turning points predate many of the ‘causes’ highlighted the deglobalization debate. For example, Brexit, Trump’s trade wars, the economic sanctions tsunami (Van Bergeijk, 2021b) and the creation of a great many border walls are better understood as symptoms of Deglobalization 2.0 (that started before these events) than as causes. 8
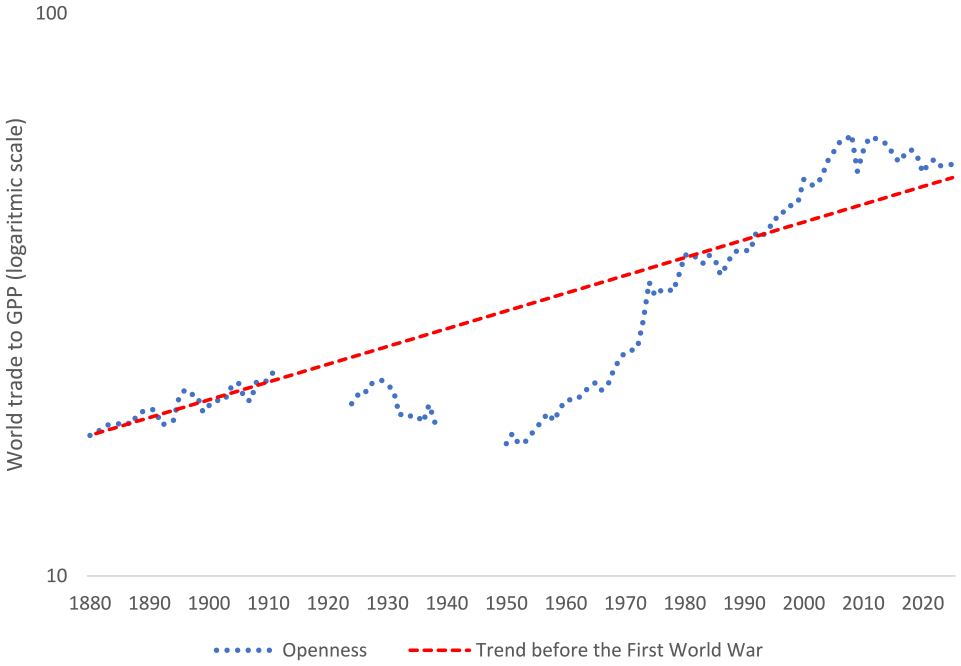
The alternation of globalization and deglobalization.
So, what are the mechanisms behind the turn from globalization to deglobalization? My point of departure is the economic principle that an optimum exists where marginal costs of further globalization equal marginal benefits. Although this is an economic principle it does not mean that we will only analyse monetary values. Indeed, the costs and benefits in my theory also extend to ‘non-economic’ areas such as health or the environment and such areas are thus also part of the mechanisms that force globalization into deglobalization. The first causal mechanism works at the individual country level. The idea that the costs and benefits of globalization are functions of the intensity of globalization is increasingly being recognized. Inverted U-shape relationships have been reported for, for example, financial globalization and wage inequality (Pi et al., 2023), globalization and sustainability (Đào, 2024), and globalization and tax burden (Van Bergeijk, 2019). Such non-linearities reflect that an increase in the intensity of globalization is a double-edged sword as illustrated in the mainstream economic narrative of the costs and benefits of opening an economy to free trade. It should be noted beforehand that this narrative is typically based on a comparative static analysis (i.e. a comparison of equilibria before and after a change in an exogenous variable) and thus neglects the dynamic path that an economy follows in the real world and that sometimes can generate substantial adjustment costs such as high (temporary) unemployment. The double-edged sword thus typically is analysed from a medium to long-term perspective.
In the initial phase when a country starts to open up the economy it can reap steep increases in productivity and welfare due to international specialization, but once the low hanging fruit has been picked the same increase in the intensity of globalization brings less benefits to the economy. Therefore, the marginal benefits schedule is downward sloping. At the same time, the costs (including the external effects) of globalization are increasing in its intensity and therefore the marginal cost schedule is upward sloping. An illustration is the vulnerability for the spread of contagious diseases in more globalized countries, see Farzanegan et al. (2021). An important role is played by costs of redistribution: liberalization of international trade and investment creates winners and losers and to be Pareto-optimal, losers need to should be compensated from the gains of more intensified globalization. This manner of redistribution is initially small at a low intensity of globalization but as assets accumulate and super-richness emerges redistribution becomes more difficult. From an economic perspective, the tax wedge that initially can be modest, increases as redistribution requires more taxation, while the welfare costs of taxation increase quadratic. The implications are, first, that a limit exists for the level of globalization (contradicting the idea entertained in some policy circles that more globalization is always better) and, second, that the costs of further globalization become more apparent and the benefits less clear as the economy approaches this limit eventually enforcing a turning point.
The second causal mechanism occurs in the realm of global governance. Hegemonic Stability Theory deals with the ebb and flood of the Pax Brittanica, the Interbellum (Deglobalization 1.0), the Pax Americana and the current Deglobalization 2.0 (starting point around 2008). From an International Political Economy perspective, the provision of global public goods can be seen as an important driver of this long wave. Global public goods include the global rules and regulations that are highly important for the proper functioning of the world economy. Examples are the rules against economic discrimination provided by the WTO, the labour standards provided by the ILO and the health and food safety requirements set by the WHO and FAO. The UN Security Council (although currently to a large extent paralysed by Russia’s war on Ukraine) sets political norms and values backed up by economic sanctions and peace-keeping missions. These forms of global governance are important facilitators if not drivers for the international division of labour and the process of globalization (Van Bergeijk, 2013b). The theory of collective action developed by Mancur Olson (1965, 1982) remains a main reference on global public goods provision. Olson argued that collective action is plagued by the free rider problem: once a public good is provided rational selfish beneficiaries that cannot be excluded from its use have no incentive to share in the costs of its provision. The upshot is that public goods will typically be underprovided if the proceeds are to be shared by (too) many and/or cannot be sufficiently appropriated. All countries have an incentive to free ride on global public goods and as argued by Kindleberger (1981, 1986), global public goods will only be produced by a hegemon with enough clout both to initiate and to maintain the rules and regulations that buttress the functioning of the world economy. It is thus relevant that both Deglobalization 1.0 and 2.0 are associated with a decreasing share of the hegemon in GPP towards a level achieved by its contestant. At the time of the Great Depression the ‘battle’ for hegemony was between the United Kingdom and the United States; around the Great Recession competition is between the United States and China. Importantly, at the onset of deglobalization the hegemon deserts the economic rules of the game: Deglobalization 1.0 sees the end of the Golden Standard and the free movement of capital, increasing protectionism and competitive devaluations by the United Kingdom, in the 2010s the Trump Presidency is a culmination point of the United States distancing itself from the multilateral system. Those rules underpinned globalization and were actually designed by the hegemon’s interest in an open trade and investment climate. An open stable and relatively peaceful system, however, allows other countries to develop and outgrow the hegemon capturing a larger share of the benefits of globalization. These contestants are free riding on the global public good, that is, the hegemon’s activities in support of the rules of the game. In the early phase of globalization, a smaller hegemon share from a larger economic world pie may still be an improvement. At some point, however, the costs of being a hegemon outweigh the benefits. That is the point when the hegemon retreats from globalization (see also Payne and Silver, 2023). At the time of writing Mr. Trump will become the Republican candidate and if successful in the presidential elections in November 2024, a further abandonment of the international rules by the United States is almost certain. A Joe Biden victory could, however, not prevent the further deterioration of US hegemony as the rise of China continues and the BRICS country group expands suggesting a further change into the direction of a multi-system mode of world governance.
Correlates of Deglobalization
A preliminary question is whether the two long phases of deglobalization are sufficiently comparable to allow for useful generalization. The point is not that the periods should be the same in all respects, but rather that they should not be too different. Actually, the existence of some differences is essential because otherwise we would not be able to learn something about the comparative strength of the drivers of deglobalization. The next section deals with this preliminary question. The ‘Econometric Findings’ section brings together and discusses some econometric findings.
Globality and Deglobality
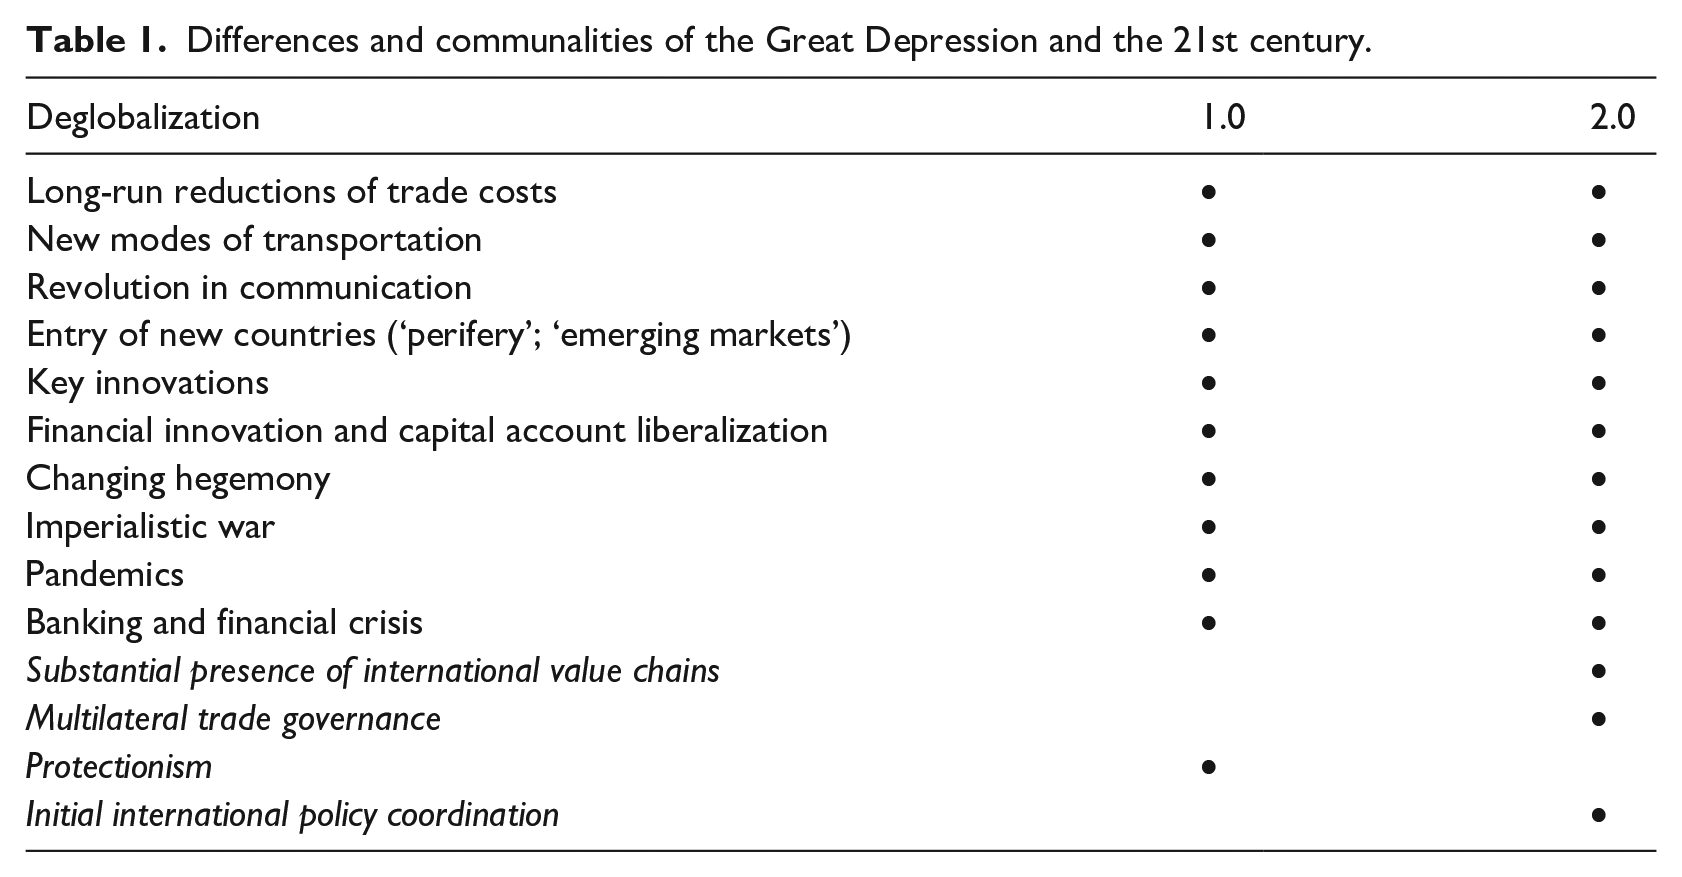
We are not living the lives of our (great-)grandparents, of course, but as set out in greater detail in Van Bergeijk (2019), the ‘Roaring Twenties’ of a century ago and our own epoch (the ‘Roaring 2000s’; the first decade of the second millennium) have a lot of similarities (Table 1). Just before deglobalization’s onset, the world’s mood is optimistic and confident in the future possibilities and persistence of globalization. Markets are open and global, capital freely crosses borders at astonishing levels and speed, completely new products, financial innovations and improved living conditions create hope and further strengthen confidence. New industries boost productivity and fuel booms on the stock exchange. A cluster of trade enhancing factors covers key technological innovations, long-run reductions of trade costs and new modes of transportation and communication. The role and strategies of large, initially often core-based, firms and later competitors from the periphery change. Some clear differences are also observed: international trade is mainly driven by comparative advantage in the early 20th century, but in recent times is increasingly reflecting competitive advantage as a basis for the fragmentation of production in international value chains. Protectionism, a key feature of the 1930s, is not absent in the 21st century but at a much lower intensity than before. At the start of the Great Recession internationally coordinated policy responses stood in sharp contrast with the ‘beggar thy neighbour’ policies of Deglobalization 1.0.
Differences and communalities of the Great Depression and the 21st century.
Most of all, although separated by a century, the ‘roaring twenties’ and the ‘roaring two-thousands’ shared a common belief in globalization as an unstoppable force. A belief that was founded in technological change and the shrinking of the world’s ‘mental horizons’ as travel increases and new far-away markets are increasingly opening up. We may see the differences of our era and the first part of the 20th century perhaps more clearly due to the tremendous structural change and productivity gains over a century, but the awareness of personal integration and belonging to a world economy are characteristic of the globalization phase before the turning points of 1928 and 2008. This state of mind bas been labelled ‘globality’ by Martin (2018): a consciousness of an increasing degree of social, economic and political integration and its impact on our daily life. In the same vein we can juxtapose ‘deglobality’ as today’s state of mind of shrinking social, economic and political cross-border linkages. These states of mind condition our behaviour with real economic consequences. The change from globality to deglobality reflects the fact that the costs of intensifying globalization become apparent. Economic connectedness makes the world economy more vulnerable to global financial crises. Human connectedness makes the planet more vulnerable to pandemics. Geopolitical and geoeconomic change increase the risk for armed conflict driven by a strive for access to strategic raw materials and this vulnerability is further enhanced by changes in and challenges to the Bretton Woods institutions that are grounded in the Liberal Peace Paradigm but do not sufficiently recognize the resource curse.
Econometric Findings
Although the wave in Figure 2 is still a unique phenomenon, we are able to observe two events, namely the turning points (the high tides of globalization) where deglobalization sets in. An empirical analysis at the level of the world economy is not opportune, but the degrees of freedom can be enhanced if the analysis is done at the level of individual countries. 9 The country data can then be investigated with a panel analysis for the two episodes to find out the strength of the drivers behind the trade collapse of the Great Depression and the Great Recession. Table 2 brings together some econometric findings of a simultaneous analysis of the two world trade collapses and does so from two angles: the peak-to-trough-change of the import volume and the peak-to-trough percentage points change in openness (the trade-to-gross domestic product (GDP)-ratio). The panel regressions are unbalanced since reliable observations on the import volume for Deglobalization 1.0 were only available for 34 countries while for Deglobalization 2.0 in principle 173 country observations are available. Due to missing data for some explanatory variables the total number of observations in the panel regressions reduces to 159. (Column (3) reports findings for the balanced panel of 25 countries where we have observations for both). 10 In the spirit of Occam’s Razor the succinct regression equations investigate the association of a number of key determinants of the peak-to-trough reductions of real imports (Columns (1) and (2)) and openness (Columns (4) and (5)), respectively. This research strategy (testing the impact on both the import level and the import-to-GDP ratio) attempts to meet three sources of uncertainty. First, different specifications are in order because the quasi-postulated reduced form equations are not based on a formal (mathematical) model and thus alternative specifications need to be investigated. Second, using different specifications of the dependent variable is a best practice in view of the measurement difficulties. Third, this procedure also takes account of the logic that a reduction in GDP that exceeds an import reduction by definition increase the ratio. The impacts are estimated for the first year (Column (1)) and the first three years (Columns (2)–(5)).
Determinants of the decrease in trade and openness following the outbreak of the Great Depression and the Great Recession.
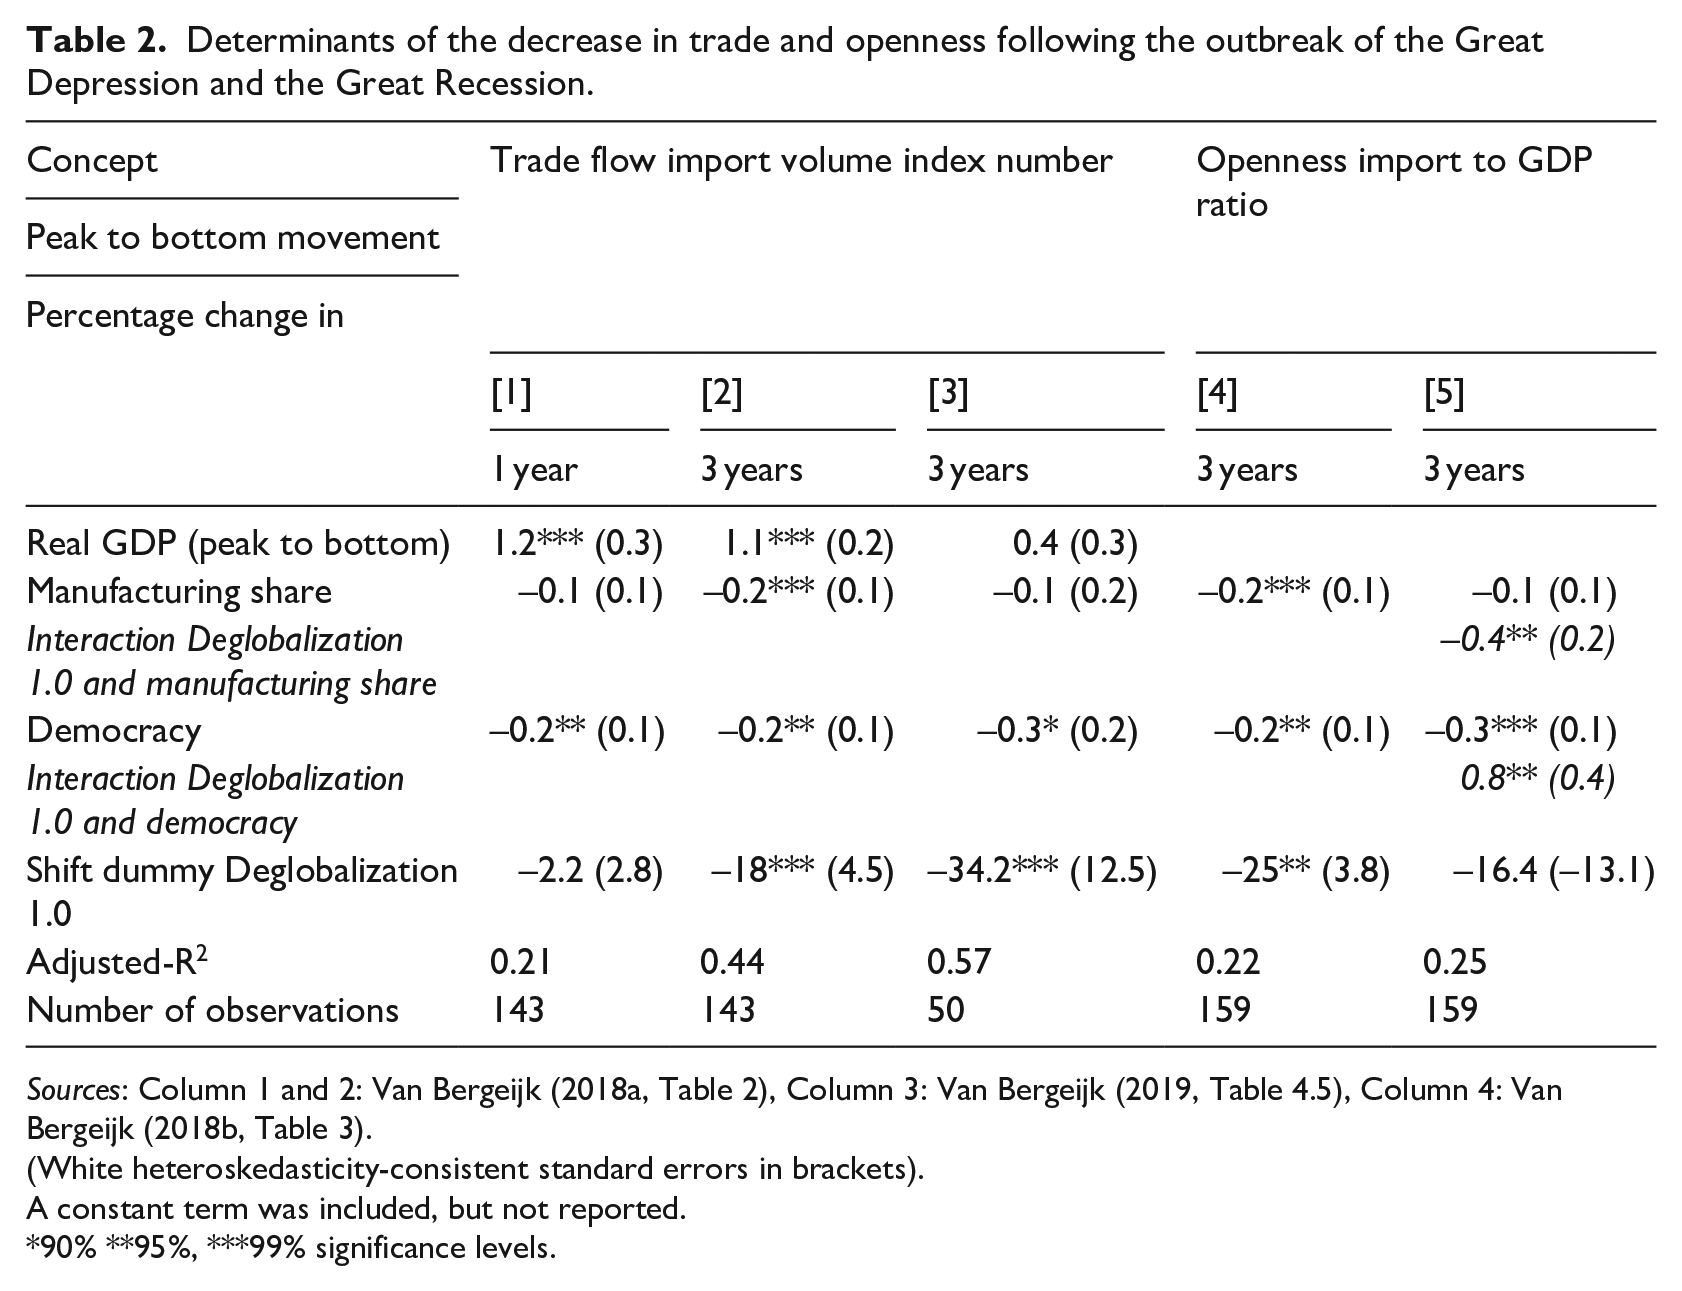
Sources: Column 1 and 2: Van Bergeijk (2018a, Table 2), Column 3: Van Bergeijk (2019, Table 4.5), Column 4: Van Bergeijk (2018b, Table 3).
(White heteroskedasticity-consistent standard errors in brackets).
A constant term was included, but not reported.
90% **95%, ***99% significance levels.
All regression models incorporate a measure for the political system because distributional forces are expected to be stronger in more democratic countries. Table 2 summarizes the regressions that use the Vanhanen indicator that broadly focuses on a country’s level of democratization (alternative regressions with similar result used the Polity Index that evaluates the balance between democracy and autocracy). Since income distribution and asset accumulation are important important drivers of the turning point, Democracy is a priori expected to be associated with a stronger (more negative) reduction in imports and openness. The second common variable is the manufacturing import share that reflects an important qualitative difference in the trade flows of Deglobalization 1.0 and 2.0 as it is associated with intermediate products and value chain activity which over time have become much more important. A priori I expect that a larger manufacturing share is associated with a stronger contraction of imports and openness due to bullwhip effects in international production networks. The third common variable is a shift dummy variable for Deglobalization 1.0 that tests for statistical differences. The trade flow specifications (Columns (1) and (2)) include the change in GDP as an explanatory variable which, so to say moves from the right-hand-side of the equation to the left-hand-side when we study openness (i.e. the import-to-GDP-ratio). The data are discussed in Appendix 1.
The estimated regressions perform reasonably well. The estimated parameters are of similar sign, size and significance level across specifications (with Column (3) showing lower significance for manufacturing share and GDP contraction due to the reduction in sample size). The signs conform to a priori expectations. Adjusted R2 which corrects for degrees of freedom is acceptable for an unbalanced panel spanning a period of eight decades. 11 Column (1) analyses the direct impact on country imports in the first year; in this specification the shift dummy for Deglobalization 1.0 is insignificant. The implication is that the two starting phases of Deglobalization 1.0 and 2.0 are – at least in this sample – to a large extent comparable. Column (2) reports the impact after 3 years and now the shift dummy is statistically significant and its size and significance in the balanced panel (Column (3) is even more pronounced. This implies that the time profile is important; it may take several years before differences between Deglobalization 1.0 and 2.0 become statistically significant. 12 Column (4) reports on the 3-year impact on country openness. The estimated coefficients of Models (2) and (4) are comparable and conform to a priori expectations: the estimated coefficients for both democracy and manufacturing import share are significantly associated with stronger deglobalization in the first 3 years of the deglobalization phase. Next Column (5) reports a model that includes interaction terms of a multiplicative dummy for Deglobalization 1.0 and manufacturing import share and democracy, respectively. These interaction terms test if the pattern for Deglobalization 1.0 differs from the overall pattern. The interaction term for manufacturing import share is negative and statistically significant. This may reflect that this variable has stronger discriminatory power in an era where intra-industry trade dominates (Deglobalization 1.0) rather than the inter-industry trade that characterizes current world trade (the qualitative shift in trade patterns over a century) or alternatively that international value chains are a countervailing force in times of high trade uncertainty because they are typically build on trust in long-term trading relations (Van Bergeijk, 2013a). The interaction term for democracy is statistically significant and positive. On the whole, democracy is still associated with stronger deglobalization in the panel, but for Deglobalization 1.0, democracy is associated less strongly with deglobalization than currently. This may be due to autocracy’s stronger correlate during Deglobalization 1.0 or reflect that democratic processes have changed over time.
The Major Difference: Resilience of World Trade
One of the topical issues in the empirical economic literature on the trade impact of the Great Recession and COVID-19 is the heterogeneity of both the speed and depth of the reduction of cross-border trade and investment flows that occurred as a direct response (peak-to-trough), as well as the speed of recovery after that response (i.e. trough-to-recovery and, sometimes, a new all-time high). 13 Resilience of world trade has, indeed, been unexpectedly strong. 14
Consider Figure 4 that compares the three major trade collapses over a century and the potentially emerging collapse related to the wars on Ukraine and Gaza. To make the developments comparable, each period starts 6 months before the pre-trade-collapse peak that identifies period ‘zero’. Index numbers are used where the peak-level before the collapse is set equal to 100. It is now easy to see the percent changes and compare the episodes. For example, once trade starts to decrease during the Great Recession and the Great Lockdown the percentage decrease outpaces the rate observed Deglobalization 1.0, demonstrating the astonishing monthly speed and size of world trade contractions during Deglobalization 2.0. The pattern of recovery, however, is also sharp and 1–2 years world trade returns to pre-pandemic peak level for the Great Lockdown and Great recession, respectively. In contrast during Deglobalization 1.0 trade did not restore to pre-peak level; occasionally a year could have a positive world trade growth rate, but no sustained recovery occurred in the Interbellum. Importantly, the contractions in 2008–2009 and 2020, both started to bite after a quarter but in the fourth month of the COVID collapse, world trade was already 15% below previous-peak-level, while this was ‘only’ 8% during the 2008–2009 episode. Global merchandise trade in May 2020, however, bottomed out, and full recovery was achieved in October 2020. At the comparable point of the 2008–2009 trade collapse, the volume of world trade was still 17% below pre-crisis peak level. During Deglobalization 1.0, world trade 12 months into the collapse was 28% below pre-crisis peak level, with further decreases to 50% below pre-crisis peak level on the horizon. Clearly, the two recent world trade followed a V and U pattern respectively, in contrast with the protracted deep slide of Deglobalization 1.0.
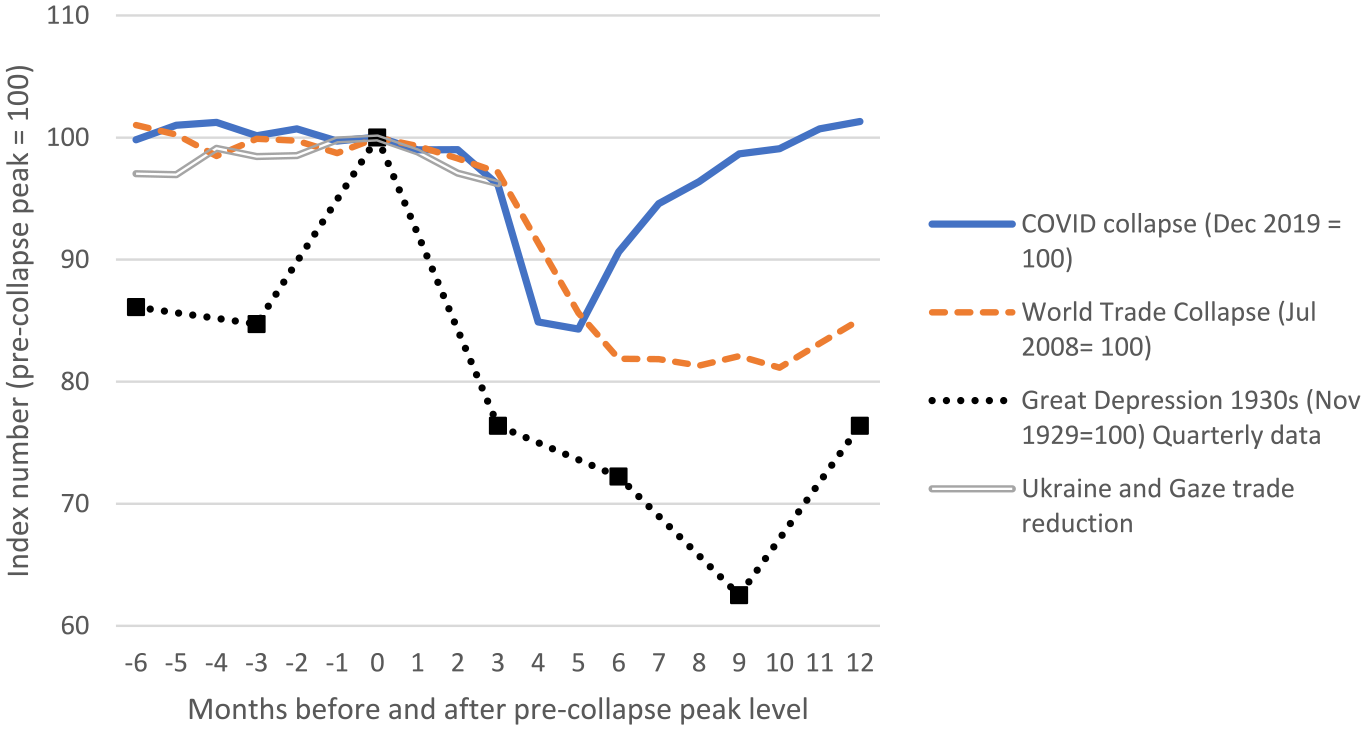
A comparison of the trade impact of the Great Depression, the Great Recession, the COVID-19 pandemic and the Wars on Ukraine and Gaza.
It is tempting to associate patterns for the Deglobalization 2.0 shocks and the differences identified in Tables 1 and 2 and speculate that greater resilience could be driven by the international value chains (that transmit shocks but also help to overcome uncertainty), a much smaller role for protectionism that did such a bad job in Deglobalization 1.0, and the existence of the Bretton Woods Institutions that enabled (at least in the initial phase of the Great Recession) a significant role for policy coordination. 15
Caveats, Conclusions and Outlook
Several caveats are in order. First, the analysis is not based on a formal theoretical model or specific theory, and rather uses descriptive statistics and quasi-postulated reduced form equations. Second, measurement issues are highly relevant also because the analysis covers a long period in which international services have become much more tradable potentially exerting a downward bias on measures that deal with the flow of goods only. Third, conceptual heterogeneity of different aspects of globalization have increased since 2008. This sometimes makes the findings (that should not be seen as causal but rather as associations) multi-interpretable.
To meet these challenges this article blended best practices on structural deglobalization measurement from different scientific fields and followed a multimethod approach providing a narrative review of literature, quantitative stylized facts and an econometric analysis of the turning points of the (de)globalization wave. The triangulation below aims to bolster confidence levels of this multimethod studies by integrating various sources and methods assuming that the sum is more than the parts but also recognizes the value of contradictory results, which can present research puzzles and highlight areas of uncertainty.
The findings in combination substantiate the utility of a multi-method research strategy based on the hypothesis that globalization and deglobalization are iterating phases of the world economy. The regressions in themselves do not prove this hypothesis – of course! The fact, however, that a relatively succinct model is capable of describing countries turning from globalization towards deglobalization certainly does not refute this hypothesis either and the (comparative) descriptive statistics and narrative review of literature increase our confidence. So both qualitative historical research and econometric studies can benefit from a comparative analysis of trade collapses and meaningful lessons can be expected from this comparison.
The methods and perspectives allow the following conclusions. There is increasing support for the assessment that we entered a deglobalization phase and by implication for the hypothesis that globalization and deglobalization are alternating phases of a long wave of the world system. Informed by an overview of the historical contexts, the econometric finding of the impact of the political variable suggests at the country level that distributional issues are an important force associated with the turning points of globalization: demands to compensate the losers from globalization will be more pronounced in democracies than under autocratic rule. The strength of this mechanism differs somewhat for the two episodes. During Deglobalization 1.0, autocratic rule and dictatorship are associated more strongly with trade contractions and deglobalization; recently democracy is associated more strongly with trade contractions and deglobalization. While this observation has some value on its own, more research is needed to understand why these differences occur. The findings also underline the importance of the manufacturing import share as a key determinant. The change from predominantly intra industry to inter industry trade that occurred between the two periods clearly matters, but as suggested by one of the anonymous reviewers its impact on structural (de)globalization is an issue for future research. Comparing the turning points of the Great Depression to the Great Recession and Great Lockdown, world trade’s resilience to deglobalization increased. This may be due to wiser government policies and regulations, the multilateral trading system and/or the mitigating role of international value chains. A weak spot of the analysis in this paper is that the analysis is at a macrolevel and thus needs strengthening by more detailed consideration of actual business strategies and related interests of large corporations. 16 All findings thus suggest issues for future research.
Under current geoeconomic and geopolitical conditions a recovery from the current deglobalization phase is unlikely. The economic impact of the new ‘Cold Trade War’ can be significant (Van Bergeijk, 2014). Recent economic research on the impact of limiting international value chain activity and international trade shows that de-risking, in-shoring, near-sourcing, and other forms of import substitution entail high costs especially for small open market economies and would, moreover, further reduce openness globally (Attinasi et al., 2023; Eppinger et al., 2021; Felbermayr et al., 2023). In the worst-case scenarios of Attinasi et al. decoupling of international value chains could amount to a reduction of world openness by 20%–30%. Felbermayer, Mahlkow, and Sandkamp do not report world totals, but their worst-case scenario for the BRIC countries and the Western countries covers world trade to a large extent, finding reductions of the exports-to-GDP ratio by roughly a third to half for these country groupings (Felbermayr et al., 2023, Table 2). These numbers are significant and provide a strong motivation to take deglobalization seriously not only as a topic of academic interest but also as a priority in policy making. Deglobalization is not simply the mirror image of globalization and a return to the status quo ante is unlikely. While high income earners with significant human capital and adjustment capabilities largely escape the hardship of deglobalization, the trade shocks and price hikes associated with the Ukraine war have demonstrated the vulnerability of low income workers both in the Global North and Global South.
Footnotes
Appendix 1
This paper analyses events that are distant in time and thus the issue of conceptual comparability of statistics over eight decades needs attention. For example, national accounts did not exist during Deglobalization 1.0. In addition, measurement errors are a very significant problem for international trade flows, both presently and in the past (Van Bergeijk 2024). This is especially relevant because my panel consists of a blend of recent data and data from the 1930s. As a practical way to reduce the extent of measurement error corruption I use aggregate real import data basically because this reduces misclassification by commodity and/or country and because the impact of a negative shock can be expected to be most visible and unambiguous in the development of the volume (Van Bergeijk, 2009). Moreover, I use wherever possible sources that cover the full period so that the concept of interest is measured according to a single definition. If a single source time series is not available, I preferred sources where institutional measurement hopefully helps to enhance consistency of the data. An example is the manufacturing share where for Deglobalization 2.0 the source is the UN division that is institutional heir of the League of Nations staff that provided the data for Deglobalization 2.0.
The construction of the data sets is discussed in detail in Van Bergeijk (2018a for imports, and 2019 for openness). Import to GDP ratio is calculated peak to trough using several sources: for the 1930s, United Nations Statistical Office (1962), Maddison (1985, 2006) and Birnberg and Resnick (1975) and for the 2000s, IMF World Economic Outlook Database (April 2015). The set of explanatory variables consists of country-specific variables. These are all measured in the year before the start of the world trade collapse that initiated the phase of deglobalization. Manufacturing import share is derived and estimated from League of Nations (1931, Table 95, 168–170), United Nations Statistical Office (1962) and United Nations (2010a, 2010b). The political variable is taken from Vanhanen data set (2011 see http://www.prio.org/Data/Governance/Vanhanens-index-of-democracy/). Country GDP is derived from Maddison (2006), which is updated by the Groningen Growth and Development Centre (http://www.ggdc.net), and calculated peak to trough. Openness is calculated from the import and GDP data.
Funding
The author(s) received no financial support for the research, authorship and/or publication of this article.