
Abstract
Peritoneal dialysis (PD) patients are at risk of muscle wasting and clinical guidelines recommend assessing dietary intake, by calculating protein equivalent of nitrogen appearance (PNA) to assure adequate intake. As the PNA equations were developed some time ago based on continuous ambulatory PD (CAPD) treatments, we re-evaluated them by comparing dietary recall protein intake. Dietary histories were obtained from 42 PD patients, mean age 62.2 ± 15.8 years, 58.1% male, 41.9% white, 39.5% treated with CAPD, median dialysis vintage 13.2 (3.1–23.3) months when attending for routine outpatient peritoneal membrane testing. Dietary protein intake (DPI), median 50.8 (37.5–71.5) g/day was determined with the Nutrics software program®, and using PNA equations, DPI varied from 32.6 (31–34.3) to 68.8 (58.7–86.3) g/day. Bland Altman bias ranged from −22.8 ± 23.4 to +12.0 ± 24.6 g/day, with the older equations tending to underestimate and the more recent equations overestimating dietary recall DPI. There was systematic bias with the older equations, particularly as DPI increased. Although there was a wide variation, the two equations exhibiting least variation with dietary DPI were: PNA=15.1 + (0.195 × 24-h combined urinary and peritoneal urea mmol) + (24-h combined urinary and peritoneal protein loss), and PNA = 20.1 + (0.209 × 24-h combined urinary and peritoneal urea mmol), with a mean bias of +6.3 and +7.8 g/day compared to dietary DPI, and negative nitrogen balance of −1.7 and 2.6 g/day, respectively. Our study would suggest that the most used PNA equations may overestimate DPI in many patients and potentially result in unrecognised protein malnutrition.
Introduction
Current clinical guidelines recommend that patients with chronic kidney disease follow a reduced protein diet but then increase their dietary protein intake (DPI) when they transition to dialysis. 1 However, many dialysis patients fail to achieve these targets. 2 As such, current clinical guidelines recommend regular assessment of DPI. 1
Access to specialist dietitians varies between dialysis centres, and as such other methods of assessing DPI is often used in routine clinical practice. Assuming that a dialysis patient is not losing muscle mass and is in neutral protein balance, then the protein equivalent of nitrogen appearance (PNA) has been used as a surrogate marker of DPI. PNA is estimated from combined 24-h urinary and peritoneal urea losses and assuming that urea represents a constant proportion of total nitrogen excreted.3,4 Several equations have been developed derived from small studies in peritoneal dialysis (PD) patients treated by continuous ambulatory PD (CAPD),4–9 with the largest study based on 23 measurements from 12 patients. 5
As both patient demographics and PD prescriptions have changed over time, with the introduction of automated PD cyclers, with (CCPD), or without a day-time exchange (APD), we wished to determine whether there were differences between DPI based on patient dietary recall and that determined with PNA equations.
Methods
DPI was assessed by a single renally trained specialist dietitian based on 24-h patient recall following the British dietetic association guidelines, with pictorial images to aid portion size and food frequency cross check. 10 The dietitian was blinded to urea kinetic results. Dietary interviews took place when patients attended for routine outpatient assessment of peritoneal membrane function, and analysed using the Nutritics software (Nutrias, Swords, County Dublin, Ireland). 11 Patients unable to provide accurate dietary recall, due to cognitive impairment, physical disability or language barriers were excluded. Patients who had peritonitis or other infections, or hospital admissions within the previous 12 weeks were excluded. All patients used glucose-based PD dialysates and 7.5% icodextrin (Baxter Health Care, Deerfield, Illinois, USA) for overnight exchanges with CAPD or the daytime CCPD exchange.
PNA was calculated from urea measured in 24-h collections of spent dialysate effluent and urine, using a standard laboratory analyser (P module analyzer, Roche Integra, Roche diagnostics, Lewes, UK). 12 Non-urea nitrogen balance was calculated by subtracting 24-h spent peritoneal dialysate urea nitrogen from the total nitrogen dialysate losses. 13 As dietary intake can vary from day to day, dietary recall was for the same 24-h period as the peritoneal and urinary collections. Patient demographics were obtained from the Hospital patient records.
PNA was calculated using the equations set out in the appendix.4–9,14 Peritoneal glucose absorption was calculated as the difference in the amount of glucose instilled in fresh dialysate and that in drained dialysate. Dietary energy intake (DEI) was estimated from dietary recall and peritoneal glucose absorption. The Goldberg cut off was used to compare dietary recall with energy expenditure, assuming sedentary life-style. 15
Ethics
The study was approved by the U.K. National Health Service (NHS) Research Authority Ethics Service (NRES) (EDGE 158772, IRAS29331). In keeping with the Helsinki accord, all patients provided written informed consent, and following NRES protocols, all data was appropriately anonymised prior to analysis.
Statistical analysis
Data is presented as mean ± standard deviation, median (interquartile range), or percentage. Standard statistical tests Spearman univariate analysis and Kruskal–Wallis with appropriate post hoc corrections made for multiple testing. Bland–Altman analysis was used to determine agreement between methods. Statistical analysis used Prism 10.6 (Graph Pad, San Diego, USA) and SPSS 29 (IBM, Armonk, New York, USA). Statistical significance was taken as p < .05.
Results
We studied 42 stable PD patients out of 45 patients, mean age 62.2 ± 15.8 years, 58.1% male, 41.9% white, 37.2% Asian and 20.9% Black. Twenty-two (53.7%) were diabetic and the median glycated haemoglobin was 42 (37–58.3) mmol/mol. The median PD dialysis vintage was 13.2 (3.1–23.3) months. One patient was unable to provide a dietary history due to language barrier, and two patients declined to take part. All patients achieved the U.K. target for weekly urea clearance (Kt/V). The majority were treated by CAPD and CCPD (both 42.9%), followed by APD (14.3%). The median DPI was 50.1 (38–70) g/day, with an oral calorie intake of 1205 (1076–1593), and basal metabolic rate of 1356 (1192–1558) kcal/day. The median daily carbohydrate intake was 136.6 (103.9–173.9) g, fibre 12.9 (9.8–20.6) g and sodium 1162 (814–1539) mg.
The 24-h peritoneal and urinary protein losses were 3.34 (2.54–4.7) g and 0.33 (0.09–1.15) g respectively. Calorie intake increased to 1205 (1076–1593) when including 114 (12–213) glucose calories absorbed from the peritoneal dialysate.
Whereas the older equations tended to underestimate dietary recall DPI,5,6,9 the more recent equations tended to overestimate DPI11,14 (Table 1). As such, the median calculated daily nitrogen balance differed from around −2 to +2 g/day compared to when using dietary DPI (Table 1).
Estimations of daily dietary protein intake from 24-h patient dietary recall (diet protein) and equations estimating daily protein nitrogen appearance (PNA) g/day and calculated daily nitrogen balance (N balance) using PNA equations and dietary recall protein intake.
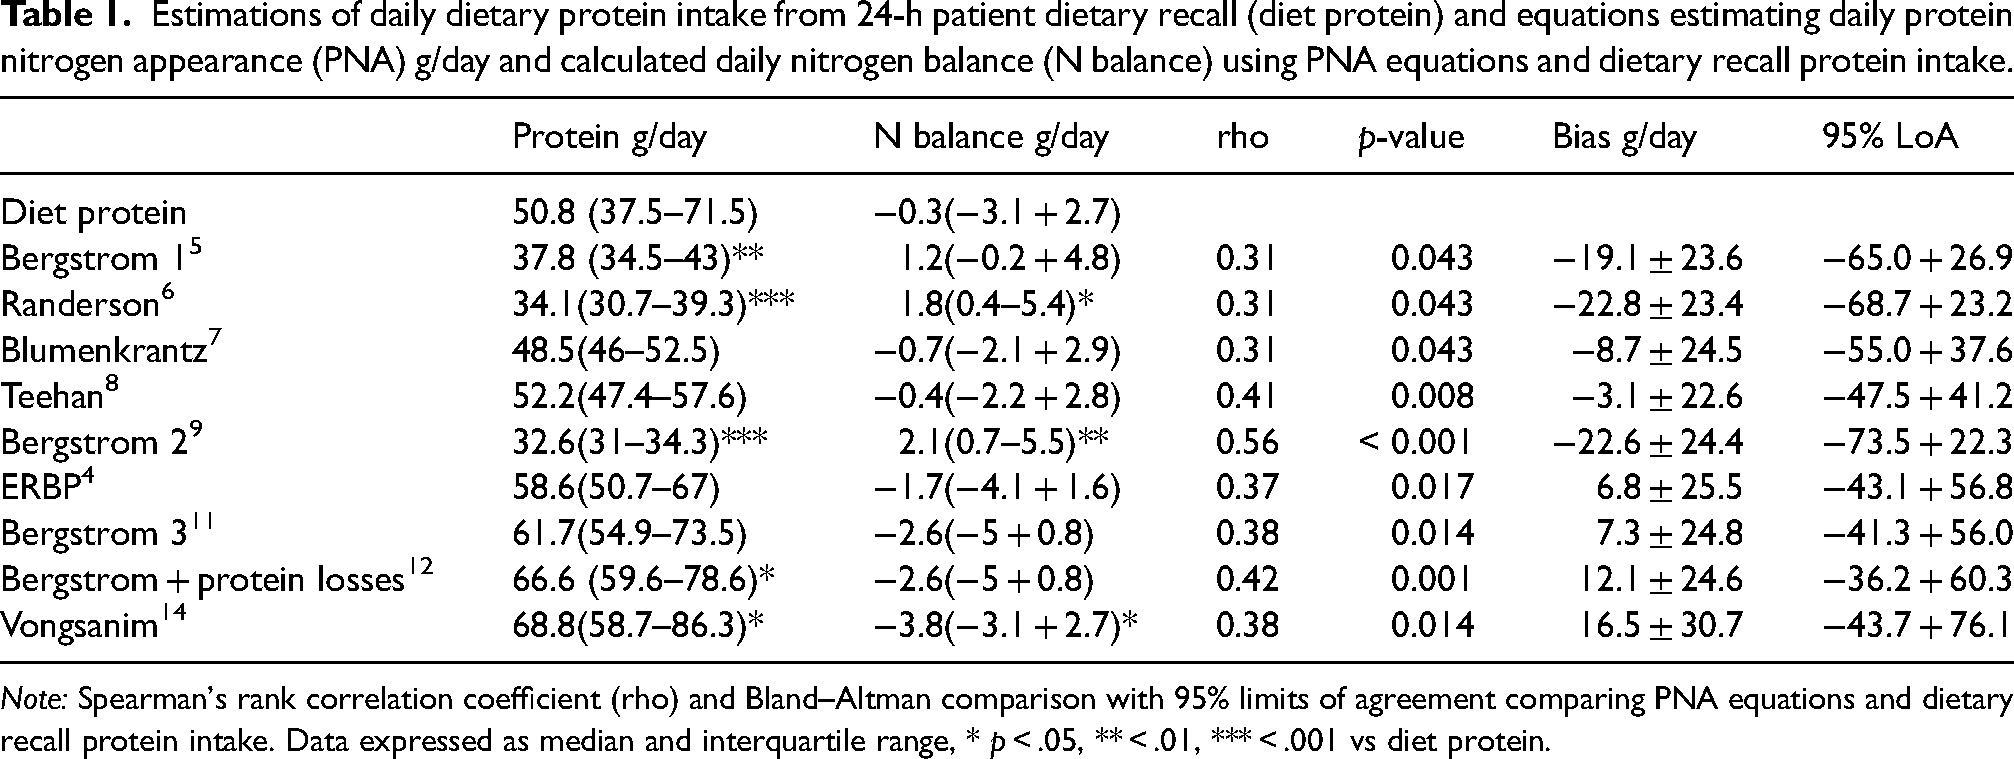
Note: Spearman's rank correlation coefficient (rho) and Bland–Altman comparison with 95% limits of agreement comparing PNA equations and dietary recall protein intake. Data expressed as median and interquartile range, * p < .05, ** < .01, *** < .001 vs diet protein.
There were univariate associations between dietary recall DPI and that calculated from all the equations. However, on Bland–Altman analysis the median bias for DPI varied from an underestimation of −22.8 g/day to +16.5 g/day compared to dietary recall DPI, with quite a wide variation in the 95% limits of agreement (Table 1).
Comparing the different equations, then some showed systematic bias, particularly with higher DPI (Figure 1). This systematic bias was observed most with the earlier PNA equations.
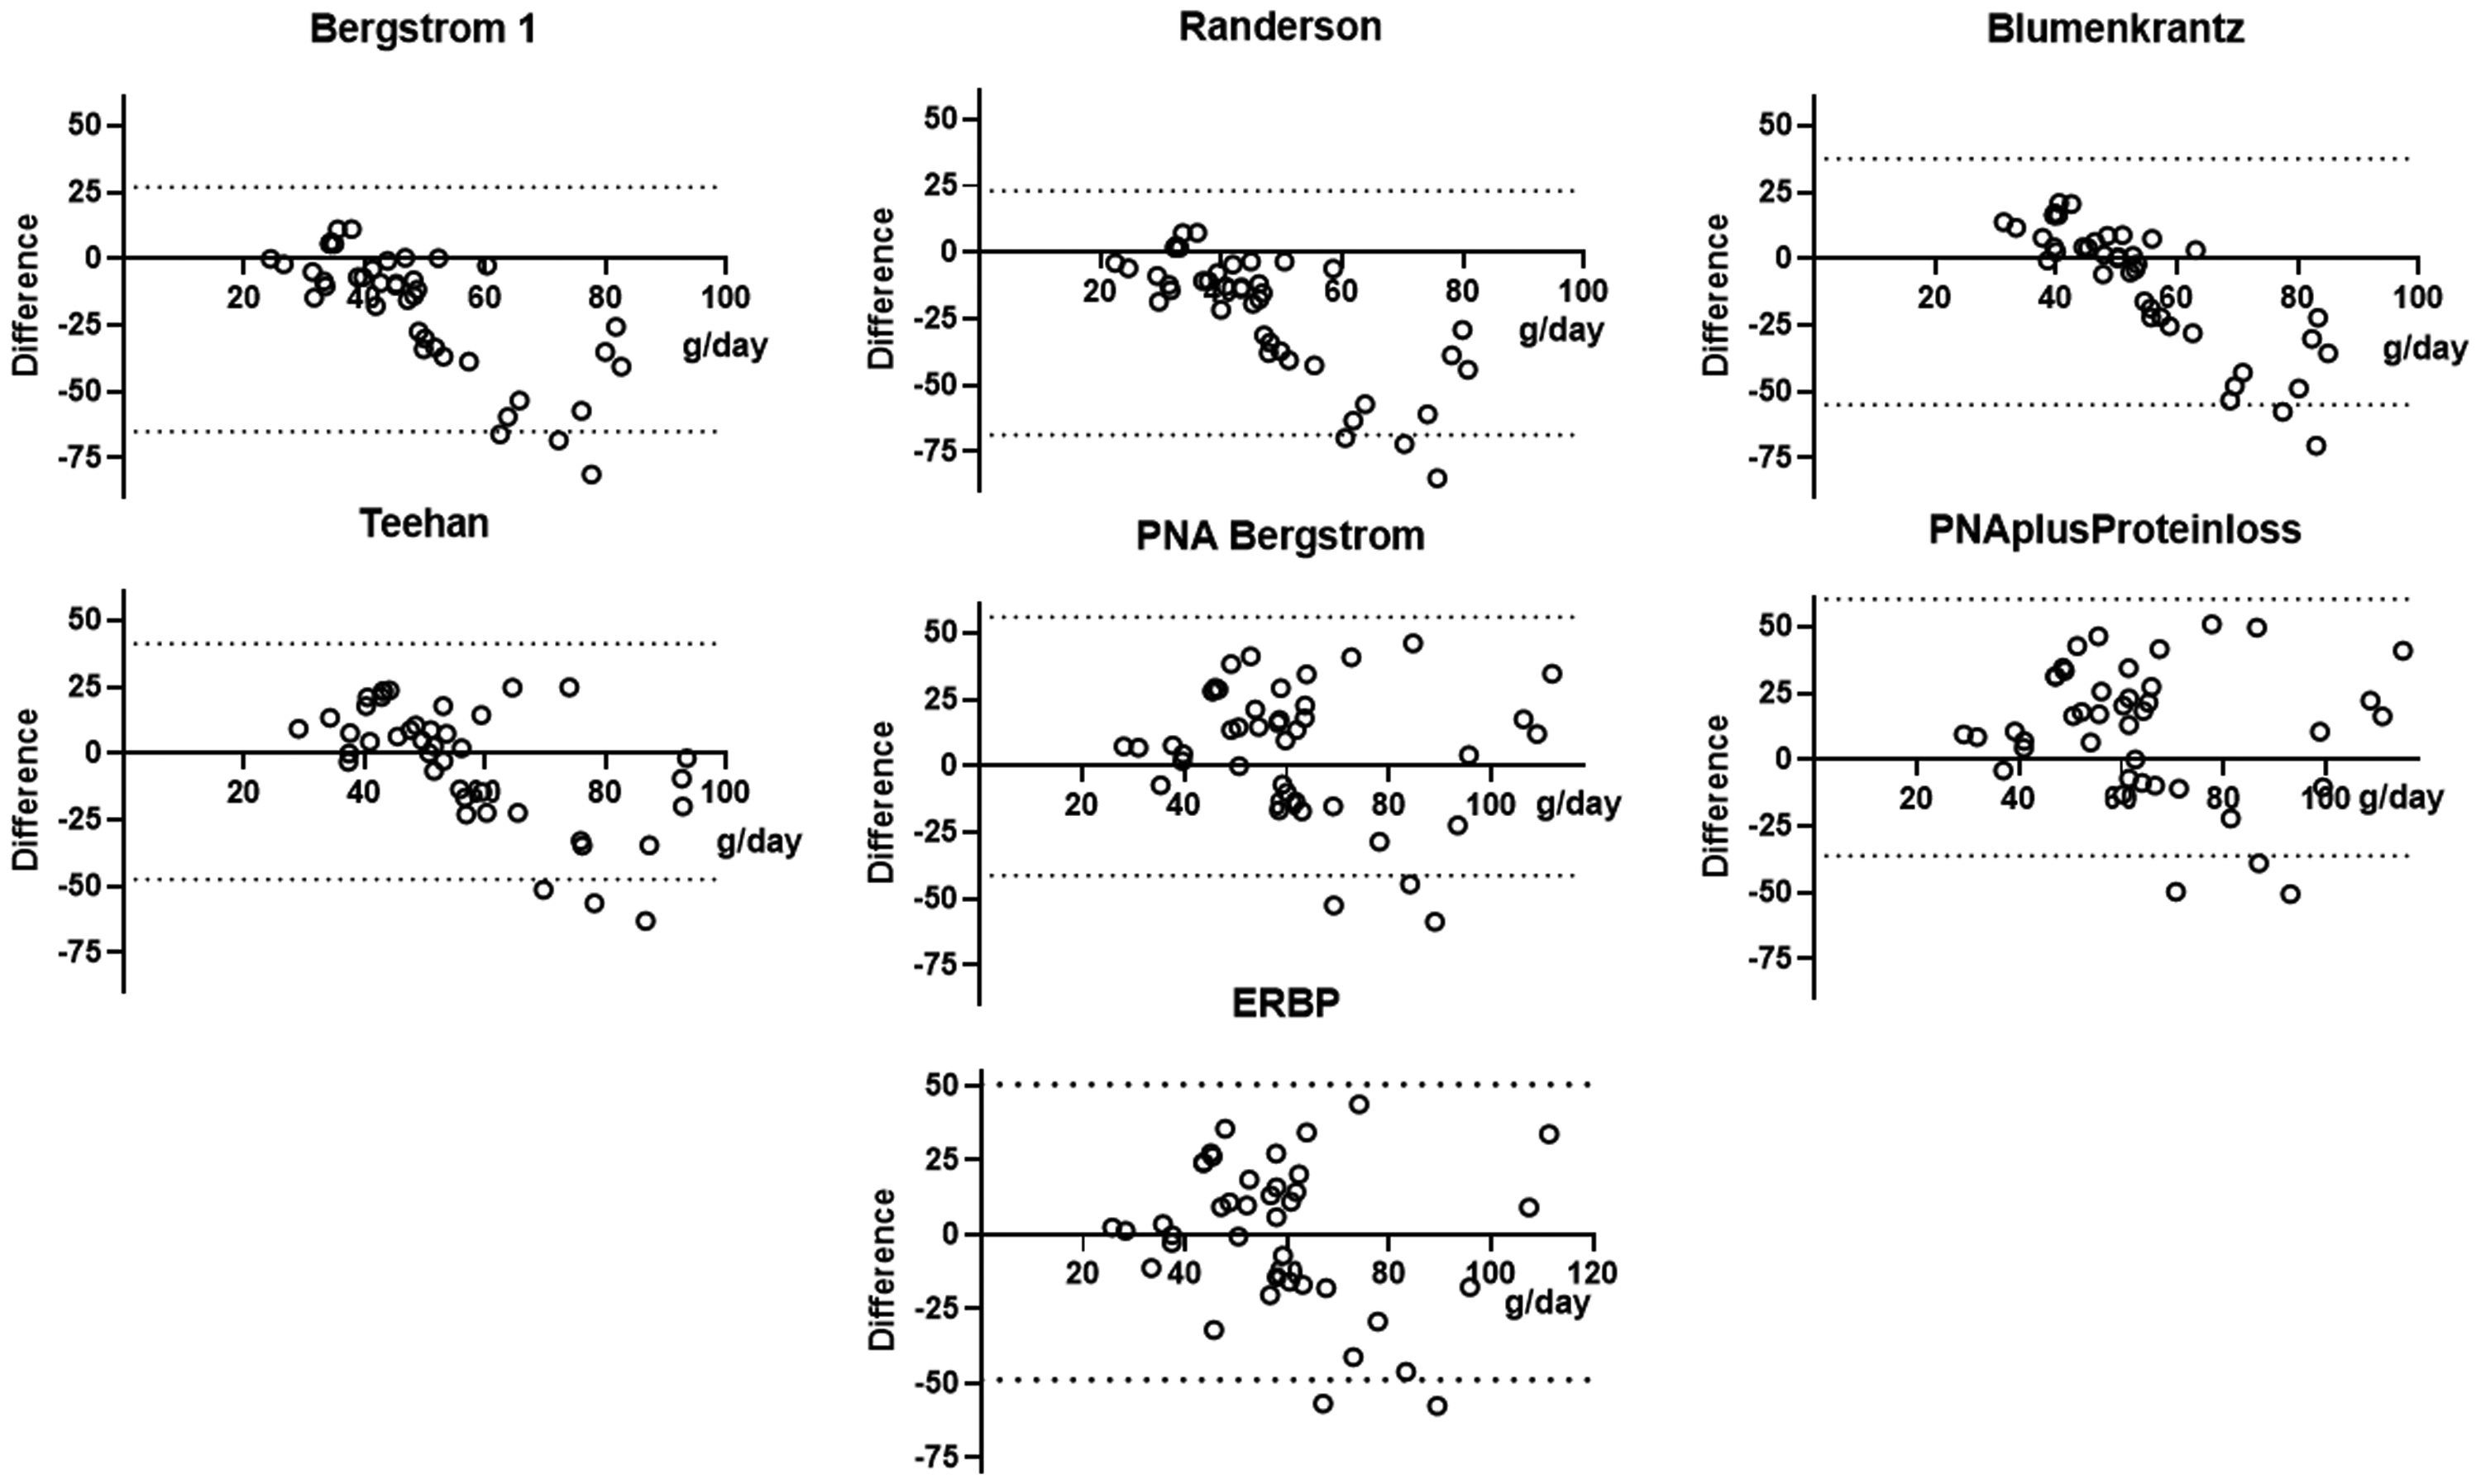
Bland–Altman plots comparing 24-h dietary recall protein intake and that calculated from a series of equations estimating the protein equivalent of nitrogen appearance.
To review dietary recall, DPI was strongly associated with DEI (r = 0.58, p < .001). DEI was compared with basal metabolic rate, and the mean bias was 32 ± 633 kcal/day for the Harrison-Benedict equation, −18.7 ± 614 kcal/day for the Cunningham equation and −37.9 ± 627 kcal/day for the Miflin–StJeor equation, respectively. Assuming a sedentary lifestyle, then the median Goldberg ratio using the Harrison–Benedict equation was 1.28 (1.03–1.58), 1.33 (1.1–1.7) using the Cunningham equation and 1.34 (1.11–1.65) using the Miflin–StJeor equation, respectively.
Discussion
PD patients are at increased risk of developing a negative nitrogen balance and losing muscle mass if they have an inadequate DPI.16,17 Whereas body fat stores can act as an energy store, there is no equivalent store of protein which can provide a source of amino acids for anabolism. So, an adequate DPI is essential to prevent muscle loss. Clinical guidelines recommend that DPI should be assessed in dialysis patients.3,4 Although dietary records and patient recall can be used, clinical guidelines also advocate assessing PNA. In addition to urea losses in spent peritoneal dialysate and urine, PNA includes an inflation factor to account for losses of proteins, small peptides and amino acids, along with a correction factor for other protein losses. These include those from the gastrointestinal tract, and skin, estimated to average around 1.3 g/day, although faecal losses may vary between 0.52 and 2.8 g/day.5,6,18,19 As nitrogen balance will be affected by infections, other catabolic states and fasting, 20 then PNA should preferably be measured in stable outpatients.
As such, for a neutral nitrogen balance, then PNA should be greater than dietary recall DPI, due to the additional protein losses accounted for with the PNA equations. We noted an association between dietary recall DPI and PNA, which differs from an earlier study from Brazil, which reported a higher dietary recall DPI than PNA. 21 As PNA equations take into account estimates of additional protein losses, we noted a systematic bias particularly with some of the earlier PNA equations. 21 The combined median protein loss in peritoneal dialysate and urine in our study was 3.6 g/day, which would suggest that dietary recall DPI would be around 5 g/day less than that of the PNA equations.
We acknowledge that both diet recall and PNA equations potentially have multiple confounders. In keeping with previous studies, a 24-h patient dietary recall was chosen due to the difficulty in elderly dialysis patients accurately recalling dietary intake over a longer period, and the inaccuracy of food charts recorded at home. 22 In addition, as dietary intake may vary from day to day, so we took the diet history over the same 24 h as the dialysate and urine collections. To determine whether patients had under or over-estimated DPI, we used the Goldberg ratio, which compares DEI and energy expenditure. 15 Basal metabolic rate was estimated using three different equations, and then adjusted for active energy expenditure assuming a sedentary life style. Fewer than 16% of patients were classified as potentially having under reported DEI. However, the reliability of the Goldberg cut-off analysis has been shown to be highly dependent on body composition and active energy expenditure, 15 which may differ between PD patients and the general population, with reports of increasing prevalence of sarcopenia and obesity in PD patients. 23
Just as patients may inaccurately recall food intake, PNA can be affected by errors in collecting and measuring 24-h spent dialysate and urine. Similarly, changes in food intake, physical activity and acute illness can all impact on both DPI and PNA. 20
Thus, despite all the PNA equations being based on a younger PD patient population treated by CAPD, we found that the ERBP and later Bergstrom equation would appear to perform better than other proposed PNA equations when applied to an older multiethnic PD population treated by CAPD and APD cyclers with and without a daytime exchange.4,11 However, both diet recall and these PNA equations suggested that most of our patients failed to achieve a high enough DPI to potentially prevent a negative nitrogen balance.
Practical application
When estimating DPI by calculating the nitrogen appearance rate in PD patients using the older Bergstrőm, Randerson or Blumenkrantz equations, then these equations underestimate DPI compared to that obtained from dietary recall, and so potentially under estimate DPI.
Footnotes
Acknowledgements
PD team.
Authorship
HS conducted patient interviews and analysed dietary data; AD obtained ethical and other institutional approvals, and wrote first draft; both HS and AD reviewed and agreed final version of the manuscript.
Declaration of conflicting interests
The authors declared no potential conflicts of interest with respect to the research, authorship, and/or publication of this article. The data presented in this article has not been previously published in part or full form.
Ethical approval
The study was approved by the UK NHS NRES (EDGE 158772, IRAS29331).
Funding
The authors received no financial support for the research, authorship, and/or publication of this article.
Informed consent to participate
In keeping with the Helsinki accord, all patients provided written informed consent, and following NRES protocols, all data was appropriately anonymised prior to analysis.
Appendix
Protein nitrogen appearance equations for estimation of daily dietary protein intake
Equation 1 [5]
19 + (7.62 × 24-h combined urinary and peritoneal urea nitrogen)
Equation 2 [6]
10.76 × (urine and peritoneal urea nitrogen appearance g/day/1.4) + 1.4
Equation 3 [8]
6.25 + (0.93 × 24-h combined urinary and peritoneal urea nitrogen + 5.47)
Equation 4 [9]
(6.25 × (24-h combined urinary and peritoneal urea nitrogen) + 1.81 + 0.031 × body weight kg) + 24-h effluent peritoneal dialysate protein
Equation 5 [13]
19 + (7.31 × 24-h combined urinary and peritoneal urea nitrogen)
Equation 6 [9]
15.1 + (0.195 × 24-h combined urinary and peritoneal urea) + (24-h combined urinary and peritoneal protein loss)
Equation 7 [10]
20.1 + (0.209 × 24-h combined urinary and peritoneal urea)
Equation 8 [14]
20.1 + (0.209 × 24-h combined urinary and peritoneal urea) + (24-h combined urinary and peritoneal protein loss)
Equation 9 [15]
7.17 + (0.31 × 24-h combined urinary and peritoneal urea)