
Abstract
Background
Peritoneal dialysis (PD) is commonly performed using either intermittent or tidal exchanges, whereas other exchange techniques such as continuous flow PD are little used. Previous research indicated that stirring the intra-peritoneal dialysate markedly increases small solute clearances. Here, we tested the hypothesis that stirring of the dialysate increases small solute clearances by using a novel exchange technique where the dialysate is pulsed back and forth during the treatment without addition of fresh fluid.
Methods
PD was performed in anesthetized Sprague-Dawley rats with either no pulsations (20 mL fill volume), 2 mL (10%) pulses (21 mL fill volume), or 5 mL (25%) pulses (22.5 mL fill volume) utilizing a pulse flow rate of 5 mL/min. The higher fill volume for the pulsed treatments compensates for the fact that the average intra-peritoneal volume would otherwise be lower in pulsed treatments. Water and solute transport were closely monitored during the treatment.
Results
Net ultrafiltration decreased significantly during pulsed PD with the 25% pulse volume. The 60 min sodium dip was unaltered, whereas the fluid absorption rate was increased for the 25% group. Solute clearances did not significantly differ between groups, except for a slightly lower calcium clearance in the 25% group.
Conclusion
Our data indicate that stirring the dialysate using pulsed exchanges does not provide any advantage compared to conventional exchange techniques. In contrast, pulsed treatments had slightly lower ultrafiltration and small solute transport. The present findings may have implications regarding the choice of tidal volume in automated PD, favoring smaller tidal volumes.
Introduction
The number of patients requiring dialysis treatment is increasing worldwide. 1 Peritoneal dialysis (PD) provides many advantages over conventional in-center hemodialysis (IHD), such as lower societal costs and increased patient autonomy. However, the use of far lower dialysis fluid flow rates (DFRs) in PD compared to IHD combined with the low diffusion- and UF capacity of the peritoneal membrane reduces efficacy of the treatment in terms of solute and water removal. Indeed, inadequate dialysis or water removal is a common cause for PD technique failure and subsequent transition to IHD—a transition now known to be associated with increased mortality. 2
In a pioneering study, Zakaria et al. demonstrated a more than two-fold increase in 51Cr-EDTA diffusion capacity by placing the animal on a standard laboratory shaker at 10 Hz. 3 There is also clinical evidence to suggest that the effects of increasing the DFR during treatment with automated PD (APD) exceed those expected from theory – suggestive of a stirring effect. 4 Indeed, it is quite possible that such an effect can be accomplished without providing fresh dialysis fluid (as in the work of Zakaria et al. 3 ), but rather by exchanging the same dialysis fluid in a pulsatile manner—herein referred to as pulsed PD. Conceivably, such stirring may increase small solute clearances in at least two ways: (i) by the disruption of stagnant layers adjacent to the peritoneal membrane and (ii) mixing of the dialysate, in both cases, improving concentration gradients. To test the hypothesis that stirring of the dialysate increases small solute clearances, we here performed studies in a well-established animal model of PD by using a pump to fill/drain the peritoneal cavity in a pulsatile manner. Small solute clearances and isocratic diffusion capacities 5 were analyzed to detect the increments hypothesized in previous articles.3,4 Lastly, the effects of mixing were also evaluated in an in vitro model of the human peritoneum.
Methods
We conducted an experimental study in 24 animals. Subjects were circa 9 weeks old male Sprague-Dawley rats having a body weight of ∼300 g with free access to water and food (Special Diets Services RM1(P) IRR.25 801157). The study was approved by the Ethics Committee for Animal Research at Lund University, and the animals were treated in accordance with the guidelines of the National Institutes of Health for Care and Use of Laboratory animals. Reporting of results is in accordance with the ARRIVE guidelines.
Inclusion and exclusion criteria
Healthy animals without signs of illness before surgery (e.g. kyphotic body position, lethargy etc.) were included in the study (as judged by the technician performing the experiment). Exclusion criteria, also as judged by the technician, were respiratory- or circulatory failure; moderate to severe anemia, electrolyte or acid-base disorders at baseline; signs of bleeding into the dialysate; extra-peritoneal leakage of dialysate; infusion pump- or cycler dysfunction which could not immediately be remedied.
Blinding and randomization
Two interventions were performed initially in this study: control (no pulsations) (C) and 2 mL pulsations (1.25 pulses/min). An interim analysis was performed after finishing experiments for the control- and 2 mL groups. The analysis did not show efficacy, so it was decided to continue the study by performing larger pulsations of 5 mL in a third group. In order to minimize possible bias caused by doing the experiments in a certain order, the order of the initial experiments was randomized using a random number generator. The random sequence was C, M, M, M, C, C, C, M, C, M, C, M, M, M, C, C (C = control, M = 2 mL pulsed PD). Blinding could not be performed since it was obvious to the technician performing the experiments (Helén Axelberg) which group a certain animal belonged to. However, the technician performing the experiments was at all times kept unaware of the purpose of the study to minimize possible bias.
Surgery
The surgical procedure and experimental PD setup was essentially the same as that in our recent study. 6 A schematic of the experiment is shown in Figure 1(A). Briefly, the animal was placed in a glass container to which a continuous supply of 5% isoflurane in air (Isoban, Abbot Stockholm, Sweden) was administered. Following induction of anesthesia, the animal was removed from the container. Anesthesia was then maintained with 1.6–1.8% isoflurane in air delivered via a mask. After tracheostomy, the animal was connected to a volume-controlled ventilator (Ugo Basile; Biological Research Apparatus, Comerio, Italy). End-tidal pCO2 was monitored continuously using a capnograph (Capstar-100, CWE, Ardmore, Pa) and maintained between 4.8 and 5.5 kPa. Body temperature was kept between 37.1°C and 37.3°C by means of a feedback-controlled heating pad. The left femoral artery was utilized for the measurement of MAP and heart rate; and to draw blood samples (95 μL) for the measurement of creatinine, urea, glucose, electrolytes, and hemoglobin (I-STAT, Abbot, Abbot Park, Ill). Access via the right femoral vein was established for infusion of a maintenance saline infusion (3 mL h−1). A small amount of creatinine (0.5 mg) and 51Cr-EDTA (0.34 kDa) was added to the dialysate. The former to ensure that dialysate concentrations are higher than the lower limit of detection for creatinine on the i-STAT instrument. Access to the peritoneal cavity was established percutaneously by means of a multi-holed catheter which was tightly secured to the skin using cyanoacrylate (Histoacryl, B. Braun Surgical, Rubi, Spain). After the PD-dwell, the dialysate was quickly recovered from the peritoneal cavity, first by simple extraction using a syringe to draw fluid from the PD-catheter. Residual fluid was thereafter gently be retrieved from the peritoneal cavity using pre-weighed gauze tissues to ensure that all fluid was recovered. For UF determination we used simple mass balance UF = Vout−Vin, although we also calculated residual volumes as described in the work by Martus et al. 7 PD fluids were pre-warmed to 37°C before use. Animals were euthanized by an intravenous bolus injection of potassium chloride after the experiment. Directly before dialysate sampling, a 1 mL bolus of the dialysate was flushed back and forth several times. Animals treated with pulsed PD will have a fill volume that is 20 mL (control) + 50% of the pulse volume to avoid reduced surface area as an effect of a lower average intraperitoneal volume (see also Ref. 8 ).
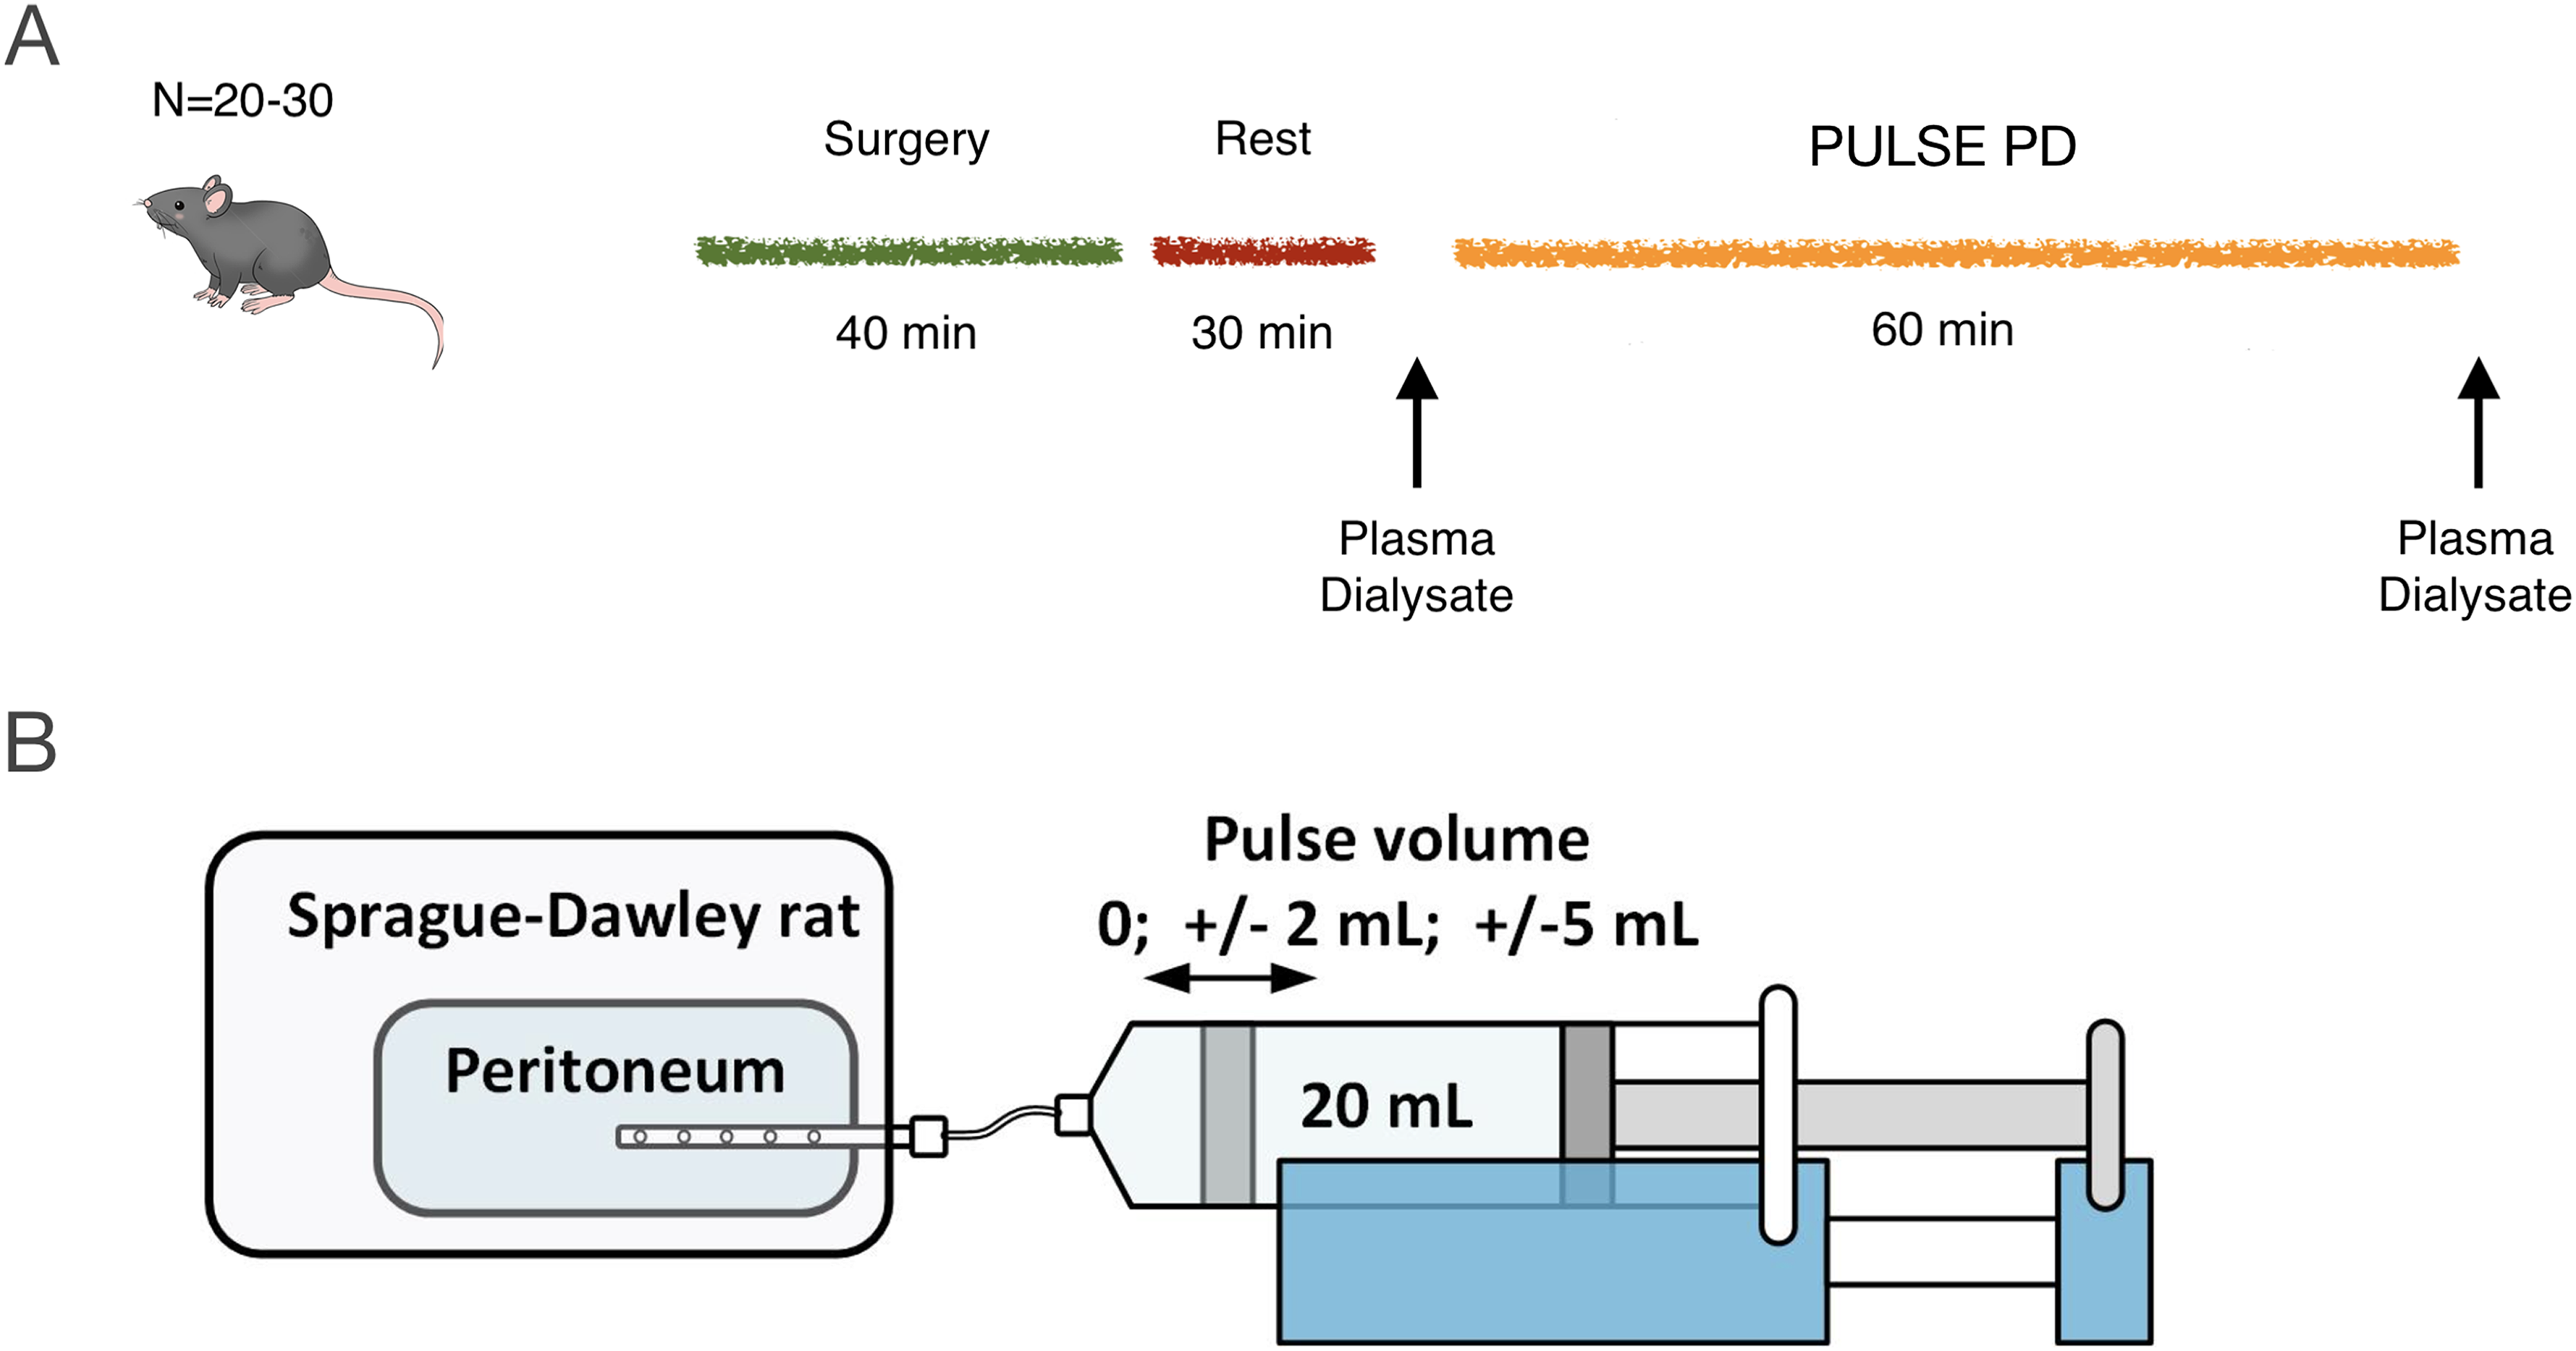
(A) Twenty-four animals were divided into SHAM (n = 8) and two treatment groups receiving pulsed PD. At 20 min following surgery, PD was started either without pulsations or with pulsations. Before and after dialysis blood and dialysate samples for routine chemistry (iSTAT1) will be taken. Blood pressure and heart rate were continuously monitored during the course of the experiment. (B) Pulsed regimens utilized a pulse volume of either 2 mL (10% of average intra-peritoneal volume) (n = 8) or 5 mL (25% of average intra-peritoneal volume) (n = 8).
Choice of pulse volume and frequency
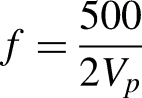
We assume that an achievable pulse flow rate for PPD performed via a conventional PD catheter is 500 mL/min (25% of fill volume). If utilizing a fill volume of 20 mL, this corresponds to a pulse flow rate of 5 mL/min in rats. The frequency of pulsations will be lower the larger the pulse volume is, as follows:
Study interventions
Animals were divided into three groups of eight animals: one control group (no pulsations), one group with 2 mL pulsations (1.25 pulses/min) and another group receiving 5 mL pulsations PD (0.5 pulses/min). All pulsed regimens were delivered using a pull/push syringe pump (Legato 270P, KD Scientific Inc., MA USA). After an initial resting period of 20 min, experimental PD was performed with a dwell time of 60 min using 1.36% glucose fluid (Baxter Inc, Ill.) either performed as a single dwell without pulsations (control) or as a single dwell with pulsations (intervention) (Figure 1(B)). Before and after dialysis, blood chemistry was assessed (Na, Cl, K, total CO2, Glucose, creatinine, urea, Ca-ion, Hemoglobin, Hematocrit). Samples from the dialysate were collected before and immediately after filling of PD-fluid, as well as after dialysis, and were analyzed for 51Cr-EDTA activity and Na, Cl, K, total CO2, creatinine, urea, and Ca-ion concentrations. In contrast to patients, filling and draining the peritoneal cavity in rats take very little time (<< 1 min). Dwell times does not include the initial fill phase or final drain phase. Plasma-to-dialysate clearances were calculated as the average solute removal rate (mmol/min) divided by the mean plasma concentration (mmol/L). Dialysate-to-plasma clearances were calculated as the mean solute absorption rate (mmol/min) divided by the average dialysate concentration (mmol/L). Isovolumetric and isocratic diffusion capacities were calculated as described previously. 5
Primary outcome
The primary outcome of this study was the dialysate clearance of 51Cr-EDTA calculated as

Secondary outcomes
Secondary outcomes are UF and UF per gram glucose absorbed, sodium dip (Nastock-Na60) and 125I-albumin dialysate clearance.
Exploratory outcomes
Exploratory outcomes are diffusion capacities and clearances for other solutes such as urea, creatinine, and glucose. Plasma-to-dialysate clearances were calculated from Solute removal (e.g. mmol/L)/Plasma concentration (average). Plasma concentrations were corrected for the plasma water fraction (assumed to be 95%) and, for charged solutes, the Gibbs-Donnan effect 9 (assumed to be 0.96z where z is the valence). Dialysate clearances were calculated as for 51Cr-EDTA (see above). Glomerular filtration rates were estimated from the plasma-to-urine clearances of 51Cr-EDTA.
Sample size and power analysis
Data from a previous study was used to estimate the coefficient of variation of ClEDTA to 13.6%. A Monte Carlo based power analysis was conducted by generating random samples 10,000 times based on the assumption of a 25% and 50% increase for the 2 and 5 mL groups, respectively. The analysis revealed 83% power to detect a significant difference in ClEDTA between the control group and the pulse PD 1 group, for the difference between the pulse PD 2 group and the control group, the statistical power was 99.7%. For UF, if assuming a coefficient of variation of 20%, the power analysis showed 50.2% power for the 25% effect, and 87.7% power for the 50% effect.
Flow distribution in an artificial model of the human peritoneum
Based on a CT (computed tomography) scan of female patient, a simplified 3-dimensional model was created by using the construction software SolidWorks. The so generated SolidWorks file made it possible to 3-d print the abdominal cavity. A catheter was placed into the model and fluid was pumped into the artificial abdominal cavity. By inserting ink into the flow during pulsation the mixing and distribution effect could be visualized. A fill volume of 2 L was used and pulses of 7.5, 75, and 233 mL were applied at a frequency of 2 pulses per minute except for the 233 mL pulse volume which was applied at a frequency of 3 pulses per minute.
Statistical methods
Data are displayed as median (interquartile range) unless otherwise stated. Significant differences between groups were assessed using a non-parametric Kruskal–Wallis omnibus-test, followed by post-hoc contrasts when significant. Adjustment for multiple comparisons was performed using the Benjamini-Hochberg procedure when applicable. Calculations were performed using R for mac (version 4.1.1).
Results
Experimental PD was performed in 24 Sprague-Dawley rats, either performing a single 60-min treatment without pulsations (control; n = 8), or with 2 mL pulses (n = 8) or 5 mL pulses (n = 8). Both pulsed regimens used a pulse flow rate of 5 mL/min resulting in a total of 75 pulsations for the 2 mL group and 30 pulses for the 5 mL group. Routine- and treatment parameters are shown in Supplemental Table 1. Median residual volume assessed using 125I-albumin was 1.8 mL (0.5 to 3.3). For 51Cr-EDTA, similar median values were obtained, being 2.2 mL (1.3 to 4.0). Glomerular filtration rate assessed using 51Cr-EDTA was 2.1 mL/min (1.3 to 3.2) and urine output during dialysis was 18 μL/min (10 to 25).
Pulsed PD did not significantly increase dialysate clearance of 51Cr-EDTA, but had small but significant effects on small solute transport
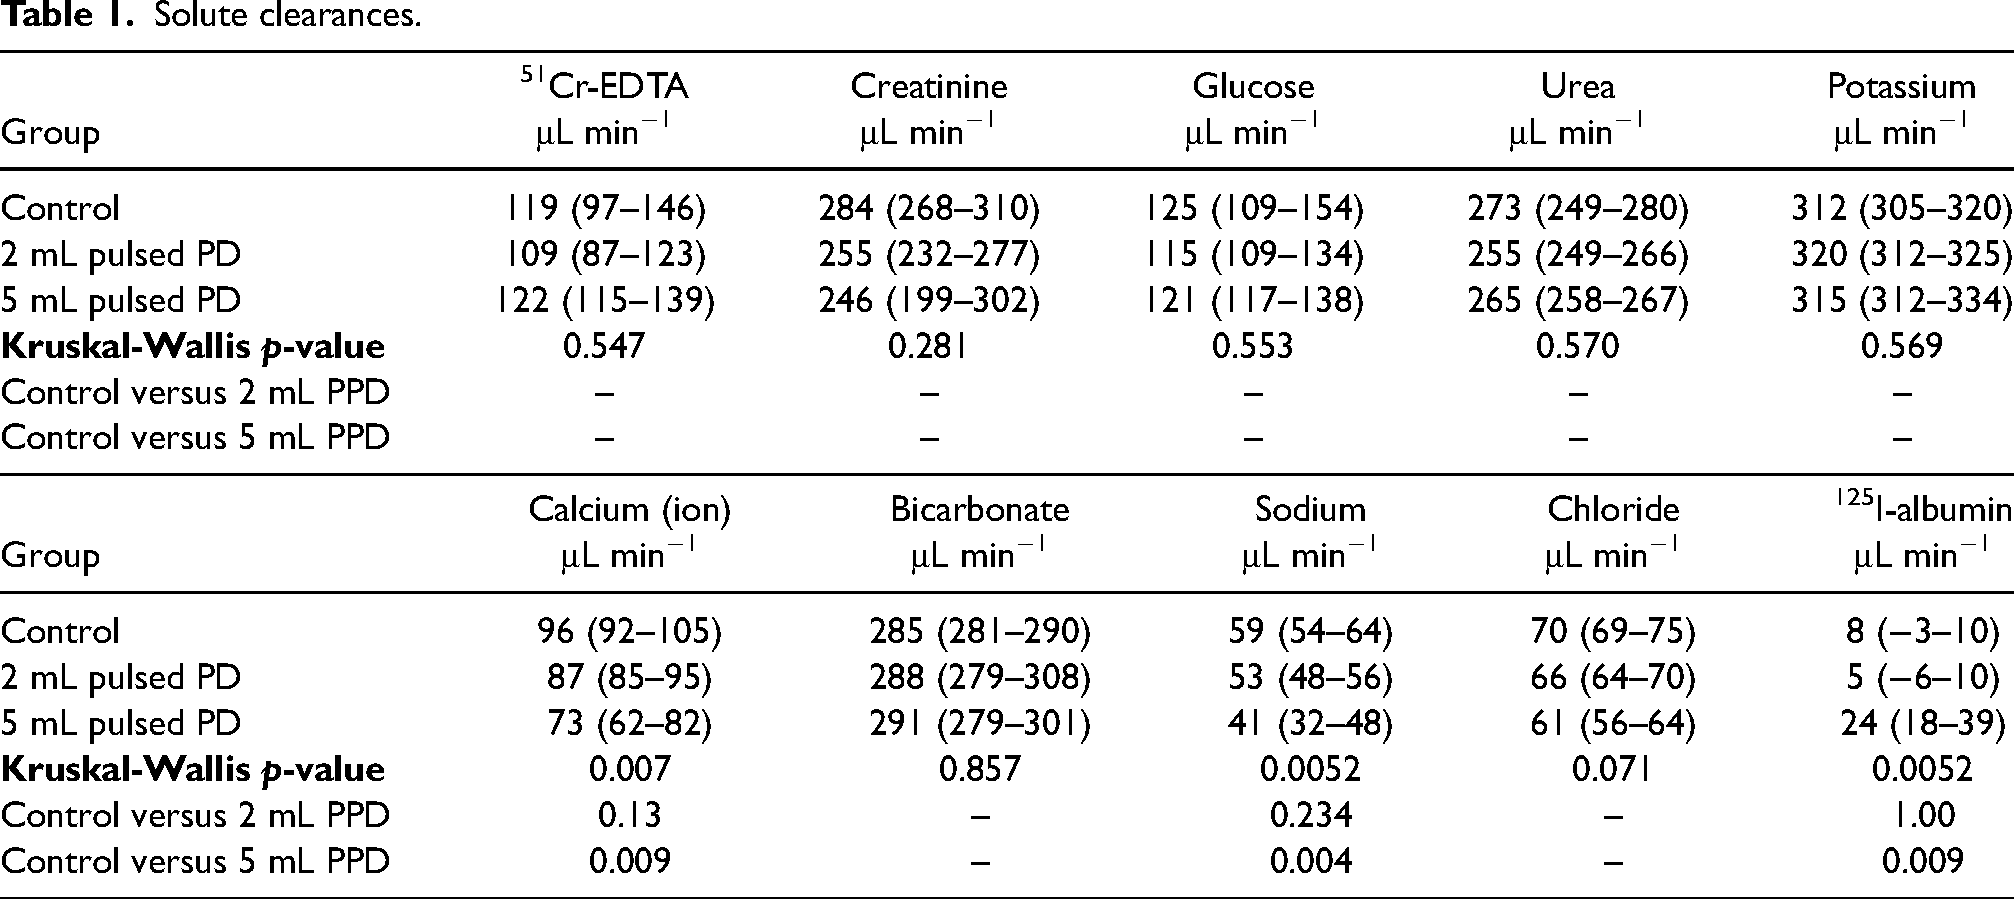
As seen in Figure 2(A) and (B), the clearance and diffusion capacity of 51Cr-EDTA was not different from control for the two pulsed treatment regimens (Table 2). Ultrafiltration (volume in-volume out) was lower in the 5 mL pulsed treatment (Figure 2(D)). In contrast, as seen in Figure 2(E), there were no significant differences in 60-min sodium dip (stock dialysis fluid sodium-60 min dialysate sodium) (Kruskal–Wallis χ2 = 0.91, p = 0.63). Dialysate clearances of extracellular ions calcium and sodium decreased in the 5 mL pulsed PD group (Table 1), but no significant differences were detected for other analytes.
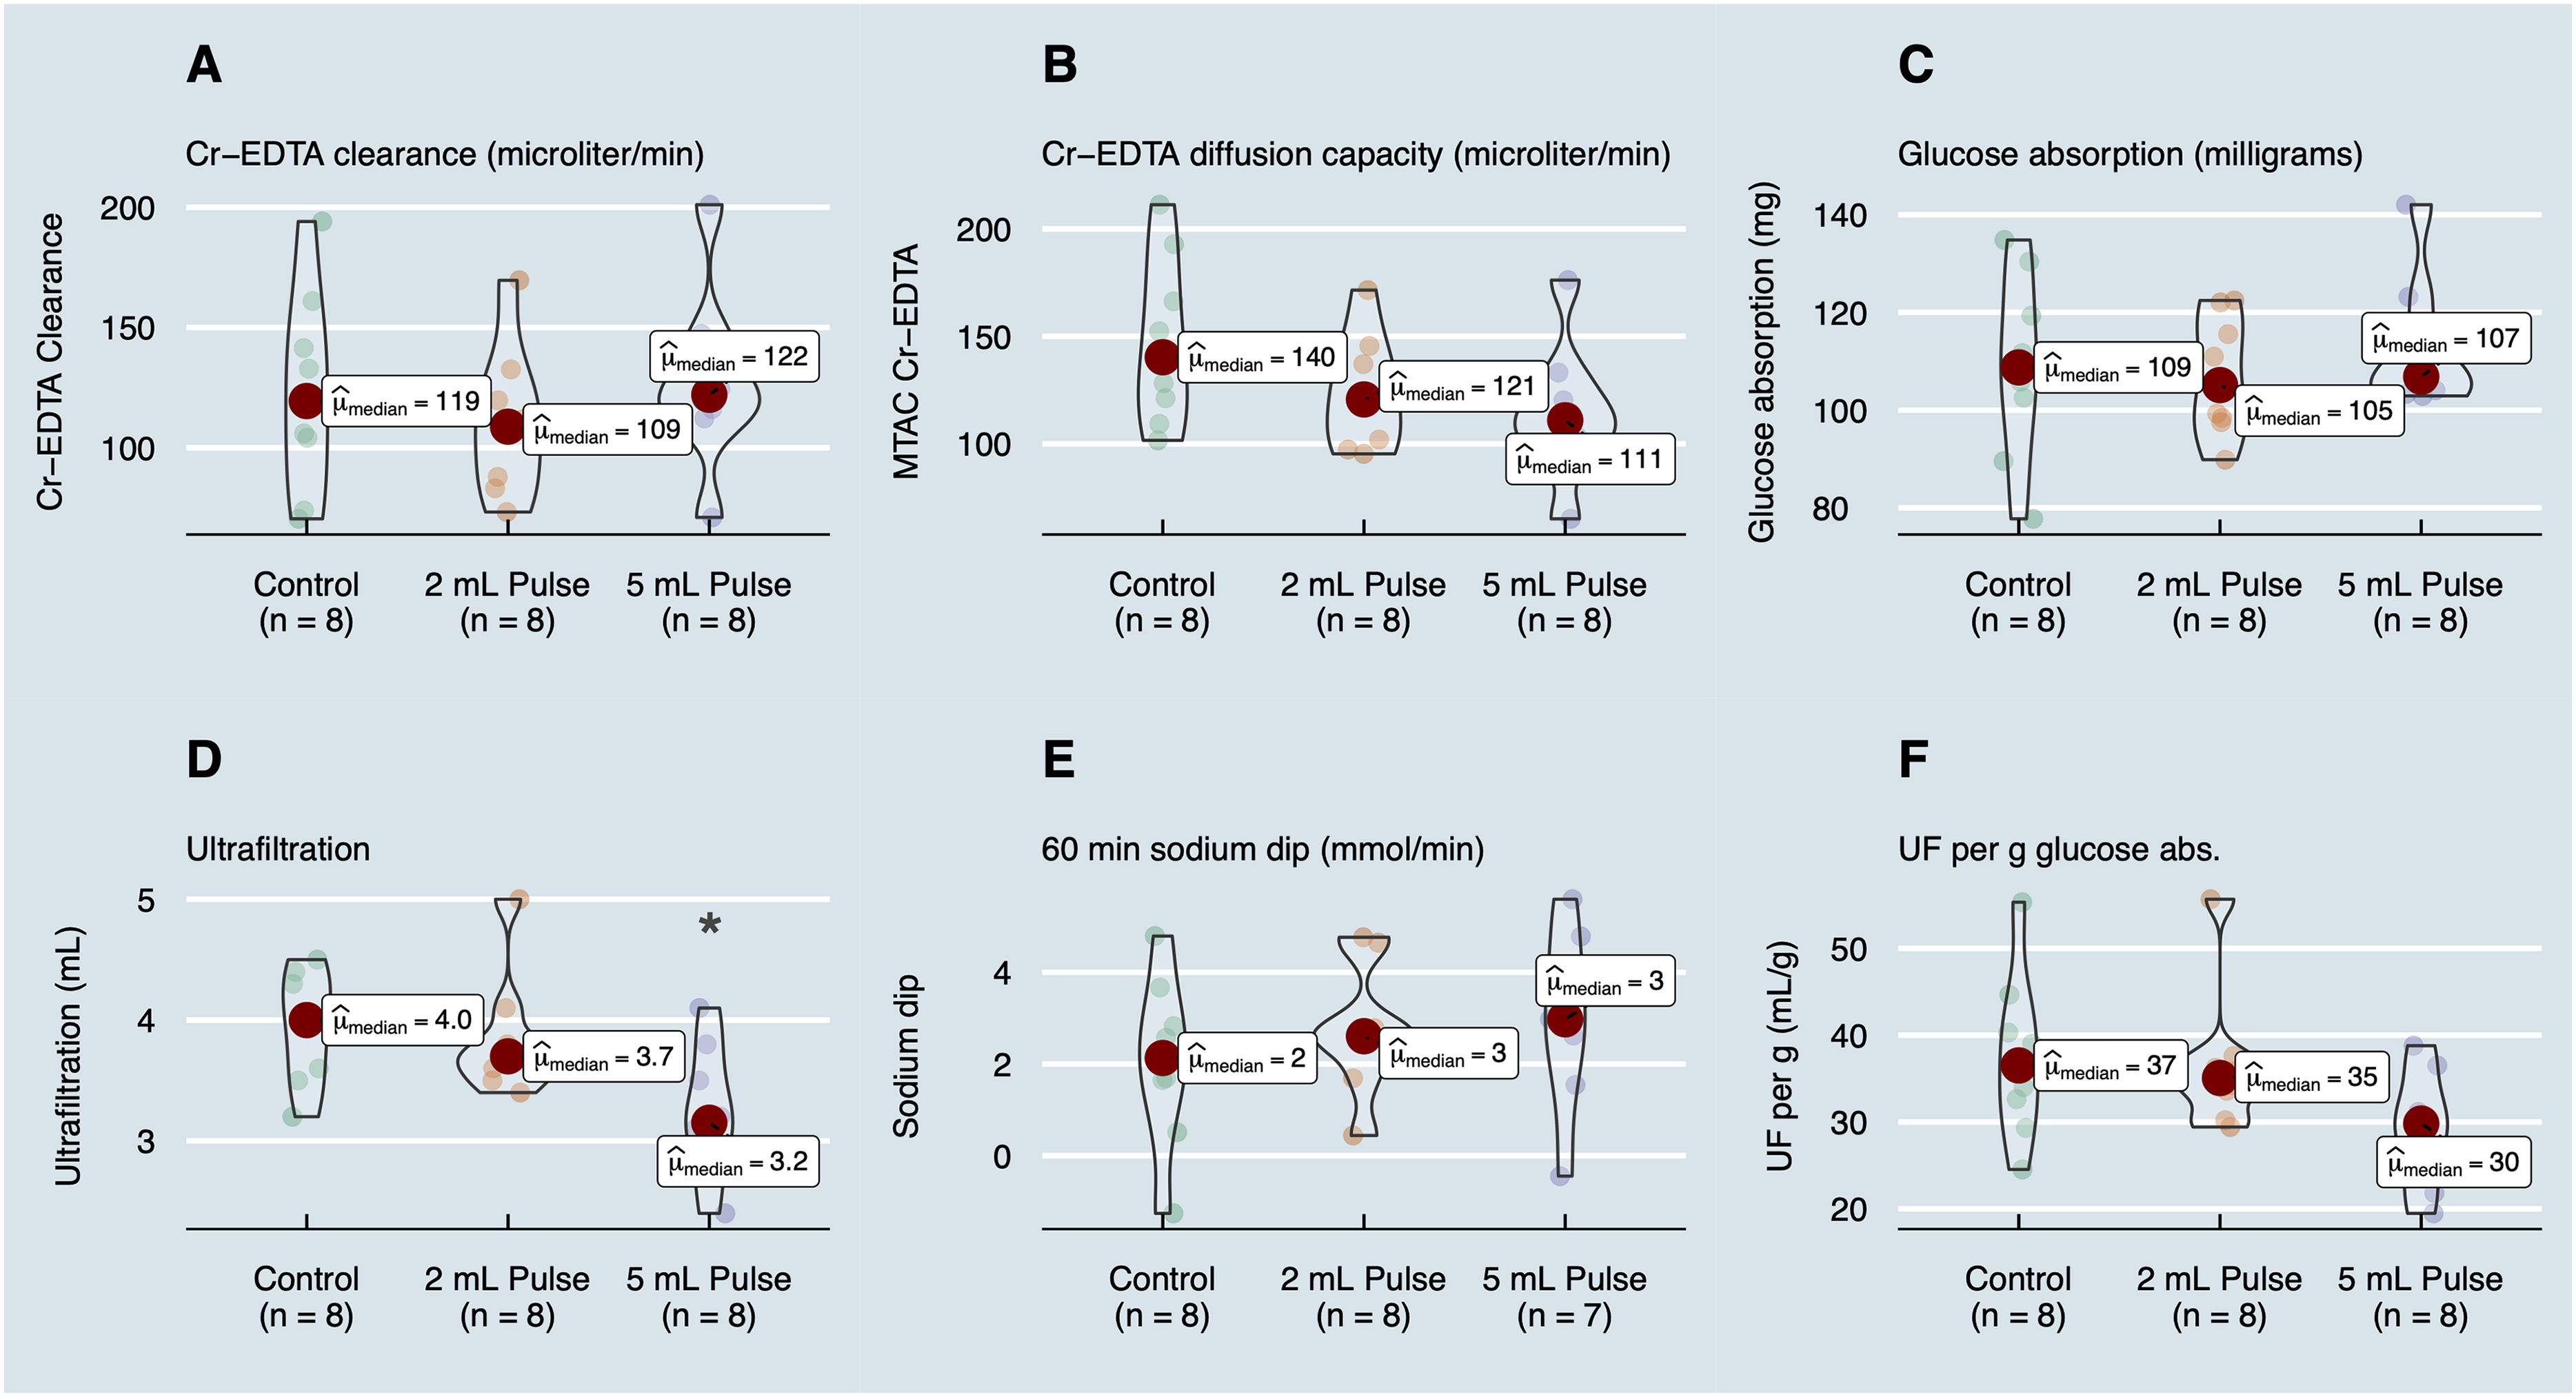
Outcomes of the study. Dialysate clearances (A) and isocratic diffusion capacities (B) of 51Cr-EDTA for the different treatment groups (μL/min). (C) Glucose absorption during the entire session (mg). (D) Drained ultrafiltration (UF) (OUT-IN). (E) 60-min sodium dip (stock Na–Na60). (F) UF efficacy (UF per gram glucose absorbed).
Solute clearances.
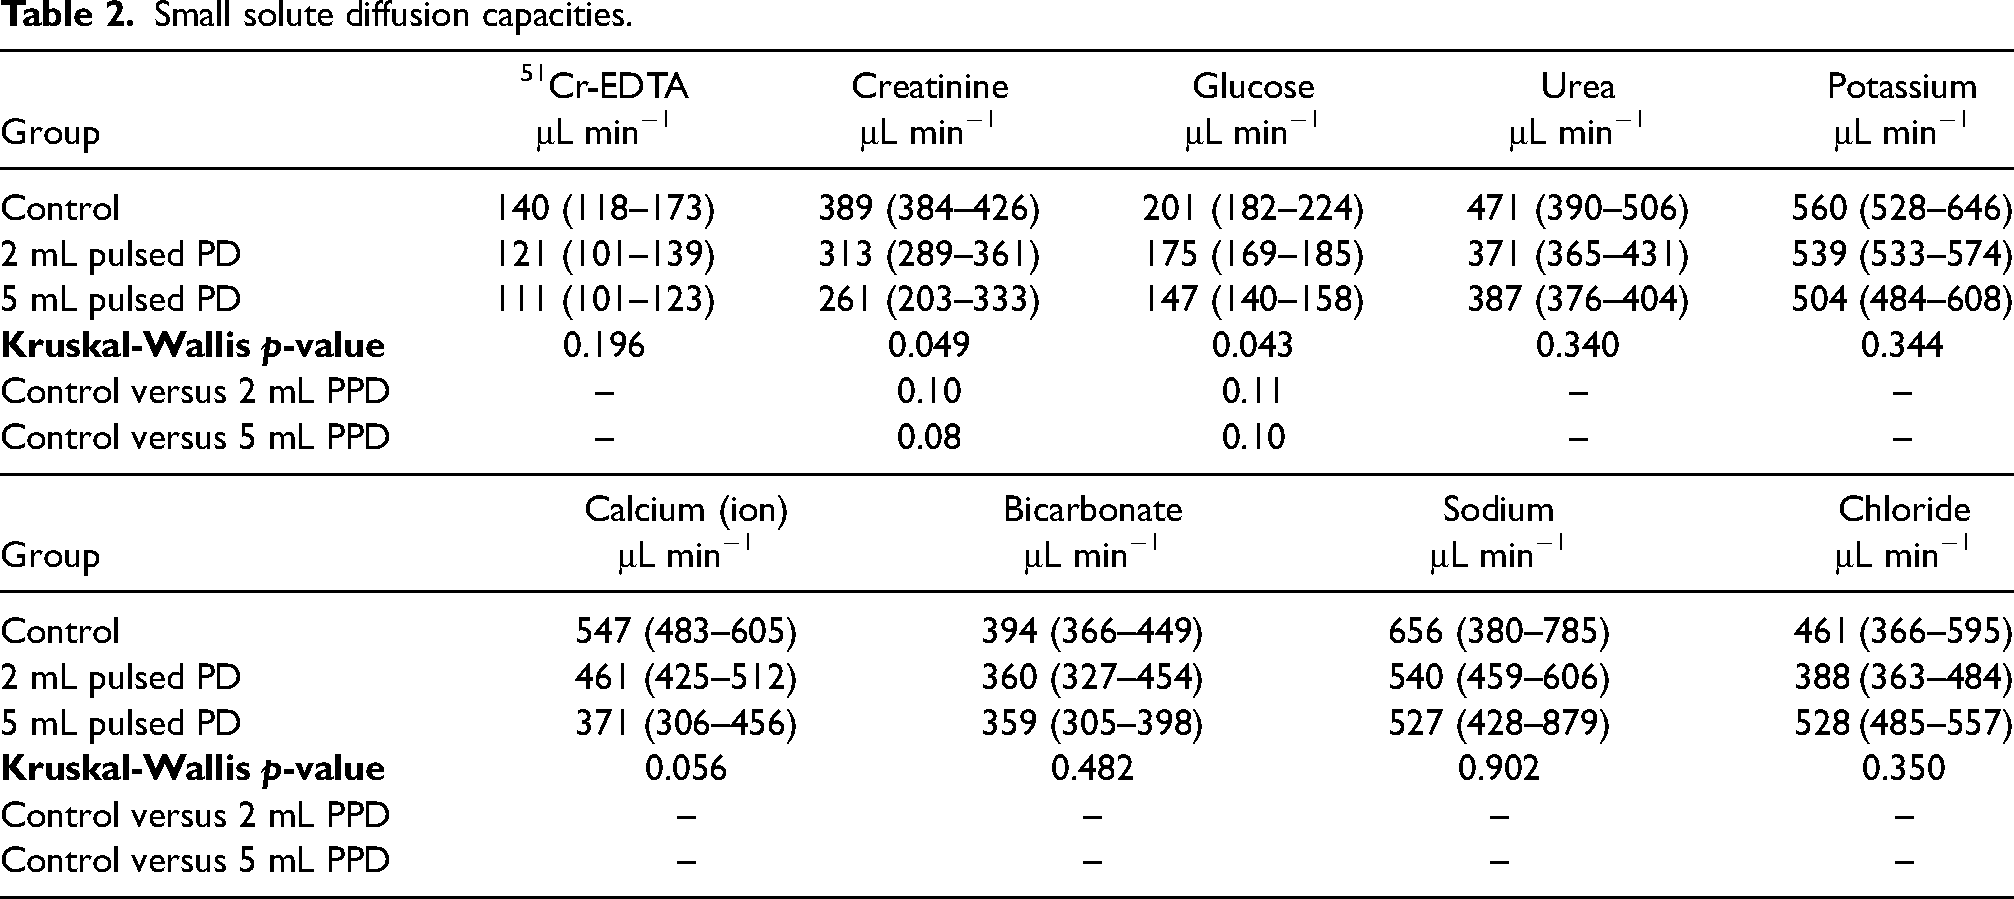
Small solute diffusion capacities.
Pulsed PD with 25% pulse volume reduced UF by increasing the fluid absorption rate
Ultrafiltration was lower (p = 0.047) in the 5 mL pulsed PD group, being 3.2 mL (3.0 to 3.6) compared to control 4.0 mL (3.6 to 4.3) and the 2 mL group 3.7 mL (3.6 to 3.9) (Figure 2(D)). Also, fluid absorption rates in terms of the dialysate clearance of 125I-albumin were markedly higher in the 5 mL pulsed regimen, being 24 μL/min (18 to 39) compared to controls 8 μL/min (−3 to 10) in controls (p = 0.009) and the 2 mL group 5 μL/min (−6 to 10). By simple calculation one sees that 60 min dwell time × (24−8) μL/min = 960 μL, which is close to the difference in UF (∼850 μL) between control and the 5 mL group. Actual trans-peritoneal UF rates (net UF rate + fluid absorption rate) were unaffected being 42 μL/min (27 to 57) and 42 μL/min (20 to 57) in the 2 and 5 mL groups, respectively, compared to controls 43 μL/min (13 to 27) in controls (Kruskal–Wallis p = 0.87). Also, the sodium dip was unaltered during pulsed regimens (Figure 2(E)), also supporting the hypothesis that the decrement in UF was caused by an increased tissue fluid absorption rate. One may thus conclude that the observed difference in UF between control and 5 mL pulsed PD is due to increased fluid absorption rate into tissue/lymph.
Analysis of small solute diffusion capacities shows intact small solute transport during pulsed regimens
Isocratic diffusion capacities for the different analytes are shown in Table 2. Although omnibus testing indicated differences between groups for creatinine, glucose, and calcium with a decreasing diffusion capacity with pulse volume (larger pulse volume ≥ lower diffusion capacity), post-hoc testing showed no significant effects (Table 2). The definition of diffusion capacity is the maximal diffusive clearance of a solute. The latter is the result of multiplying the diffusion capacity (MTAC) with the relative concentration gradient (0–100%) according to Fick's first law: Cl = MTAC(Cfrom−Cto)/Cfrom. Differences between solute diffusion capacity and clearance for all analytes are plotted in Figure 3. Solutes that have a very large gradient such as 51Cr-EDTA have clearances that are essentially equal to the diffusion capacity. In contrast, solutes that exhibit small gradients across the peritoneal membrane such as sodium, calcium, and chloride, have clearances that are closer to the UF rate (median UF rate was 61 μL/min). Correlation analysis between all solute MTACs showed reasonable agreement between most analytes (Supplemental Figure 4A). Principal component analysis revealed that the first component accounted for most of the variance (circa 80%) (Supplemental Figure 4B). Horn's parallel analysis confirmed that only the first principal component needs to be retained. Data were then regularized by retaining only the first component. Re-analysis on regularized data showed non-significant differences for all solutes (Supplemental Table 2).
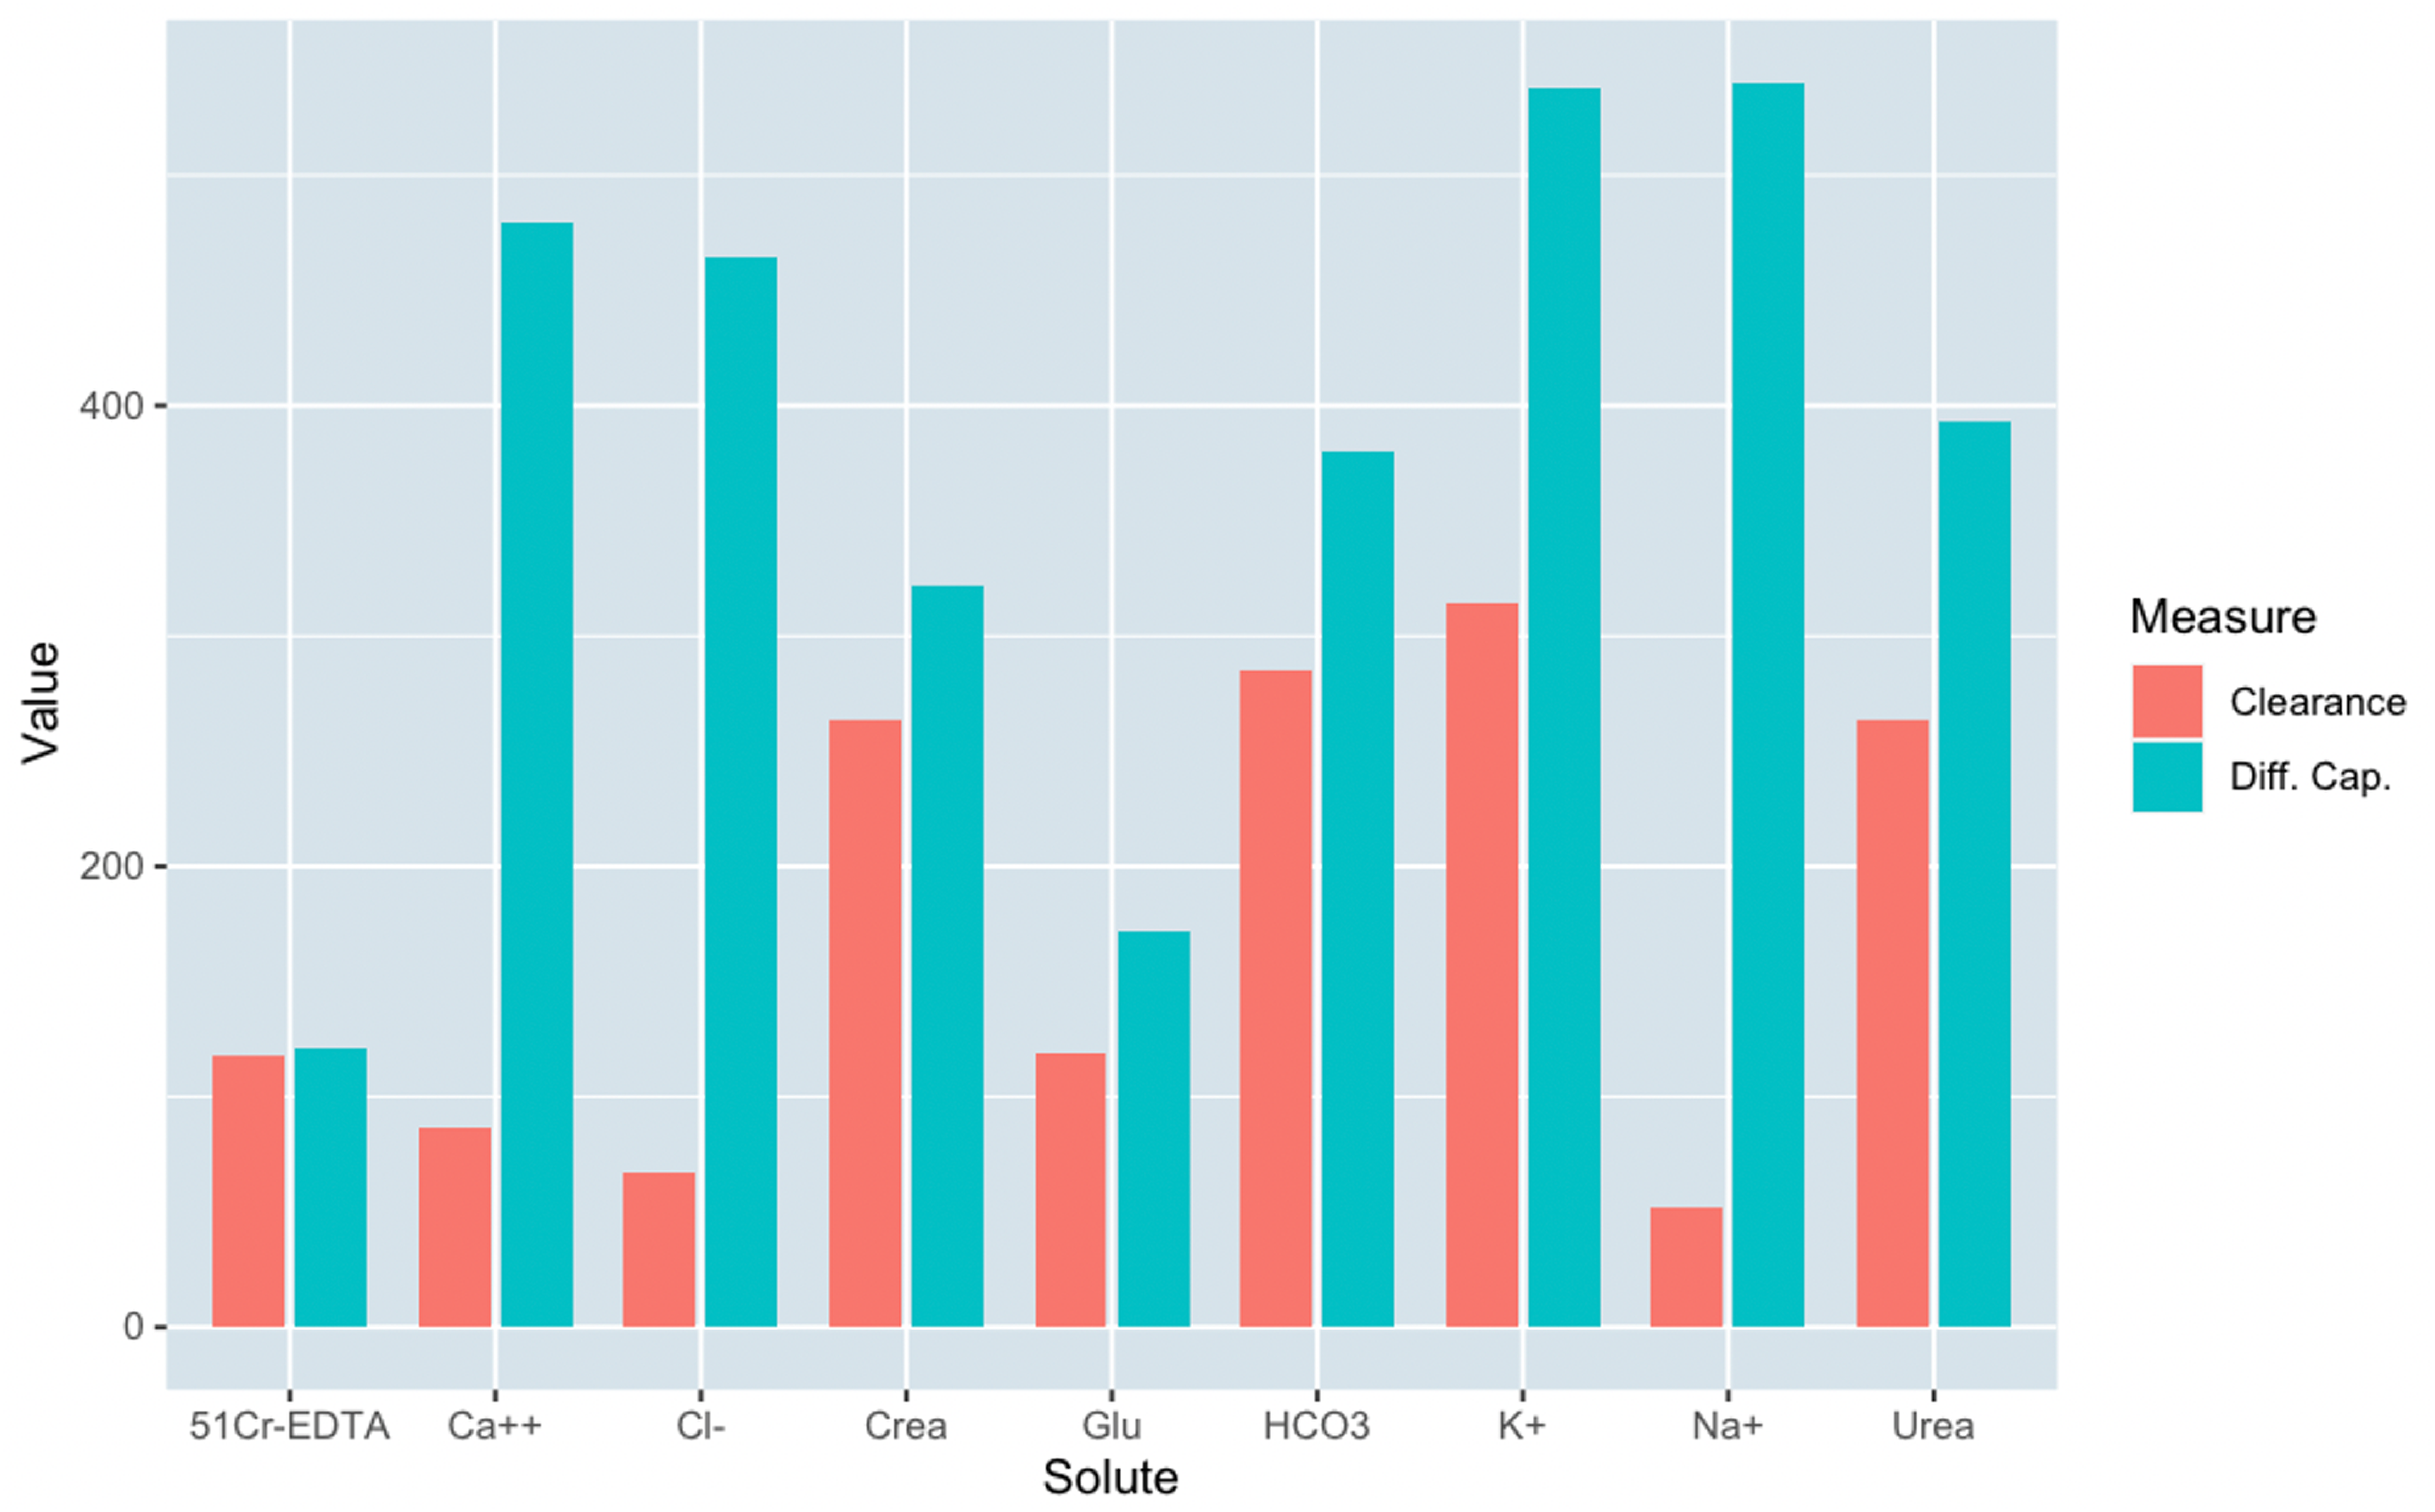
Clearances versus diffusion capacities (both in μL/min) for all animals and all small solutes: 51Cr-EDTA, calcium ion (Ca++), chloride (Cl-), creatinine (urea), glucose (glu), total carbon dioxide (HCO3), potassium (K+), sodium (Na+), and urea.
Mixing effect in the artificial abdominal cavity
The effect of mixing the dialysate was also evaluated in vitro in a 3D-printed model of the peritoneum based on a CT scan from a female PD patient. Utilizing a pulse volume flow of 30 mL/min (1.5% of fill volume) and a pulse time of 30 s resulted in a minimal mixing effect in the lower pelvis area (Supplemental Figure 5A). In the next step, the flow and the pulse time was increased to 30 s and 300 mL/min. Improved mixing of the ink in the pelvis area and in the paracolic gutter area could be observed (Supplemental Figure 5B), but little effect in the perihepatic area. A further increase of the flow showed a better mixing effect in the pelvis area, paracolic gutter area, and perihepatic area (Supplemental Figure 5C).
Discussion
This study is the first to explore pulsed PD, aimed at evaluating the effect of mixing the fluid inside the peritoneal cavity by small and frequent pulses of dialysate. The underlying assumption is that the dialysate is not well-mixed during standard PD exchanges, reducing gradients adjacent to the peritoneal membrane. From the present data, the effect on small solute clearance by mixing the dialysate using pulsed regimens appears small or non-existent. In contrast, Zakaria 3 and also Levitt 10 found marked increments in small solute diffusion capacity (∼1–300% increase) by placing the animal on a vibrating pad. The authors speculated that stirring was the mechanism, but another effect of vibration is local vasodilation 11 which, in light of the present data, appears to be a more likely mechanism. 12 The present findings may have implications on the choice of tidal volume in APD with very frequent tidal exchanges, since we found a lower UF for the 25% pulse volume. However, several lines of evidence indicate that tidal exchanges provide a slight advantage in solute clearance over intermittent exchanges at higher dialysate flow rates and vice-versa.4,13 Thus, one may conclude that the observed negative effects on UF in this study may be an issue only at very high DFRs (e.g. 3 L/h and above) where a lower tidal volume of 10% should then be more favorable than 25%. The increased fluid- and lymphatic absorption rate in the present experiments may be due to a higher intraperitoneal pressure in pulsed regimens. It is well-established that an increase in intraperitoneal hydrostatic pressure will lead to increments in fluid absorption rates. 14
The small-solute diffusion capacity of the peritoneal membrane was herein calculated using the isocratic model, which was recently found to closely correlate with the three-pore model. 5 The isocratic model also takes convective- and free-water transport (FWT) into account, under the assumption of a constant (isocratic) UF rate. Thus, the model should be most accurate for shorter dwell times. The initial dilution of the dialysate solute concentration due to FWT 15 will affect all solute concentrations in the dialysate. Thus, models that do not take this into account will typically overestimate diffusion capacities in proportion to the amount of FWT. The model used herein did not however take into account the vasodilation caused by PD fluids, 16 but it has been shown that this effect is small and transient in rats when using newer low-GDP solutions. 17 The mechanisms behind the vasodilation caused by PD-fluids remain obscure. Zakaria performed studies in rats, showing that the acute effects appear to be caused mainly by the hyperosmolality of the solution, 18 possibly mediated via the endothelial NO-system. It is interesting to note that the observed effects may not only be an effect of an increased peritoneal blood flow, but may also affect capillary permeability per se. Indeed, several lines of evidence indicate that the NO-system acts as a double-edged sword in its role in the maintenance of capillary permeability. 19 At low levels of activity, NO-activation counter-acts increments in capillary permeability. In contrast, if endothelial NO synthase is markedly upregulated, but not its cofactor tetrahydrobiopterin, then so called NO uncoupling occurs leading to the formation of reactive oxygen species 20 which typically act to increase microvascular permeability 19 as well as inducing oxidative stress. 20
There are several limitations in the present experiments. First, and foremost, experiments were performed in healthy rats that were naïve to PD. Indeed, the properties of the peritoneal membrane are quite different during chronic conditions. 21 However, relative effects of stirring should be quantitatively the same, regardless of the properties of the peritoneal membrane. In addition, the flow rate with which pulses can be performed in a patient with normal catheter function was here assumed to be circa 500 mL/min (25% of fill volume, corresponding to 5 mL/min in rats). This value is higher than those obtained during a clinical treatment, where fill rates are usually around 300 ml/min and initial drain rates are a bit higher 350 ml/min—using only gravity as the driving force. However, due to the fact that only a very small portion of fluid is removed and that pulse PD will most likely be performed using mechanical pumps in a clinical setting, higher flow rates can most likely be achieved. Furthermore, the artificial peritoneum used lacks many of the characteristics present in the real peritoneum which is much more elastic and also is in constant movement due to breathing and peristalsis—providing natural mixing of the dialysate. Lastly, the small number of animals used means that only large effect sizes can be detected. This is an important limitation given that many results were non-significant in the present study.
The present experiments represent the first experimental study of pulsed PD, and may serve as a basis for further theoretical, experimental, and clinical studies. We conclude that the present results suggest that the effect of stirring the dialysate is small, and that other explanations should be sought for the increments in diffusive transfer during vibration 3 and high-volume APD.4,22
Supplemental Material
sj-docx-1-ptd-10.1177_08968608241299871 - Supplemental material for Pulsed peritoneal dialysis in an experimental rat model: A first experience
Supplemental material, sj-docx-1-ptd-10.1177_08968608241299871 for Pulsed peritoneal dialysis in an experimental rat model: A first experience by Carl M Öberg, Steffen Wagner, Sture Hobro and Baris U Agar in Peritoneal Dialysis International
Footnotes
Acknowledgements
The authors are grateful for the excellent experimental work by Helén Axelberg. The study was funded by Lund University Medical Faculty Foundation grant YF 2020-YF0056, The Inga-Britt and Arne Lundberg's Research Foundation, and Baxter Healthcare (all to C.M. Öberg).
Author contributions
CAÖ, SH, BA, and SW conceived and designed the study. CAÖ drafted the manuscript and performed statistical analyses. SH and CAÖ drafted figures. SW performed in vitro experiments with the artificial peritoneum. All authors revised the manuscript and approved the final version of the manuscript.
Data availability
Declaration of conflicting interests
The authors declared the following potential conflicts of interest with respect to the research, authorship, and/or publication of this article: C.M. Öberg reports research grants from Baxter Healthcare and Fresenius Medical Care, and speaker's honoraria from Baxter Healthcare and Boehringer-Ingelheim. C.M. Öberg reports a consultancy agreement with Baxter Healthcare and an advisory or leadership role with the Peritoneal Dialysis International editorial board. All other authors are employees of Baxter International Inc.
Funding
The authors disclosed receipt of the following financial support for the research, authorship, and/or publication of this article: This work was supported by the IngaBritt och Arne Lundbergs Forskningsstiftelse, Lund University Medical Faculty Foundation, Baxter International.
Supplemental material
Supplemental material for this article is available online.
References
Supplementary Material
Please find the following supplemental material available below.
For Open Access articles published under a Creative Commons License, all supplemental material carries the same license as the article it is associated with.
For non-Open Access articles published, all supplemental material carries a non-exclusive license, and permission requests for re-use of supplemental material or any part of supplemental material shall be sent directly to the copyright owner as specified in the copyright notice associated with the article.