
Abstract
Background
Variation in residual volume between peritoneal dialysis dwells creates uncertainty in ultrafiltration determination, dialysis efficiency, and poses a risk of overfill if the residual volume is large. Measuring the dilution of a marker molecule during fluid fill offers a convenient approach, however, estimation accuracy depends on the choice of dilution marker. We here evaluate the feasibility of creatinine and urea as dilution markers compared to albumin-based residual volumes and three-pore model estimations.
Method
This clinical, retrospective analysis comprises 56 residual volume estimations from 20 individuals, based on the dilution of pre-fill dialysate creatinine, urea and albumin concentrations during the dialysis fluid fill phase. Outcomes were compared individually. Bias induced by ultrafiltration, marker molecule mass-transfer and influence of fluid glucose contents was quantified using the three-pore model. Linear regression established conversion factors enabling conversion between the various marker molecules.
Results
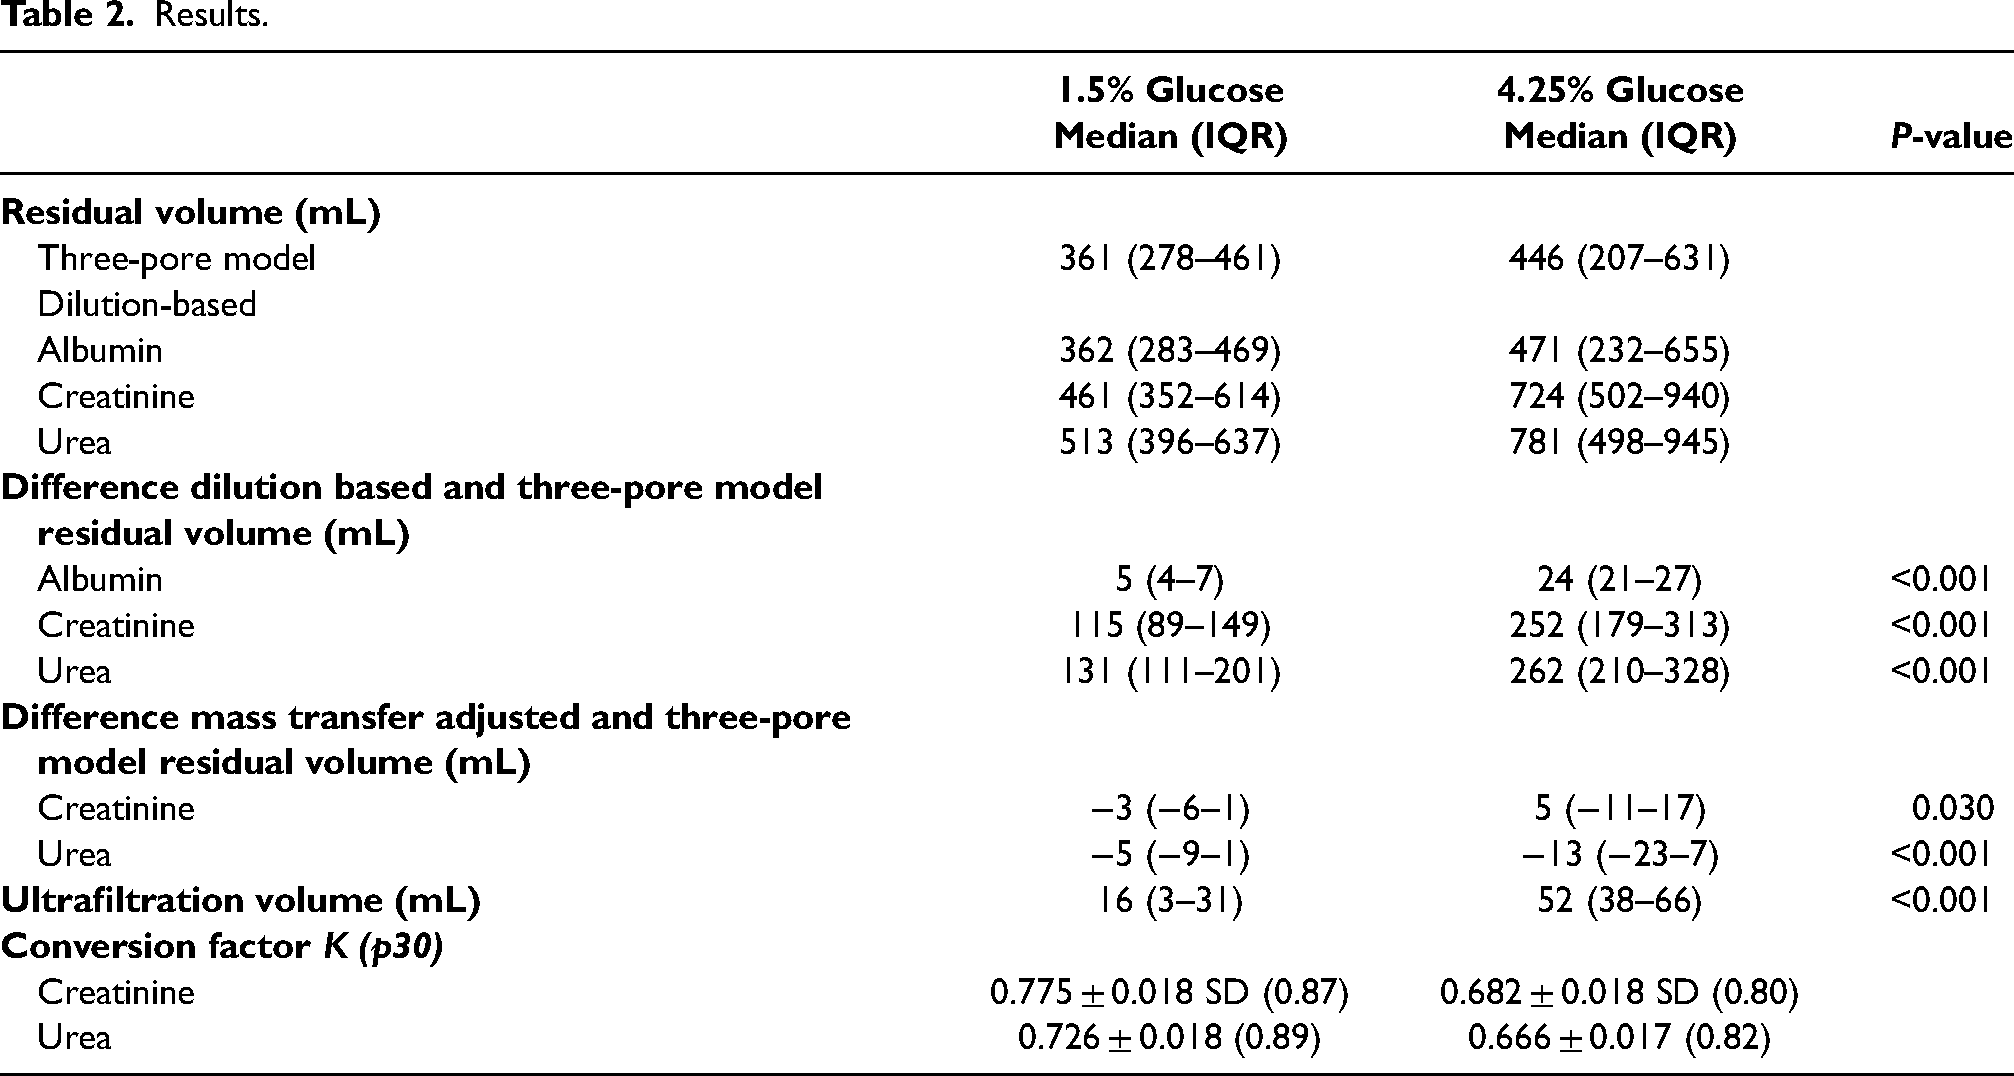
Creatinine-based calculations overestimated residual volumes by 115 mL (IQR 89–149) in 1.5% dwells and 252 mL (IQR 179–313) in 4.25% glucose dwells. In hypertonic dwells, ultrafiltration was 52 mL (IQR 38–66), while intraperitoneal creatinine mass increased by 67% during fluid fill, being the leading cause of overestimation. Albumin-based volumes conformed strongly with three-pore model estimates. Correction factors effectively enabled marker molecule interchangeability.
Conclusions
Mass-transfer of low molecular weight marker molecules is associated with residual volume overestimation. However, by applying correction factors, creatinine and urea dilution can still provide reasonable estimates, particularly when the purpose is to exclude the presence of a very large residual volume.
Introduction
The uncertainty in intraperitoneal residual volume, which is the remaining dialysate fluid volume between peritoneal dialysis dwells, presents challenges in clinical practice and research. The residual volume fluctuates between dwells due to variations in dialysis fluid fill volume, drain volume and ultrafiltration, which in-turn depends on the functionality of the catheter, treatment prescription and the transport status of the patient's peritoneal membrane. An unknown residual volume introduces treatment efficiency variations due to volume-dependent dilution of glucose and small solute concentrations of the freshly installed dialysis fluid and potential remains of alternative osmotic agents, such as Icodextrin. A large residual volume might increase the intraperitoneal pressure and alter the membrane area available for transport.1,2 The relationship between residual volumes and transport properties has been observed, as exemplified by Clause et al., where estimations of osmotic conductance to glucose were overestimated in patients with a large residual volume. 3 In clinical settings, estimating the residual volume can be particularly valuable to rule out a large intraperitoneal volume, as a large residual volume increase the risk of overfill, subsequently raising the risk of increased intraperitoneal pressure and complications such as hydrothorax,4,5 abdominal pains, hernias and soft tissue fluid leakage.6,7
The residual volume can be estimated by tracking the change in dialysate concentration of a marker molecule before and after filling of fresh dialysis fluid, utilizing the dilution equation. Marker molecules are either endogenous (originating from the patient) or exogenous, such as radio-iodinated serum albumin or dextran. 8 The dilution equation is designed to predict or estimate change in volumes or concentrations in isolated systems, where volumes and molecular contents of the two mixing fluids are the only determiners of outcome. Therefore, influx of ultrafiltration volume and marker molecule mass transport induce bias. Exogenous marker molecules are considered most accurate,8,9 while endogenous molecules such as albumin, creatinine or urea are clinically convenient. Among the endogenous molecules, albumin is considered a good dilution marker due to limited transmembrane transport during the dialysis fluid fill time.8,10,11 However, albumin measurements usually requires access to a well-equipped laboratory, while creatinine and urea can be measured bedside by handheld devices. However, creatinine and urea are small soluble molecules, susceptible to transperitoneal mass transport during the fluid fill phase, theoretically causing overestimation of dilution-based residual volumes.
We here retrospectively evaluate the estimation accuracy of dilution-based residual volumes using creatinine, urea and albumin as marker molecules compared to three-pore model estimated residual volumes. We also assess the magnitude of bias induced by marker molecule mass transfer, ultrafiltration and dialysis fluid glucose concentration.
Materials and methods
Participants and data collection
This study presents a retrospective analysis of clinical data collected between September 2015 and October 2017 at the unit of home dialysis at Skåne University Hospital, Lund, Sweden, conducted by Martus et al. 10 Twenty-one patients underwent 30 interventions, each consisting of two consecutive 1-h dwells. 10 In this post-hoc analysis, two interventions were excluded due to missing data, leaving a final 20 patients and 56 residual volumes included in the analysis. The first of the two consecutive dwells utilized 1.5% glucose, followed by the second using 4.25% glucose fluid. The full intervention procedures are detailed in the original study. 10 Dialysis fluid fill and drain volumes were carefully monitored and samples of plasma and dialysis fluid collected according to Figure 1.
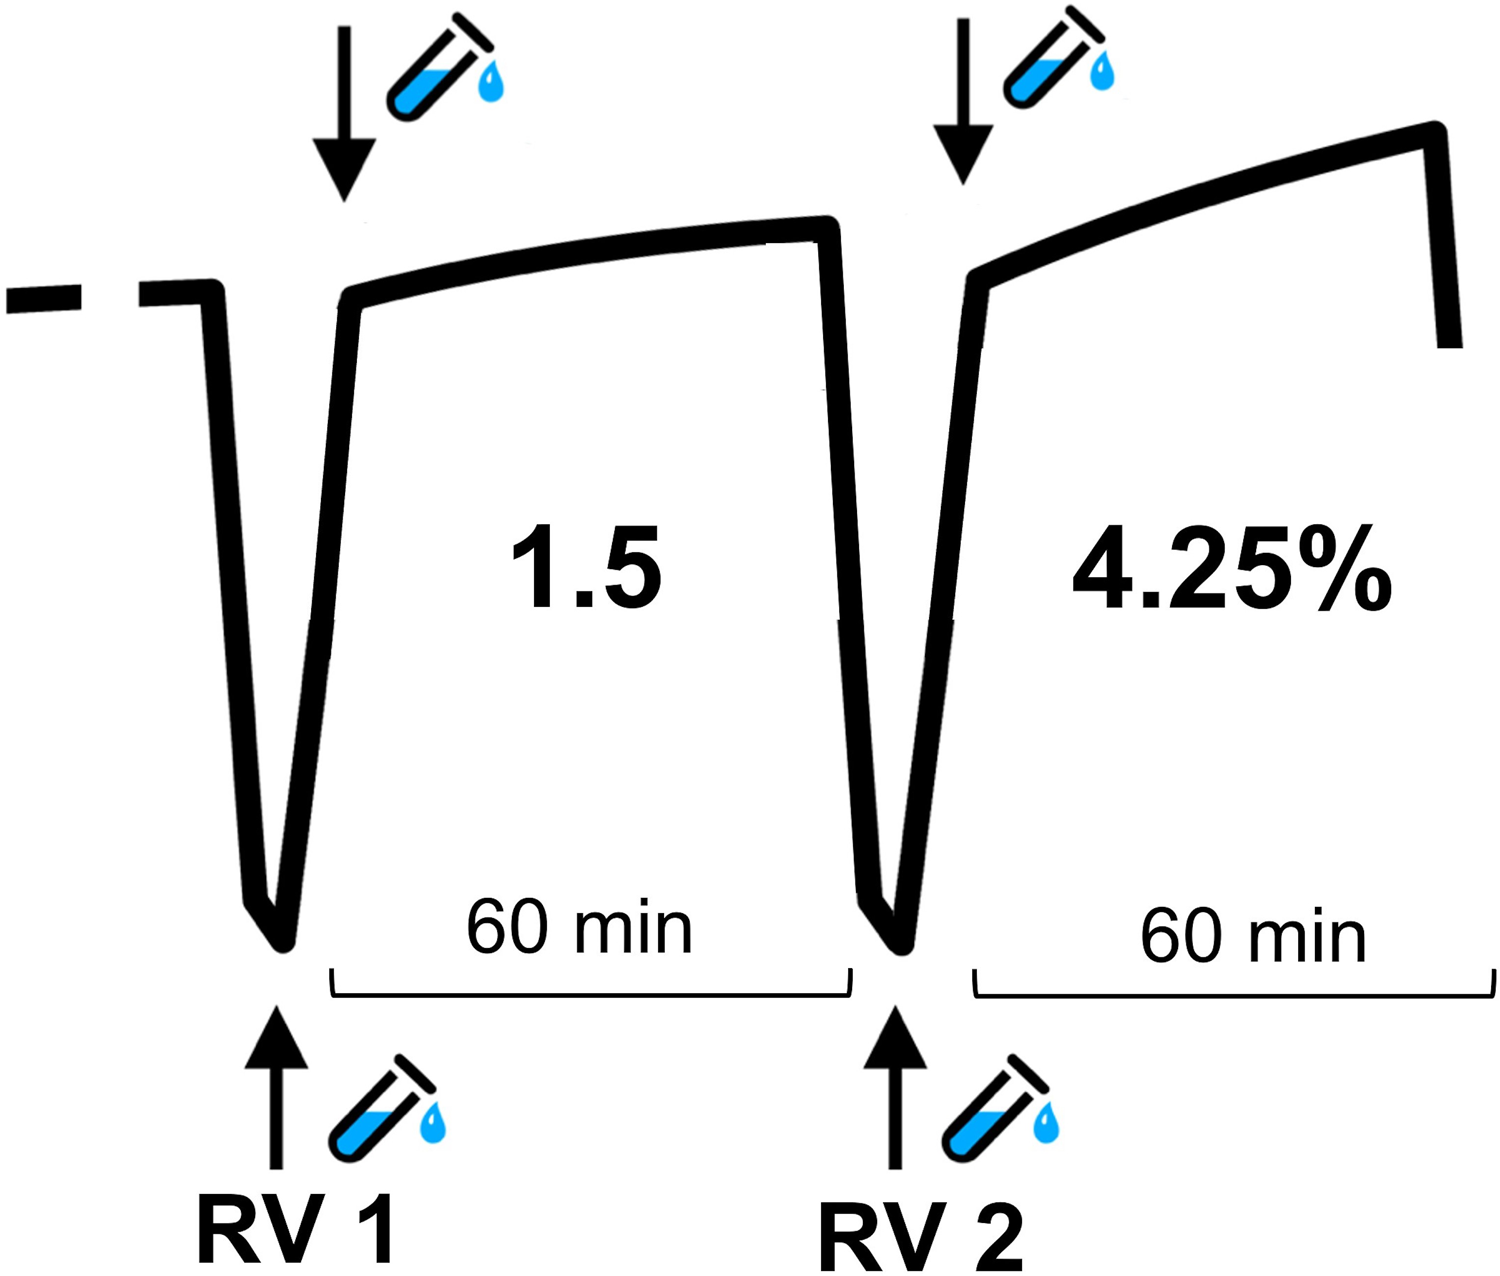
Schematic overview of dialysis dwells and fluid sampling. Two consecutive 60 min dwells, with initial 2L 1.5% glucose fluid, followed by 2L 4.25% glucose dialysis fluid. Dialysate samples were drawn as marked by arrows.
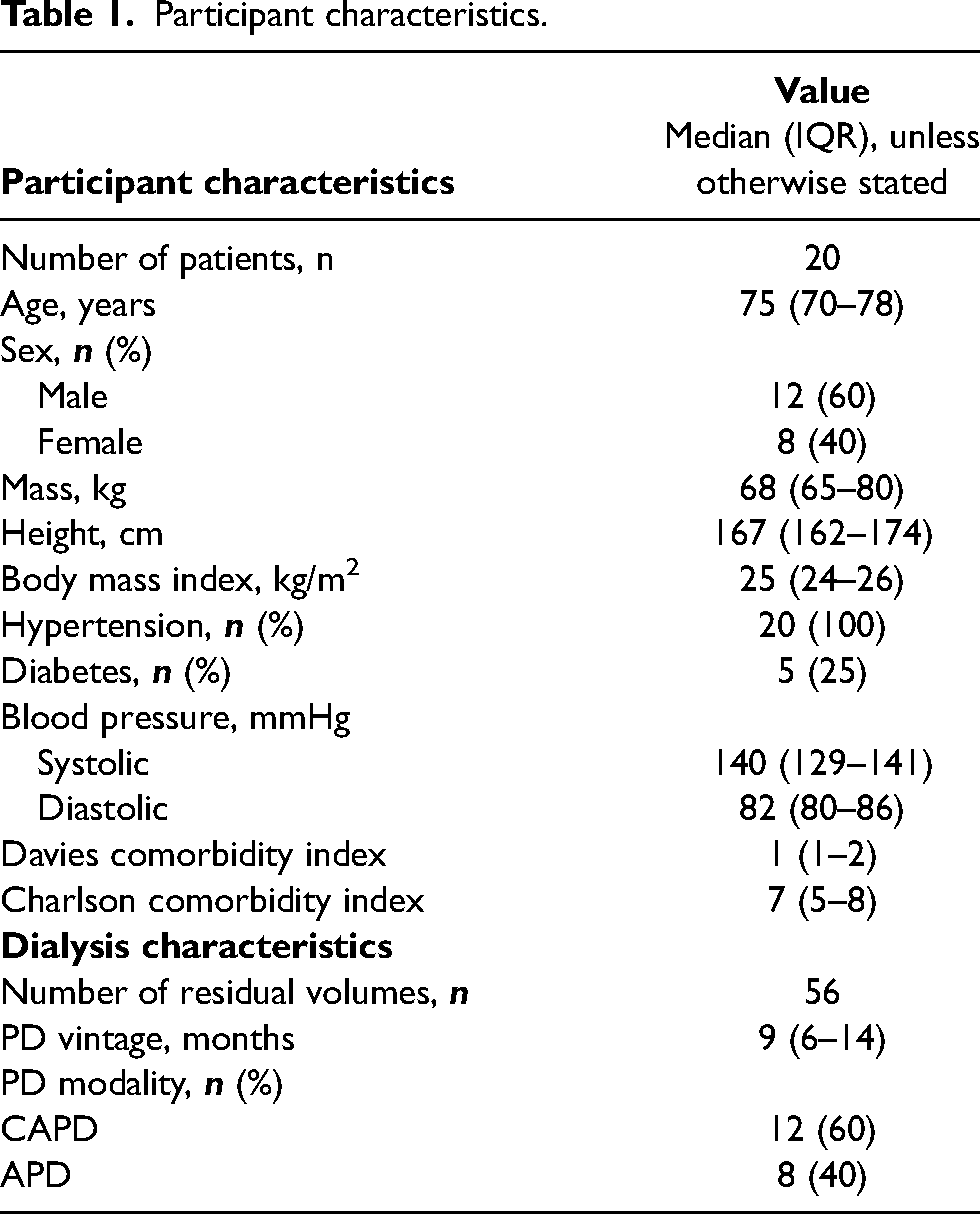
Patient characteristics are outlined in Table 1. All clinical procedures and this post-hoc analysis received ethical approval from the Swedish national ethical committee prior to initiation.
Participant characteristics.
Calculation of dilution-based residual volume
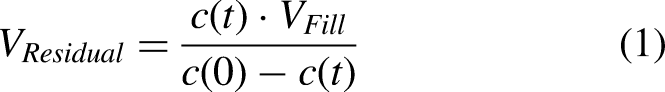
The dialysate concentration of a marker molecule was measured before fluid fill c(time t = 0 min), and after fresh fluid filling of either 1.5% or 4.25% glucose fluid.
10
Before the second sample was collected, the patient moved for a few seconds to enhance fluid mixing. This intraperitoneal ‘start concentration’ together with the marker molecule concentration after fluid fill, c(t = fill time) and the fill volume (
Three-pore model simulations and estimations
To simulate transport of small solutes and water during the fill phase of both dwells, the extended three-pore model was employed and solved using a fourth order Runge-Kutta algorithm. 12 Static membrane parameters were established based on previous studies. 12 Small solute concentrations in plasma and fresh dialysis fluid were determined using individual data collected during the interventions. Individual durations of fluid fill and dwell times were also incorporated. Individual dialysate concentrations of urea, creatinine, glucose, fill and drain volumes and durations were used for model fitting. Transport parameters such as solute diffusion capacities, ultrafiltration coefficient and the residual volume were solved using a 3-step repeated nonlinear least square regression method (GSL version 2.6). Diffusion and ultrafiltration capacities were continuously scaled in accordance with the cube–square law, describing the recruitment of peritoneal surface as a function of the intraperitoneal volume.10,13 By blocking diffusive and convective mass transfer of specific solutes during three-pore model simulations, the bias of small solute mass transfer in dilution equations is quantified.
The ultrafiltration volume 
Statistical methods
Statistical calculations were performed using RStudio for Mac version 1.2.1335. Data analysis was performed using paired Wilcoxon signed-rank test. Results are shown as median and interquartile range (IQR) unless otherwise stated. P-values below 0.05 were considered significant.
Results
The residual volumes derived from dilution all exhibited an overestimation compared to the corresponding three-pore model reference estimations, see Table 2 and Figure 2(a) to (f). As expected, residual volume calculations based on dilution of the relatively large molecule albumin demonstrated the smallest deviation from the three-pore model reference. In 1.5% dwells, the median difference between albumin and three-pore model residual volumes was 5 mL (IQR 4–7), and in hypertonic glucose dwells, it was 24 mL (IQR 21–27) (Figure 2(a) and (d)). Comparably, calculations based on creatinine and urea dilution yielded differences from three-pore model residual volumes of 115 mL (IQR 89–149) and 131 mL (IQR 111–201) respectively, in 1.5% glucose dwells. Similar to the albumin-based findings, the residual volume overestimation was more pronounced in 4.25% dwells, with creatinine-based residual volume overestimation of 252 mL (IQR 79–313) and urea 262 mL (IQR 210–328). There was no difference between the 1.5% and 4.25% fill phase durations, both lasting around 7 min.
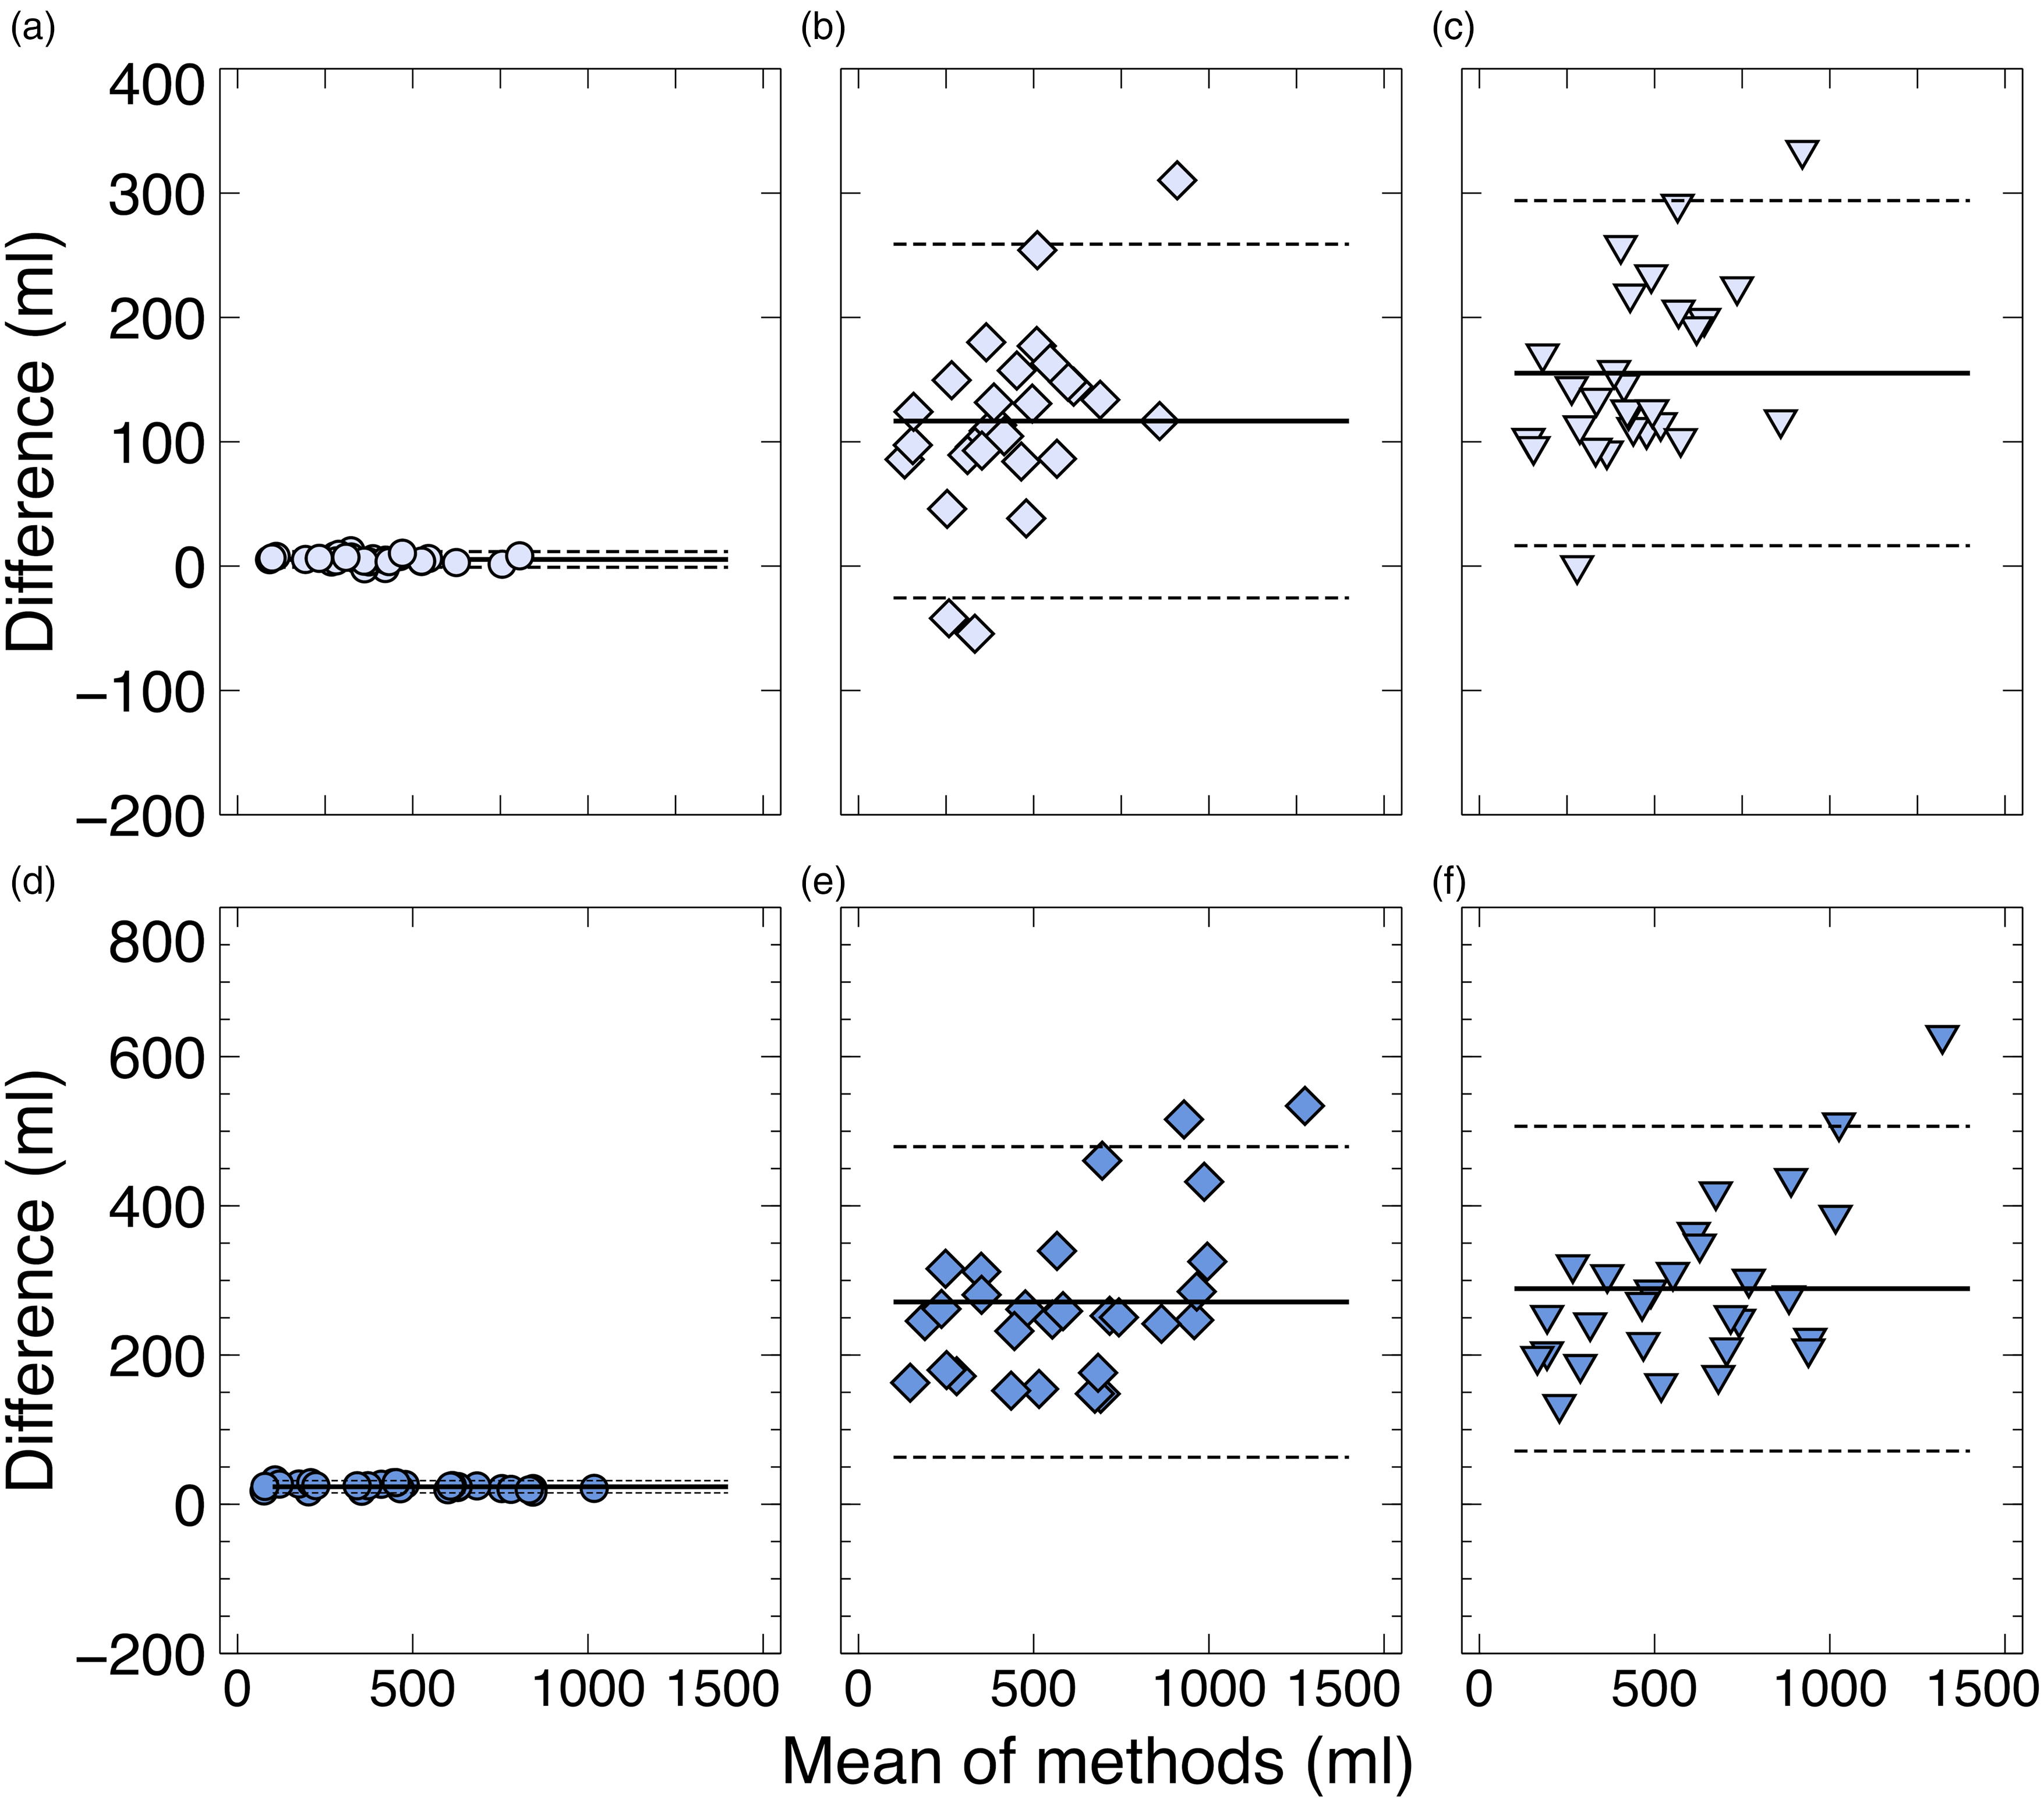
Dilution method compared to three-pore model residual volumes estimates. Bland-Altman analysis of paired residual volumes calculated during 1.5% fluid fill ((a)–(c), light blue markers) and 4.25% glucose fluid ((d)–(f), dark blue markers), using albumin ((a) 5.4 ± 6.3 mL, (d) 23.4 ± 8.2 mL), creatinine ((b) 116.7 ± 142.3 mL, (e) 271.2 ± 208.2 mL) and urea ((c) 155.2 ± 138.8 mL, (f) 289.0 ± 217.7 mL) as dilution method markers, compared to reference three-pore model estimates. Solid lines reflect the mean of the paired method outcome differences and dashed lines the limitations of agreement (±1.96 SD).
Results.
Small solute mass transfer and ultrafiltration during dialysis fluid fill phase
Mass transfer of creatinine and urea occurred during the fill phase in both glucose dwells, as depicted in Figure 3(a) and (b) and Table S1 (Supplemental material). Mass transfer of creatinine was more pronounced during hypertonic fluid fill, where an increase in creatinine median mass of 67% was observed, compared to 37% increase during 1.5% fluid fill. Similarly, urea mass transfer demonstrated higher magnitude during hypertonic fluid fill, yet to a lesser extent, with medians showing increases of 44% and 47% during 1.5% and 4.25% fluid fills respectively. Upon accounting for creatinine and urea mass transfer, the initially observed deviations between dilution based and three-pore model residual volumes were substantially mitigated. After adjustment, the remaining median deviance between the two methods was −3 mL (IQR −6–1) for 1.5% dwells and 5 mL (IQR −11–17) for 4.25% dwells when using creatinine as the dilution marker. Similarly, the deviance was −5 mL (IQR −9–1) and −13 mL (IQR −23–7) when using urea.
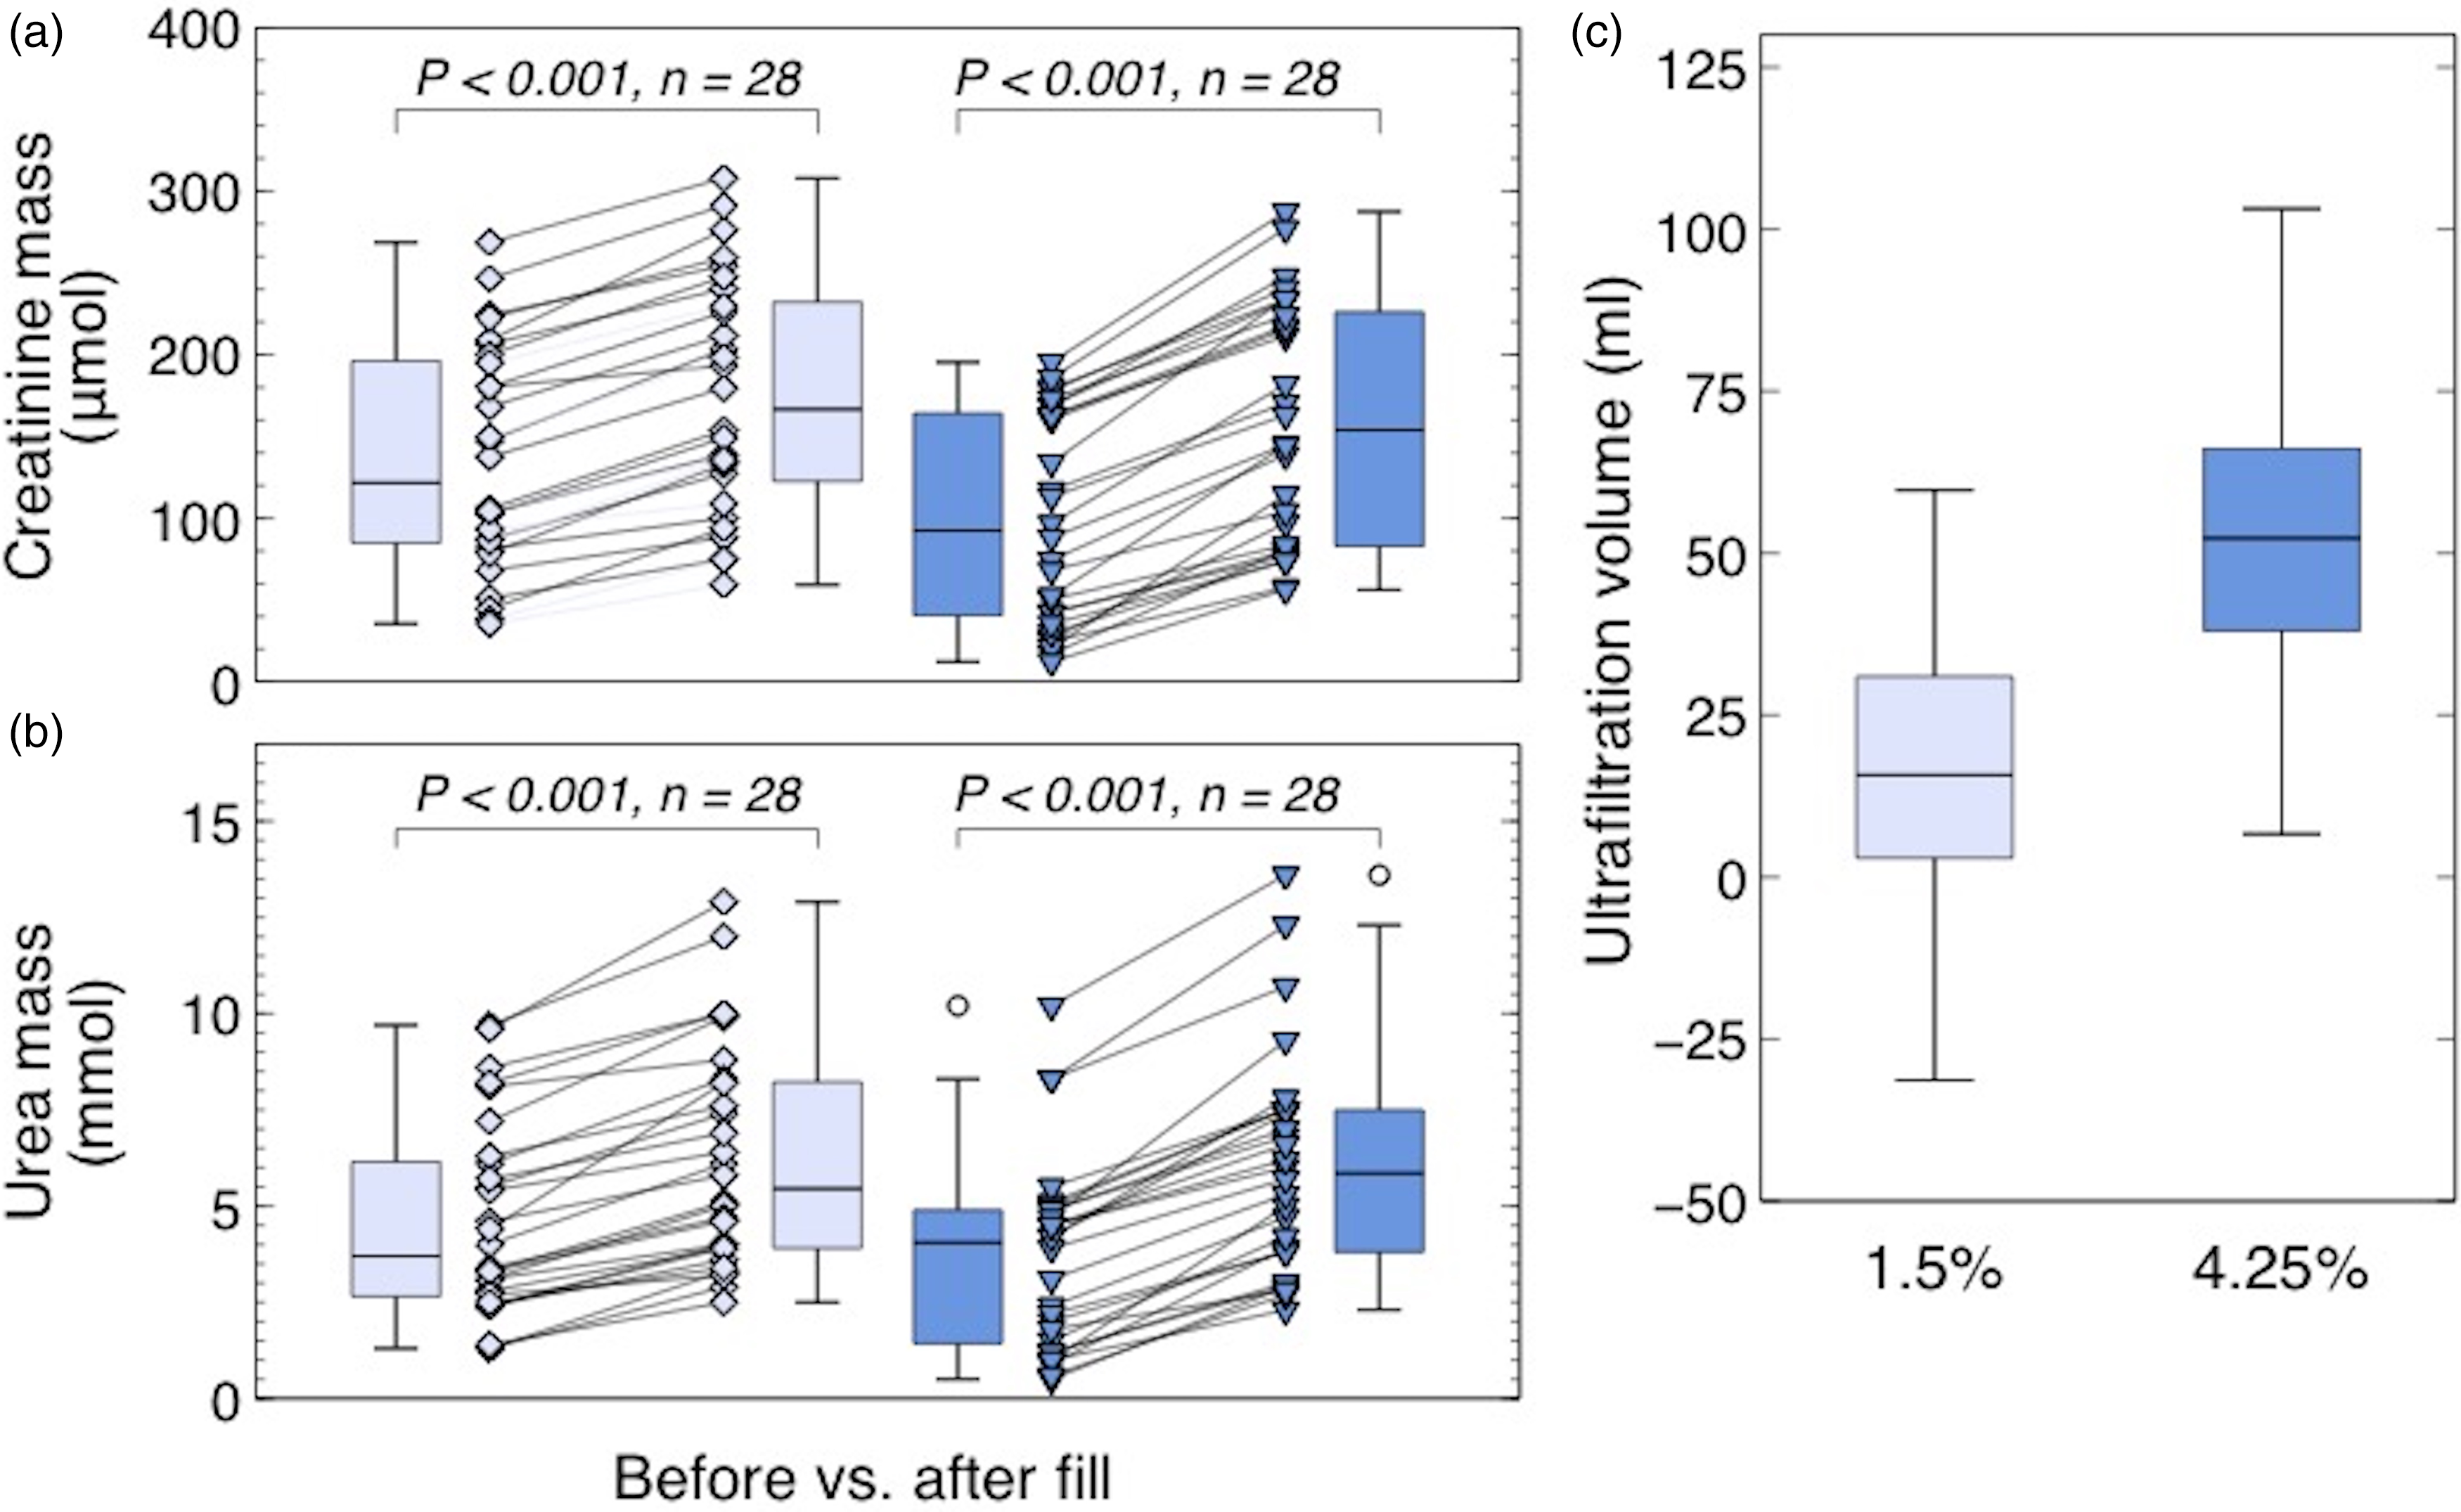
Small solute mass transfer and ultrafiltration during fluid fill. (a)–(b) Intraperitoneal creatinine mass (a) and urea (b) before and after dialysis fluid fill with 1.5% (light blue) and 4.25% glucose fluid (dark blue). Box plot whiskers represent 1.5 interquartile range of observations. (c) Ultrafiltration volumes estimated by the three-pore model accumulated during the fill of 1.5% (light blue) and 4.25% glucose fluid (dark blue).
Furthermore, three-pore model analysis of the 1.5% glucose fluid fill phase indicated a volumetric influx of 16 mL (IQR 3–31), while a larger influx of 52 mL (IQR 38–66) was observed during the 4.25% glucose fill, see Figure 3(c).
Linear regression analysis
Utilizing repeated random sub-sampling validation, linear regression coefficients were analysed. The prediction factor K, converting creatinine or urea residual volumes compared to albumin residual volumes (
Discussion
We here evaluate the feasibility and accuracy of dilution-based residual volumes calculations, in particular using clinically convenient dilution molecules such as albumin, creatinine and urea. Although there is no general ‘gold standard’ residual volume estimation method, the dilution method utilizing an endogenous marker molecule is a simple and non-invasive method.8–10 However, the dilution method is designed for totally isolated compartments, where volumes and solute contents of the two mixing fluids are the only determinants of outcome, and thereby not perfectly suitable for the permeable peritoneal cavity. Albumin as dilution marker molecule conform well with exogenous markers, probably due to the large molecular size reducing bias-inducing peritoneal mass transfer. However, the generally low dialysate concentration of albumin, secondary to the limited transperitoneal transport, may cause dialysate concentrations below the measurement detection limit, which potentially could reduce the feasibility in protocols with pre-interventional rinses or frequent fluid exchanges.
Despite short fluid fill times of about 7 min, and a limited peritoneal membrane surface area in contact with dialysis fluid during the filling of intraperitoneal volume, we observed substantial residual volume overestimation using the small solutes creatinine and urea. By applying three-pore model analysis, we here demonstrate how mass transfer is responsible for the majority of overestimation using creatinine and urea, as hypothesised. The mass transfer induced bias was particularly prominent during fill of hypertonic fluid, explained by the larger ultrafiltration inflow, and enhanced marker molecule mass transfer due to improved convective transport or a larger diffusive rate due to increased diffusion capacity.
Ultrafiltration influx is another source of uncertainty in residual volume estimations, especially in ultrafiltration enhancing hypertonic dwells. Here, ultrafiltration was observed to contribute with about 50 mL of fluid in hypertonic dwells, compared to 16 mL in weak glucose dwells. Ultrafiltration disrupts dilution-based estimation accuracy by volumetric influx caused by free-water transport, estimated to account for about 40% of the total ultrafiltration. Free-water ultrafiltration will dilute the marker molecule, regardless of the steric properties of the molecule. However, in light of the fluid fill volume usually being about 1500–2000 mL, the effect of free-water dilution could probably be considered negligible. The remaining 60% of ultrafiltration is believed to occur through small and large pores, and will therefore contribute to convective marker molecule mass transfer. However, the extent of mass transfer might vary due to the molecular size and steric properties of the endogenous dilution marker.
Creatinine and urea could serve as accurate, bed-side analysed dilution markers despite the demonstrated overestimation bias, for example by using the here presented correction coefficients, which can be easily applied to creatinine or urea residual volumes to obtain the corresponding albumin-based residual volumes. The correction coefficients here presented were estimated in a small sample, single-centre data set, and should be evaluated further in larger, more diverse cohorts. The correction factors are based on cohort data and do not answer whether transport types influence residual volume correction factors. However, the correction factors are probably individual and dependent on the peritoneal transport rate, as a high small solute transport rate will elevate the mass transfer induced bias compared to slow rate transport.
The accuracy of the dilution method accuracy depends on how well the analysed fluid sample reflects the actual conditions in the peritoneal fluid, where catheter position, adherences or other intraperitoneal compartmentalizing obstructions might reduce fluid mixing during fill. Although perfect mixing cannot be ensured, change in posture or movement of the patient might improve blending. In addition to the aforementioned considerations in selecting a suitable dilution marker, one should also take into account measurement imprecision. For example, the variance coefficient of albumin measurements in this data set was 3.9% at concentrations <18 mg/L. However, due to updated analysis protocols at our local laboratory, the imprecision of albumin measurements from now on is estimated to be 7.9% in the same concentration spectrum, lowering reliability of future albumin measurements. Contrarily, creatinine and urea imprecision remain below 1.5% in the relevant concentration levels. Hence, although albumin is the theoretically most suitable marker molecule, local conditions must be considered.
Conclusion
Mass-transfer of low molecular weight marker molecules, such as creatinine and urea are associated with residual volume overestimation mainly through peritoneal mass transfer during fluid fill. By applying correction factors, creatinine and urea dilution can still provide reasonable estimates, particularly when the purpose is to exclude the presence of a very large residual volume. In cases where high-precision measurements are needed, use of albumin or exogen molecules should be considered.
Supplemental Material
sj-docx-1-ptd-10.1177_08968608241260024 - Supplemental material for Determining the residual volume in peritoneal dialysis using low molecular weight markers
Supplemental material, sj-docx-1-ptd-10.1177_08968608241260024 for Determining the residual volume in peritoneal dialysis using low molecular weight markers by Elin Lindholm, Giedre Martus, Carl M Öberg and Karin Bergling in Peritoneal Dialysis International
Footnotes
Acknowledgements
We would like to acknowledge Alaa Aldaif for hard work and valuable input during the initial phase of this study.
Author contributions
EL and KB performed the data analysis, results interpretation, the graphic work and drafted the manuscript. CMÖ and GM supervised the results interpretation and edited the final manuscript.
Data availability
Data is available upon request.
Declaration of conflicting interests
The authors declared the following potential conflicts of interest with respect to the research, authorship, and/or publication of this article: G. Martus has a collaboration with Triomed AB (Lund, Sweden) unrelated to the present work. K. Bergling has pursued two master thesis projects with Gambro Lundia AB (unrelated to this work). K. Bergling reports research funding from Baxter Healthcare. K. Bergling and CM. Öberg are inventors of pending patents filed by Gambro Lundia AB (Baxter; unrelated to this work). CM. Öberg reports research grants (unrelated to this work) from Baxter Healthcare and Fresenius Medical Care and speaker’s honoraria from Baxter Healthcare. CM. Öberg reports a consultancy agreement with Baxter Healthcare and an advisory or leadership role with the Peritoneal Dialysis International editorial board. E. Lindholm reports no disclosures.
Funding
The authors declared the following potential conflicts of interest with respect to the research, authorship, and/or publication of this article: This work has been funded by the Medical Faculty of Lund University (ALF grant, grant number YF 2020-YF0056).
Supplemental material
Supplemental material for this article is available online.
References
Supplementary Material
Please find the following supplemental material available below.
For Open Access articles published under a Creative Commons License, all supplemental material carries the same license as the article it is associated with.
For non-Open Access articles published, all supplemental material carries a non-exclusive license, and permission requests for re-use of supplemental material or any part of supplemental material shall be sent directly to the copyright owner as specified in the copyright notice associated with the article.