
Abstract
Background:
Clinical data supporting the target haemoglobin range in patients undergoing peritoneal dialysis (PD) are scarce. This study investigated the association between haemoglobin levels and all-cause mortality in Japanese patients undergoing PD using data from a nationwide dialysis registry.
Methods:
A total of 4875 patients aged ≥18 years who were undergoing PD at the end of 2012 were analysed. Patients receiving combination therapy with haemodialysis or missing haemoglobin data were excluded. Haemoglobin values were categorised into six groups (<9.0, 9.0–9.9, 10.0–10.9, 11.0–11.9, 12.0–12.9 and ≥13.0 g/dL) and their association with mortality evaluated.
Results:
Patients’ mean age was 63 years, and 62% were men. The mean haemoglobin level was 10.7 g/dL, and 14% were anuric. Erythropoiesis-stimulating agents were used in 89%. During a median follow-up of 3.5 years, 1586 patients died. Haemoglobin levels <9.0 and ≥13.0 g/dL were significantly associated with mortality, as compared with levels of 10.0–10.9 g/dL (adjusted hazard ratios [95% confidence intervals]: 1.25 [1.06–1.48] and 1.45 [1.13–1.88], respectively). Restricted cubic spline analysis revealed a U-shaped association between haemoglobin levels and mortality. A haemoglobin level ≥12 g/dL was associated with mortality in patients with a history of cardiovascular disease (p interaction = 0.023).
Conclusion:
We provide important insights into the target haemoglobin in patients undergoing PD. Our findings suggest that setting a lower upper limit for haemoglobin levels may be beneficial for patients with a history of cardiovascular disease.
Introduction
Anaemia is a common complication in patients with chronic kidney disease (CKD) and is predominant in those undergoing dialysis. 1 Patients with CKD have a deficiency in erythropoietin production, which results in the development of anaemia. Anaemia may lead to reduced oxygen delivery to organs and tissues, resulting in symptoms of anaemia, reduced quality of life, increased risk of cardiovascular disease (CVD), hospitalisation, cognitive impairment and mortality. 2
Since the availability of erythropoiesis-stimulating agent (ESA) therapy, the Kidney Disease: Improving Global Outcomes (KDIGO) guidelines recommend that patients with CKD stage 5 receiving dialysis should initiate ESA therapy when their haemoglobin level is between 9.0 g/dL and 10.0 g/dL to prevent it from falling below 9.0 g/dL. 1 Previous studies indicate that haemoglobin levels <11.0 g/dL are associated with higher mortality rates in patients undergoing peritoneal dialysis (PD) compared with haemoglobin levels between 11.0 g/dL and 11.9 g/dL. 3 –5 Another study from Taiwan showed that haemoglobin levels <10.0 g/dL are associated with higher all-cause and cardiovascular mortality compared with haemoglobin levels between 10.0 g/dL and 10.9 g/dL. 6 In contrast, while studies have highlighted that high haemoglobin levels are associated with both increased mortality and morbidity from CVD and thrombotic events in patients with CKD as a whole, 7 –9 evidence on the impact of high haemoglobin levels in PD patients is limited. 4 –6
Guidelines for managing anaemia in patients with CKD have not clearly defined a specific target haemoglobin level for patients undergoing PD based on solid scientific evidence. The KDIGO guidelines, as well as the guidelines from the United Kingdom, Caring for Australian and New Zealanders with Renal Impairment and the European Best Practice Guidelines, do not specify the target haemoglobin levels for patients undergoing PD. 1,10 –12 Currently, only Japanese guidelines specify a target haemoglobin range of 11–13 g/dL for patients undergoing PD, which is similar to that for patients with non-dialysis-dependent CKD. 13 The rationale for setting the haemoglobin target at the same level for PD patients as that for patients with pre-dialysis CKD is that PD patients, unlike haemodialysis (HD) patients, do not experience haemoconcentration and retain certain residual kidney functions. However, establishing a specific target haemoglobin level for PD patients alone is significant, considering the differences in uremic toxin levels and inflammation between patients undergoing PD and those with pre-dialysis CKD.
Therefore, the optimal haemoglobin target for PD patients remains a topic of debate. Using data from a nationwide dialysis registry, our novel study investigated the association between haemoglobin levels and all-cause mortality in PD patients and examined the heterogeneity of optimal haemoglobin levels across clinically relevant subgroups.
Methods
Study design and population
This was a longitudinal study using the Japanese Society for Dialysis Therapy (JSDT) Renal Data Registry (JRDR) database from 2012 to 2021. Details regarding the JRDR have been published previously. 13 Briefly, this nationwide cohort study included patients undergoing dialysis in Japan. The JSDT conducts a survey of all dialysis units in Japan at the end of every year. The annual response rate was >95%. At the end of each year, patients were enrolled in the JRDR at the dialysis facility they attended, and data were sent to the data centre. The same study ID was assigned to the same patient, and follow-up data were recorded under that ID. The unit of analysis for this study was the individual patient. The study protocol was approved by the Medicine Ethics Committee of the JSDT, and the study was conducted in accordance with the Declaration of Helsinki. The requirement for written informed consent for participation in the study was waived by the Ethics Committee because the data were anonymised and no intervention was performed for research purposes.
Patients who survived and underwent PD at the end of 2012 were enrolled. We excluded patients undergoing combination therapy with HD at the end of 2012. In addition, patients aged <18 years, those who had withdrawn from dialysis or kidney transplantation by the end of 2012 and those whose haemoglobin levels were not available were excluded from the study.
Exposure of interest and outcomes
The exposure of interest was the haemoglobin level. The levels of haemoglobin were divided into six categories: <9.0, 9.0–9.9, 10.0–10.9, 11.0–11.9, 12.0–12.9 and ≥13.0 g/dL. The primary outcome of this study was all-cause mortality. Furthermore, we examined the incidence rates of cause-specific deaths due to CVD, infectious diseases and malignant diseases across haemoglobin levels. Death due to CVD was defined as heart failure, pulmonary oedema, ischemic heart disease, arrhythmia, valvular heart disease, cerebral infarction, cerebral haemorrhage or subarachnoid haemorrhage. Follow-up was censored at any of the following events: transition to HD, withdrawal from dialysis, kidney transplantation or the end of 2021.
Statistical analyses
The baseline data of the study participants were divided into six haemoglobin categories. Data are presented as number (%), mean (standard deviation) or median (interquartile range (IQR)), as appropriate, and were compared using the chi-square test for categorical variables and the analysis of variance test or Kruskal–Wallis test for continuous variables.
Multiple imputation with chained equations was used to impute missing values for the following covariates: body mass index (BMI), residual urine output, hypertension, history of myocardial infarction, history of stroke, history of limb amputation, smoking status, systolic blood pressure, diastolic blood pressure, transferrin saturation (TSAT), ferritin, serum iron, transferrin iron binding capacity, ESA dose, serum albumin, C-reactive protein (CRP), total cholesterol, calcium, phosphate and intact parathyroid hormone (PTH). The ESA dose was defined as the weekly erythropoietin–equivalent dose converted from darbepoetin alfa (DA) or epoetin beta pegol at a ratio of 1:200. 14,15 The ESA doses recorded in the data set were considered to be missing values if they exceeded the insurance coverage doses owing to inaccurate data entries. In Japan, the maximum allowed dose of epoetin for PD patients is 6000 IU/week, whereas those of DA and epoetin beta pegol are 60 µg/week and 250 µg/4 weeks, respectively. Whole PTH values measured by bio-intact assays were multiplied by 1.7 to obtain an equivalent intact PTH value. 16 The imputation model contained all other candidate predictors, the endpoint indicator and the Nelson–Aalen cumulative hazard estimate. 17 The results for the 100 imputed data sets were combined using Rubin’s rule. 18
All-cause mortality was compared across haemoglobin levels using the Kaplan–Meier method and tested using the log-rank test. The association between haemoglobin categories and all-cause mortality was examined using multivariable-adjusted Cox proportional hazards models. The haemoglobin category of 10.0–10.9 g/dL was selected as the reference because it was the closest to the lower limit of 11.0 g/dL stipulated in current Japanese guidelines and included the mean haemoglobin value. Covariates in multivariable adjustment models were as follows: age, sex, time since starting dialysis, hypertension, diabetes mellitus (DM), BMI, history of myocardial infarction, history of stroke, smoking, and serum levels of albumin, corrected calcium, phosphate, intact PTH and log-transformed CRP (Model 1, a basic model); Model 2 also included residual urine output and residual Kt/V (Model 1 + residual kidney function); Model 3 also included ESA dose, TSAT and ferritin (Model 2 + anaemia treatment and iron indices). As some records of urine output were registered as ‘0’ mL/day for anuric patients, we categorised urine output into the following three groups: <100, 100–500 and >500 mL/day, which indicates anuria, oliguria and normal, respectively. We classified ESA dose into the following categories based on a previous study: 0 (no use); 0< to <3000; 3000 to <6000; 6000 to <9000; and ≥9000. 19 In addition, we performed a stratified analysis based on sex, age group (<60, 60–69 and ≥70 years), BMI category (<22, 22–24.9 and ≥25 kg/m2), DM, urine output category, CRP (<0.1, 0.1 to <1.0 and ≥1.0 mg/dL) and history of CVD, after adjusting for variables in Model 1. Categorisation of age, BMI and CRP levels was based on the tertiles of their values. To test the heterogeneity of each subgroup in the association of haemoglobin with mortality, we used Wald’s test. The reference category for each subgroup is ‘No’ for binary variables, female for sex and the category containing the smallest value for continuous values divided into three or more categories. Assuming a nonlinear association between haemoglobin and mortality, we performed a restricted cubic spline sensitivity analysis. Knots were placed at 9.0, 10.0, 11.0, 12.0 and 13.0 g/dL of haemoglobin, after adjusting for variables in Model 1. A haemoglobin level of 11.0 g/dL was chosen as the reference. The codes to generate the spline curve are provided in the Online Supplemental Material. The proportional hazards assumption was graphically assessed using Schoenfeld residuals. In all analyses, a two-sided p value of <0.05 was considered statistically significant. Statistical analyses were performed using Stata MP version 18.0 (Stata Corp, College Station, Texas, USA).
Results
Patient selection and characteristics of those with and without haemoglobin values available
A flow chart of the patients in the present study is displayed in Online Supplemental Figure 1. Overall, 9570 patients underwent a form of PD by the end of 2012. Haemoglobin data were missing for 2282 individuals. After exclusion, data from 4875 patients were available for analysis. The missing values for each variable and the comparison between patients with and without haemoglobin are presented in Online Supplemental Table 1. Overall, those whose haemoglobin levels were unavailable were more likely to undergo automated PD and more likely to have a history of stroke, myocardial infarction or limb amputation. In addition, over 90% of values were missing for many covariates. The percentages of missing values in those whose haemoglobin data were available were approximately 30% for residual urine output, blood pressure and serum ferritin and 42% for TSAT.
Baseline characteristics
Demographic characteristics of the participants are presented in Table 1. The mean age of the participants was 63 years, with 62% being men. The median time since PD initiation was 28 months, and the mean haemoglobin level was 10.7 (±1.4) g/dL. Approximately 30% of the participants had diabetic nephropathy, 14% were anuric and 89% used ESA. The participants with higher haemoglobin levels were more likely to have a shorter time since PD initiation, more residual urine output, lower systolic blood pressure and lower amount of ESA dose. The proportion of patients with previous kidney transplantation in all groups was very low.
Baseline characteristics.a
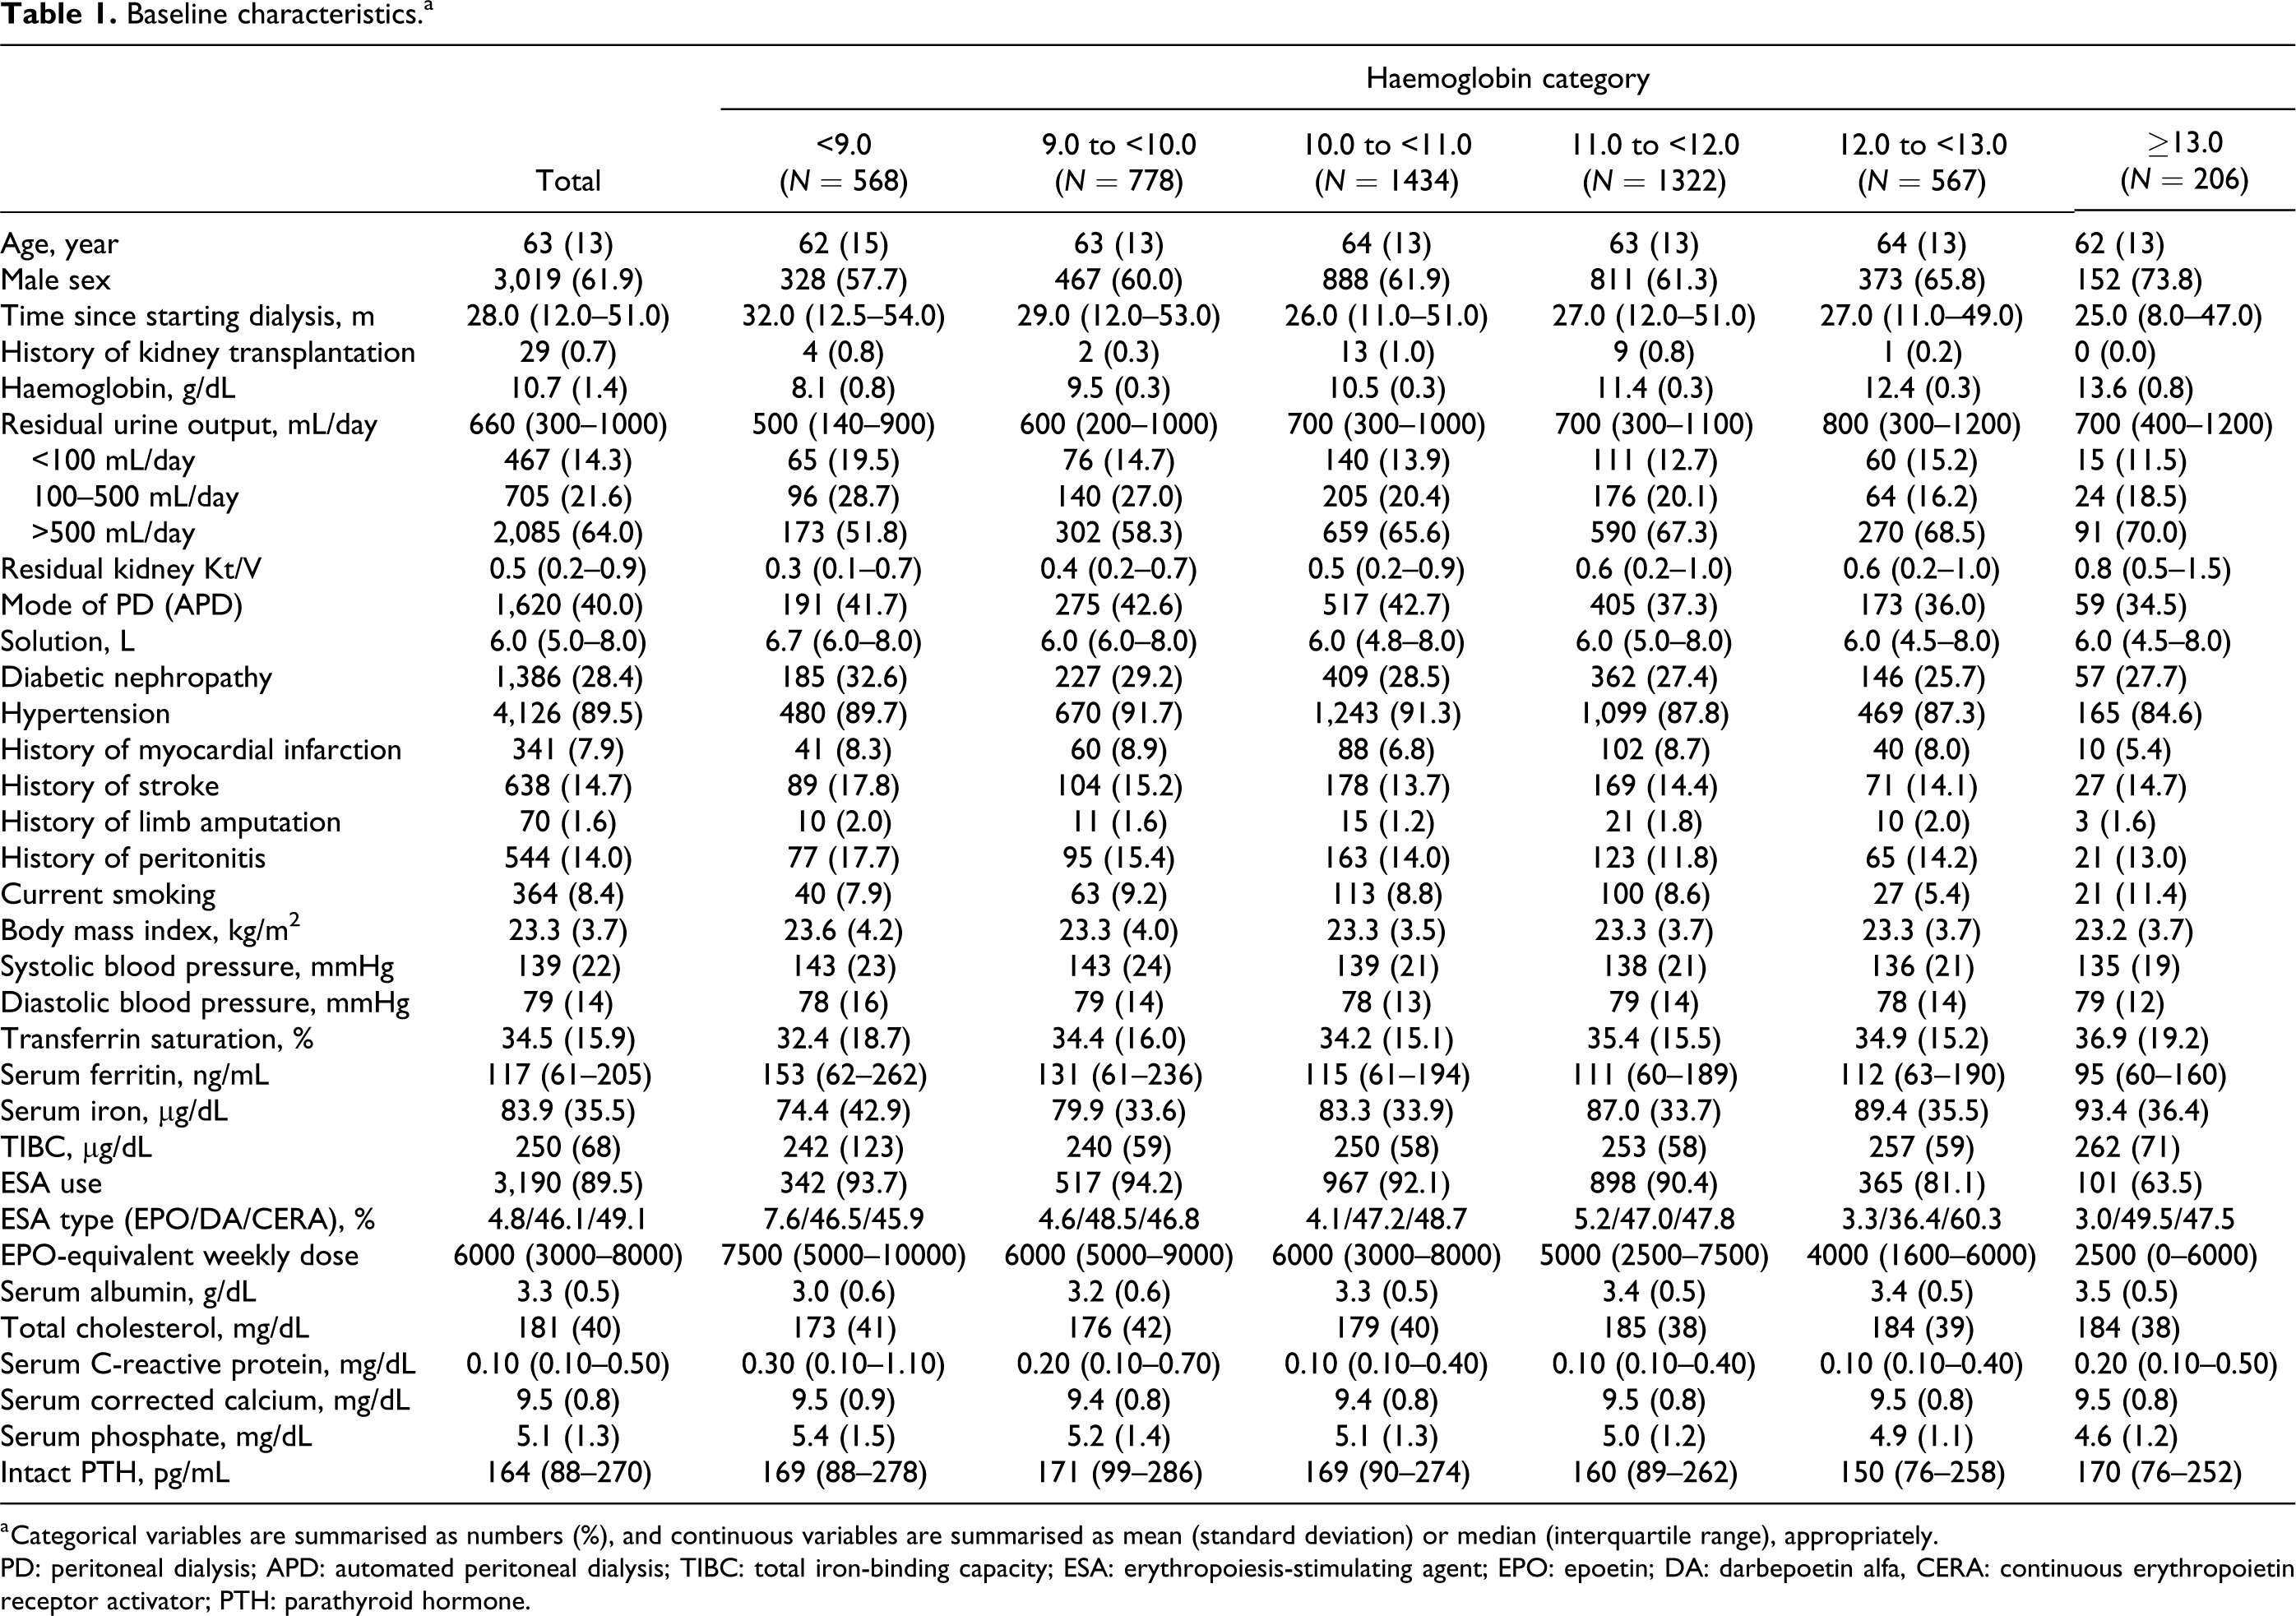
a Categorical variables are summarised as numbers (%), and continuous variables are summarised as mean (standard deviation) or median (interquartile range), appropriately.
PD: peritoneal dialysis; APD: automated peritoneal dialysis; TIBC: total iron-binding capacity; ESA: erythropoiesis-stimulating agent; EPO: epoetin; DA: darbepoetin alfa, CERA: continuous erythropoietin receptor activator; PTH: parathyroid hormone.
Overall survival and comparison of survival outcomes
During a median follow-up of 3.5 (IQR, 1.5–6.2) years, 1586 patients died, 168 patients underwent kidney transplantation, 1872 patients were transferred to HD and 472 patients were lost to follow-up. The proportions of loss to follow-up, transplantation and transition to HD were comparable across haemoglobin categories (Online Supplemental Table 2). The Kaplan–Meier curve exhibited a difference in mortality based on haemoglobin levels (p < 0.001) (Figure 1).
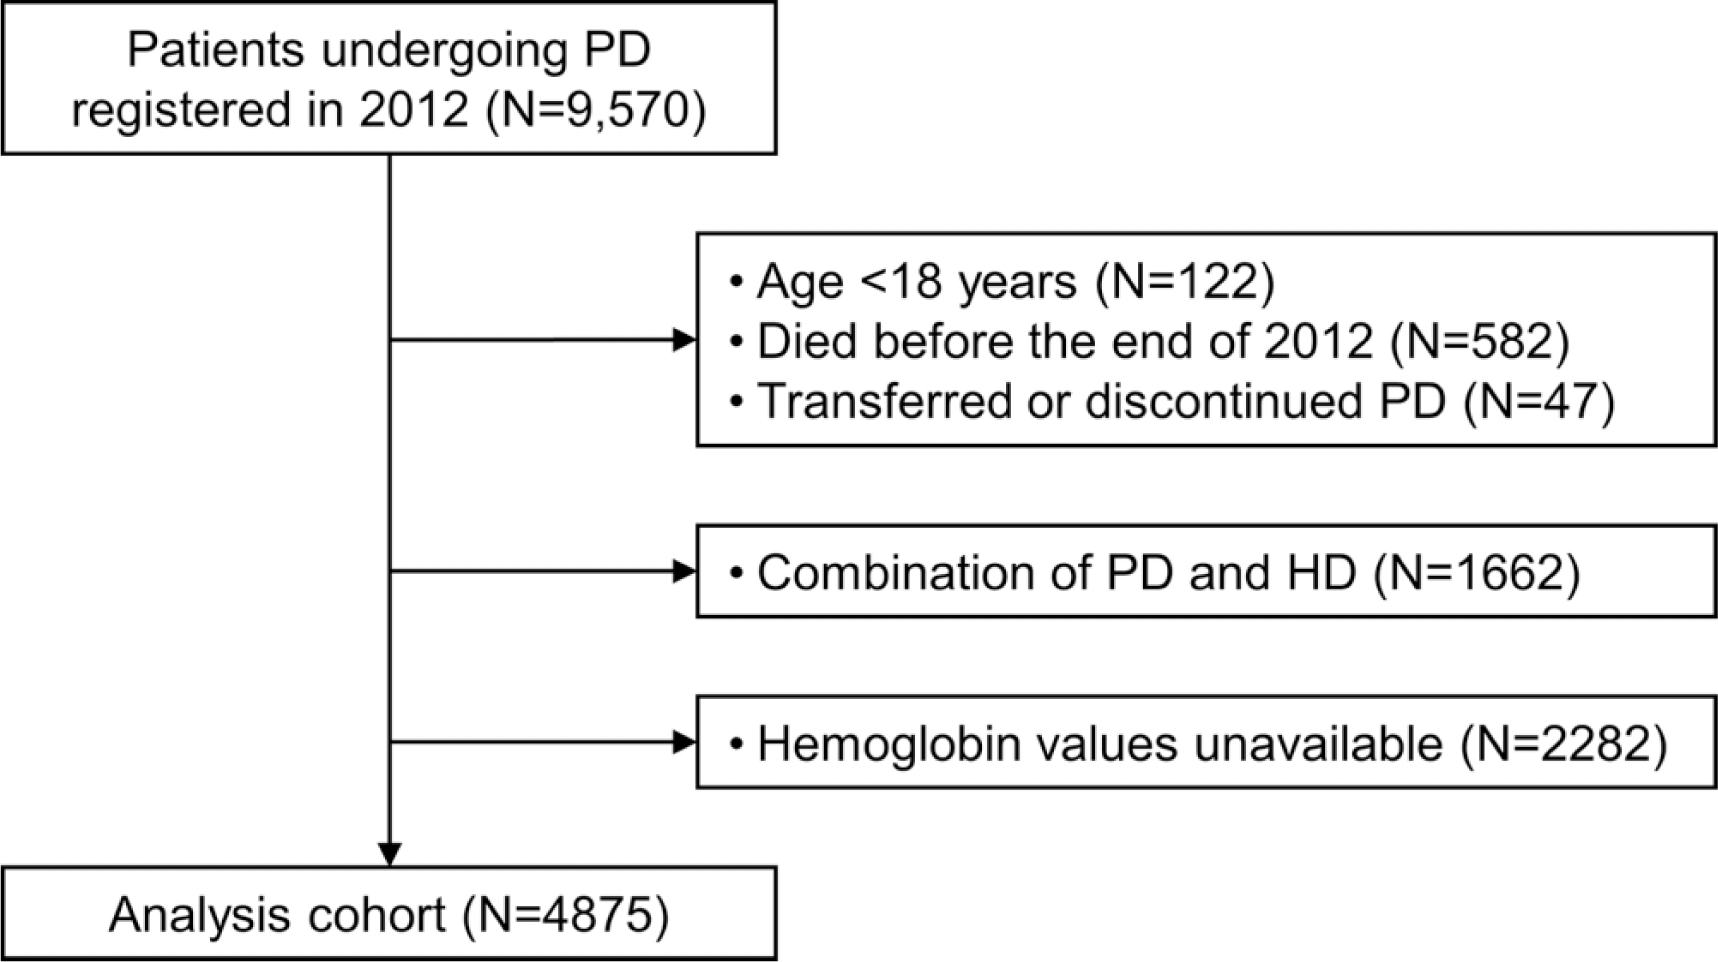
Patient selection.
In the multivariable Cox models, the levels of haemoglobin <9.0 and ≥13.0 g/dL were significantly associated with all-cause mortality with adjusted hazard ratios (HR) of 1.25 (95% confidence interval [CI], 1.06–1.48) and 1.45 (95% CI, 1.13–1.86) in Model 1, respectively (Table 2). After adjusting for other covariates, these associations remained significant. Restricted cubic spline analysis presented a U-shaped association between haemoglobin levels and mortality (Figure 2).
Association between hemoglobin levels and all-cause mortality in unadjusted and multivariable-adjusted models.a
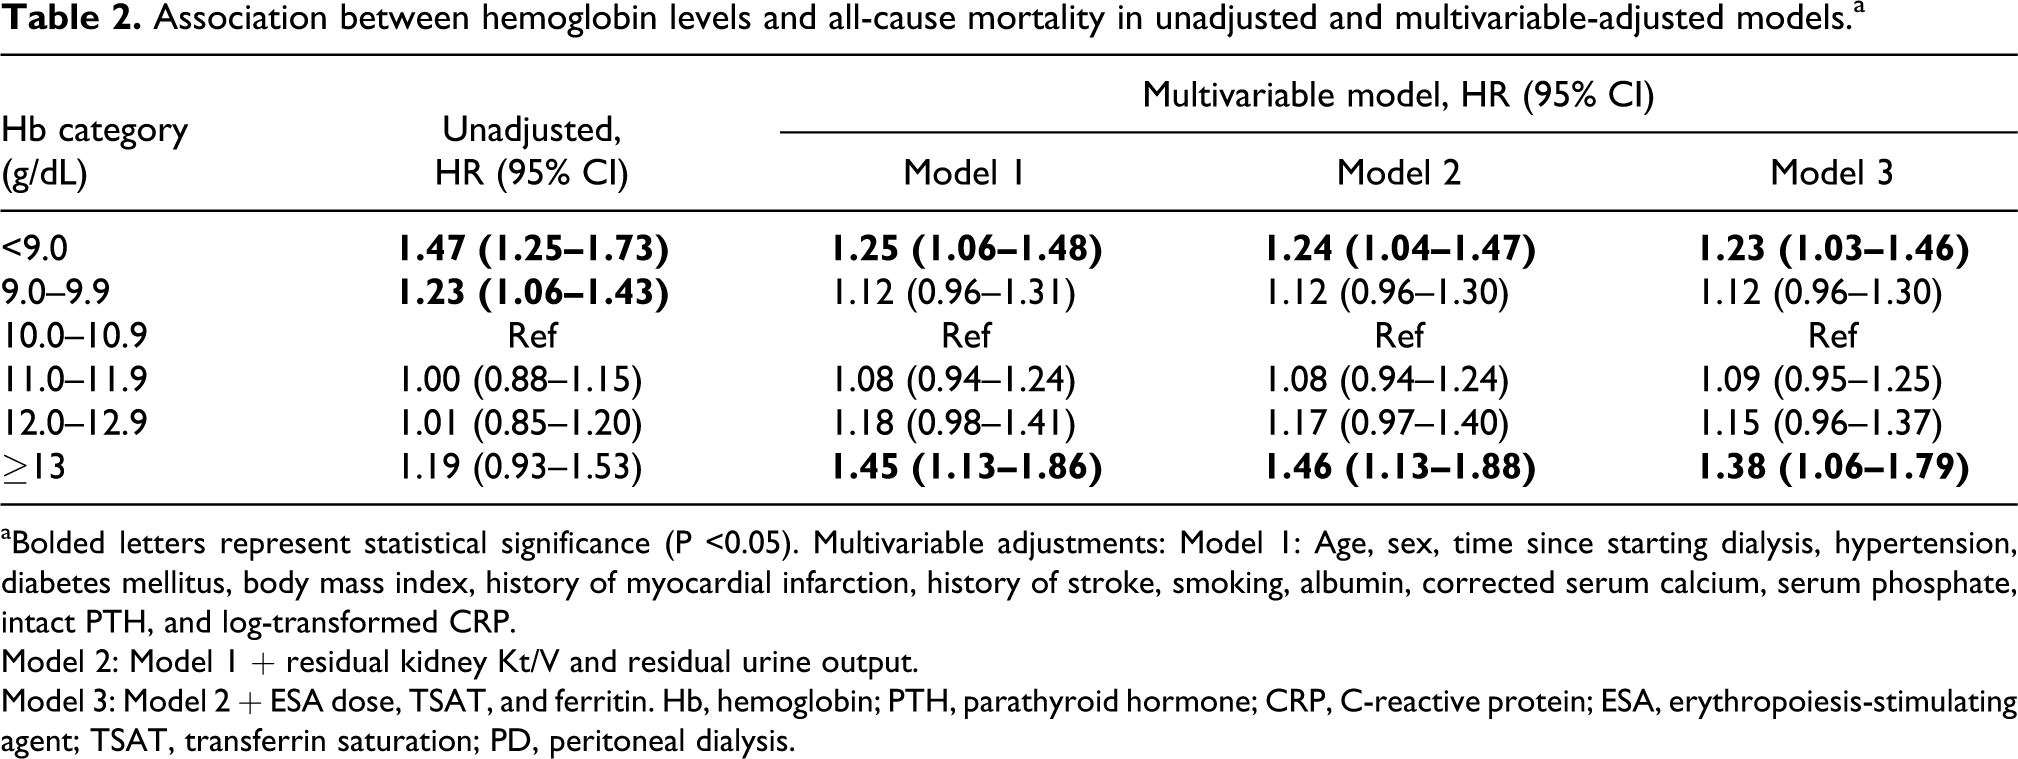
aBolded letters represent statistical significance (P <0.05). Multivariable adjustments: Model 1: Age, sex, time since starting dialysis, hypertension, diabetes mellitus, body mass index, history of myocardial infarction, history of stroke, smoking, albumin, corrected serum calcium, serum phosphate, intact PTH, and log-transformed CRP.
Model 2: Model 1 + residual kidney Kt/V and residual urine output.
Model 3: Model 2 + ESA dose, TSAT, and ferritin. Hb, hemoglobin; PTH, parathyroid hormone; CRP, C-reactive protein; ESA, erythropoiesis-stimulating agent; TSAT, transferrin saturation; PD, peritoneal dialysis.
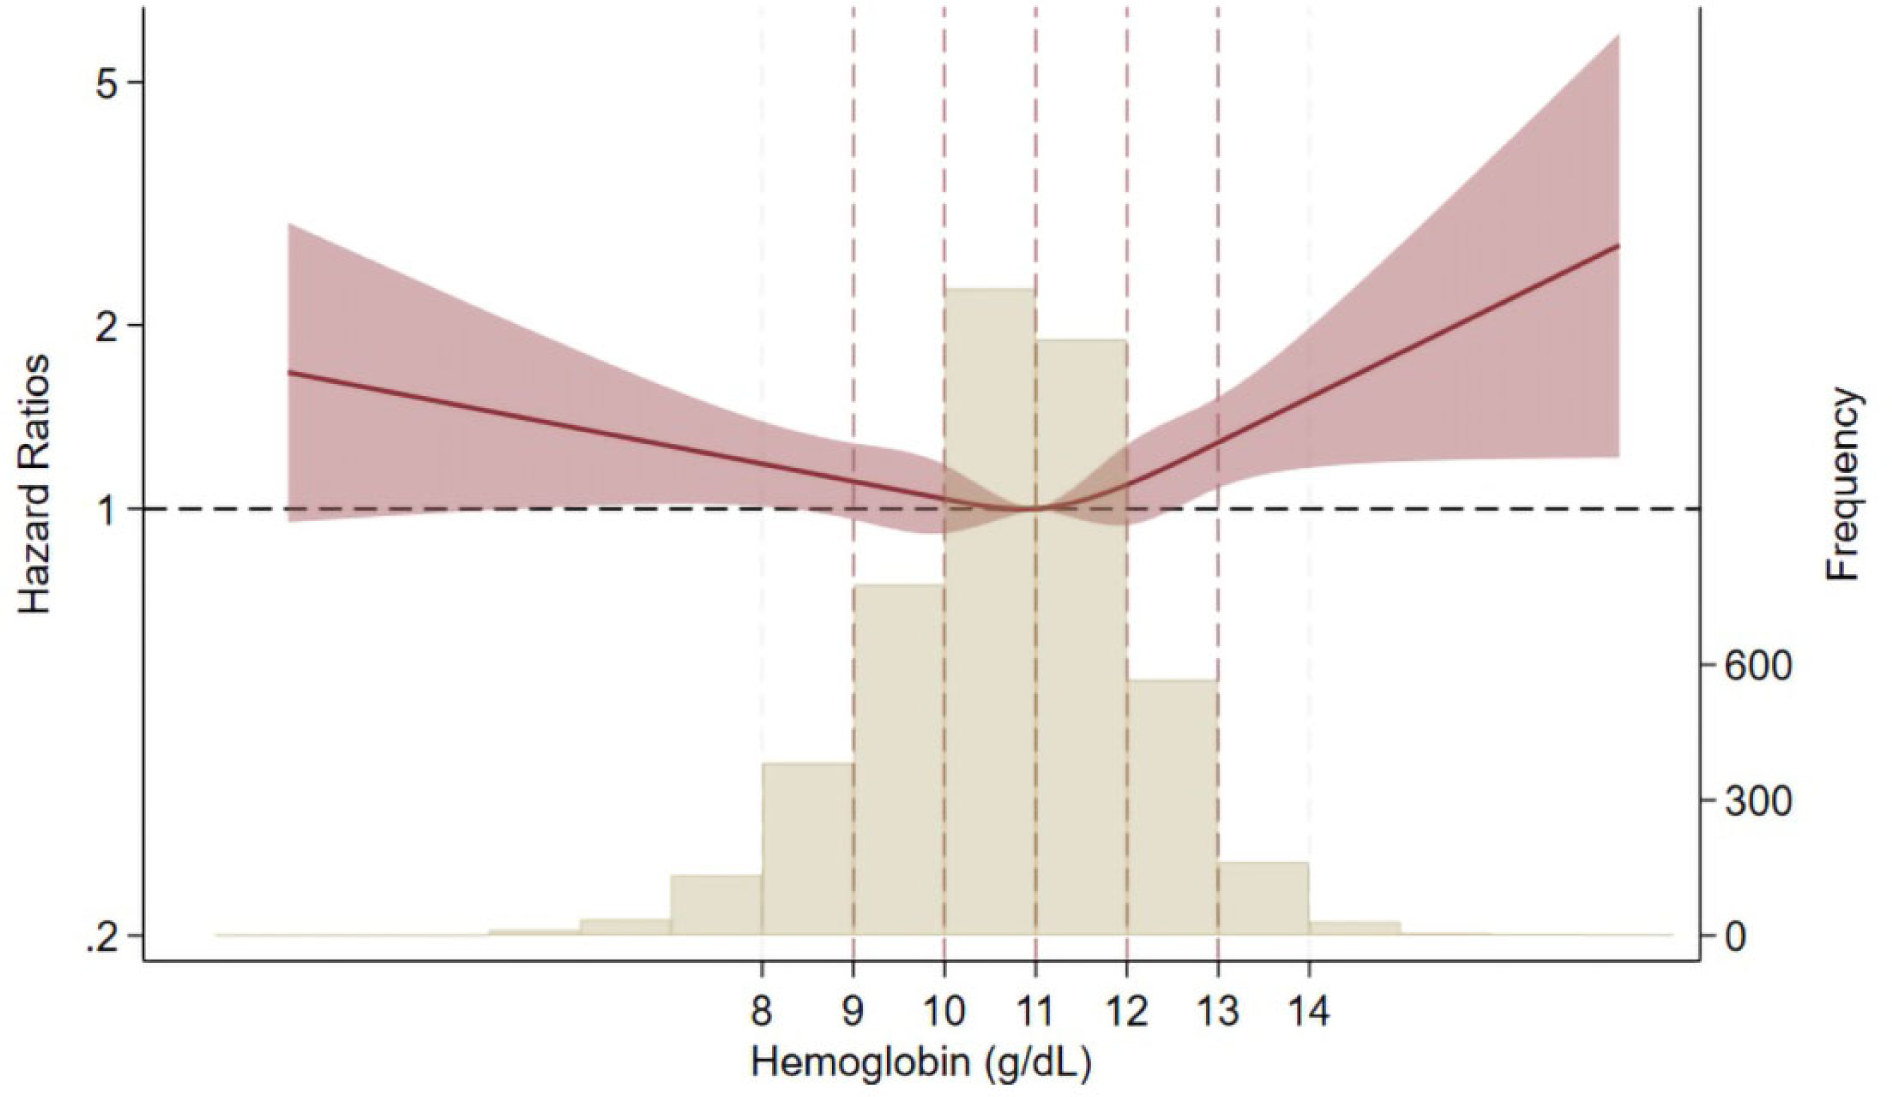
Non-linear association between haemoglobin levels and all-cause death. Adjusted for age, sex, time since starting dialysis, hypertension, diabetes mellitus, body mass index, history of myocardial infarction, history of stroke, history of limb amputation, smoking, albumin, creatinine, corrected serum calcium, serum phosphate, intact PTH, log-transformed CRP and total cholesterol.
In the stratified analyses, a history of CVD only revealed a heterogeneous association between haemoglobin levels and mortality (p for interaction = 0.023) (Table 3). In patients with a history of CVD, 12.0–12.9 and ≥13.0 g/dL of haemoglobin was associated with mortality (HR, 1.56 [95% CI, 1.13–2.16] and 1.81 [95% CI, 1.10–3.00], respectively). The other strata did not exhibit heterogeneous results regarding the association between haemoglobin levels and mortality. Among patients with anuria and high CRP, haemoglobin levels ≥13.0 g/dL showed higher HRs of 2.34 (95% CI, 1.13–4.85) and 1.51 (95% CI, 1.00–2.28), respectively, than patients in the other group. Furthermore, patients with DM whose haemoglobin levels were above 11.0 had a high risk of mortality.
Stratified analysis of the association between haemoglobin categories and mortality.a
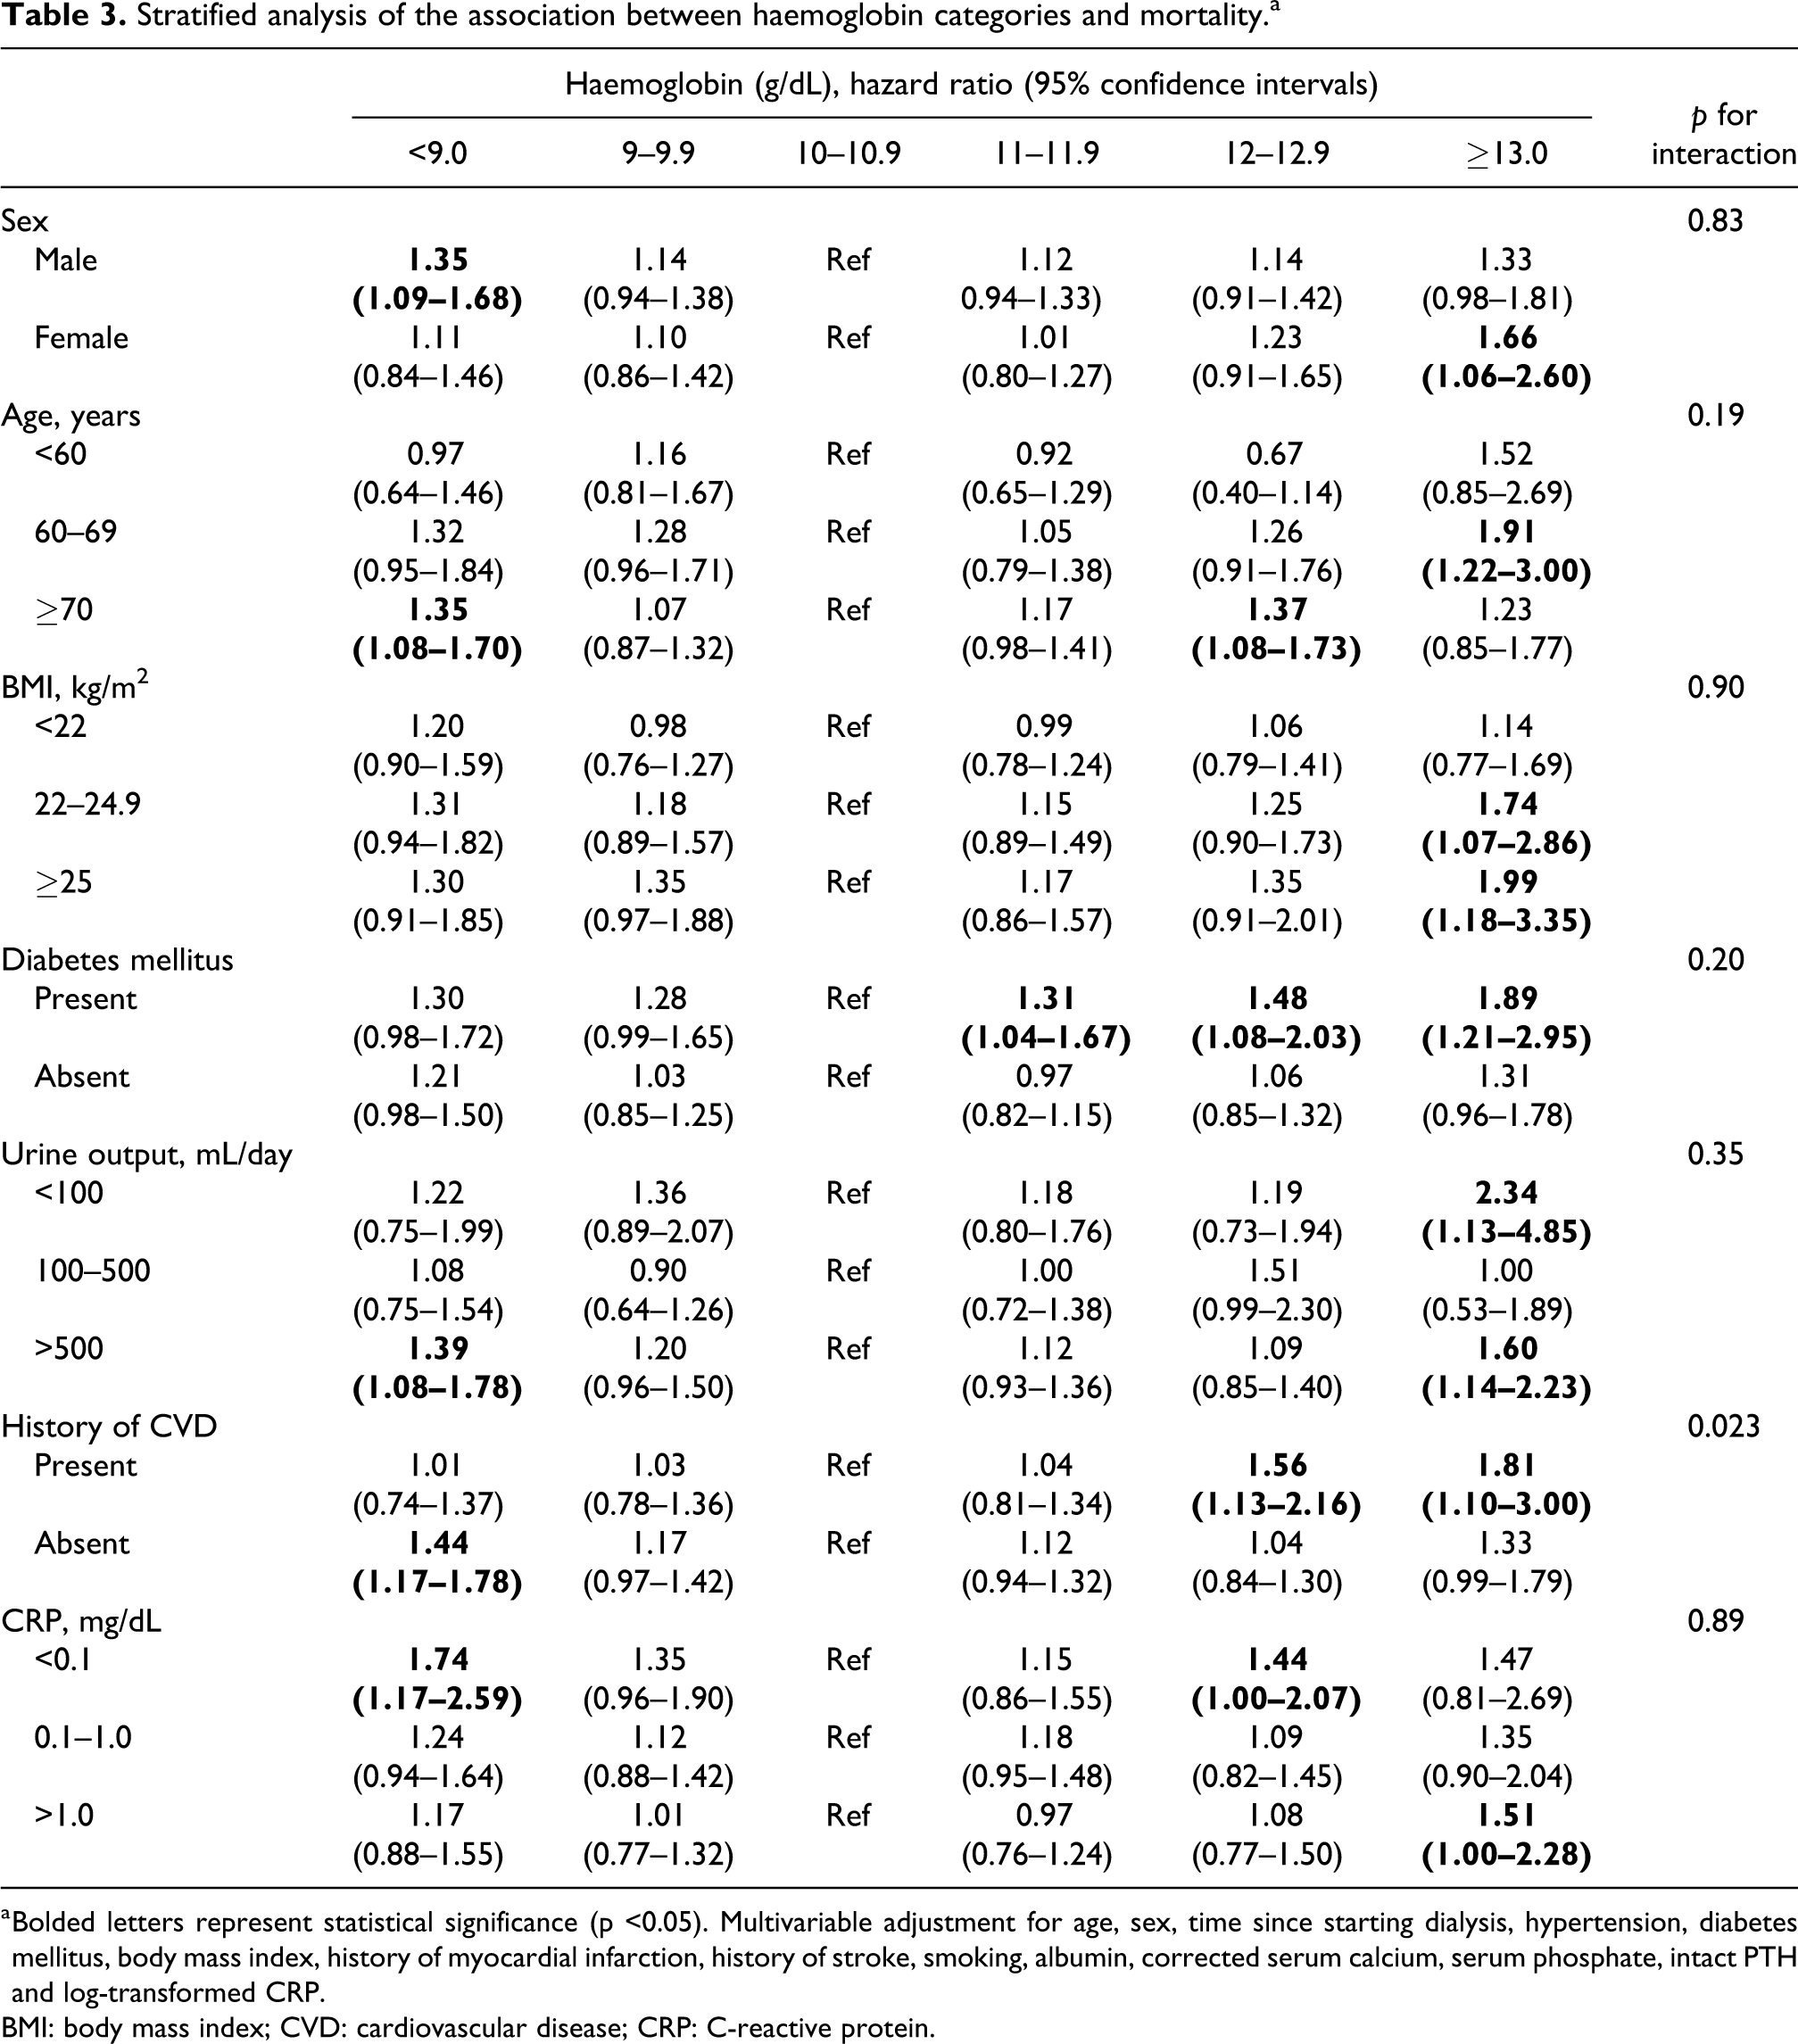
a Bolded letters represent statistical significance (p <0.05). Multivariable adjustment for age, sex, time since starting dialysis, hypertension, diabetes mellitus, body mass index, history of myocardial infarction, history of stroke, smoking, albumin, corrected serum calcium, serum phosphate, intact PTH and log-transformed CRP.
BMI: body mass index; CVD: cardiovascular disease; CRP: C-reactive protein.
Cause-specific death
The incidence of all-cause and cause-specific deaths is depicted in Online Supplemental Figure 2. A U-shaped association between haemoglobin levels and outcomes was observed for all-cause death and death due to CVD. A J-shaped association was observed for deaths due to malignant diseases, with a high incidence observed only in the highest category.
Discussion
This study utilised a nationwide cohort of patients undergoing PD in Japan and made several important observations. First, it confirmed previous findings 4 regarding the association between lower haemoglobin levels and increased risk of mortality in PD patients. Second, we were the first to identify the upper limit of target haemoglobin by demonstrating a significant association between haemoglobin levels ≥13 g/dL and mortality. Third, there were no significant differences in the association between achieved haemoglobin levels and mortality in the subgroups based on sex, age, DM, BMI, CRP and residual urine output. However, substantial differences were observed between patients with and without a history of CVD. Our study is the first in Japan to demonstrate the target range of haemoglobin in patients undergoing PD. Since the analysis was based on a nationwide dialysis registry database, the results are generalisable.
The present study provides objective data regarding the current Japanese guidelines for maintaining haemoglobin levels below 13 g/dL. Four previous studies failed to establish the upper haemoglobin limits for PD patients. 3 –6 For instance, a study from Taiwan reported haemoglobin levels similar to those in Japan but with significantly higher ferritin levels. 6 However, the study mentioned that Taiwanese nephrologists avoided using disproportionately high ESA dosages to achieve haemoglobin levels of 10–11 g/dL by increasing iron supplementation. Hence, differences in iron and/or ESA administration practices may partly account for the variation in results. Another study conducted in the United States, which examined haemoglobin and mortality in PD patients treated with ESAs, failed to demonstrate an upper limit of haemoglobin in all participants. 4 However, it revealed a U-shaped association between haemoglobin levels and all-cause and cardiovascular mortality in non-African American men. In this previous study, the upper limit of haemoglobin was 14–15 g/dL, which was higher than that observed in the present study. This disparity may be attributed to the younger age of participants and shorter time since PD initiation in that study than in our study. The follow-up period was substantially longer in the present study (up to 9 years, median: 3.5 years) than in these previous studies (median: <3 years), 3 –6 and this opportunity for long-term observation may have been a major factor that led to the obtained results. PD patients in Japan are more likely to be treated for longer periods than those in other countries 20 and may be exposed to high haemoglobin levels for longer periods. On the other hand, previous studies may have had difficulty reproducing the circumstances of such long-term exposure to high haemoglobin levels. In addition, the JRDR, the source of the data used in this study, has a high follow-up rate, with only about 10% of patients being lost to follow-up. Furthermore, the bias of censoring events among the comparison groups was almost negligible, and the impact of bias due to informative censoring was minimal.
Another important aspect of anaemia treatment in patients with CKD is the use of ESAs. A meta-analysis indicated that ESA use is associated with an increased risk of thromboembolic events. 21 This is consistent with the results of a large, randomised, double-blind trial involving over 2000 patients with systolic heart failure and anaemia, in which one group received DA to achieve a target haemoglobin level of 13 g/dL, while the other received a placebo. The study discovered no difference in the primary outcome; however, there was an increase in thromboembolic events. 22 In the present study, incorporating ESA dosage as a covariate in the multivariable-adjusted models did not significantly alter the association between haemoglobin levels and mortality. A previous study showed that ESA doses in PD patients were not as high as in HD patients and that hypo-responsiveness to ESAs had no greater impact on survival in PD patients than in HD patients, 23 suggesting that ESA doses and ESA hypo-responsiveness have a limited clinical impact in PD patients. This could explain why the association of haemoglobin with the outcome was not altered after adjustment for ESA doses.
The present study revealed a different upper limit of the target haemoglobin level, 12 g/dL, in a subset of patients with a history of CVD. In addition, we found that higher achieved haemoglobin levels were associated with an increased incidence of cardiovascular mortality, although statistical significance was not reached owing to the limited sample size. A study conducted on Japanese patients undergoing HD indicated that the association between haematocrit and mortality differed between patients with and without atherosclerosis. 24 Patients without CVD exhibited an inverse association between haematocrit and mortality risk, whereas those with CVD did not exhibit such a clear association. The authors speculated that increased blood viscosity may reduce blood flow volume in individuals with atherosclerosis, which may lead to reduced oxygen supply to vital organs. 25 In contrast, patients with a history of CVD did not demonstrate a significant association between haemoglobin levels (<9.0) and mortality. That does not mean that patients with a history of CVD are more susceptible to a reduced haemoglobin concentration than those without. It may simply be due to the small sample size in the lowest haemoglobin category of patients with a history of CVD.
The risk of all-cause mortality in individuals with achieved haemoglobin levels ≥11 g/dL was increased in patients with DM as haemoglobin levels increased, although no significance was observed between those with and without DM (p interaction = 0.20). The results were consistent with the TREAT trial, which demonstrated that higher target haemoglobin levels (>11.5 g/dL) were associated with an increased risk of stroke and hypertension in patients with non-dialysis-dependent diabetic kidney disease. 7 This may be because patients with DM are more likely to develop atherosclerosis than those without.
The present study has several limitations. First, data on iron supplementation were not available. Second, a substantial number of patients, nearly one-third, were missing values for haemoglobin in the data set. This may have led to a selection bias; at the same time, the sample sizes for cause-specific deaths were insufficient. However, we showed a similar association with CVD deaths in a crude descriptive analysis. Third, a substantial proportion of data on residual Kt/V, an important indicator of residual kidney function, were missing. This could lead to a biased estimation in our results. However, when we analysed the data with and without using residual Kt/V in the model, the results were consistent. Fourth, we performed several subgroup analyses based on a prespecified hypotheses, yet the potential for alpha error overall error rate in multiple comparisons cannot be entirely dismissed. Nevertheless, a statistically significant interaction, requiring robust statistical power, a statistically significant interaction, which would have been less likely to be detected without substantial statistical power, was observed between the haemoglobin category and a history of CVD. This interaction was not observed in the other subgroup analyses. Fifth, while the follow-up rate was as high as approximately 90%, there could be potential bias due to informative censoring. However, there was little difference in the proportion of censoring events among the comparison groups, except for the transition to HD (Online Supplemental Table 2). The lowest category had fewer transitions to HD than did the reference category; thus, potentially biasing the mortality rate higher in this category. Conversely, in the highest category, the number of transitions to HD was comparable to that of the reference category. Finally, because this was a retrospective study, there may have been unmeasured confounders. However, we used a nationally representative data set of PD patients in Japan.
In conclusion, our study provided important insights into determining the target ranges, including the upper limit of haemoglobin, in PD patients using a nationally representative registry database for the first time. Moreover, it may be advisable to set a lower upper limit for patients with a history of CVD.
Supplemental Material
Supplemental Material, sj-docx-1-ptd-10.1177_08968608241244995 - Management of anaemia and prognosis of patients undergoing maintenance peritoneal dialysis: A nationwide cohort study
Supplemental Material, sj-docx-1-ptd-10.1177_08968608241244995 for Management of anaemia and prognosis of patients undergoing maintenance peritoneal dialysis: A nationwide cohort study by Takahiro Imaizumi, Takeshi Hasegawa, Takaaki Kosugi, Hiroki Nishiwaki, Hirokazu Honda, Kazuhiko Tsuruya, Yasuhiko Ito and Takahiro Kuragano in Peritoneal Dialysis International
Footnotes
Acknowledgements
The data reported herein were obtained from the JRDR database. The authors are thankful to all patients and medical staff who registered the patients’ data in the JRDR database. The interpretation and reporting of these data are the responsibility of the authors and should not be viewed as an official policy or interpretation of the JSDT.
Author contributions
Conceptualisation: TI, TH and YI; data acquisition: TI, TH, YI and TKu; data analysis: TI; methodology: TI, TH, TKo and YI; supervision: HH, KT, YI and TKu; drafting: TI; and interpretation: TH, TKo, HN, HH, KT, YI and TKu.
Declaration of conflicting interests
The author(s) declared no potential conflicts of interest with respect to the research, authorship, and/or publication of this article.
Ethical approval
The study protocol was approved by the Medicine Ethics Committee of the Japanese Society for Dialysis Therapy. Approval number: 61.
Funding
The author(s) disclosed receipt of the following financial support for the research, authorship, and/or publication of this article: TI received a research grant from Kyowa Kirin Co., Ltd. and GSK. TH received a research grant from JSPS KAKENHI, Grant Number 19K03092, and honoraria from Kyowa Kirin, Baxter, Terumo, Ono Pharmaceutical and Torii Pharmaceutical. TKo received honoraria from Kyowa Kirin, Amgen and Torii. HN received speaker honoraria from Kyowa Kirin, Baxter, Terumo, Ono Pharmaceutical Co. Ltd., Daiichi-Sankyo and Kissei Pharmaceutical Co. Ltd. HH is a scientific advisor for Astellas Pharma, Bayer Yakuhin, Kyowa Kirin, Mitsubishi Tanabe Pharma and Torii Pharmaceutical and has obtained research funds from Chugai Pharmaceutical, Kyowa Kirin, Otsuka Pharmaceutical and Torii Pharmaceutical and lecture fees from Astellas Pharma, Bayer Yakuhin, Chugai Pharmaceutical, Kissei Pharmaceutical, Kyowa Kirin, Mitsubishi Tanabe Pharma and Torii Pharmaceutical. KT received honoraria from Kyowa Kirin, Mitsubishi-Tanabe, Astellas, Torii, Bayer and Chugai and endorsements from Kyowa Kirin, Torii, Chugai and Bayer. YI received research grants and speaker honoraria from Chugai Pharmaceutical, Kyowa Kirin, Astellas Pharma, Mitsubishi Tanabe Pharma, Bayer and Torii Pharmaceuticals. TKu received research grants from Ono Pharmaceutical Co., Ltd., Kissei Pharmaceutical Co., Ltd., speaker bureaus from Kyowa Kirin, Fuso Pharmaceutical Industries, Ltd., Mitsubishi Tanabe Pharma Corporation, Astellas Pharma Inc., AstraZeneca Plc., Bayer Yakuhin, Ltd., Astellas Pharma Inc., Mitsubishi Tanabe Pharma Corporation and Bayer Yakuhin Ltd.
Informed consent
Waived.
References
Supplementary Material
Please find the following supplemental material available below.
For Open Access articles published under a Creative Commons License, all supplemental material carries the same license as the article it is associated with.
For non-Open Access articles published, all supplemental material carries a non-exclusive license, and permission requests for re-use of supplemental material or any part of supplemental material shall be sent directly to the copyright owner as specified in the copyright notice associated with the article.