
Abstract
Peritoneal dialysis (PD)-related peritonitis is one of the top priorities for care and research among PD stakeholders. This study summarizes PD peritonitis rates from available population-based national or regional registries around the world, examining trends over time. This is a systematic review of PD peritonitis rates in patients treated with PD for kidney failure, from census-based national or provincial/statewide/provider registries or databases. MEDLINE (via PubMed) was searched from inception to August 2020, and inquiries made to national registry personnel using the International Comparisons section of the 2018 United States Renal Data System Annual Data Report as a contact list. Quantitative synthesis was done using weighted random-effects Poisson regression. Of 81 countries that reported utilization of PD, 19 did not have a traditional dialysis registry (governed by either professional societies or government entities), and only 33 monitored PD peritonitis rates correctly and accessibly. There is wide variation in PD peritonitis rates between countries, although the global average has been decreasing over time, from 0.600 episodes/patient-year in 1992 to 0.303 in 2019. Other sources of variability include the continent in which the country is nested and the size of its PD population. PD peritonitis, despite its importance for PD stakeholders, is under-monitored. While the global rate is decreasing over time, the presence and extent of this improvement varies from country to country. There is an opportunity for better monitoring, research into underachieving and overachieving nations and development of international clinical support networks.
Introduction
Peritonitis is the main treatment-related complication affecting patients on peritoneal dialysis (PD). It is one of the most, if not the most, important patient-centred outcome, as well as being an important cause of death directly from sepsis and/or local complications, and an important cause of delayed mortality from exacerbation of underlying disease by the stress of the condition. 1,2 Peritonitis rate is a core component of quality control for any given PD programme and a key metric for monitoring programmatic success across health jurisdictions. Despite the importance of the condition, the global landscape of PD peritonitis rates has not been well-established, with only a small literature base comparing rates between different countries and between different eras.
In this article, PD peritonitis rates are summarized from available population-based registries and databases around the world, examining trends over time. The objective of this study was to quantify variation between health jurisdictions and over time and provide insights into opportunities for improving clinical care and further comparative epidemiological research. For the purposes of reporting and analysis, the study is presented as a systematic review with adherence to Preferred Reporting Items for Systematic Reviews and Meta-Analyses checklists. 3
Methods
Eligibility criteria
For the purpose of this study, a registry was defined as any systematic collection of standardized information to evaluate care for a population defined by a particular disease. 4 For this research, a registry was eligible for inclusion if it reported peritonitis rates (as a ratio of episodes to time-at-risk) in patients treated with PD for kidney failure; was census-based rather than sample-based, 5 included national or provincial/statewide/provider populations; was active at the time of searching; had acceptable rates of incomplete data submission in the opinion of the respective registry governance group.
No particular limitation was placed on the type of organization responsible for the registry, although efforts were made to identify traditional dialysis registries governed by either government entities or professional societies. However, non-traditional registries governed by regional clinical networks, patient advocacy organizations and health service provider systems were all eligible, so long as they met all the criteria above. Data from individual hospitals and single commercial PD service providers were not considered unless they provided PD treatment for the majority of PD patients nationally.
Data sources
Eligible registries were identified from (1) a MEDLINE (via PubMed) search from inception to 26 August 2020 using relevant search terms (see Online Supplemental Table S1) and (2) contact with countries reporting national PD utilization data in International Comparisons section of the 2018 United States Renal Data System (USRDS) Annual Data Report (table N.7b). 6 There was no language restriction used in the literature search. These results were supplemented by Internet search engines results to 26 August 2020, snowballing and reverse snowballing from reference lists of relevant review articles and clinical practice guidelines and by citation tracking in Google Scholar.
Registry selection
Registries were selected for inclusion and data extraction if they reported peritonitis rates annually and had done so up to and including 2015. These criteria were designed to ensure contemporary insights from modern data.
Data items and collection
Annual peritonitis rate data were extracted by the author, including the most recent year available, but excluding data from before 1992. This was to avoid data using PD systems with obsolete technology before the advent of modern integrated disconnect system (IDS) sets. 5 –8 This framing does not acknowledge that the uptake of the IDS set was gradual over the 1990s and early 2000s and that older technology was still commonly being used until the turn of the century, 9 and even more recently (personal communication from Merita Rroji).
Peritonitis rates were sourced directly from registry reports or alternatively obtained from (and confirmed by) registry personnel. These data were supplemented by the number of patients on PD during the year in the population (or subpopulation) covered by the registry, for the purpose of weighting in statistical computations.
No data were collected assessing risk of bias in the individual registries, as might be reflected by the presence and extent of missing data, the integrity of various sources used for ascertainment of outcomes (e.g. whether data were reported by the healthcare professional vs. linkage to clinical information systems or reimbursement claim repositories), or by the utilization of data audit and validation procedures.
The main summary measure was PD peritonitis rate, reported as number of peritonitis episodes per patient-year.
Synthesis of results
Poisson regression was used to provide a quantitative summary of PD peritonitis data and explore the relationship between PD peritonitis rate and year. A random effect was used for each health jurisdiction to allow for the residual heterogeneity in peritonitis rates not modelled by the explanatory variable. Data were weighted using the number of PD patients at risk in each registry. The regression coefficient obtained from this analysis describes how the annual PD peritonitis rate in the pooled registries changed with each year. The marginal estimates from this model for each year describe the typical annual PD peritonitis rate, pooled across registries in which data were available. Statistical significance was attributed at an alpha of 0.05.
Results
Registry selection and characteristics
Registry identification and selection is shown in Figure 1(a) and (b), and details of the information flow for each registry are shown in Online Supplemental Table S2. The multiple regional registries in Italy were not modelled separately but rather as a single number for the county as provided by the Società Italiana di Nefrologia. The same could not be done for the 16 regional kidney registries in Spain, and data were sought from each registry and a weighted average calculated for the year from those with data that could be made available. In the end, the only eligible registries from Spain to have suitable data and make it available were Cataluña and Navarra. Of note, conventional searching of medical literature did not identify meaningful amounts of data for this study, and the second data source was the main contributor.
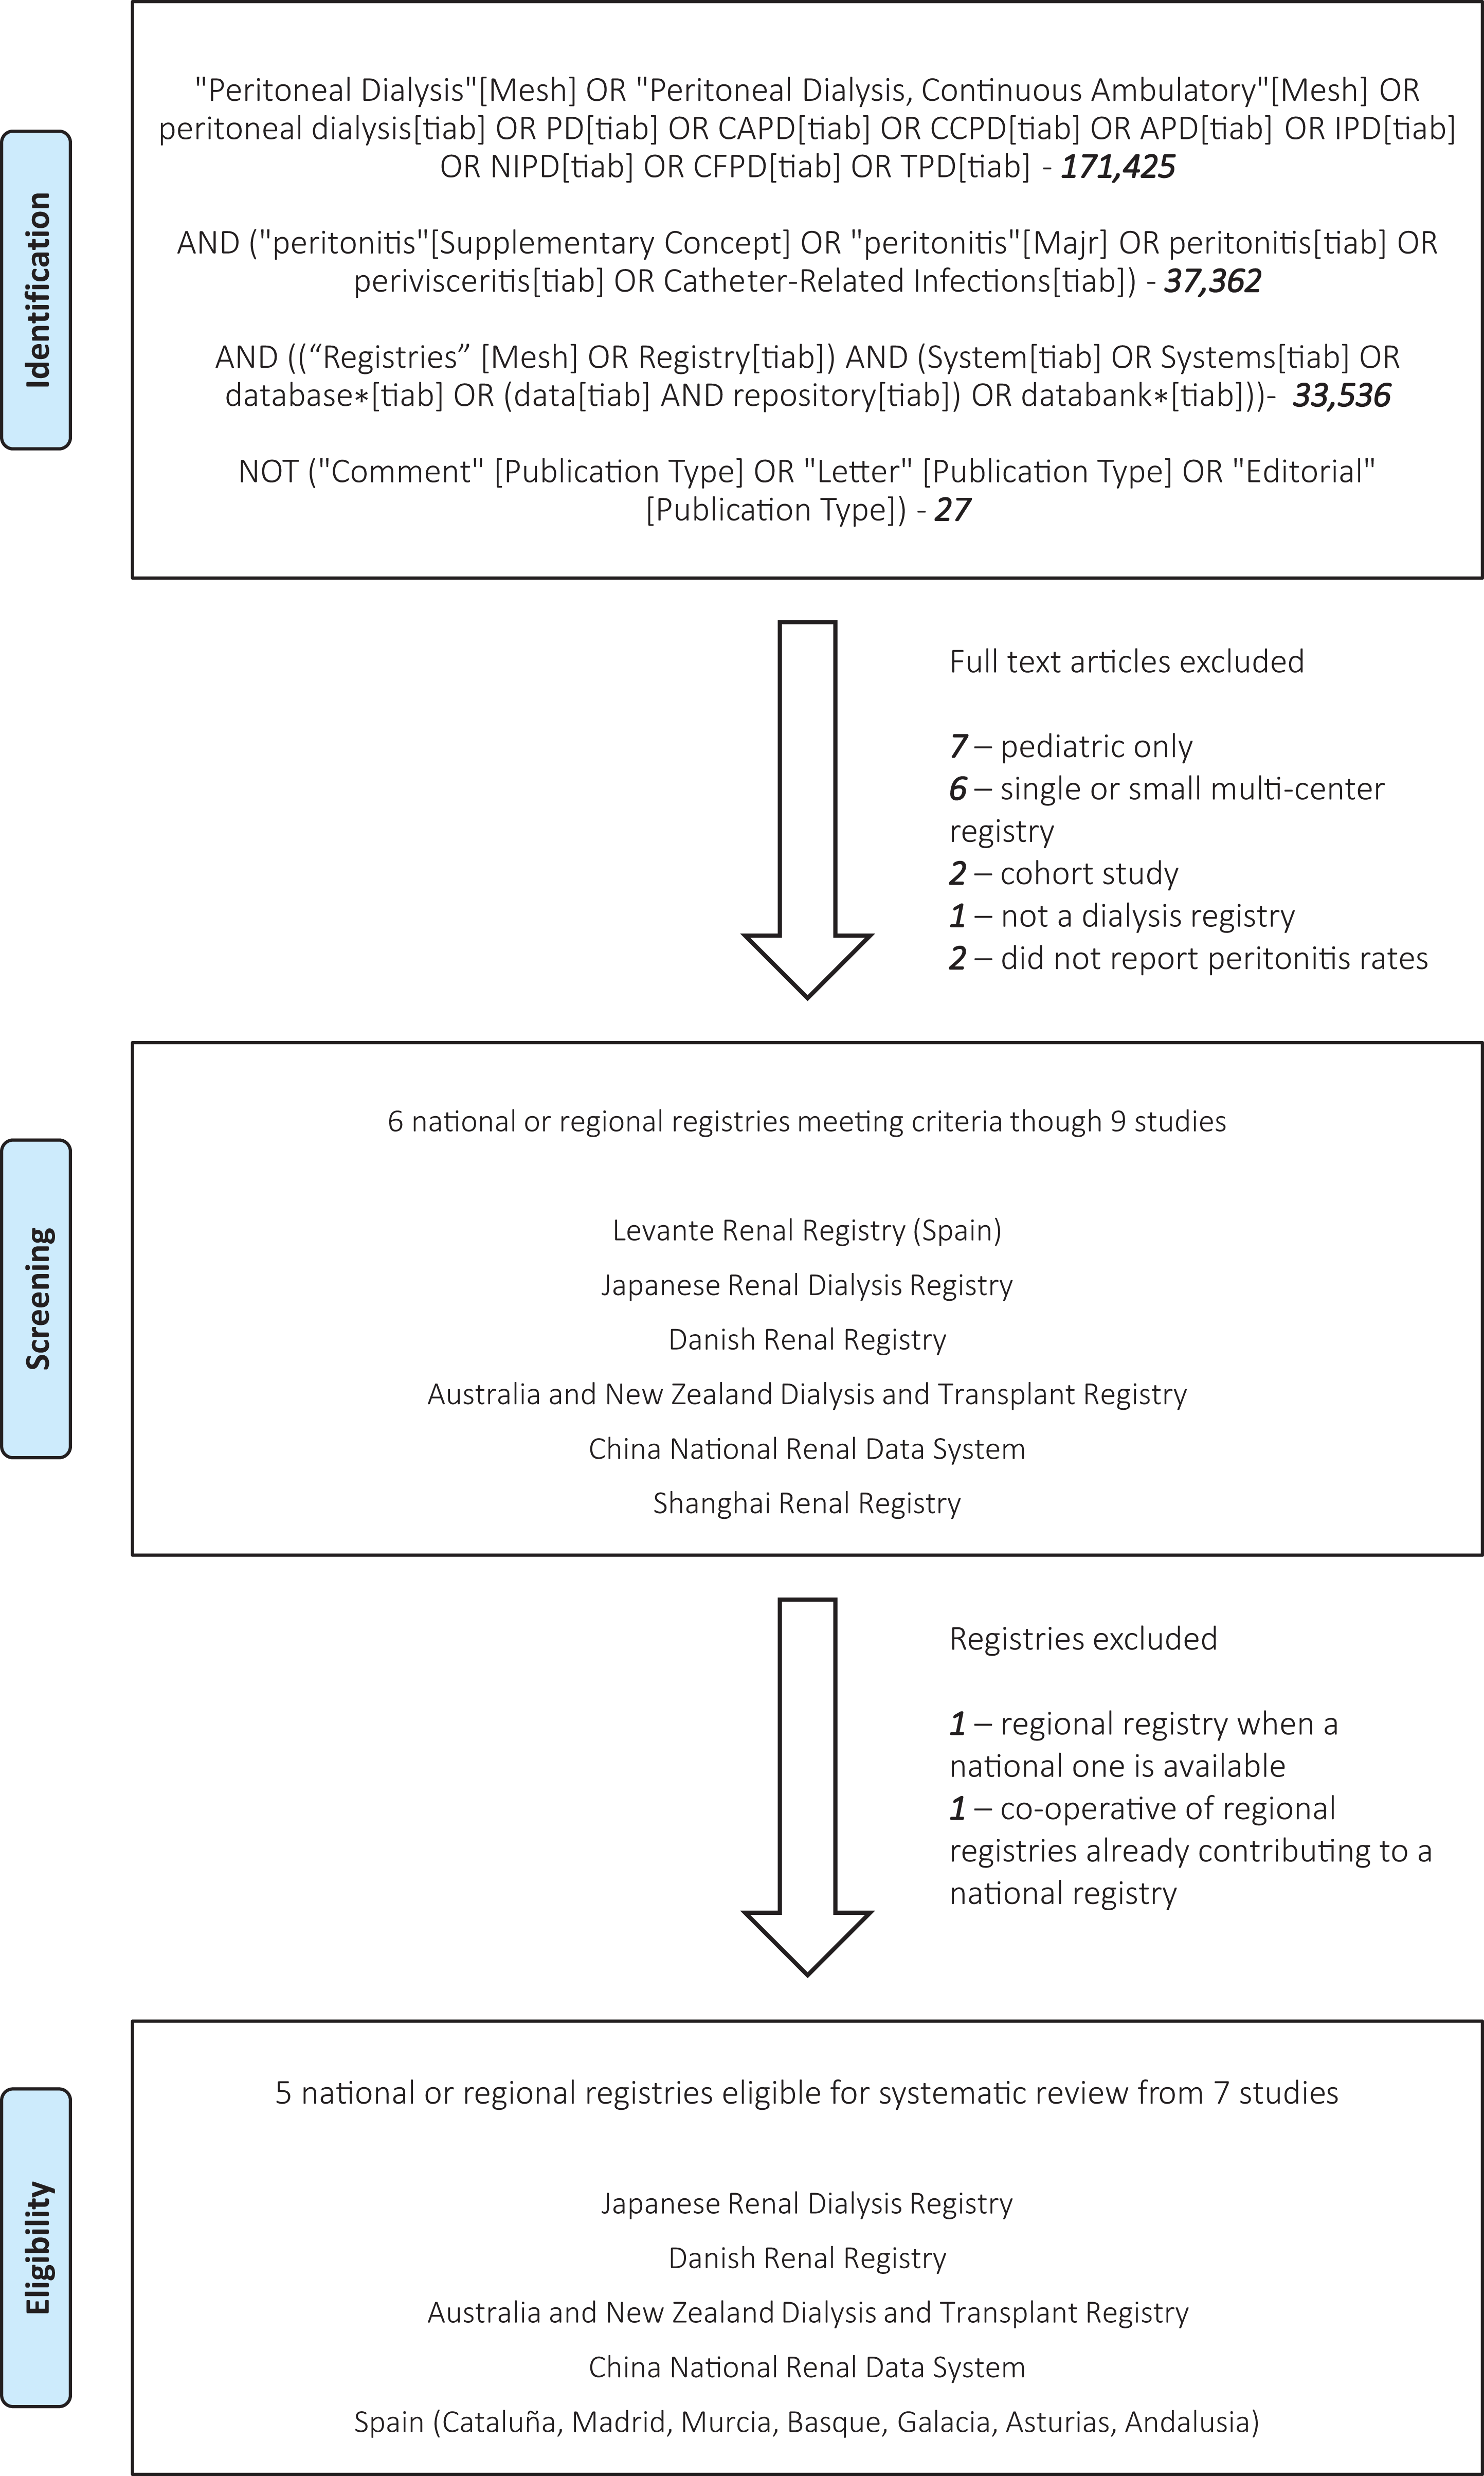
Flow diagram showing the systematic data search and determination of eligible registries.
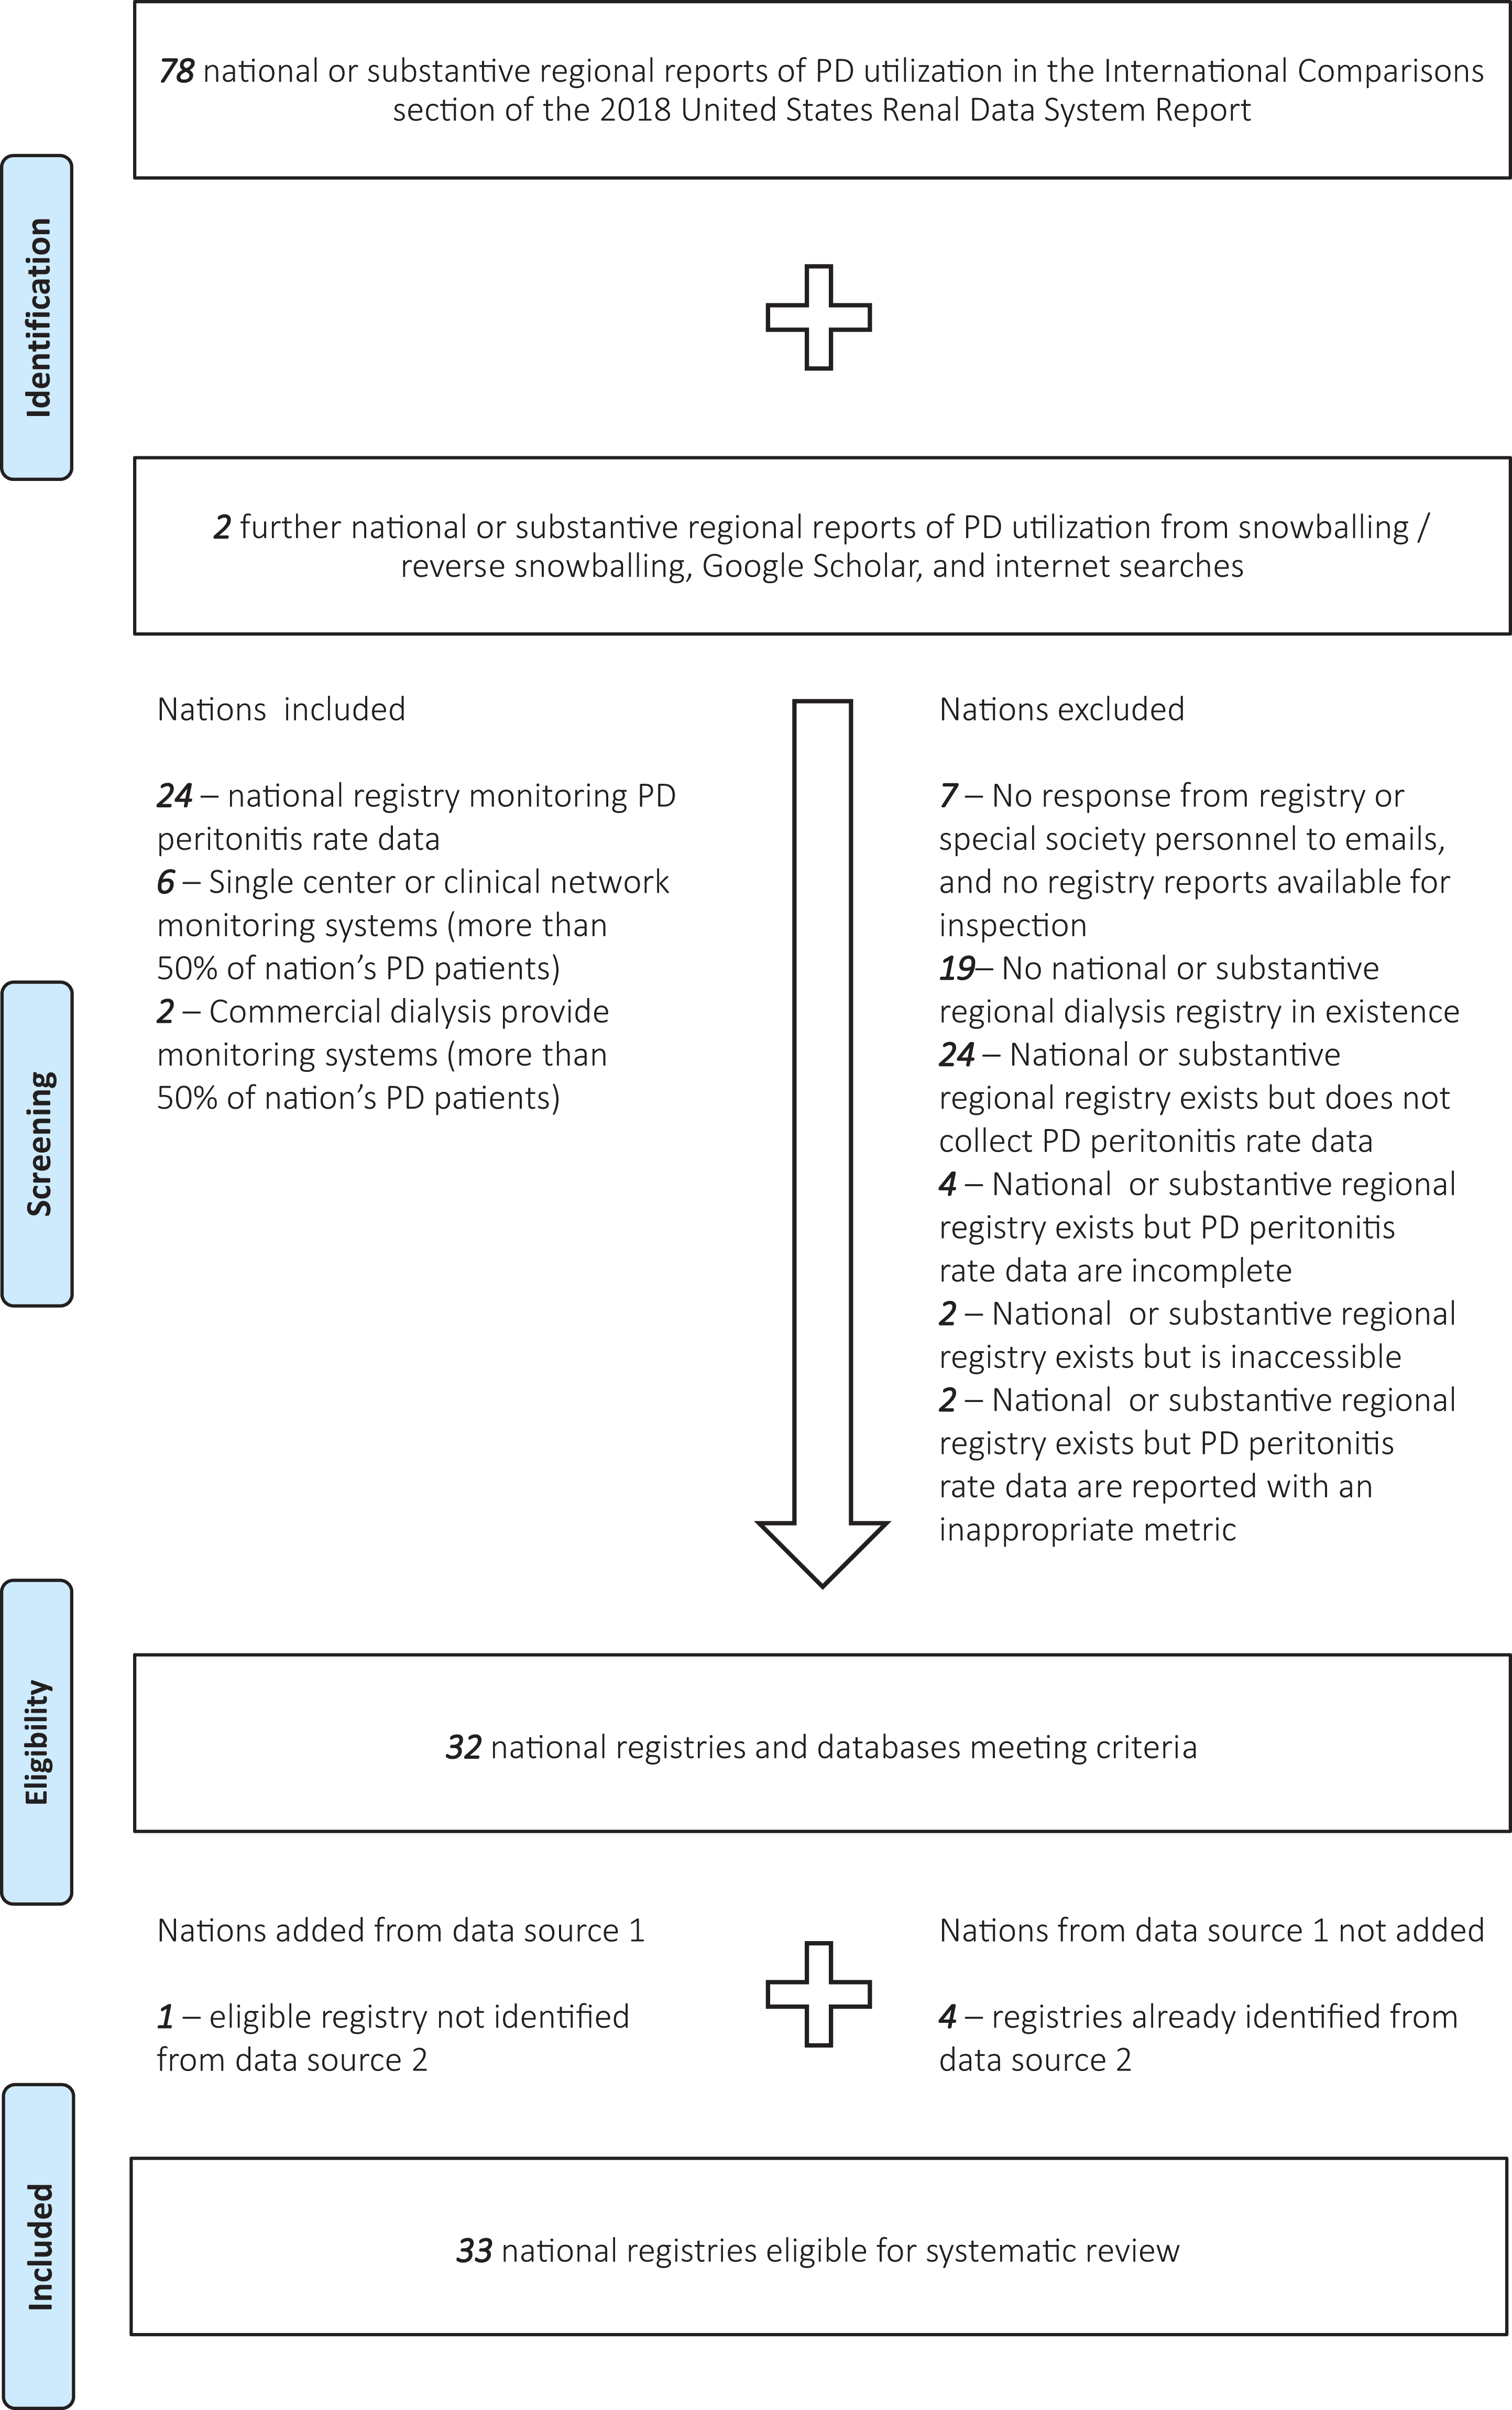
Of the total of 81 countries in the study that report national PD utilization, 19 did not have traditional dialysis registries. Of the 59 countries with traditional dialysis registries, only 33 collected or monitored PD peritonitis rate data. In two countries, the registry was held by the government and not available for ascertainment (Ukraine and Iran). In one country, an inappropriate metric was used to monitor PD peritonitis rate (United States, % of PD patients with peritonitis in Section L of the 2019 USRDS Annual Data Report reference tables at https://www.usrds.org/reference.asp 6 ). In three countries, the registries did monitor PD peritonitis rates appropriately, although missing data were felt to be unacceptably high according to registry personnel (Indonesia and Sweden) or alluded to in publications (Peru 10 ). The registry or professional society personnel from eight countries did not respond to email contact at any stage (Slovakia, Slovenia, Serbia, Peru, Philippines, Egypt, Bosnia and Herzegovina and Jordan), although one had a website and reports indicating that a fully functioning national dialysis registry does indeed exist (Jordan). Only one country made contact to indicate that its registry collected and monitored PD peritonitis rate data, without committing to sharing data (Oman). Three committed to making their data available but were delayed beyond the time of publication of this article (the Netherlands, Saudi Arabia and Sri Lanka). The remainder contributed what data were available.
Of further note, non-traditional registries were available for several nations. Commercial data were probably in existence for many more countries than were obtained but only contributed to three countries in this study. In Argentina, Fresenius Medical Care provides services for ∼1000 of the current 2000 PD patients in that country, and after formal negotiation with their medical affairs leadership, data were made available for that country. In Columbia, Baxter Renal Therapy Services provides services for ∼4000 of the ∼8000 PD patients in that country, and a similar process was successful in that country. In Guatemala, La Unidad Nacional de Atención al Enfermo Renal Crónico (UNAERC) provides services for ∼3000 of the current ∼3700 PD patients in that country through a range of commercial dialysis providers and make their quality metric data (including PD peritonitis rate) public on their website. Other negotiations to procure data from large dialysis organizations were not exhaustive but universally unsuccessful.
The most common non-traditional registries providing data for this study were from single centres providing the majority of PD in their respective countries (Tartu University, Estonia; UNAERC, Guatemala; University Health Centre ‘Mother Teresa’, Albania; University Hospital, Iceland; Riga Stradins University, Latvia; Vilnius and Kaunas Hospitals, Lithuania). The second most common source was from national clinical networks (led by Hamad General Hospital in Qatar; led by Tehran University of Medical sciences in Iran; led by Salvadoran Institute of Social Security in El Salvador; led by Salmaniya Hospital in Bahrain). Of these 15 non-traditional registries, 1 had an inappropriate metric to monitor PD peritonitis rate (Iceland, % of PD patients with peritonitis), 1 had incomplete data (Kuwait), 3 had committed to making their data available but were delayed beyond the time of publication of this article (Lithuania, Iran and Estonia) and 2 did not commit to sharing data (Bahrain and Qatar).
Main results
A total of registries from 33 countries were analysed. PD peritonitis rates over time for each country are shown in Online Supplemental Table S3. Of note, the availability of data has been increasing year-on-year but still unavailable for more than 50% of countries that report PD utilization rates at a national level.
Synthesis of results
Annual PD peritonitis rates are summarized in Table 1 from the main model and displayed graphically by country and in aggregate in Figure 2. PD peritonitis rates are, on average, observed to be decreasing steadily over time, from 0.600 episodes per patient-year in 1992 to 0.303 in 2019. This observed decrement in PD peritonitis rate seems to be continuing, albeit in a less marked way than previously. There is a marked variation in reported PD peritonitis rate by country. Some of this residual variation can be predicted by other factors. For instance, the associated effect of the continent in which the country is nested on PD peritonitis rates is shown in Figure 3, with highest PD peritonitis rates observed in Asia-Pacific, the lowest in the Americas, with Europe – Middle East – Africa being intermediate. This finding is an association only, with uncertain causality, bearing in mind that PD practice and penetration is likely to be very different between continents. The size of the PD population at risk in countries contributes to this observed statistical variation as well, as shown in Figure 4.
Annual mean PD-related peritonitis rates, as obtained by predicted margins from the random-effects Poisson model of aggregated registry data.
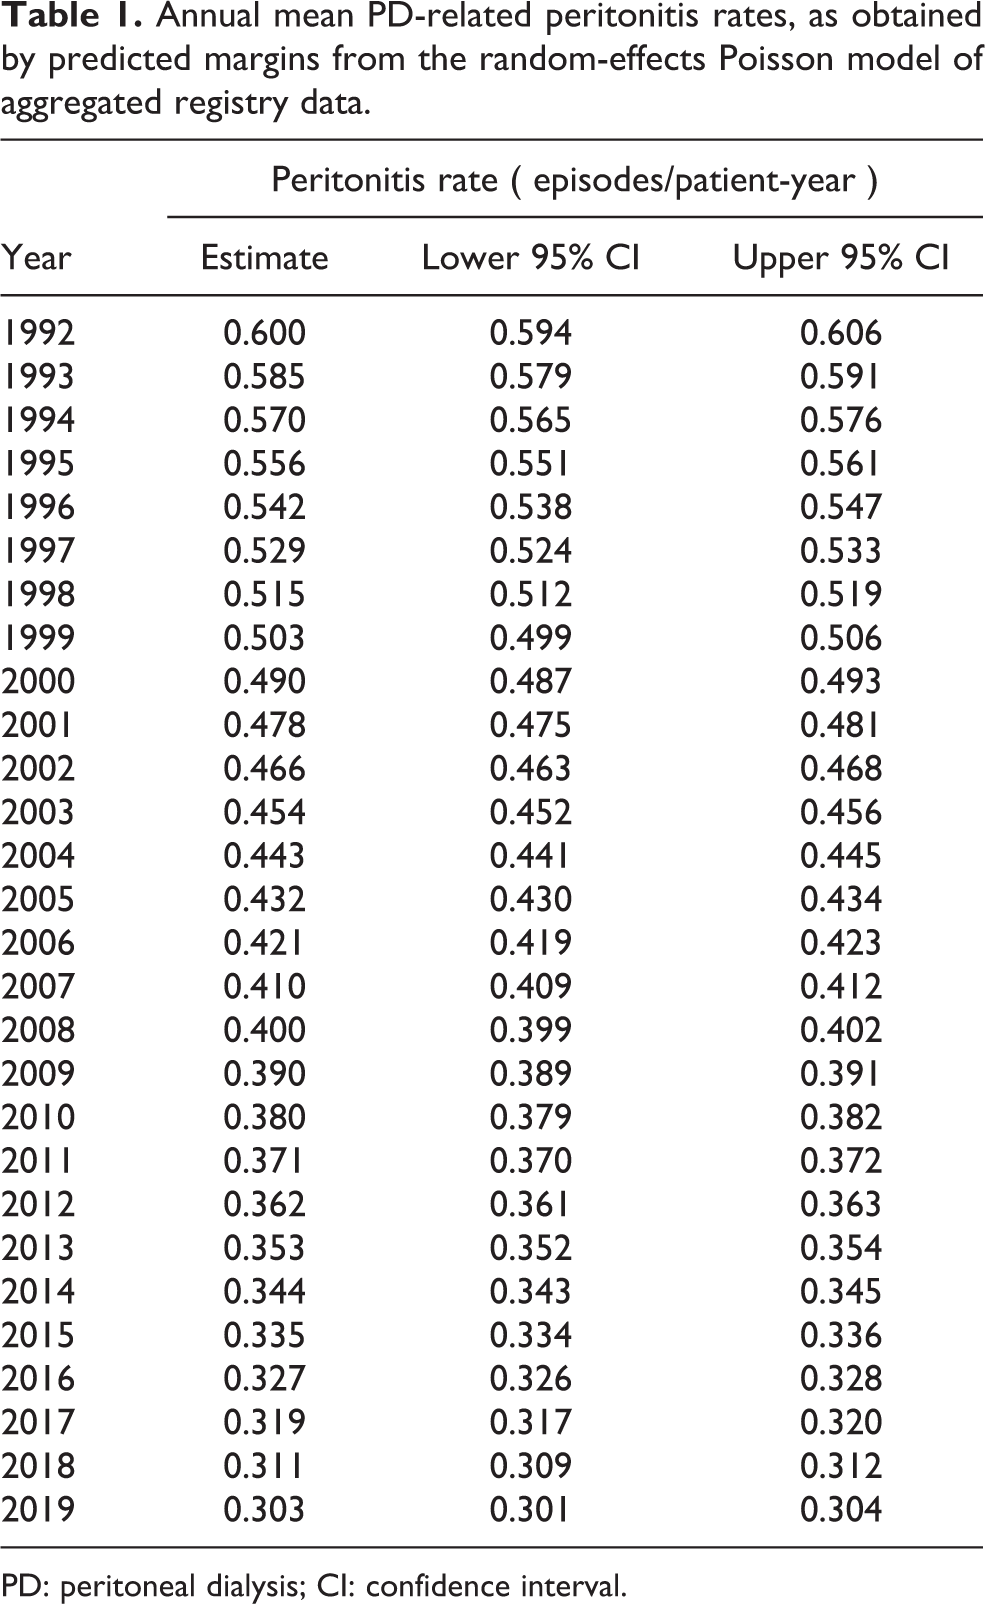
PD: peritoneal dialysis; CI: confidence interval.
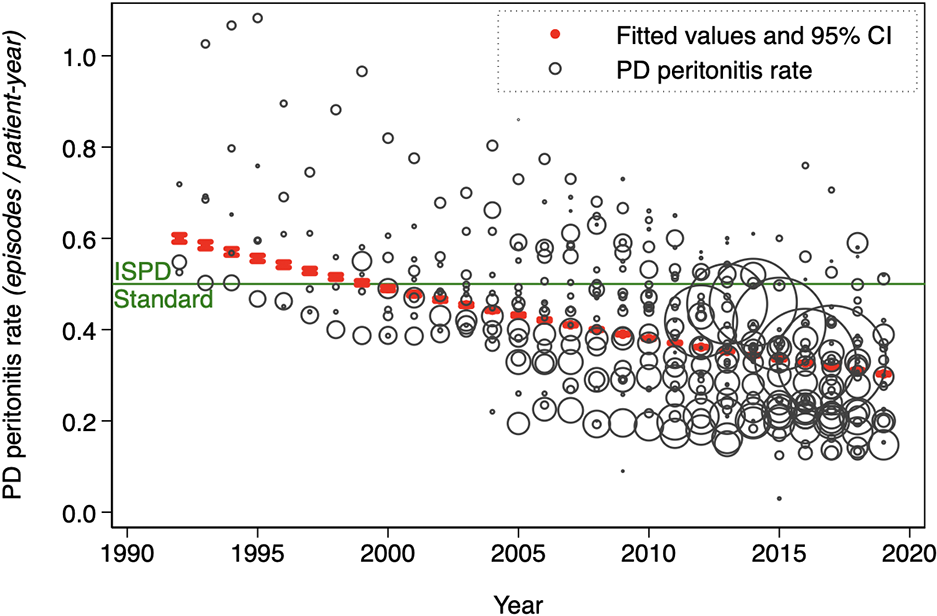
Annual peritonitis rates from 33 national registries (marker sizes weighted for size of PD population), with superimposed annual global average PD-related peritonitis rates, as obtained by marginal predictions from the random-effects Poisson model of aggregated registry data.
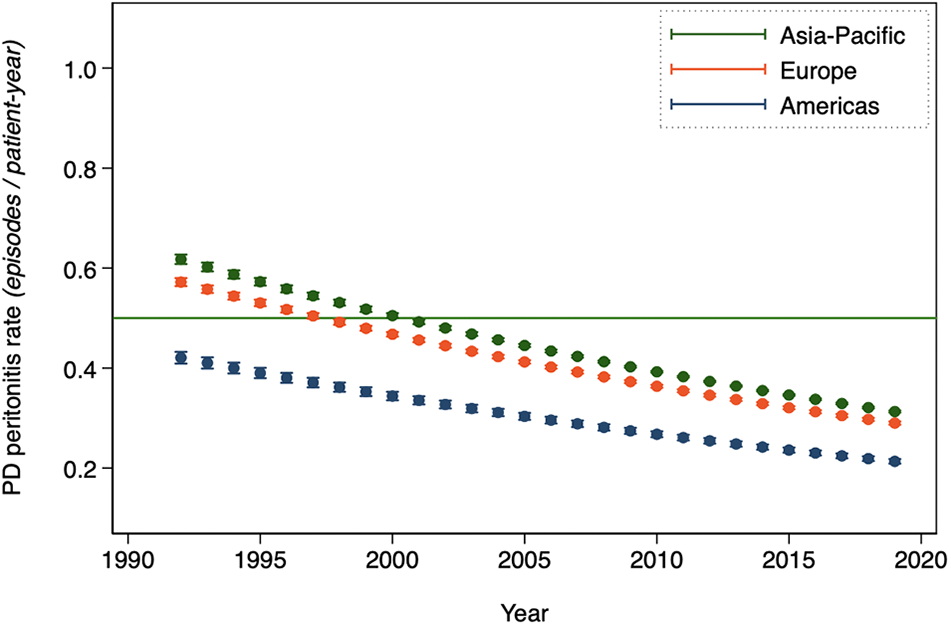
Annual mean PD-related peritonitis rates, as obtained by predicted margins from the random-effects Poisson model of aggregated registry data, by the continent in which the country is nested.
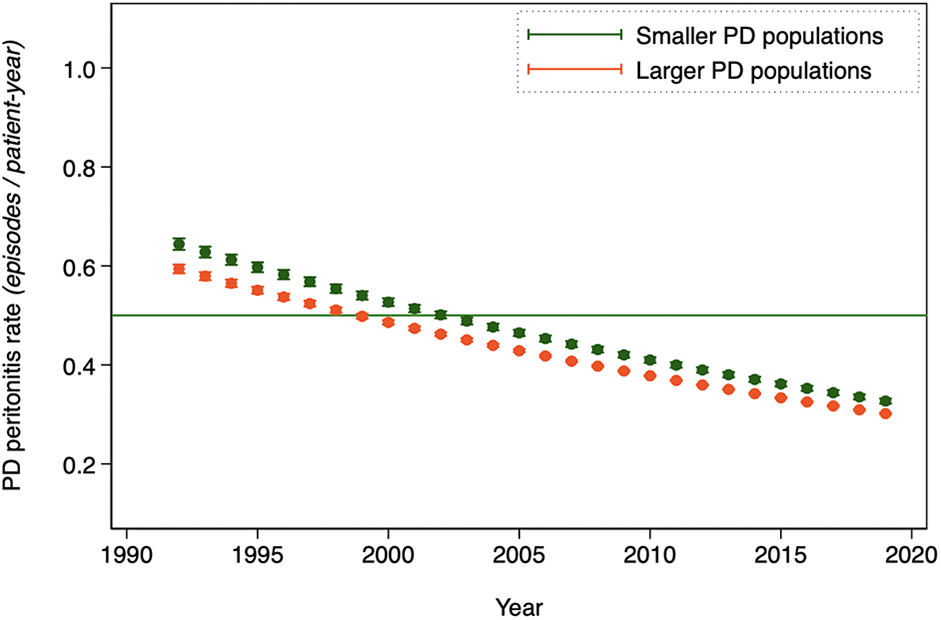
Annual mean PD-related peritonitis rates, as obtained by predicted margins from the random-effects Poisson model of aggregated registry data, by the size of the national PD population at risk (> median versus < median).
Discussion
There are four major insights from this study. The first is that PD peritonitis rates are decreasing with time. This is important since this condition is the very top patient-centred priority for care 11,12 and also a leading cause of death – in a recent review, approximately 2.5% of peritonitis episodes resulted in death and 4% of peritonitis patients died of their episode. 13 In the same review, PD peritonitis resulted in hospitalization in the large majority of cases, with patients averaging about 5 days in hospital. These figures probably underestimate burden of disease, since they do not account for delayed morbidity and mortality. 14 –17 Fortunately, this study suggests that PD peritonitis is becoming less frequent.
There are several possible explanations for this finding. Technology and technique have undoubtedly improved over time, culminating in the modern IDS set (i.e. disposable dialysate containers and the Y connector as a single set) 18 –22 and routine use of the ‘flush before fill’ technique. 21,23 –27 This is most likely responsible for improvements in the 1990s and 2000s. 28 –36 The reasons for the continuing improvement are less obvious. Improved adherence to evidence-based practice is possible underlying reason, 37 –42 resulting in progressively better trained staff, standardization of patient care and routine programmatic clinical quality initiatives. The issue of technology should not be back-burnered, however. PD transfer sets differ markedly between manufacturers, with studies consistently showing better elimination of potential bacterial contaminants by systems with controllers external to the flow path, rather than within the tubing. 43 A scoping systematic review by industry employees has shown that PD systems from different manufacturers have different PD peritonitis rates, 44 and this is a high priority for follow-through by independent investigators.
The second insight concerns the wide variation in PD peritonitis rates between countries. The proportion of this variation attributable to traditional risk factors is unknown, as this study lacks appropriate data for analysis. The ongoing Peritoneal Dialysis Outcomes and Practice Patterns Study is probably the best opportunity to cast light upon this variation and determine how much excess PD peritonitis is explained by the absence of known best practices. 45 Other analytic approaches may be useful to gain further knowledge, such as algorithmic techniques that identify the reason for outliers, as opposed to focusing on reasons for regression to the mean. 46 –48 With or without this further research, initiatives that can achieve programmatic excellence across borders are likely to be helpful, and consideration should be given to international clinical networks that can evaluate or credential member programmes.
The third insight is that only a minority of countries have a national monitoring system. This critical oversight affects some of the largest and most wealthy countries (e.g. the United States, the United Kingdom, Switzerland, etc.). This concern has been raised recently in a call to action for the United States. 37 A lack of information around peritonitis will fuel unreasonable biases against PD by those who have them, and will prevent consistent audit of programme results against accepted standards and national norms. This latter situation can lead to complacency around potentially preventable morbidity and mortality. The systems for national monitoring in this study comprised formal registries under government or special society provenance, clinical networks and commercial provider databases. A particular point of concern centres on the latter group. There is commercial sensitivity and regulatory consequences in the reporting of adverse events that can be related to devices sold by a company, and this is an impediment to data sharing. This is overcome in some health jurisdictions, such as is in Guatemala – several different commercial providers are required to submit their peritonitis rates to the Ministry of Health, who then pool the data reporting an overall peritonitis rate. Ironically, the performance of most commercial kidney-failure treatment service providers is excellent. Notwithstanding, contracts for the provision of commercial PD services should probably include reporting requirements for clinical metrics to an independent monitoring system, to allow for appropriate and transparent clinical quality control.
The final insight is that the current standard for PD peritonitis rate is probably somewhat high. The majority of studies in current literature report peritonitis rates of less than 0.5 episodes per patient-year at risk (1 episode/24 months), which is the highest acceptable rate suggested by the International Society for Peritoneal Dialysis (ISPD) guidelines. 1,2 This study confirms similar rates in registries as well. However, this does not mean that there are not opportunities to decrease PD peritonitis rates further. In the author’s own centre, where PD peritonitis rates have been traditonally somewhat high, the COVID-19 ‘lockdown’ and hypervigilant attention to masking and hand hygiene decreased rates by over 50% (Online Supplemental Table S4, personal communication from Dr Jamie Kendrick Jones and PD staff at Middlemore Hospital). These data suggest strongly that there is still an excess of preventable PD peritonitis in centres with ostensibly acceptable – but not excellent – PD peritonitis rates. A reduction in the highest acceptable rate suggested by the ISPD guidelines seems sensible to ensure that continued attention is given to the prevention of PD peritonitis.
This study has several important limitations. As described in the methods, no data were collected to assess risk of bias in the individual registries, which would be a fruitful future exercise. In addition, registries often do not contain extensive data about patient- and centre-related characteristics, and it was not possible to do a meaningful adjustment of PD peritonitis rates for these factors. Another limitation concerns the consistency of definitions used by registries to define peritonitis, either between registries or within registries over time. Concepts and classifications of relapsing, recurrent and repeat PD peritonitis were not well-established until recently, and their handling is likely to be particularly variable. The upshot of this is that some of the observed differences in PD peritonitis rates may reflect definitional differences rather than true differences. Finally, the comparison of registry data is subject to the ecological fallacy, where there is an incorrect assumption that statistical association observed between group-level variables is equal to the association between the corresponding variables at the individual level. This fallacy is perhaps most relevant to analyses exploring the potential relationship between a country’s macroeconomic indicators and their PD peritonitis rates. There are two implicit assumptions in such an analysis: first, that the PD patients are representative of the kidney failure source populations, and second that macroeconomic indicators track with PD programme funding and quality. Both assumptions should be validated before such an analysis is done in databases such as the one in this article.
Conclusion
PD peritonitis rate appears to be decreasing over time, although the presence and extent of this improvement varies from country to country. This study shows that there is an opportunity for better monitoring, research into underachieving and overachieving nations and development of international clinical support networks.
Supplemental material
Supplemental Material, sj-docx-1-ptd-10.1177_0896860821996096 - A systematic review of peritoneal dialysis-related peritonitis rates over time from national or regional population-based registries and databases
Supplemental Material, sj-docx-1-ptd-10.1177_0896860821996096 for A systematic review of peritoneal dialysis-related peritonitis rates over time from national or regional population-based registries and databases by Mark R Marshall in Peritoneal Dialysis International
Footnotes
Acknowledgements
The author thanks all of the contacts below, who assisted in obtaining data for this study. The author would also like to acknowledge Professor Vivek Jha for his help in connecting with key personnel in South Asia. Albania – Merita Rroji; Argentina – Roberto Barone, Alejandro Kohn – Tuli; Australia – Neil Boudville, Phil Clayton; Austria – Reinhard Kramar; Bangladesh – Harum-Ur-Rashid; Belarus – Kirill Komissarov; Belgium, Dutch sp. – Johan DeMeester; Belgium, French sp. – Frederic Collart, Christian Verger; Brazil – Thyago Moraes; Brunei – Chiao Yuen Lim; Bulgaria – Evgueniy Vazelov; Canada – Peter Blake, Philip McFarlane; Chile – Partricia Diaz; China – Yao Qiang; Columbia – Alfonso Bunch; Croatia – Dajana Katicic; Cuba – Raul Bohorques, Yanet Álvarez; Czech Republic – Ivan Rychlík; Cyprus – Kyriakos Ioannou; Denmark – Kristine Hommel; El Salvador – Ramón García-Trabanino; Estonia – Mai Rosenberg; Finland – Patrik Finne; France – Christian Verger, Thierry Lobbedez; Germany – Martin Wagner, Christoph Wanner; Guatemala – Peter Rohloff, Pablo Garcia; Hong Kong – Gary Wong; Hungary – György Reusz; Iceland – Margrét B Andrésdóttir, Runolfur Palsson; Indonesia – Lydia Aida, Ni Made Hustrini; Iran – Shahrzad Ossareh, Iraj Najafi; Iraq – Ala Sh. Ali, Hafez Elzein; Ireland – Austin Stack; Israel – Eli Golan; Italy – Maurizio Postorino, Poris Neri, Gianfranca Cabiddu; Japan – Hisonori Nariai; Kazakhstan – Abduzhapper Gaipov; Kuwait – Ali AlSahow; Latvia – Aivars Petersons, Ilze Puide; Lebanon – Ali Abu-Alfa; Lithuania – Marius Miglinas; North Macedonia – Nikola Gjorgjievski, Goce Spasovski; Malaysia – Sunita Bavanandan; Montenegro – Marina Mugosa Ratkovic; Mexico – Ramón Paniagua, Guillermo García-García; Morocco (including the Southern Provinces) – Tarik Sqalli Houssaini, Bahadi Abdelaali, Christian Verger; the Netherlands – Marc AGJ ten Dam, Tiny Hoekstra; New Zealand – Gerald Waters; Norway – Anders Åsberg; Oman – Issa Al Salmi, Adhra H Al Mawali; Poland – Andrzej Oko, Dorota Sikorska; Portugal – Ana Amelia Galvao; Qatar – Abdullah Hamad; Korea – Dong Ryeol Ryu; Romania – Liliana Garneata; Russia – Anton Andrusev; Saudi Arabia – Faissal AM Shaheen, Besher Al-Attar, Paul Follero, Dan Aldrin Santiago, Haron Ahmed; Scotland – Michaela Petrie, Jamie Traynor; Singapore – Sandra Lim; South Africa – Razeen Davids; Spain (Cataluña) – Jordi Comas Farnes, Emma Arcos Fuster, Jaune Tort Bardolet; Spain (Aragon) – Federico Eduar Arribas Monzon, Jose Maria Abad Diez; Spain (Valencia) – Miguel Gonzalez Rico, Óscar Zurriaga, Jose Luis Górriz; Spain (Navarra) – Joaquin Manrique Escola, Maria F Slon Roblero; Spain (Asturias) – Ramón Alonso de la Torre; Sri Lanka – Pubudu De Silva, Rezvi Sherrif, AKS de Alwis; Sweden – Helena Rydell, Maria Stendahl; Switzerland – Rebecca Winzeler; Taiwan – JinBor Chen; Thailand – Noppakun Thammatacharee; Turkey – Nurhan Seyahi; United Kingdom – Martin Wilkie; United States – Kimberly Nieman; Ukraine – Maxim Malasayev; Uruguay – Liliana Gadola. The author is especially grateful given the timing of his requests during the difficult year of 2020.
Declaration of conflicting interests
The author(s) declared the following potential conflicts of interest with respect to the research, authorship and/or publication of this article: In addition to his affiliated employers, MRM is currently supported by the Health Research Council of New Zealand. In the past, he has been a contractor and employee for Baxter Healthcare (Asia) Pte Ltd and has been a contractor for Fresenius Medical Care Asia Pacific Ltd.
Ethical approval
Not applicable.
Funding
The author(s) received no financial support for the research, authorship and/or publication of this article.
Informed consent
Not applicable.
Supplemental material
Supplemental material for this article is available online.
Trial registration
Not applicable.
References
Supplementary Material
Please find the following supplemental material available below.
For Open Access articles published under a Creative Commons License, all supplemental material carries the same license as the article it is associated with.
For non-Open Access articles published, all supplemental material carries a non-exclusive license, and permission requests for re-use of supplemental material or any part of supplemental material shall be sent directly to the copyright owner as specified in the copyright notice associated with the article.