
Abstract
Background:
Peritoneal fibrosis (PF) is a common complication of peritoneal dialysis (PD), but a specific and sensitive biomarker for PF is lacking. The present study aimed to determine the use of effluent decoy receptor 2 (eDcR2) as a biomarker for PF in PD patients.
Methods:
PD patients (n = 248) were recruited, and peritoneal specimens were collected at PD initiation (n = 30) and cessation (n = 33). Enzyme-linked immunoassay was used to measure eDcR2 and the eDcR2 appearance rate (eDcR2-AR) was calculated. The levels of DcR2 mRNA and protein were determined. The correlation of eDcR2 level with peritoneal function, histological parameters and DcR2 expression were analysed. Receiver operating characteristic (ROC) analysis was used to assess the diagnostic performance of eDcR2 for PF, which was defined as a submesothelial thickness 150 µm or more. Co-localisation of DcR2 with a mesothelial marker, fibroblast markers and fibrotic markers were determined.
Results:
The eDcR2-AR level correlated with PD duration, D/P Cr values, peritoneal Kt/V and peritoneal injury scores, especially submesothelial thickness (r = 0.638, p < 0.001). DcR2 was primarily expressed in peritoneal fibroblasts, and co-localised with α-SMA, vimentin, collagen I and fibronectin, but not with E-cadherin. Peritoneal DcR2 expression had a positive correlation with eDcR2-AR. ROC analysis indicated eDcR2 had an area under the curve of 0.907 for detection of PF (sensitivity: 78.6%, specificity: 100%) and the best cut-off value was 392.5 pg/min.
Conclusion:
The eDcR2-AR level is a potential biomarker for assessing PF in PD patients. Effluent DcR2 was mainly derived from peritoneal fibroblasts and DcR2-positive cells may accelerate PF, suggesting that it may be a potential therapeutic target.
Introduction
Peritoneal dialysis (PD) is a common form of kidney replacement therapy used for patients with end-stage renal disease (ESRD). The main advantages of PD for treatment of ESRD are that it can preserve residual kidney function while maintaining high quality of life. 1 However, long-term PD treatment is accompanied by histopathological and functional alterations in the peritoneum. The pathogenesis of peritoneal injury is due to a combination of bioincompatible factors in the dialysate, including high levels of glucose and advanced glycation products, and high osmolality, which lead to the induction of inflammation. 2 –5 The main characteristics of chronic peritoneal injury include loss of mesothelial cells, submesothelial thickness, accumulation of extracellular matrix and neoangiogenesis, which ultimately lead to ultrafiltration failure (UFF). 4,6 Therefore, it is necessary to explore effective methods for the early assessment of peritoneal injury and dysfunction.
Peritoneal biopsy is the gold standard for detection of histopathological changes in the peritoneum. 6 However, this procedure is invasive and does not allow dynamic monitoring of the progression of peritoneal lesions. A non-invasive biomarker present in PD effluent would be clinically useful for evaluating peritoneal injury. Cancer antigen 125 (CA125) is a widely used effluent marker, and previous studies used it as a marker of mesothelial cell mass in PD patients. 7,8 However, CA125 alone is not useful for assessment of other peritoneal damage, such as peritoneal fibrosis (PF), which is closely related to peritoneal UFF. In addition, peritoneal damage is associated with high expression of matrix metalloproteinase-2 (MMP-2), connective tissue growth factor (CTGF) and pentraxin 3, but these markers are not specific for peritoneal injury, especially PF. 9 –11
Decoy receptor 2 (DcR2) is a transmembrane receptor of tumour necrosis factor-related apoptosis-inducing ligand that belongs to the tumour necrosis factor receptor superfamily. 12 DcR2 has high expression in tumours and is associated with resistance to apoptosis. There is also evidence that expression of DcR2 correlates with the degree of tumour differentiation and prognosis. 13,14 A recent study found that DcR2 had high expression in fibroblasts and was associated with accelerated liver fibrosis, and a subsequent study reported that antagonising DcR2 can inhibit liver fibrosis. 15 Our recent studies confirmed that DcR2 was associated with kidney fibrosis and promoted the progression of kidney fibrosis. 16,17 In this study, we investigated the expression of DcR2 in the peritoneal tissues of PD patients and examined the possible role of DcR2 in the development of PF.
Researchers regard DcR2 as an indicator of cell senescence, and because its ectodomain is shearable, it can be easily detected in body fluids. 18,19 In fact, Sanchez-Lazaro et al. and our previous studies confirmed that the extracellular segment of DcR2 was detectable in serum and urine. 17,20,21 Our previous studies showed that urinary DcR2 could be used as a novel biomarker for evaluation senescent tubular cells and kidney interstitial injury in patients with chronic kidney diseases. 17,22 However, the association of the level of effluent DcR2 (eDcR2) with peritoneal damage is currently unknown.
In this study, we measured the eDcR2 levels of PD patients and analysed the correlation of eDcR2 level with peritoneal functional and histological parameters. Additionally, we estimated the value of eDcR2 for detection of PF. Finally, we measured the expression and localisation of DcR2 in the peritoneum and assessed the potential function of DcR2-positive cells in the development of PF.
Materials and methods
Patient characteristics
A total of 248 patients who were receiving continuous ambulatory peritoneal dialysis (CAPD) were enrolled from the Department of Nephrology of Daping Hospital (Chongqing, P.R. China) between January 2012 and December 2018. The PD fluid was mainly acidic (pH 5.2), low calcium (1.25 mmol/L) and contained 1.5% glucose (Baxter). All patients received CAPD for at least 6 months, were free from peritonitis during the 3 months preceding enrolment and had no other diseases, such as malignancy, liver disease or heart disease. None of the patients received PD combined with haemodialysis.
Peritoneal specimens were obtained from 30 patients at initiation of PD (pre-PD peritoneum) and 33 patients at the cessation of PD, who transferred to haemodialysis due to PD-related problems (e.g. UFF) or received transplantation (PD peritoneum). These patients received CAPD with low calcium and 1.5% glucose (Baxter).
The study protocol was approved by the Ethical and Protocol Review Committee of the Army Medical University, and each participant signed a written informed consent agreement.
Peritoneal equilibration test (PET), Kt/V urea, and peritoneal effluent sample collection
Peritoneal solute transport was assessed using the peritoneal equilibration test (PET), which was performed using 2000 mL peritoneal dialysate that contained 2.5% glucose after a 4 h dwell time, as described previously. 7 The dialysate to plasma (D/P) creatinine values of the PET results were obtained at 6 months after catheter insertion or within 6 months before catheter removal. 11 Serum and effluent creatinine levels were determined using an automatic biochemistry analyser (Beckman Coulter Unicel DXC 800). The peritoneal transport status was classified as low, low average, high and high average-transport based on the D/P creatinine values at 4 h. Dialysis adequacy was based on urea clearance, adjusted for total body volume (Kt/V urea). Total Kt/V urea and peritoneal Kt/V urea were calculated based on 24-h urine and dialysate collection using PD Adequest software (Baxter Healthcare). Peritoneal effluent, with a dwell time of more than 8 h overnight, was collected at 6 months after catheter insertion (pre-PD group) or within 6 months before catheter removal (PD group). The samples were centrifuged and stored at −80°C prior to analysis.
Glucose exposure
The cumulative and average annual glucose exposure was calculated as described previously. 23 For example, for an individual using 4 × 2 L exchange (3 × 1.5%, 1 × 2.5%), the product of the volume and the glucose concentration for each exchange would be 90 + 50 = 140 g glucose/day, which is equivalent to 4200 g/month and 51,100 g/year.
Measurement of effluent DcR2 and calculation of appearance rate
Effluent DcR2 (eDcR2) levels were measured using a specific enzyme-linked immunoassay (ELISA) kit (ab46017; Abcam, Cambridge, UK) as described previously. 17,21 The minimum detectable dose of this kit was 64 pg/mL. The samples were first diluted (1:4), and the procedures were then conducted according to the manufacturer’s instructions. The total coefficient of variation for this determination was 3.7–9.6%. To account for the influence of dwell time and volume of effluent, the appearance rate (AR) of eDcR2 was calculated. 7 The eDcR2-AR was defined as the level of eDcR2 in the total drained effluent (mL) divided by the dwell time (min):
eDcR2-AR = (eDcR2 level
Peritoneal biopsy and histological analysis
Parietal peritoneum samples were obtained using a standard method, as reported previously. 6,24 The tissue was fixed with 4% paraformaldehyde solution and then stained with haematoxylin and eosin and Masson’s trichrome. Mesothelial cell coverage was assigned a level of 0 to 6, as described by Schaefer et al. 25 The degree of PF was determined from the thickness of the submesothelial compact zone (a submesothelial interstitial layer between the mesothelial surface and the upper border of the peritoneal adipose tissue). 24 Five regions were randomly selected for measurement using microscopy (Leica, Germany), and mean thickness was calculated. PF was defined as a submesothelial compact zone that was more than 150 µm, as described previously. 26 The blood vessel density was measured using Image J software according to previous studies. 27 For these measurements, the total number of sectioned blood vessels (capillaries, postcapillary venules and venules) within the compact zone was counted, and then this number was divided by total compact zone area (mm2) and mesothelial surface length (mm). Acute inflammation (neutrophils/HPF) was scored as 0 (absent), 1 (1/HPF), 2 (2–5/HPF) or 3 (>5/HPF). Chronic inflammation (round cells/HPF) was scored as 0 (absent), 1 (1–5/HPF), 2 (6–20/HPF) or 3 (>20/HPF). 28 Vasculopathy was scored as 0 (no hyalinising vasculopathy), 1 (subendothelial hyaline material < 7 µm thick), 2 (subendothelial hyaline material > 7 µm thick without luminal distortion or narrowing), 3 (luminal distortion or narrowing) or 4 (luminal obliteration). 26,29
IHC and immunofluorescence staining
Peritoneal DcR2 (ab108412; Abcam, Cambridge, UK) was detected using a two-step immunohistochemical staining technique as previous described. 16,17 The sections were deparaffinised and rehydrated. Following antigen retrieval, the sections were incubated with an anti-DcR2 antibody at 4°C overnight. Ten fields (200×) were randomly selected for measurement of the percentage of positive staining using Image J software. All sections were evaluated by two pathologists who were blinded to group allocations.
For immunofluorescence staining, tissue sections were incubated with an anti-DcR2 antibody, followed by Alexa-555-conjugated goat anti-rabbit antibody (ab150078; Abcam), mouse anti-vimentin (ab8978; Abcam), anti-α-SMA (BM0002, Boster, Wuhan, China), anti-collagen I (ab6308; Abcam) and anti-fibronectin (ab6328; Abcam), followed by Alexa-488-conjugated goat anti-mouse antibody (ab150117; Abcam) at 4°C overnight. Nuclei were stained with 4, 6-diamidino-2-phenylindole (C1006; Biyuntian Biotechnology, Shanghai, China). Images were detected using laser scanning confocal microscopy (Leica, Germany).
In situ hybridisation
Peritoneal tissue was fixed with a 4% paraformaldehyde solution containing diethyl pyrocarbonate (DEPC). In situ hybridisation (ISH) was then used to detect DcR2 mRNA using a commercial kit (MK1828, Boster, Wuhan, China) as previously described. 10 Counterstaining with haematoxylin was not performed.
Statistical analysis
Variables with normal distributions were presented as means ± standard deviation (SDs) and those with non-normal distributions were expressed as medians (interquartile ranges). Between-group differences were assessed using analysis of variance, followed by Bonferroni correction (for variables with normal distributions) or the Kruskal–Wallis test (for variables with nonparametric distributions). Correlations were assessed for normally distributed variables (Pearson’s correlation) and non-normally distributed and rank variables (Spearman correlation). Receiver operating characteristic (ROC) analysis was performed to calculate the area under the curve (AUC) for eDcR2 and to identify the best cut-off value for detection of PF. All statistical analyses were conducted with SPSS version 18.0 (SPSS, Chicago, Illinois, USA). A p value less than 0.05 was considered significant.
Results
Level of DcR2 in peritoneal effluent
We recorded the baseline demographic and clinical characteristics of 248 PD patients (Supplementary Table S1). The mean concentration of eDcR2 was 113.4 pg/mL (SD: 38.9) and the median eDcR2-AR (based on dwell time and effluent volume) was 356.6 pg/min (IQR: 289.6, 438.1). In addition, analysis of the eDcR2 level indicated a greater level in diabetic nephropathy (DN) group (423.8 ± 65.4 vs. 373.7 ± 59.1 pg/min), but the difference was not statistically significant.
Correlation of effluent DcR2 with clinical parameters
We next analysed the correlation of eDcR2 and eDcR2-AR with different clinical parameters (Table 1). The eDcR2-AR level was significantly correlated with age, PD duration, glucose exposure, D/P Cr (4 h) and peritoneal Kt/V. However, eDcR2 had no correlation with these parameters. These results suggest that eDcR2-AR could be used as a potential biomarker for peritoneal transport function and dialysis adequacy in PD patients.
Correlation of eDcR2 level with clinical parameters (n = 248).
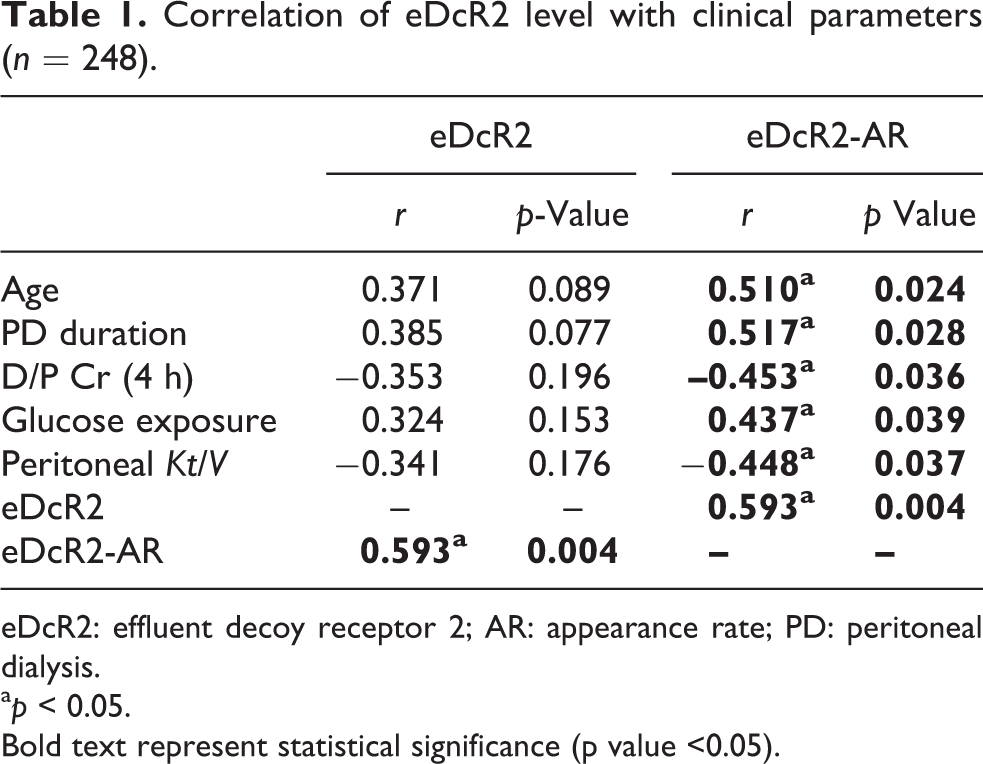
eDcR2: effluent decoy receptor 2; AR: appearance rate; PD: peritoneal dialysis.
a p < 0.05.
Bold text represent statistical significance (p value <0.05).
Correlation of eDcR2-AR level and peritoneal injury parameters
We collected peritoneal specimens from 63 patients and analysed the clinical characteristics and histological parameters (Supplementary Table S2). To study the correlation of eDcR2-AR with PD-related peritoneal injury, we performed subgroup analysis of all patients undergoing peritoneal biopsy. The results (Table 2) showed that eDcR2-AR correlated with submesothelial thickness in pre-PD patients (n = 30). In PD patients (n = 33), the eDcR2-AR level strongly correlated with submesothelial thickness, chronic inflammation and vasculopathy scores. These results suggested that eDcR2-AR may be useful for evaluation of peritoneal injury, particularly submesothelial thickness.
Correlation of eDcR2-AR with different parameters of peritoneal damage.
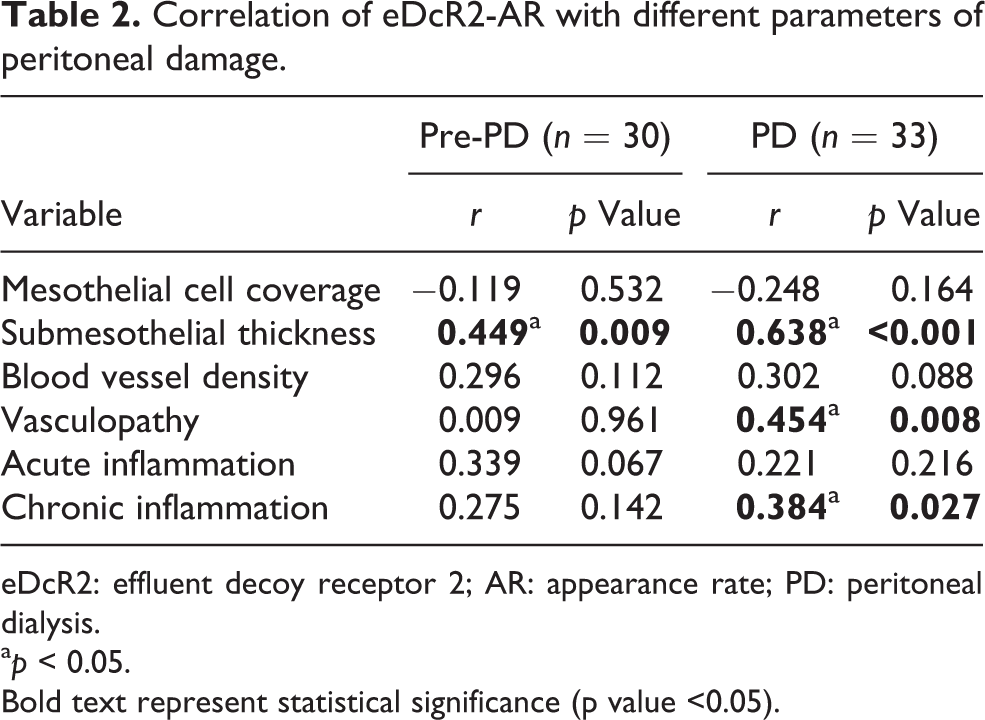
eDcR2: effluent decoy receptor 2; AR: appearance rate; PD: peritoneal dialysis.
a p < 0.05.
Bold text represent statistical significance (p value <0.05).
Localisation of DcR2 mRNA and protein in the peritoneum
To determine whether eDcR2 was released from the peritoneum, we conducted immunohistochemistry (IHC) and ISH staining for DcR2. ISH analysis showed that DcR2 mRNA was expressed in the submesothelial zone, mainly in fibroblast-like cells (Figure 1(a)). The IHC results were similar, in that DcR2 protein was mainly expressed in fibroblast-like cells, but not in mesothelial cells or vascular cells (Figure 1(b)). In addition, the percentage of DcR2-positive area was greater in PD patients than in Pre-PD patients (Figure 1(c)).
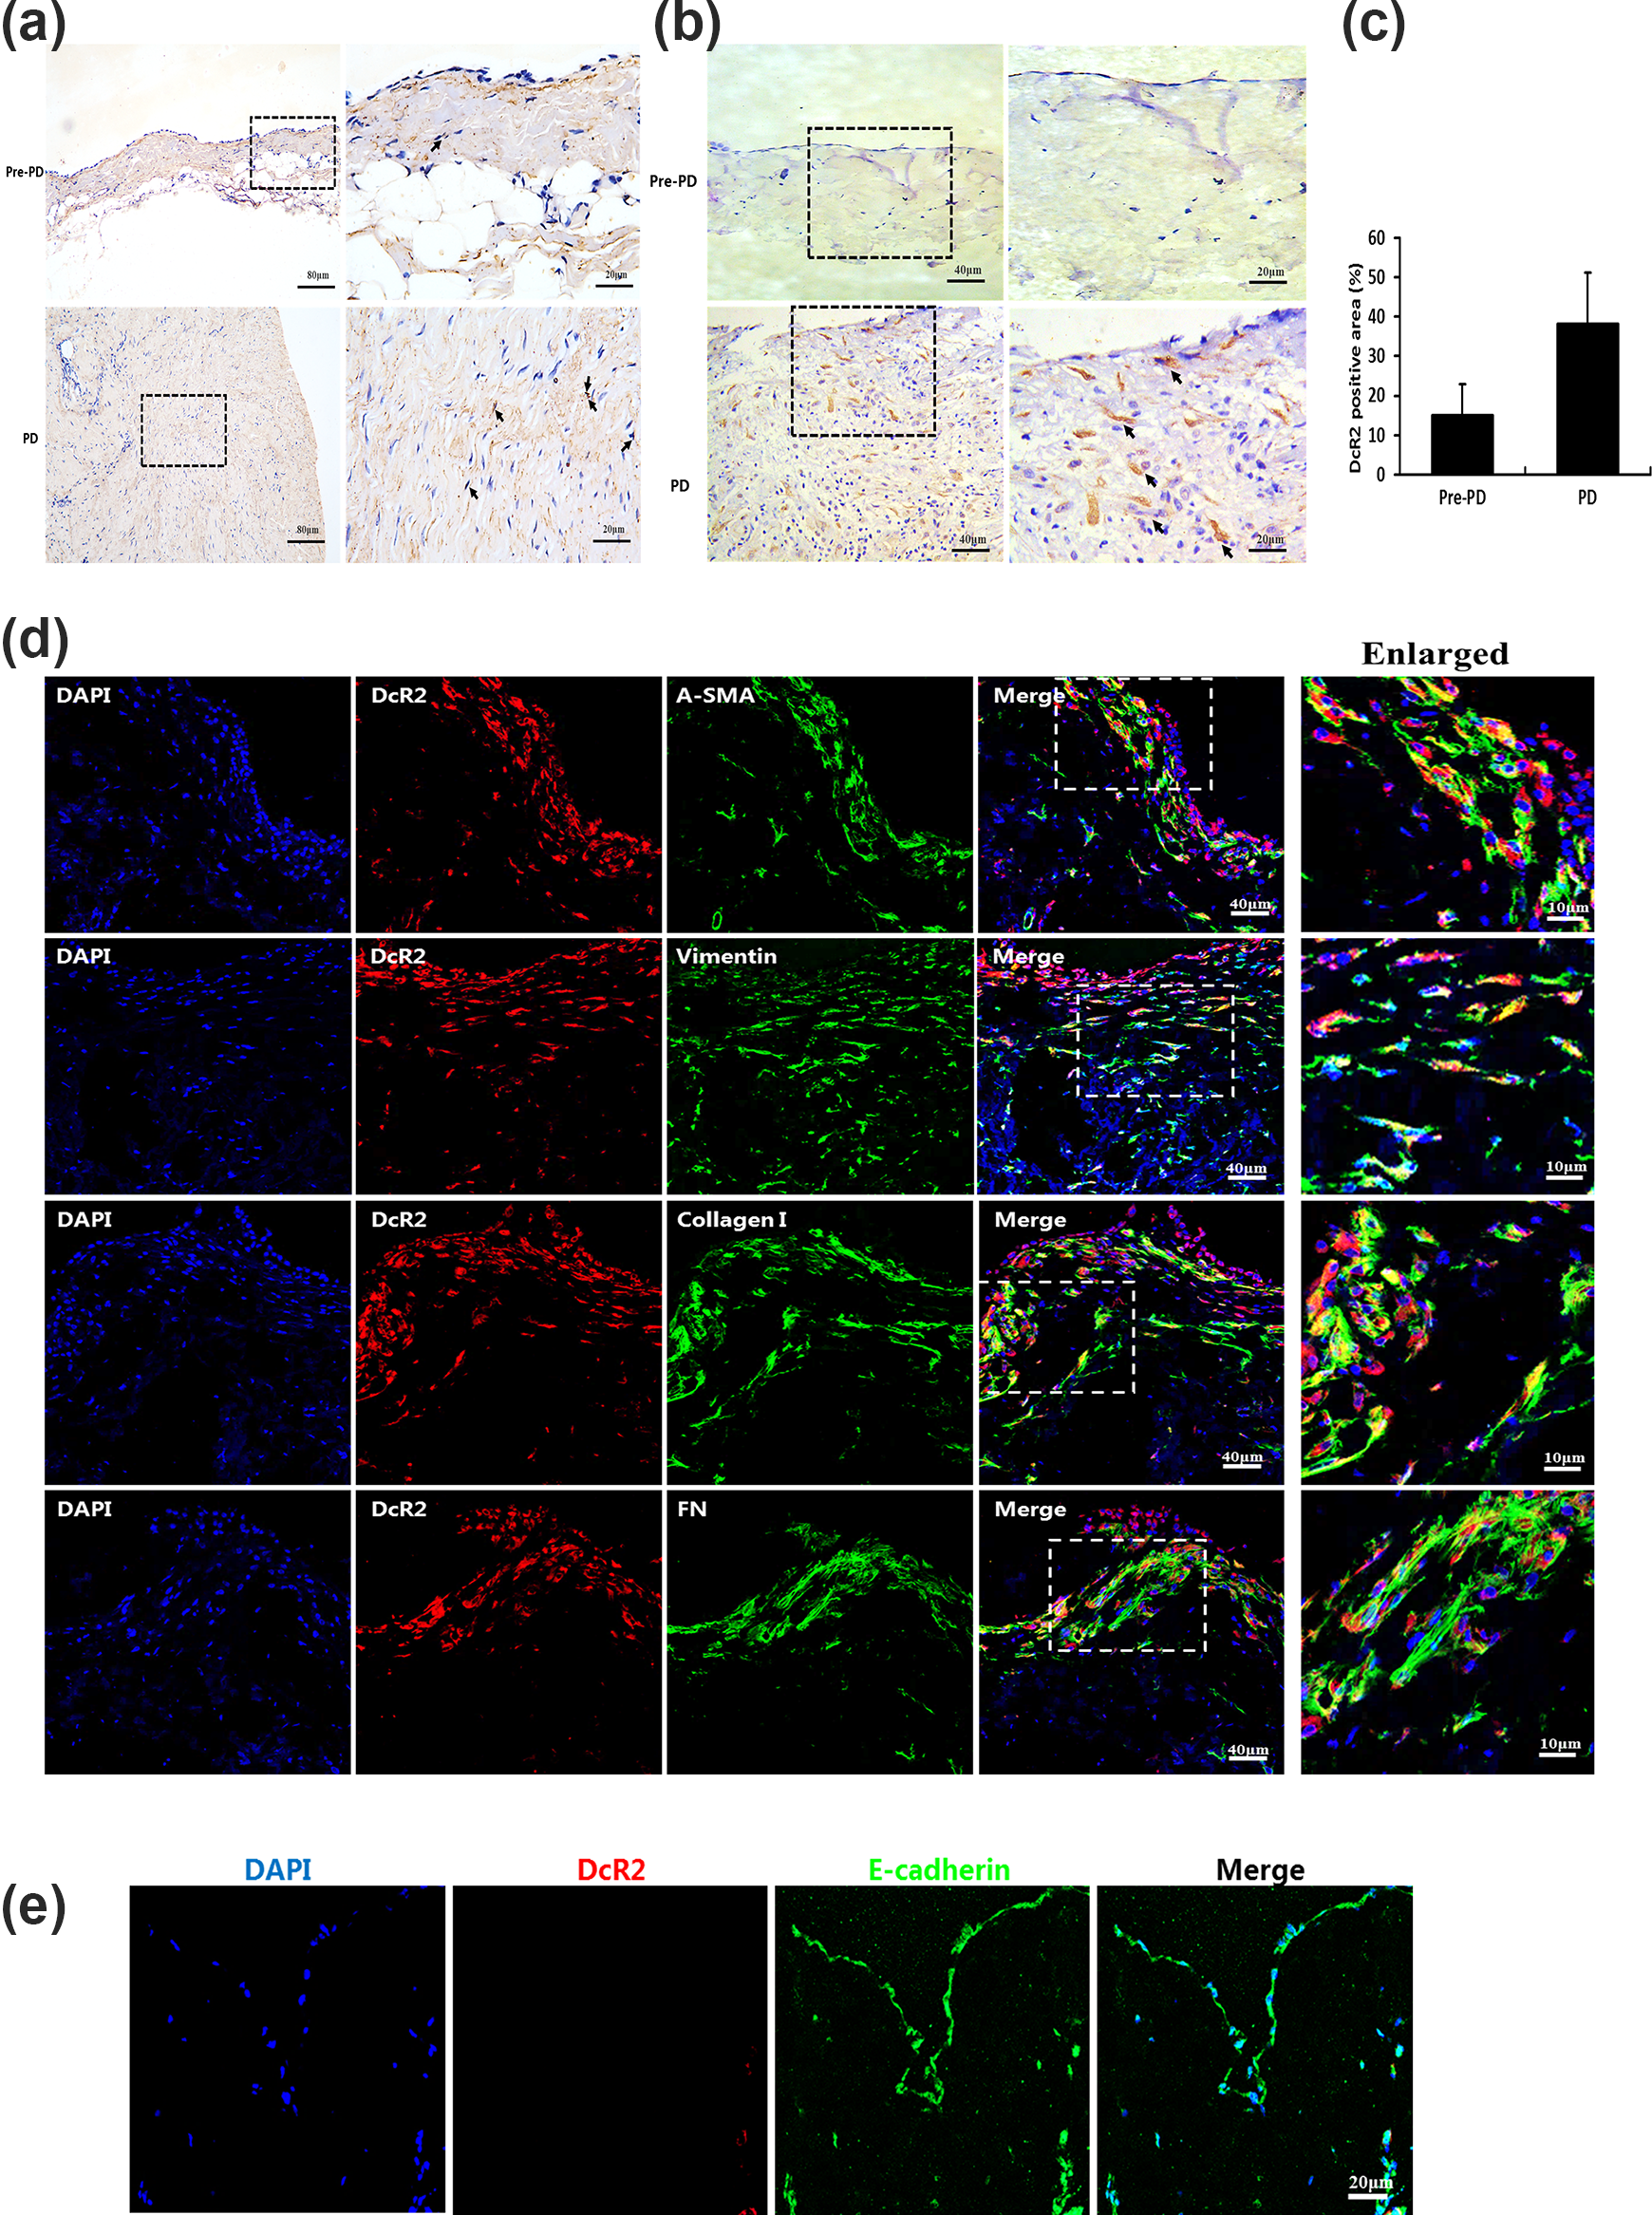
(a–b) Localisation of DcR2 mRNA (ISH) and DcR2 protein (IHC) in the peritoneum of pre-PD (n = 30) and PD patients (n = 33) (a–b). C: Percentage of DcR2-positive area (*p < 0.05 for PD vs. pre-PD), with arrows representing positive signals. (d–e) Double immunofluorescence assay for DcR2 with fibroblast markers (α-SMA, vimentin, collagen I and FN) in PD patients and with a mesothelial marker (E-cadherin) in pre-PD patients. Nuclei were stained with 4, 6-diamidino-2-phenylindole. DcR2: decoy receptor 2; PD: peritoneal dialysis; ISH: in situ hybridisation; IHC: immunohistochemistry.
A co-localisation analysis showed DcR2 co-localised with mesenchymal markers vimentin and a-smooth muscle actin (a-SMA), but not with a mesothelial marker (E-cadherin). These findings suggested that DcR2-positive cells may have a mesenchymal-like phenotype, an important origin of fibroblasts. The production of collagens is also regarded as a hallmark of fibrogenic cells. 30,31 Figure 1(d) showed that DcR2-positive cells co-localised with collagen I and fibronectin (FN) (fibroblast and fibrotic markers). The above results indicated that DcR2 was mainly expressed in peritoneal fibroblasts and suggested that DcR2 may accelerate PF in PD patients.
Correlation of peritoneal DcR2 expression and eDcR2-AR level
Previous studies confirmed that the ectodomain of DcR2 was shearable and could be detected in fluid samples, 17,20,22 and that eDcR2 levels can be measured in PD patients. To determine the source of the eDcR2, we separately analysed the correlation of eDcR2-AR with peritoneal DcR2 in the pre-PD and PD subgroups. In the pre-PD subgroup, the peritoneal DcR2 level correlated with effluent DcR2-AR level (Figure 2(a)), suggesting that underlying disease (CKD5) affects the level of peritoneal DcR2. In the PD subgroup, the correlation coefficient between peritoneal DcR2 and effluent DcR2-AR (r = 0.638, p < 0.001) was higher than that in the pre-PD subgroup. The results suggested that eDcR2-AR directly reflects the peritoneal expression of DcR2, and that long-term PD treatment promotes the expression of peritoneal DcR2.
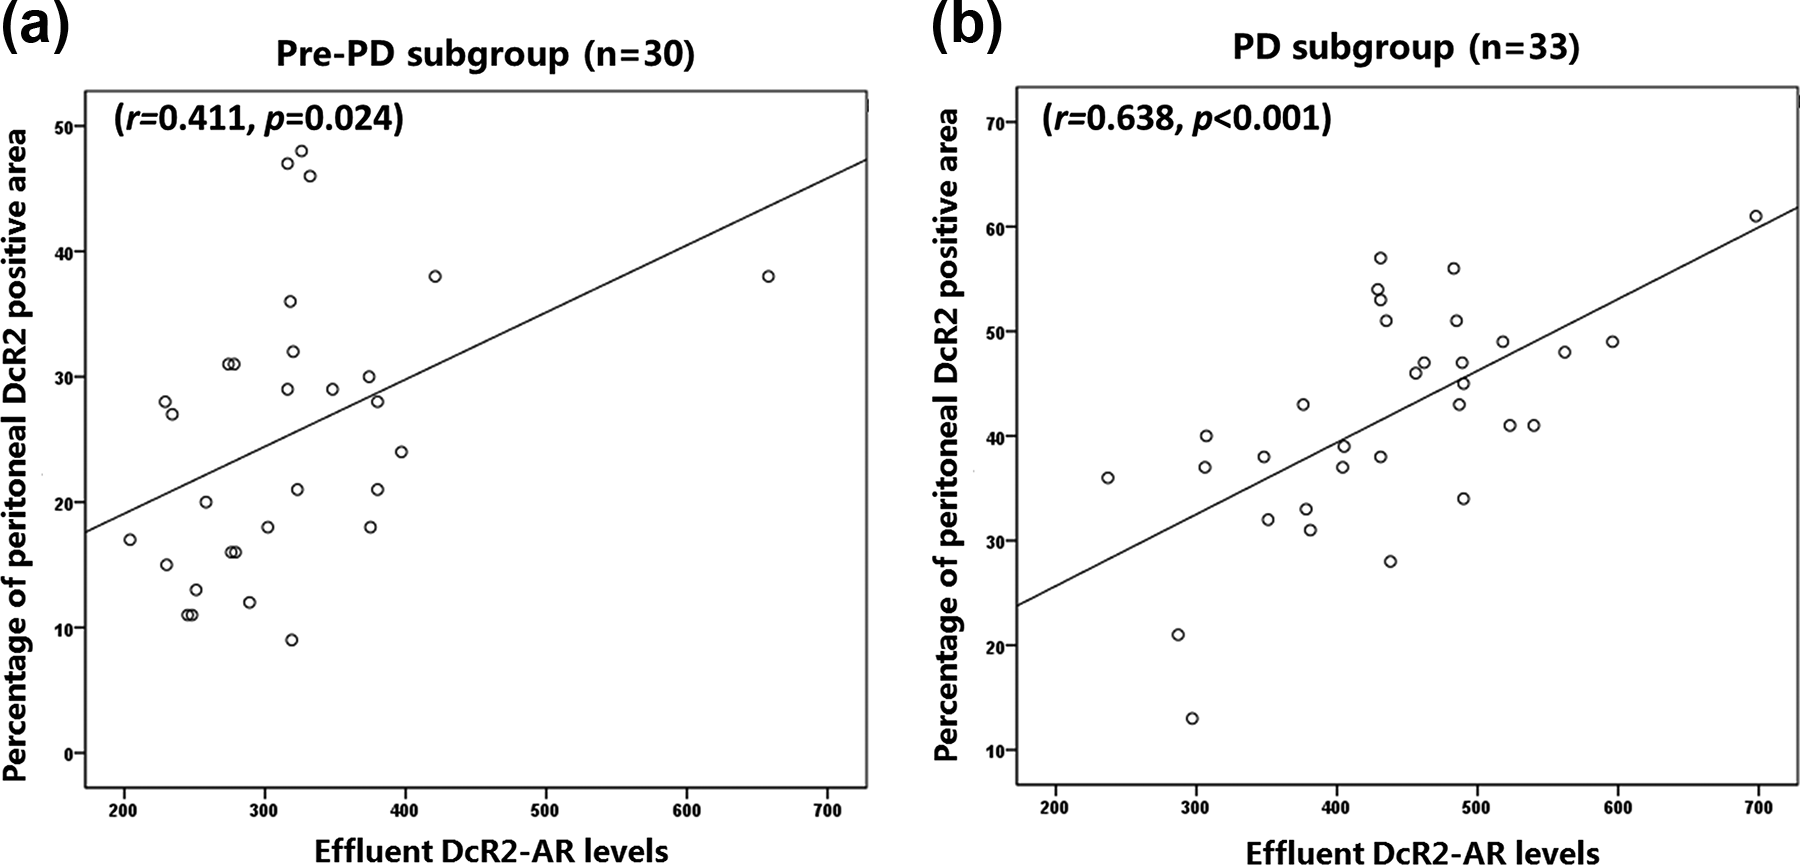
Correlation of eDcR2-AR level with the percentage of peritoneal DcR2-positive area in pre-PD (a) and PD patients (b), respectively. eDcR2: effluent decoy receptor 2; AR: appearance rate; PD: peritoneal dialysis.
ROC analysis of eDcR2-AR for assessing PF in PD patients
We classified PD patients into two groups based on the presence (n = 28) or absence (n = 5) of PF (submesothelial thickness > 150 um), 26 and then performed ROC analysis using eDcR2-AR measurements (Figure 3). These results showed that eDcR2-AR effectively distinguished these two groups, with an AUC of 0.907 (95% confidence interval: 0.800, 1.000, p < 0.001). The eDcR2-AR had a sensitivity of 78.6% and a specificity of 100%, and the best cut-off value was 392.5 pg/min. These results indicated that eDcR2-AR has potential for use as a biomarker for assessing PF in patients undergoing PD.
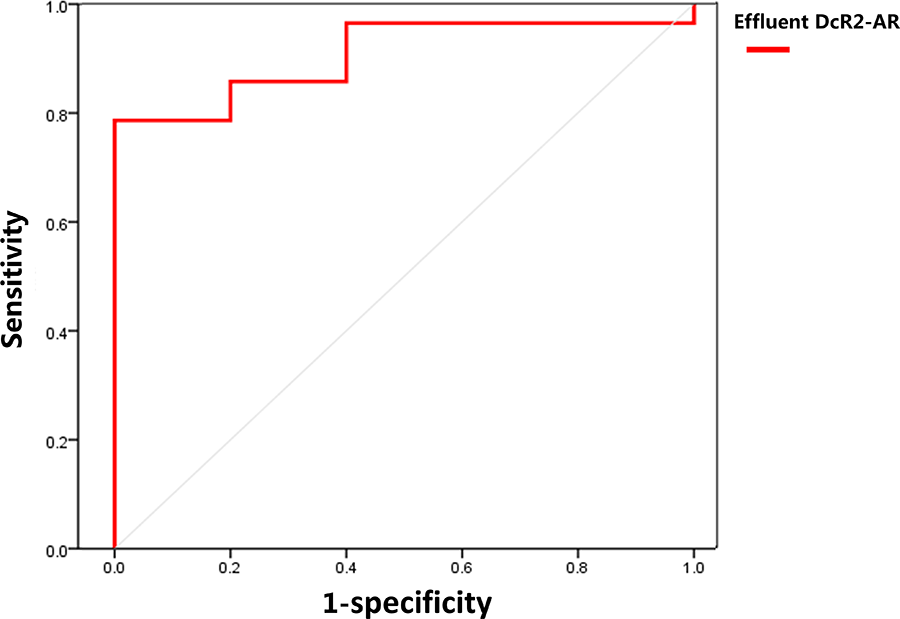
ROC analysis of eDcR2-AR for detection of peritoneal fibrosis in patients undergoing PD (n = 33). AUC = 0.907 (95% CI: 0.800, 1.000, p < 0.001), sensitivity = 78.6%, specificity = 100%, optimal cut-off value = 392.5 pg/min. eDcR2: effluent decoy receptor 2; AR: appearance rate; PD: peritoneal dialysis; CI: confidence interval; ROC: receiver operating characteristic; AUC: area under the curve.
Discussion
PF is a major reason for peritoneal UFF because long-term exposure of the peritoneum to bioincompatible PD fluid. 32 In the present study, we found that eDcR2-AR was associated with peritoneal dysfunction and submesothelial thickness. In addition, we found that eDcR2 was mainly derived from the peritoneal fibroblasts and eDcR2-AR was a non-invasive biomarker with a high sensitivity and specificity for identification of PF in PD patients.
Previous research confirmed that the extracelluar segment of DcR2 was sheared and detectable in biological fluids. 20 This study found that eDcR2 can also be detected in effluent using ELISA, an extension of our previous research which reported the presence of eDcR2 in urine. 17,21,22 Our results also indicated that eDcR2-AR level was associated with PD duration, peritoneal Kt/V and D/P Cr value. These results suggest eDcR2-AR is useful for assessing peritoneal function, especially transport characteristics and dialysis adequacy. In addition, eDcR2-AR level was positively correlated with age, possibly because DcR2 was a marker of senescence. 18,19 Age-related senescence affected the kidney expression of DcR2, 33 and therefore may also affect the extracellular segment of DcR2 levels in body fluids.
The pathological alterations of the peritoneum, including loss of mesothelial cells, submesothelial thickening (variously described as fibrosis or sclerosis), inflammation, change of blood vessel density, and vasculopathy, generally occurred in patients receiving long-term PD. 6 However, subgroup analysis found that eDcR2-AR level correlated with submesothelial thickness in pre-PD patients. Previous studies found that submesothelial thickness increased with age from infancy to mid-childhood, but was lower in healthy adults. 25 Williams et al. studied adults with CKD5 and demonstrated a significantly thicker submesothelial compact zone compared with normal individuals. 26 These findings indicate that uraemia itself may induce changes in the peritoneal membranes of patients before they commence PD. 26 Therefore, the peritoneum of adults with CKD5 has a certain degree of thickening, and this may promote the expression and secretion of peritoneal DcR2. Additionally, the eDcR2-AR level strongly correlated with submesothelial thickness in PD patients, and the correlation coefficient was higher than in pre-PD patients. Once this thickness exceeded 150 µm, it is defined as PF. 26 A thicker submesothelial compact zone indicates more serious PF. The average duration of PD in our patients was approximately 45 months, and this was one of the most critical factors contributing to PF. These findings suggested that eDcR2-AR could be used to assess PF in patients undergoing PD.
To determine the source of eDcR2, we measured the expression of DcR2 mRNA and protein in the peritoneum. The results indicated that DcR2 protein and mRNA were highly expressed in the submesothelial zone of the thickened peritoneum, mainly in fibroblast-like cells. Subsequent results showed that DcR2 co-localised with α-SMA, vimentin, collagen I and fibronectin (fibroblast markers), but not with E-cadherin (a mesothelial cell marker). This indicated DcR2 was mainly expressed in the peritoneal fibroblasts. A previous study found that DcR2 had higher expression in senescent cells, including senescent fibroblasts. 15 However, there are remaining controversies about the role of fibroblast senescence in tissue fibrosis. Some studies suggested that senescent fibroblasts had decreased synthesis of collagen and increased secretion of MMPs, and that this promoted skin aging. 34 Other studies concluded that senescent fibroblasts accelerated fibrosis by secretion of senescence-associated secretory phenotype. 35 In the present study, we found that collagen I and fibronectin accumulated around DcR2-positive fibroblasts in the thickened peritoneum, suggesting that DcR2 may drive the progression of PF. Moreover, although peritoneal DcR2 positively correlated with eDcR2-AR in pre-PD and PD patients, the correlation coefficient in PD patients was much greater. These results suggested that long-term PD treatment further promotes the expression of peritoneal DcR2, and that eDcR2 directly reflects peritoneal DcR2 expression.
Although previous researchers examined the use of many non-invasive biomarkers to assess peritoneal injury, a specific marker is still lacking. For example, Cheema et al. used effluent CA125 as a biomarker for evaluating the integrity of peritoneal mesothelial cells 8 and Mizutani et al. used CTGF as a biomarker for mesothelial and PF. 10 Other researchers reported that MMP-2, plasminogen activator inhibitor 1 and CCL18 levels were associated with peritoneal membrane function, but did not report pathological data on PF. 9,36,37 In the present study, ROC analysis indicated that eDcR2-AR detected PF with a high sensitivity and specificity, suggesting that eDcR2-AR could be an effective biomarker for assessing PF in PD patients.
This study has some limitations. First, this is a single-centre cross-sectional study, and there may have been bias in data collection and analysis; whether eDcR2-AR levels can accurately evaluate PF of PD patients requires a multicentre follow-up study. Second, the matrix in the dialysate fluids, especially the high concentration of glucose, had a certain impact on the DcR2 level determined by ELISA, and this could have led to a bias. In addition, there is not a universally accepted precise of definition of PF. We used the thickness of the submesothelial contact zone to evaluate fibrosis, but this measurement does not necessarily reflect the functionally relevant area. Despite these limitations, this study provides important new regarding eDcR2-AR as an indicator of PF that has high sensitivity and specificity in PD patients. Therefore, these limitations do not reduce the potential clinical utility of eDcR2-AR for non-invasive assessments of PF.
In summary, our results indicated that eDcR2-AR has potential for use as a novel, sensitive and specific biomarker for assessing PF in patients undergoing PD. We found that eDcR2 was mainly derived from peritoneal fibroblasts and that DcR2-positve cells apparently accelerated PF. Further studies are required to clarify the role of DcR2 in PF at the molecular level and the potential use of DcR2 as a therapeutic target for treatment of PF.
Supplemental material
Supplemental Material, sj-docx-1-ptd-10.1177_08968608211067866 - Effluent decoy receptor 2 as a novel biomarker of peritoneal fibrosis in peritoneal dialysis patients
Supplemental Material, sj-docx-1-ptd-10.1177_08968608211067866 for Effluent decoy receptor 2 as a novel biomarker of peritoneal fibrosis in peritoneal dialysis patients by Jie Yang, Mingyu Cai, Jinfang Wan, Liming Wang, Jia Luo, Xue Li, Wenjiang Gong, Yani He and Jia Chen in Peritoneal Dialysis International
Footnotes
Acknowledgement
We are grateful to all patients and medical staff who participated in this project.
Author contributions
JY and MC performed experiments and collected samples; JW, LW, JL, XL and WG collected clinical data; YH and JC interpreted results of experiments; JC prepared figures, edited and revised manuscript; YH and JC conceived and designed research. JY and MC authors contributed equally to this work. All authors reviewed and edited the manuscript and approved the final version of the manuscript.
Declaration of conflicting interests
The author(s) declared no potential conflicts of interest with respect to the research, authorship, and/or publication of this article.
Ethical approval
Ethical approval for this study was obtained from Ethics Committee of Army Medical University (approval no. 2009-80).
Funding
The author(s) disclosed receipt of the following financial support for the research, authorship, and/or publication of this article: This research was supported by the Special Key Program of Chongqing Technology Innovation and Application Development (no. cstc2019jscx-gksbX0024); the National Natural Science Foundation of China (no. 81800646); the medical research funding of PLA, China (no. AWS14C003) and the National Science and Technology Support Plan of China (no. 2016YFC1305501).
Informed consent to participate
Written informed consent was obtained from all subjects before the study
Informed consent to publish
Written informed consent was obtained from the patient(s) for their anonymised information to be published in this article.
Supplemental material
Supplemental material for this article is available online.
References
Supplementary Material
Please find the following supplemental material available below.
For Open Access articles published under a Creative Commons License, all supplemental material carries the same license as the article it is associated with.
For non-Open Access articles published, all supplemental material carries a non-exclusive license, and permission requests for re-use of supplemental material or any part of supplemental material shall be sent directly to the copyright owner as specified in the copyright notice associated with the article.