
Abstract
Background:
The peritoneal capillary endothelium is widely considered to be the most influential structure in dictating the rate of small solute transport (SST) during peritoneal dialysis (PD). PD patients are at significant risk of systemic microcirculatory dysfunction. The relationship between peritoneal and systemic microcirculations in patients new to PD has not been well studied. We hypothesised that for patients on PD for less than 6 months, dysfunction in the systemic microcirculation would be reflected in the rate of SST.
Methods:
We recruited 29 patients to a cross-sectional, observational study. Rate of SST was measured using a standard peritoneal equilibration test. Laser Doppler Flowmetry was used to measure response to physical and pharmacological challenge (post-occlusive hyperaemic response and iontophoretic application of vasodilators) in the cutaneous microcirculation. Sidestream Darkfield imaging was used to assess sublingual microvascular density, flow and endothelial barrier properties.
Results:
We found no moderate or strong correlations between any of the measures of systemic microcirculatory function and rate of SST or albumin clearance. There was however a significant correlation between dialysate interleukin-6 concentrations and both SST (rs = 0.758 p ≤ 0.0001) and albumin clearance (rs = 0.53, p = 0.01).
Conclusions:
In this study, systemic microvascular dysfunction did not significantly influence the rate of SST even early in patients PD careers. In conclusion, this study demonstrates that intraperitoneal factors particularly inflammation have a far greater impact on rate of SST than systemic factors.
Introduction
The primary function of the microcirculation, which encompasses arterioles, capillaries and venules, is to allow exchange of nutrients and gas transfer across their semi-permeable vascular wall. A monolayer of endothelial cells forms the blood interface throughout the cardiovascular system. This layer performs multiple functions integral to the proper functioning of the microvascular network including regulation of vascular permeability, inhibition of platelet aggregation and regulation of vascular tone. 1 Vascular endothelial cells are covered on their luminal surface by the glycocalyx, a negatively charged layer of glycoproteins. The glycocalyx exerts several important vasculoprotective effects including inhibiting coagulation and leucocyte adhesion 2 and mediating shear stress-induced nitric oxide release, 3 but it also plays a significant role in vascular permeability. 4
The peritoneal capillary endothelium is widely considered to be the most influential structure in dictating the rate of small solute transport (SST) across the peritoneum during peritoneal dialysis (PD). 5 The capillary wall as the major barrier to solute transport forms the basis for the most widely applied and best understood model of peritoneal transport – Rippe’s three pore model. 6 More recently, this model has been extended by others to propose a role for the endothelial glycocalyx. 7
All dialysis patients including those on PD have multiple risk factors for microcirculatory dysfunction. Experimentally, uraemia has been associated with endothelial cell activation, 8 impaired endothelial repair 9 and oxidative stress. 10 Additionally, within kidney cohorts, there is a high prevalence of comorbidities such as diabetes and coronary artery disease, which have independent detrimental effects on the systemic microcirculation. 11,12 Recent years have seen the development of several techniques to non-invasively study, in vivo, the structure and function of the microcirculation. 13,14 In kidney cohorts, these techniques have been used to demonstrate reduced capillary density in the skin and under the tongue, 15 –17 reductions in the vasodilatory response of the skin microcirculation to physical and chemical stimuli 18,19 and impairment of glycocalyx barrier properties. 20
The relationship between the systemic and peritoneal microcirculations is likely to be complex, wherein both are influenced by demographic and biochemical factors including age, sex, co-morbidity and inflammation. In addition, with time on PD, the peritoneal microcirculation is damaged through exposure to non-physiological dialysis solutions in a way that the systemic microcirculation is not. It remains unclear how the systemic microcirculation relates to the peritoneal microcirculation in patients who have recently commenced PD.
We conducted a cross-sectional, observational study in patients who had been receiving PD for less than 6 months, comparing rate of SST at first test of peritoneal permeability with non-invasive tests of the structure and function of the cutaneous and sublingual microcirculations, to test the hypothesis that changes in the systemic microcirculation such as loss of glycocalyx integrity, alterations in small vessel density and impairments in reactive vasodilation would be reflected in the rate of SST.
Methods
Subjects
Participants were recruited from patients attending the Royal Devon and Exeter Hospital and University Hospital Wales, Cardiff, for their dialysis care between December 2016 and November 2019. Patients were eligible to take part if they were aged over 18 years, had been receiving PD for less than 6 months and underwent a standard test of peritoneal permeability within the first 6 months of treatment. Potential participants were excluded if they were prescribed a calcineurin inhibitor, had a history of Raynauds disease or experienced a major vascular event in the preceding 3 months, all of which are known to alter microvascular function.
Peritoneal permeability test
All participants underwent a test of peritoneal permeability as part of their routine clinical care. Participants recruited at the Royal Devon and Exeter site underwent a standard peritoneal equilibration test (PET) as originally described by Twardowski. 21 Participants recruited at the Cardiff site underwent a ‘fast PET’, whereby dialysate samples were taken for analysis only at the end of the 4th hour and not at time 0 or 2 h. All other aspects of the PET were as for the standard PET. The primary outcome variable was dialysate to plasma ratio of creatinine at 4 h (D/Pcr4 H). Excellent agreement between D/PCr4 H for standard PET and fast PET has been shown (r = 0.77; p = 0.0001). 22 Differences in laboratory creatinine assays are known to influence results, 23 therefore samples taken during the Cardiff PETs were frozen and subsequently reanalysed in the Royal Devon and Exeter clinical biochemistry department (Creatinine Jaffe Gen.2 by Cobas). Manufacturers of this assay state that no interference is expected at glucose concentrations <120 mmol/L. None of the 4-h dialysate samples (used for our primary outcome measure) had glucose concentrations in excess of this level; therefore, creatinine concentrations were not corrected for glucose concentration.
Biochemical analyses
Albumin was measured in blood and the 4-h dialysate samples (Roche immunotrubidimetric microalbumin assay), expressed as milligram per litre and used to calculate peritoneal albumin clearance using the following formula;
Interleukin-6 (IL-6) was measured in blood and dialysate samples (taken from the overnight dwell prior to the PET); these were processed at the immunoassay biomarker core laboratory, University of Dundee, using IL-6 Meso Scale Discovery V-PLEX assay.
Study protocol
All participants attended for a single study visit during which all the microvascular tests were performed. Participants attended in the morning, having fasted orally overnight for at least 8 h. Participants attended ‘dry’ (without any dialysate in situ), their overnight dialysis regime the night before was conducted as per their individual prescription. Information was recorded based on demographic details, past medical history, current medications and dialysis regime. To reduce the influence of food intake on microvascular parameters, participants were given a standardised meal of two pieces of brown toast with butter and a glass of water. All tests were conducted in a temperature-controlled room (23 ± 1°C) in which participants had acclimatised for 30 min.
Microvascular tests
Using these techniques, impairments of microcirculatory structure and function have been demonstrated in other kidney cohorts compared with healthy controls. 17,20,24 Significant correlations between these and other established parameters of altered microcirculation have also been demonstrated. 25 –28
All microvascular tests were conducted and analysed by a single operator. Reproducibility data, as determined by multiple measurements on different days in the same individual, were acquired for all techniques, coefficients of variation fell within acceptable ranges in the published literature (Supplemental Data 1).
Cutaneous microcirculatory function
To facilitate temperature regulation, human skin has a high vasodilatory reserve. Relative changes in skin blood flow provoked by physical and pharmacological stimuli can be easily and non-invasively measured using laser Doppler techniques. 29 We performed two tests of cutaneous microcirculatory function using Laser Doppler Flowmetry. The flexor aspect of the right arm was used for both tests unless the participant had an arterio-venous fistula on that arm, when the flexor aspect of the left arm was used.
Iontophoretic application of vasodilators
Iontophoresis allows minimally invasive trans-dermal delivery of charged molecules to a localised area of cutaneous microcirculation 30 (Figure 1(A)). Endothelium dependant and endothelium independent vasodilation were assessed using iontophoretic application of acetylcholine (ACh) and sodium nitroprusside (SNP), respectively. These were individually applied using a separate Perspex direct electrode chamber, attached by an adhesive disk to separate sites on the flexor aspect of the forearm. ACh (1% w/v Miochol-E, Novartis, Camberley, UK) and ACh vehicle solution (3% w/v mannitol in water) were delivered using an anodal current of 0.1 mA for 5 × 20 second bursts with 60 s between currents; SNP (0.25% w/v, 25 mg/mL Hospira Pty Ltd., Melbourne, Australia) and SNP vehicle solution (0.45% w/v saline, Baxter, UK) were delivered using a single cathodal current of 0.2 mA applied for 60 s. Flux was recorded, using a solid-state Laser Doppler Perfusion Imager, Moor LDI (Moor Instruments, Axminster, Devon), immediately prior to current application and at 60 s intervals for 5 min for both ACh and SNP and was analysed using MoorLDI software V 5.3. Current was delivered by a battery powered iontophoresis controller (Moor iontophoresis controller, MIC2, Moor Instruments).
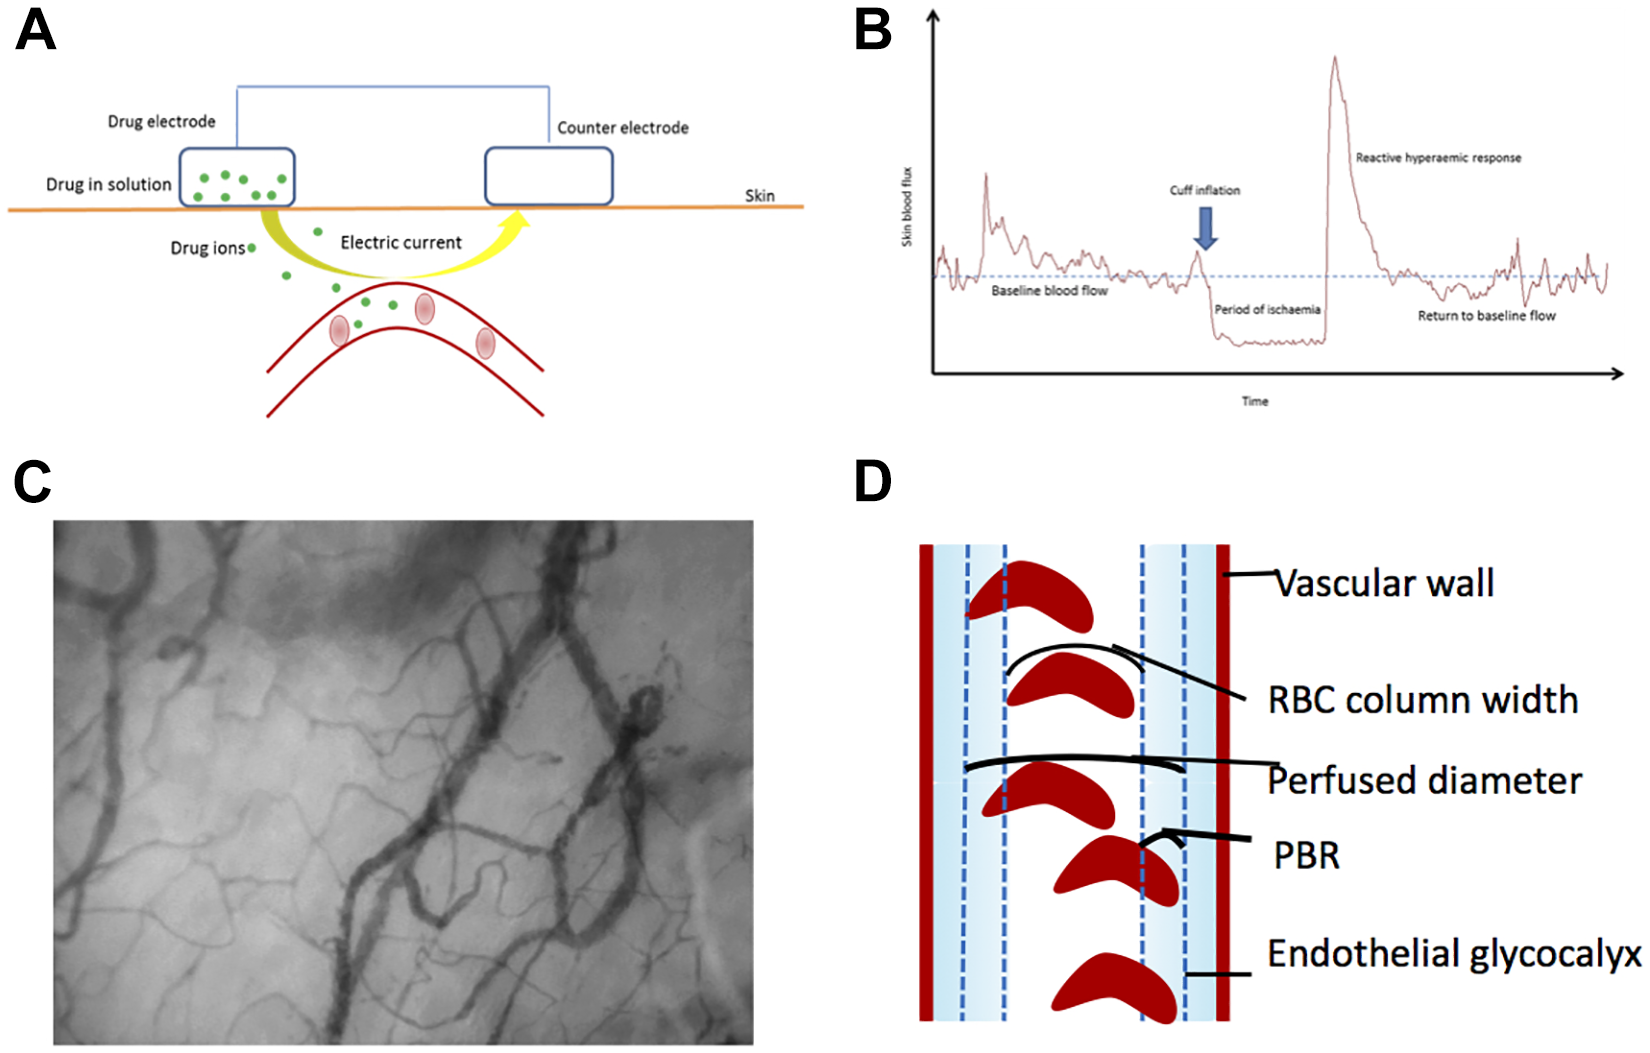
Techniques used to study the cutaneous and sublingual microcirculations (modified from Williams et al. 14 , with permission). (A) Schematic representation of iontophoretic delivery of vasoactive substances. Vasodilation in response to the delivery of vasoactive substances is measured using Laser Doppler Perfusion Imaging producing a 2D perfusion map, brighter colours indicate greater flux. (B) Representative laser Doppler trace obtained before, during and after a brief period of arterial occlusion. A reactive hyperaemia can be induced by a brief period of arterial occlusion using a cuff placed around the upper arm or leg. This response takes the form of a post-ischaemic flow initially many times faster than normal followed by exponential decay to baseline. The response is measured using a single-point laser doppler flowmeter. (C) Example of sublingual microcirculation as visualised using sidestream dark field imaging. A handheld camera illuminates the tissue using green light-emitting diodes, the scattered light is within the wavelength of the haemoglobin absorption spectrum (530 nm) and is therefore absorbed by haemoglobin contained in RBCs. Reflected light is captured on a charge coupled camera. RBCs are visualised as black or grey bodies on a white background. Penetration of the light is up to 3 mm consequently superficial capillaries and venules that contain RBCs are visualised. (D) Schematic depicting the principles used by Glycocheck software to measure glycocalyx permeability. Dotted lines represent the edge of the cell permeable and impermeable areas. The PBR for vessels between 5 µm and 25 µm is calculated as perfused diameter – median RBC column width/2 (as the PBR is present on both sides of the RBC column). PBR: perfused boundary region; 2D: two dimensional; RBC: red blood cell.
For each of the test substances, the primary outcome measures were peak vasodilatory response during the monitoring period in arbitrary units (AUs) and total vasodilatory response (area under the curve) adjusted for baseline.
Post-occlusive reactive hyperaemia
The hyperaemic response following the release of a brief period of arterial occlusion can also be captured using Laser Doppler Flowmetry 31 (Figure 1(B)). This post-occlusive hyperaemic response is a global assessment of cutaneous microvascular function.
Flux was captured using a DRT4 laser Doppler perfusion monitor (Moor Instruments), attached to the flexor aspect of the forearm using an adhesive disk. Baseline flux was recorded for 10 min. A multi-outlet blood pressure cuff attached to a pressure reservoir placed around the upper arm was rapidly inflated to 200 mmHg; this pressure was maintained for exactly 4 min. Complete arterial occlusion was ensured by monitoring the flux trace. After 4 min, the cuff was rapidly deflated. Flux was monitored for a further 10 min or until it returned to baseline, whichever occurred sooner.
Offline analysis of the flux traces was performed. The primary outcome measures were absolute peak flux (Moorsoft DRT4 version 2.0) and area under the reactivity curve, that is, the total hyperaemic response (MoorVMS-PC version 3.1 software).
Sublingual microcirculation
Sidestream Darkfield imaging – capillaroscopy
Sidestream Darkfield (SDF) imaging allows direct visualisation of flow in microvascular beds with a mucosal covering and is most commonly used to study the sublingual circulation 32 (Figure 1(C)).
Participants were studied in the supine position. Images were acquired using a handheld SDF device (Microscan, Microvision Medical, Amsterdam, the Netherlands), with a 5× objective lens and a numerical aperture of 0.16. A single use plastic cap was applied to the tip of the device which was then placed sublingually, and illumination levels and focus adjusted to achieve optimal images. Video sequences of 20 s duration were recorded using AVA 3.1 software (Academic Medical Centre, University of Amsterdam, the Netherlands). Sufficient recordings were made such that the operator was confident of having three recordings that could be reliably analysed offline as per European Society of Intensive Care Medicine recommendations. 33 Analysis was performed using the semi-automated AVA 3.1 software, as previously described in detail. 34 All vessels were identified manually and segmented from background tissue by drawing the vessel centreline and lumen boundaries, then allocated to one of three groups: small (<20 µm), medium (20–50 µm) or large (50–100 µm). Full examination was only made of small vessels as these are the most physiologically important for oxygen and nutrient exchange. Flow in each vessel was semi-quantified by the person analysing the record as continuous, sluggish (flow for 50–100% of the recording), intermittent (flow for <50% of the recording) or no flow. The AVA software uses these data to calculate the following outcome variables: total vessel density (mm/mm2), perfused vessel density (mm/mm2) and proportion of perfused vessels (%).
Sidestream dark field imaging – glycocalyx barrier properties
SDF images also enable an assessment of the endothelial glycocalyx. 35 Images were acquired using a handheld SDF video microscope (KK technology, Honiton, Devon, UK), connected to a laptop running Glycocheck measurement software (Glycocheck BV, Maastricht, the Netherlands). Analysis is fully automated and has previously been described in detail. 20 In short, it is not possible to visualise the glycocalyx directly using SDF; the parameters produced by the Glycocheck software are based on the principle that an intact endothelial glycocalyx has a cell permeable and a cell-impermeable layer. The outer edges of the microvascular lumen (from the surface of the endothelial cell to the most luminal aspect of the proposed cell-impermeable layer) are relatively devoid of red blood cells (RBCs). Damage to the endothelial surface layer means RBCs have greater access to the usually cell-impermeable region and consequently deviate further from their central region of flow (Figure 1(D)). The primary outcome variable generated by Glycocheck is the perfused boundary region (PBR) for vessels measuring 5–25 µm. The PBR reflects the degree to which RBCs can deviate from their median column width and penetrate the usually cell-impermeable area, larger PBRs represent greater lateral movement and imply greater penetration into the glycocalyx.
Ethics
The study was approved by East-Midlands Leicester Central Research Ethics Committee (REC ref 16/EM/0395) and conducted per the Declaration of Helsinki. All participants gave their written informed consent.
Statistics
Statistical analysis was performed using StataSE-16 (Stata Corporation, Texas, USA). Graphical analysis was performed using GraphPad Prism 8 software. All variables were tested for normality by Shaprio-Wilks test. For normally distributed data correlations, between variables were assessed using Pearson’s correlation coefficient. For non-normally distributed data correlations, between variables were assessed using Spearman’s rank correlation coefficient. A result was considered statistically significant if p ≤ 0.05.
Results
All eligible patients were approached during the recruitment period. A total of 37 participants were recruited across the two sites. Eight participants withdrew or were withdrawn prior to microvascular investigations. Twenty-nine participants were included in the final analysis (see Supplementary Figure 1 for flow-chart summarising recruitment). Further recruitment was not possible within the time frame of the study. Demographic data for the cohort are detailed in Table 1. Primary diagnoses of kidney failure were hypertensive nephropathy 27.6%, glomerular nephropathy 17.2%, small vessel vasculitis 10.3%, polycystic kidney disease 10.3%, small kidneys/unknown cause 10.3%, diabetic nephropathy 6.9%, reflux nephropathy 6.9% and other 10.3%.
Characteristics of study participants in the analysis.a
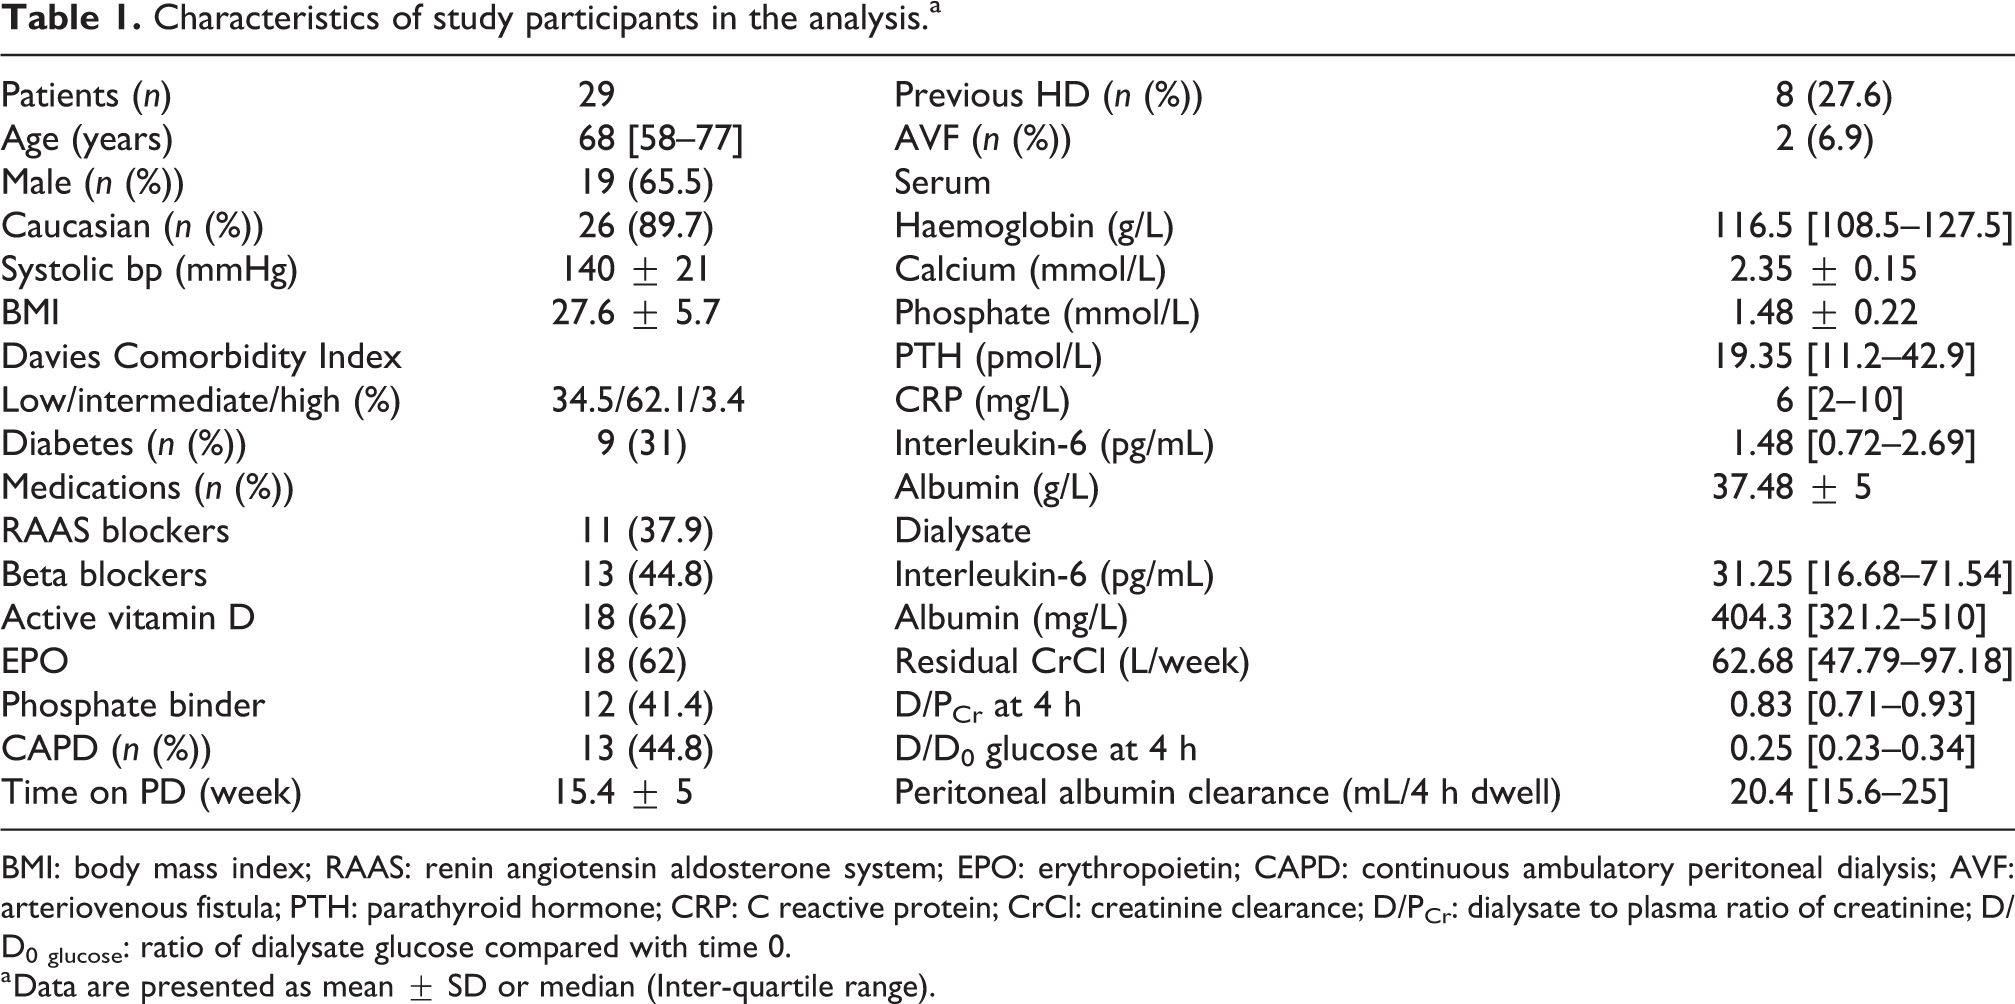
BMI: body mass index; RAAS: renin angiotensin aldosterone system; EPO: erythropoietin; CAPD: continuous ambulatory peritoneal dialysis; AVF: arteriovenous fistula; PTH: parathyroid hormone; CRP: C reactive protein; CrCl: creatinine clearance; D/PCr: dialysate to plasma ratio of creatinine; D/D0 glucose: ratio of dialysate glucose compared with time 0.
a Data are presented as mean ± SD or median (Inter-quartile range).
SST as defined by dialysate to plasma ratio of creatinine at 4 h (D/PCr4 H) was not normally distributed and therefore all analyses using this variable were done using non-parametric tests. The results of the microvascular tests in this cohort are summarised in Supplementary Table 1.
Relationship between SST and the systemic microcirculation
Correlations between SST and all the microvascular parameters measured are summarised in Table 2.
Summary of correlations between small solute transport (D/PCr4 H) and systemic microcirculatory parameters.a
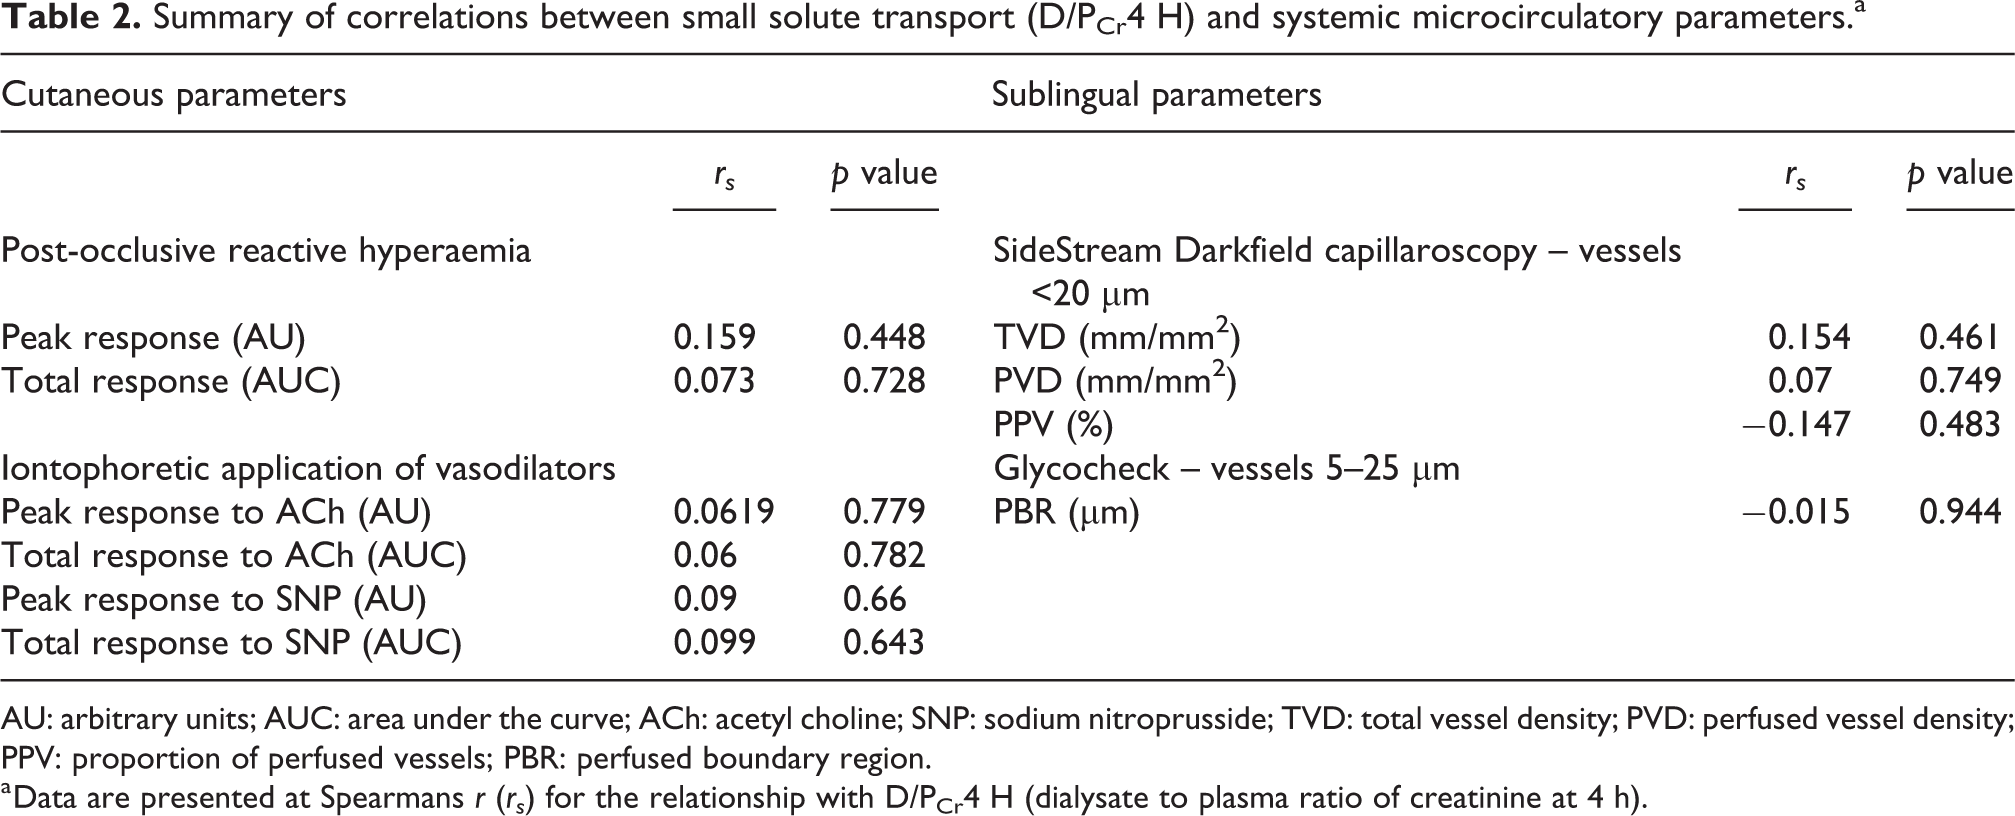
AU: arbitrary units; AUC: area under the curve; ACh: acetyl choline; SNP: sodium nitroprusside; TVD: total vessel density; PVD: perfused vessel density; PPV: proportion of perfused vessels; PBR: perfused boundary region.
a Data are presented at Spearmans r (rs ) for the relationship with D/PCr4 H (dialysate to plasma ratio of creatinine at 4 h).
Cutaneous microcirculation
Twenty-three participants had adequate data for analysis of response to iontophoretic application of ACh and SNP. There was no significant relationship between D/PCr4 H and either the peak (ACh p = 0.779, SNP p = 0.66) or total response to ACh or SNP (ACh p = 0.782, SNP p = 0.643).
Twenty-five participants had adequate data for analysis of post-occlusive hyperaemic curves. There was no significant relationship between D/PCr4 H and the absolute peak of the hyperaemic curve (p = 0.448) or the total response represented by the area under the response curve (p = 0.728) (Figure 2(A)).
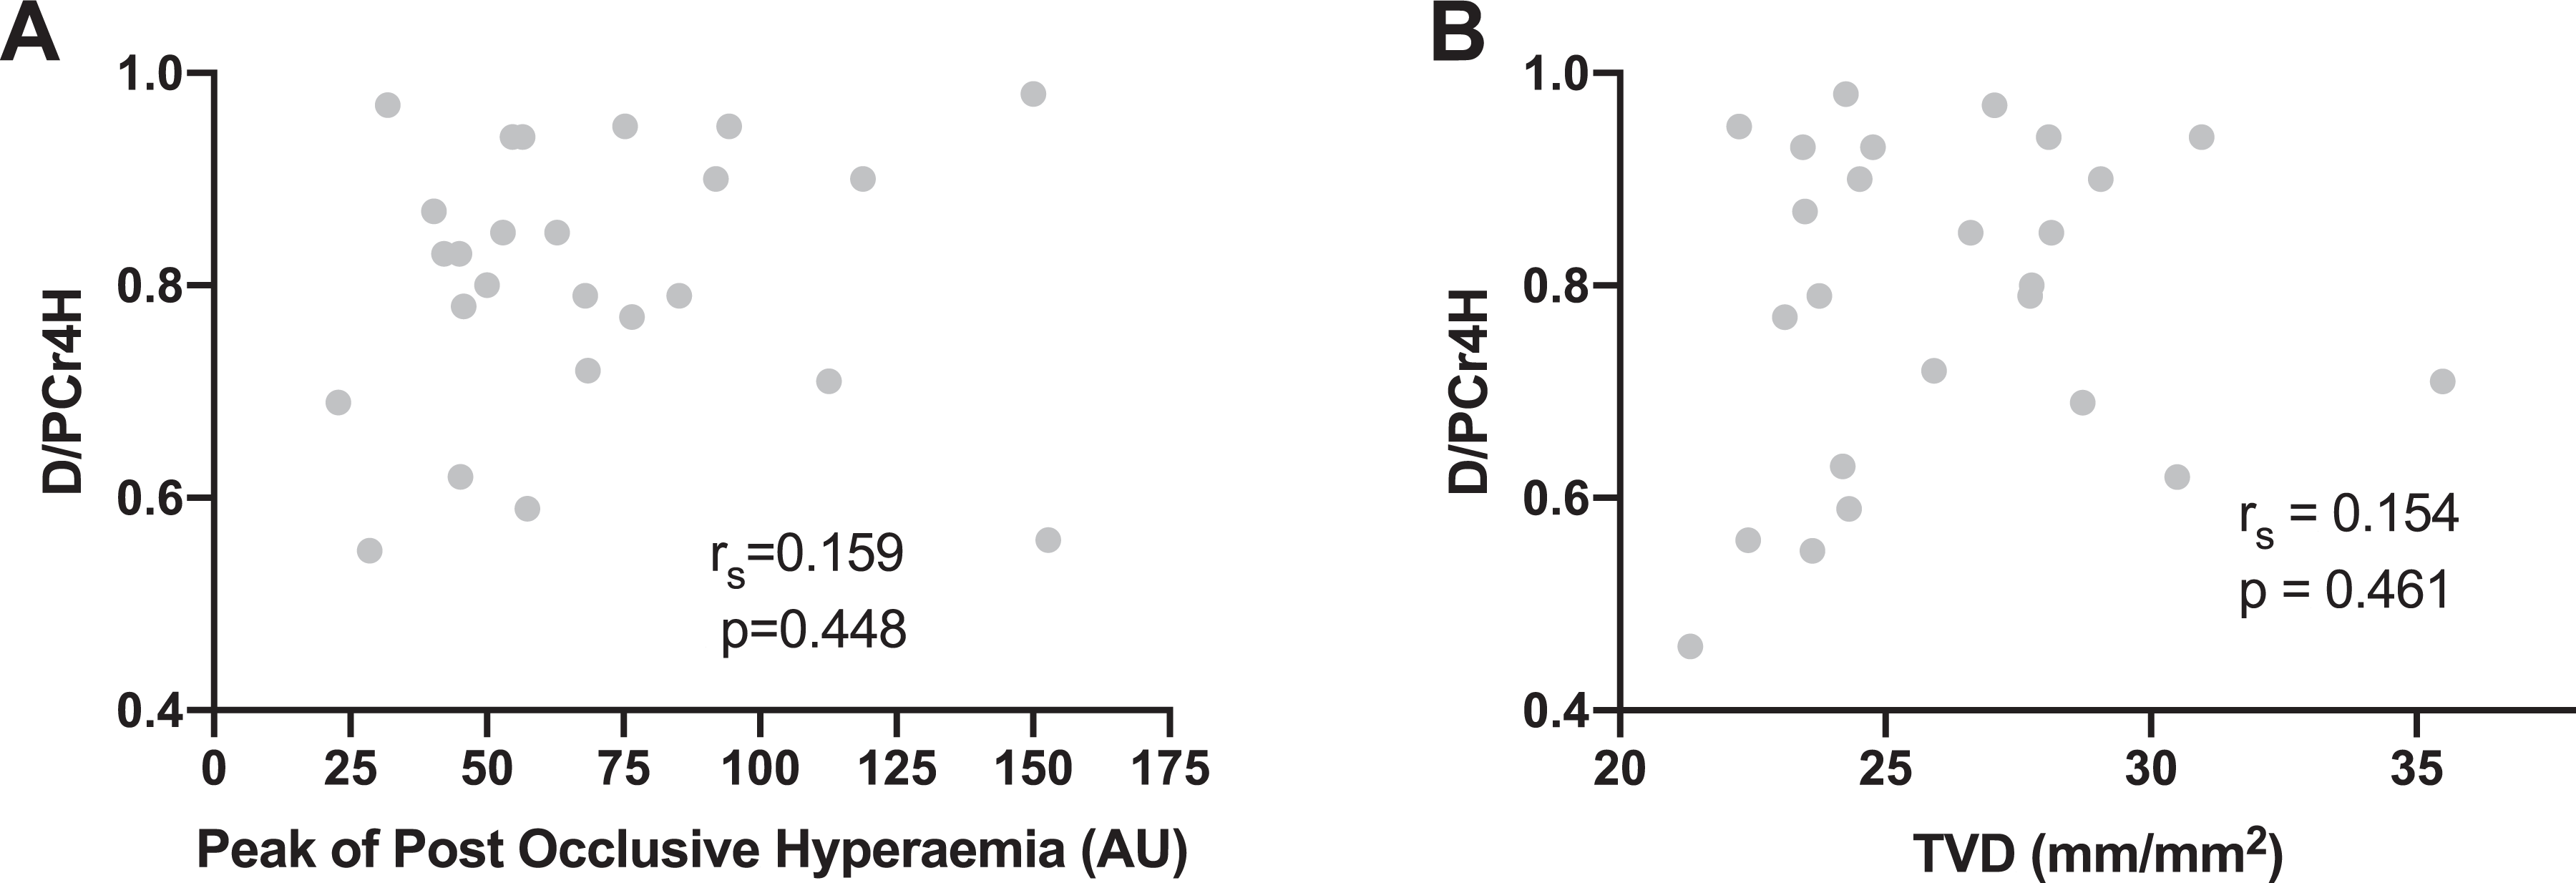
Graphs showing the relationship between SST (D/PCr4 H) and systemic microvascular structure and function. (A) No relationship between SST and peak post-occlusive hyperaemic response measured on the forearm. (B) No relationship between SST and sublingual TVD. p ≥ 0.05 for both correlations. D/PCr4 H: dialysate to plasma ratio of creatinine after 4 h; AU: arbitrary units; TVD: total vessel density; SST: small solute transport.
Sublingual microcirculation
Twenty-five participants had adequate data for sublingual capillaroscopy. No significant relationship was seen between D/PCr4 H and any of the parameters for the smallest vessels (<20 µm) (Figure 2(B)). No significant correlations were found when analysis was extended to include all vessel sizes (up to 100 µm), data not shown.
Twenty-six participants had complete Glycocheck data. No significant relationship was seen between D/PCr4 H and PBR in vessels measuring 5–25 µm.
Participants were grouped into quartiles according to D/PCr4 H. There was no statistically significant difference between participants in the top and bottom quartiles for any of the microvascular parameters. This study included a high number of fast transporters (D/PCr4 H > 1 SD above the mean in Twardowskis’s original study 21 ); it has previously been suggested that patients in the highest transport category early in their PD careers are qualitatively different to the rest of the cohort. 36 Therefore, all correlation analyses were repeated excluding the top quartile of participants (D/PCr4 H > 0.93). This did not reveal any significant associations.
Relationship between inflammation, SST and the systemic microcirculation
There was a strong correlation between dialysate IL-6 and D/PCr4 H (rs = 0.758; p ≤ 0.0001) (Figure 3(A)). There was also a significant correlation between serum IL-6 and D/PCr4 H (rs = 0.432; p = 0.0245) (Figure 3(B)) and serum IL-6 and dialysate IL-6 (rs = 0.513; p = 0.0087). After adjustment for systemic and intraperitoneal inflammation, in multiple regression analysis, the relationship between D/PCr4 H and serum IL-6 was no longer significant (p = 0.28), although the relationship between D/PCr4 H and dialysate IL-6 remained (p = 0.019). There were no significant correlations between dialysate IL-6 or serum IL-6 and any of the measures of systemic microvascular structure or function.
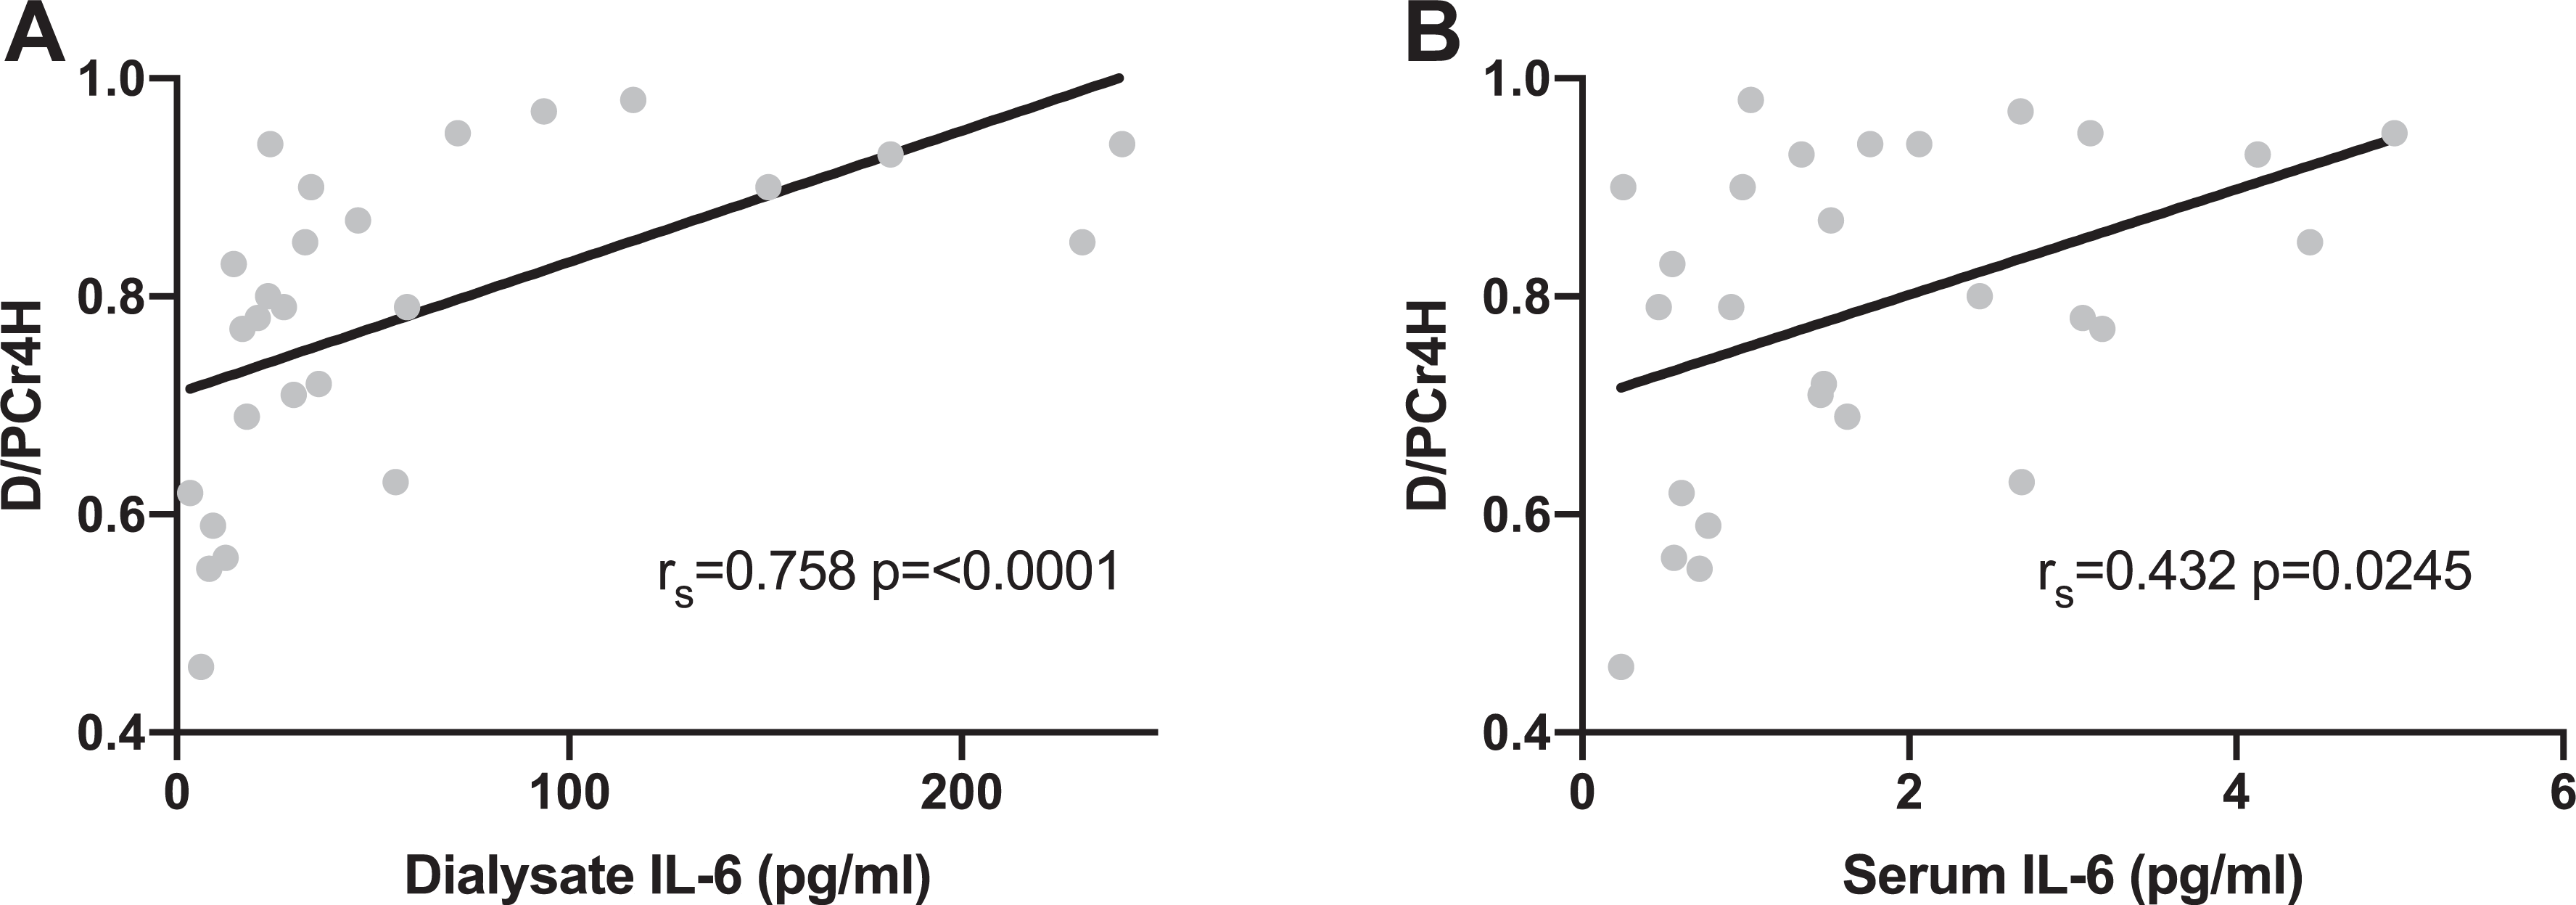
Graphs showing the relationship between small solute transport (D/PCr4 H) and (A) intraperitoneal inflammation and (B) systemic inflammation. D/PCr4 H: dialysate to plasma ratio of creatinine at 4 h; IL-6: interleukin-6.
Relationship between transport of larger molecules and the systemic microcirculation
Peritoneal albumin clearance during the 4-h dwell was calculated as outlined above. There were no significant correlations between 4-h peritoneal albumin clearance and any of the measures of cutaneous or sublingual microvascular structure and function (Supplemental Data).
There was a significant correlation between D/PCr4 H and 4-h peritoneal albumin clearance (rs = 0.51, p = 0.009). There was a significant correlation between peritoneal albumin clearance and dialysate IL-6 concentrations (rs = 0.53, p = 0.01). There was also a significant correlation between peritoneal albumin clearance and serum IL-6 (rs = 0.61, p = 0.0018) (Supplemental Figure 2).
Discussion
This is the first study to investigate the relationship between systemic microvascular structure and function and peritoneal SST in a cohort of patients exclusively with a duration of PD less than 6 months, thus examining the relationship between the systemic and peritoneal microcirculations and not the effects on peritoneal microvessels of chronic exposure to dialysate solutions.
We found no moderate or strong relationship between endothelial function, microvascular responsiveness, the glycocalyx (endothelial cell surface layer) or microvascular density as assessed in the cutaneous or sublingual microcirculations and rate of SST. Previous studies of the relationship between peritoneal SST and systemic vascular function have also reported no correlation with sublingual endothelial glycocalyx properties 36 or conduit vessel endothelial function measured using flow mediated dilatation of the brachial artery. 37,38 However, these studies examined patients well established on PD (mean duration of PD 42 months) in contrast to those in the present study.
The rate of SST across the peritoneum is widely thought to be primarily dictated by factors pertaining to the peritoneal microvascular capillary wall. If changes demonstrated in the systemic microcirculation of dialysis patients 14 such as changes in vessel density and glycocalyx barrier properties were reflected in the peritoneal microcirculation, this could in theory account for some of the variability in rate of SST observed in patients new to PD. We did not observe any moderate or strong correlations between SST and any of the measures of microvascular structure or function in either of two separate vascular beds. Albumin has a much larger molecular radius than creatinine, consequently much of it’s transport is predicted to be via the large pore pathway. Pore-matrix theory 7 would seem to dictate that loss of glycocalyx may play a greater role in the transport of solutes larger than creatinine, due to increased permeability of small pores or creation of more large pores. As predicted by traditional pore theory, we found a strong correlation between SST and albumin clearance but no relationship between peritoneal albumin clearance and any aspect of cutaneous or sublingual microvascular function.
We found a strong relationship between intraperitoneal inflammation and transport of creatinine and albumin. There is increasing evidence for a significant role for intraperitoneal inflammation in the rate of transport of small solutes and larger solutes such as albumin. 23,39,40 The Global fluid investigators reported that dialysate IL-6 concentration was the most significant predictor of SST not only in prevalent but also incident patients, a relationship that was independent of all patient-related factors and dialysis prescription. 23 As reported previously, 23 we have demonstrated that although there is an association between intraperitoneal and systemic inflammatory levels, inflammation within the peritoneum is many times higher than in the systemic circulation and exerts a greater influence on SST.
This study has a number of strengths. It is the first to prospectively study in vivo the relationship between the systemic microcirculation and peritoneal SST in incident patients. We present a well described cohort of patients who underwent a range of tests of microvascular structure and function across two vascular beds contemporaneously to their first test of peritoneal permeability.
This study also has several limitations. This is a relatively small study comprising 29 individuals; this number of participants would allow detection of a correlation coefficient of 0.5 or greater. Therefore, it is possible that a correlation smaller than this exists that this study was unable to detect. All in vivo studies of the microcirculation have to contend with significant inter and intra subject temporal and spatial heterogeneity. 31 Despite measures to reduce this including a standardised pre-test meal, peritoneal fasting and a single investigator for all tests, the inherent heterogeneity of the microcirculation in this small cohort may have further reduced our ability to detect small correlations.
Although systemic microvascular dysfunction is likely to have implications for long-term cardiovascular health, in this study, it did not significantly influence the rate of SST even early in patients PD careers. This study adds to an increasing body of evidence that intraperitoneal factors particularly intraperitoneal inflammation have a far greater impact on rate of SST than systemic factors.
Supplemental material
Supplemental Material, sj-docx-1-ptd-10.1177_08968608211047332 - An exploratory study of the relationship between systemic microcirculatory function and small solute transport in incident peritoneal dialysis patients
Supplemental Material, sj-docx-1-ptd-10.1177_08968608211047332 for An exploratory study of the relationship between systemic microcirculatory function and small solute transport in incident peritoneal dialysis patients by Jennifer Williams, Mark Gilchrist, William David Strain, Donald Fraser and Angela Shore in Peritoneal Dialysis International
Supplemental material
Supplemental Material, sj-docx-2-ptd-10.1177_08968608211047332 - An exploratory study of the relationship between systemic microcirculatory function and small solute transport in incident peritoneal dialysis patients
Supplemental Material, sj-docx-2-ptd-10.1177_08968608211047332 for An exploratory study of the relationship between systemic microcirculatory function and small solute transport in incident peritoneal dialysis patients by Jennifer Williams, Mark Gilchrist, William David Strain, Donald Fraser and Angela Shore in Peritoneal Dialysis International
Supplemental material
Supplemental Material, sj-docx-3-ptd-10.1177_08968608211047332 - An exploratory study of the relationship between systemic microcirculatory function and small solute transport in incident peritoneal dialysis patients
Supplemental Material, sj-docx-3-ptd-10.1177_08968608211047332 for An exploratory study of the relationship between systemic microcirculatory function and small solute transport in incident peritoneal dialysis patients by Jennifer Williams, Mark Gilchrist, William David Strain, Donald Fraser and Angela Shore in Peritoneal Dialysis International
Supplemental material
Supplemental Material, sj-docx-4-ptd-10.1177_08968608211047332 - An exploratory study of the relationship between systemic microcirculatory function and small solute transport in incident peritoneal dialysis patients
Supplemental Material, sj-docx-4-ptd-10.1177_08968608211047332 for An exploratory study of the relationship between systemic microcirculatory function and small solute transport in incident peritoneal dialysis patients by Jennifer Williams, Mark Gilchrist, William David Strain, Donald Fraser and Angela Shore in Peritoneal Dialysis International
Footnotes
Authors’ note
WDS reports grants, personal fees and non-financial support from NovoNordisk, non-financial support from Bayer Pharmaceuticals, grants and personal fees from Takeda, personal fees from Astra Zeneca, outside the submitted work. MG reports personal fees from Napp outside the submitted work. The results presented in this article have not been published previously in whole or part, except in abstract form.
Acknowledgements
We would like to thank the home dialysis specialist teams at Royal and Devon and Exeter Hospital and University Hospitals Wales for their help in conducting this study.
Author contributions
All authors made substantial contributions to the design of the study. JW was responsible for all data collection and analysis. All authors contributed to interpretation of the data. The first draft of the manuscript was written by JW. All authors contributed to revisions of the manuscript and approved the final submitted draft.
Data availability statement
The data supporting this publication are currently available by contacting Dr J Williams (
Declaration of conflicting interests
The author(s) declared no potential conflicts of interest with respect to the research, authorship, and/or publication of this article.
Funding
The author(s) disclosed receipt of the following financial support for the research, authorship, and/or publication of this article: This work was funded by a Kidney Research UK Training Fellowship awarded to JW [TF_013_20151127].
Supplemental material
Supplemental material for this article is available online
References
Supplementary Material
Please find the following supplemental material available below.
For Open Access articles published under a Creative Commons License, all supplemental material carries the same license as the article it is associated with.
For non-Open Access articles published, all supplemental material carries a non-exclusive license, and permission requests for re-use of supplemental material or any part of supplemental material shall be sent directly to the copyright owner as specified in the copyright notice associated with the article.