
Abstract
Background:
Previous studies suggested that automated peritoneal dialysis (APD) could be improved in terms of shorter treatment times and lower glucose absorption using bimodal treatment regimens, having ‘ultrafiltration (UF) cycles’ using a high glucose concentration and ‘clearance cycles’ using low or no glucose. The purpose of this study is to explore such regimes further using mathematical optimization techniques based on the three-pore model.
Methods:
A linear model with constraints is applied to find the shortest possible treatment time given a set of clinical treatment goals. For bimodal regimes, an exact analytical solution often exists which is herein used to construct optimal regimes giving the same Kt/V urea and/or weekly creatinine clearance and UF as a 6 × 2 L 1.36% glucose regime and an ‘adapted’ (2 × 1.5 L 1.36% + 3 × 3 L 1.36%) regime.
Results:
Compared to the non-optimized (standard and adapted regimes), the optimized regimens demonstrated marked reductions (>40%) in glucose absorption while having an identical weekly creatinine clearance (35 L) and UF (0.5 L). Larger fill volumes of 1200 mL/m2 (UF cycles) and 1400 mL/m2 (clearance cycles) can be used to shorten the total treatment time.
Conclusion:
These theoretical results imply substantial improvements in glucose absorption using optimized APD regimens while achieving similar water and solute removal as non-optimized APD regimens. While the current results are based on a well-established theoretical model for peritoneal dialysis, experimental and clinical studies need to be performed to validate the current findings.
Keywords
Introduction
Automated peritoneal dialysis (APD) has become an increasingly popular treatment for a growing number of patients and offers the possibility of delivering a higher dialysis fluid flow rate (DFR = infused dialysis fluid per unit time, e.g. 2 L/h), which will typically result in a higher dialysis dose compared to continuous ambulatory peritoneal dialysis. 1 There is, however, as yet uncertainty as to the optimal way to prescribe APD. Short dwell times (high DFRs) improve solute clearances and ultrafiltration (UF) rates 1 –3 but may confer less sodium removal (NaR) per L UF, 4,5 increased glucose exposure and increased risk of overfill. 6 Long dwell times (low DFRs) allow better utilization of the PD fluid and improved NaR per L UF but will typically provide less UF per gram glucose absorbed 1 and lower solute clearances. Accordingly, several authors have proposed bimodal prescription techniques in which shorter UF cycles are combined with longer cycles optimized for solute removal. 1,7,8 The term bimodal, used in this context, should not be confused with combined icodextrin and glucose PD solutions. 9
Using an extended three-pore model (3PM), Öberg and Rippe 1 found that optimal DFRs appear to exist for the clearance of urea and other small solutes as well as for UF. An important conclusion in our study was that the optimal DFR (exchange time) will be different for different solutes and, indeed, different patients, mainly depending on the peritoneal transport status 1 and, likely, also on the fill volume used. 8 Furthermore, it was demonstrated that large reductions in treatment time and glucose reduction are possible using ‘bimodal’ treatment regimens having no/low glucose cycles (for solute clearance) and high glucose for UF. Perhaps counter-intuitively, the high glucose concentration is used to reduce glucose absorption since higher glucose concentrations give more UF per gram glucose absorbed. 10 The bimodal regimens in the literature 1 were however constructed manually and no known algorithms exist on how to optimize APD using the 3PM. The current work is thus devoted to constructing and applying a mathematical optimization model for optimized APD using a linear regression model with constraints.
Methods
Simulations using the extended 3PM
The same parameters were applied as in the literature 1 with the exception of the initial concentrations in the residual volume, where it was assumed that the peritoneal cavity had been rinsed using 1.36% glucose solution prior to all simulations (see the literature 11 ) (Table 1). A fill flow rate of 200 mL/min was used. Drain flow rates were 350 mL/min (fast phase) and 36 mL/min (slow phase) with a break point (transition point) at an intraperitoneal volume of 381 mL (see the literature 1 ).
Extended three-pore model parameters.
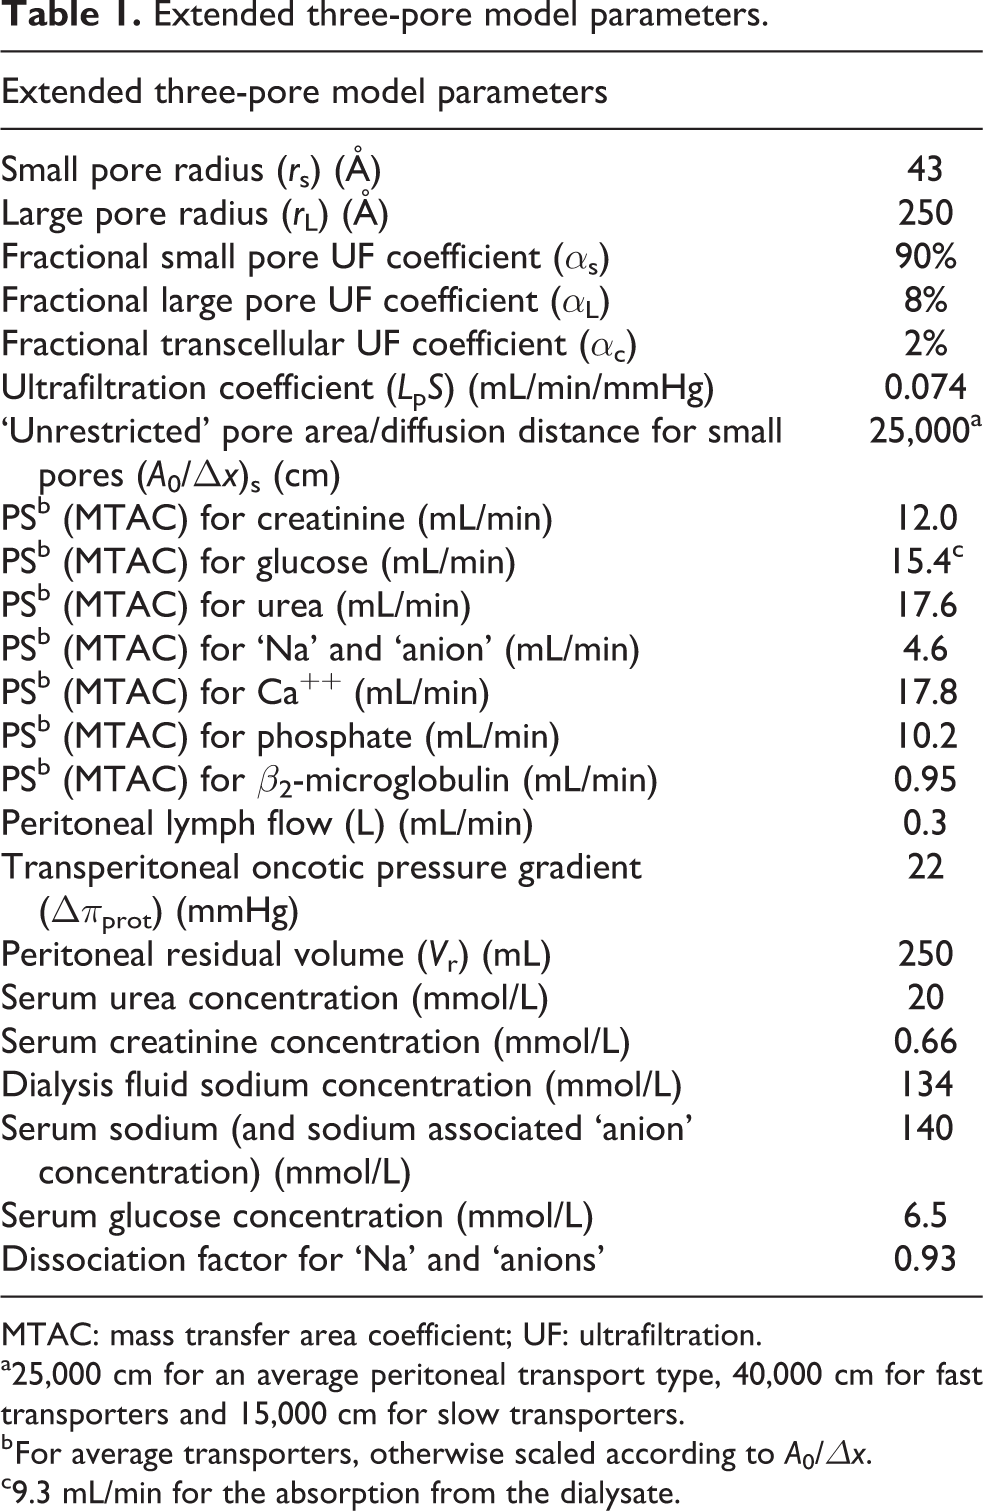
MTAC: mass transfer area coefficient; UF: ultrafiltration.
a25,000 cm for an average peritoneal transport type, 40,000 cm for fast transporters and 15,000 cm for slow transporters.
b For average transporters, otherwise scaled according to A0/Δx.
c9.3 mL/min for the absorption from the dialysate.
Optimization technique for multimodal APD regimens
A multivariate optimization model was constructed using the extended 3PM to generate solute clearances and UF rates for a wide spectrum of dwell times and different peritoneal transport types. The optimal dwell times were determined from the stationary points on the clearance versus DFR curves and UF rate versus DFR curves. Based on clinical removal targets Ri, a linear system of equations was constructed
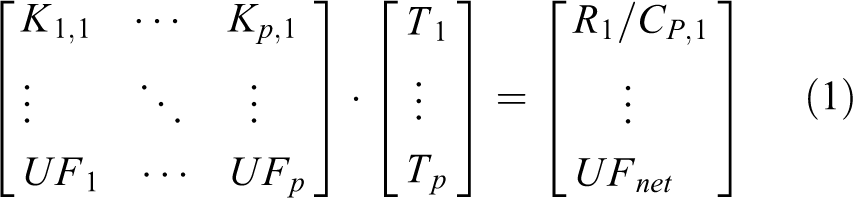
where Ki,j is the clearance of solute j and cycle type i, CP,j is the plasma water concentration of solute j, UF
i
is the UF rate of the i’th cycle type, Ti is the total treatment time for the i’th cycle type. The number of cycle types (e.g. urea, phosphate and UF cycle) does not necessarily need to equal the number of clinical targets (e.g. Rurea, Rphosphate and UFnet) and, regardless, the equation will usually not have a unique solution since the exact clinical targets may be impossible to obtain simultaneously (e.g. urea Kt/V of 2 and a much smaller phosphate removal). In fact, the opposite may be true that a spectrum of dwell types is assumed to generate regimens that fulfill a smaller number of targets. On the other hand, the case of two cycle types and two targets, where one is a solute removal, for example, urea
The number of cycles of type i (Ni) was calculated from the treatment times (τi) by dividing with the exchange time (the sum of the dwell, fill and drain time for the cycle type). Ni does not necessarily need to be a whole number, for example, Ni = 0.5 means that the cycle will be used every other day (eod), Ni = 3.5 means 3 cycles eod and 4 cycles eod, and so on. In the current publication, we chose to present only whole number solutions to facilitate comparison.
Optimization with constraints
If the volume of PD fluid available for an optimized APD prescription is limited, then the cycle times must be prolonged. This also means that the effectiveness of the treatment will be lower in terms of solute clearance and UF rate. 1 Prolonging the low glucose cycles will usually be more beneficial since the low (negative) UF rate of the low/no glucose cycles does not change very much with longer cycle times. In fact, the loss of water from the dialysate in a 0% cycle will be somewhat lower with a longer cycle time. Longer cycle time for these dwells will however lead to an increased loss of UF, which will have to be compensated by increasing the number of UF cycles. It may thus be impossible to reach the desired UF volume in which case the software was designed to prolong the UF cycles in a stepwise manner. In this way, the most effective treatment can always be found, given a certain volume limitation. In a similar fashion, a solute removal limited optimization technique can be created from the urea optimized regimens since increasing the dwell time for the long dwells is necessary to improve the removal of a solute having a diffusion capacity that is lower than that of urea (most solutes).
Results
Optimization technique
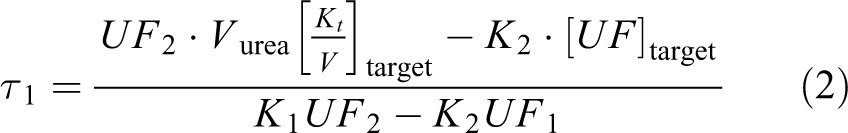
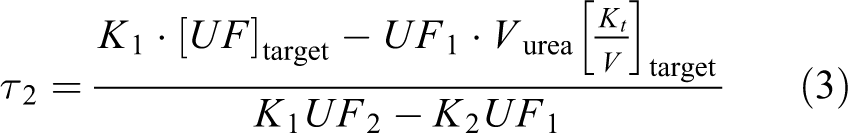
The basic steps of the optimization process are shown in Figure 1. Firstly, the extended 3PM is used to generate a spectrum of different dwell times. The solute clearance and UF rate are inversely correlated to the dwell time and the optimal dwell times in terms of solute clearance and UF are selected for ‘clearance cycles’ and ‘UF cycles’ in the bimodal regime, respectively. In the next step, equations (2) and (3) are solved to calculate the needed number of UF and clearance cycles, respectively. If there are constraints (dashed line), for example, that the total treatment volume is limited to, for example, 12 L or that the creatinine clearance should not be lower than 45 L/week, the dwell time of the cycles is prolonged in a stepwise fashion (see ‘Methods’ section). When the constraint is fulfilled, an optimized regime is created, again by solving equations (2) and (3).
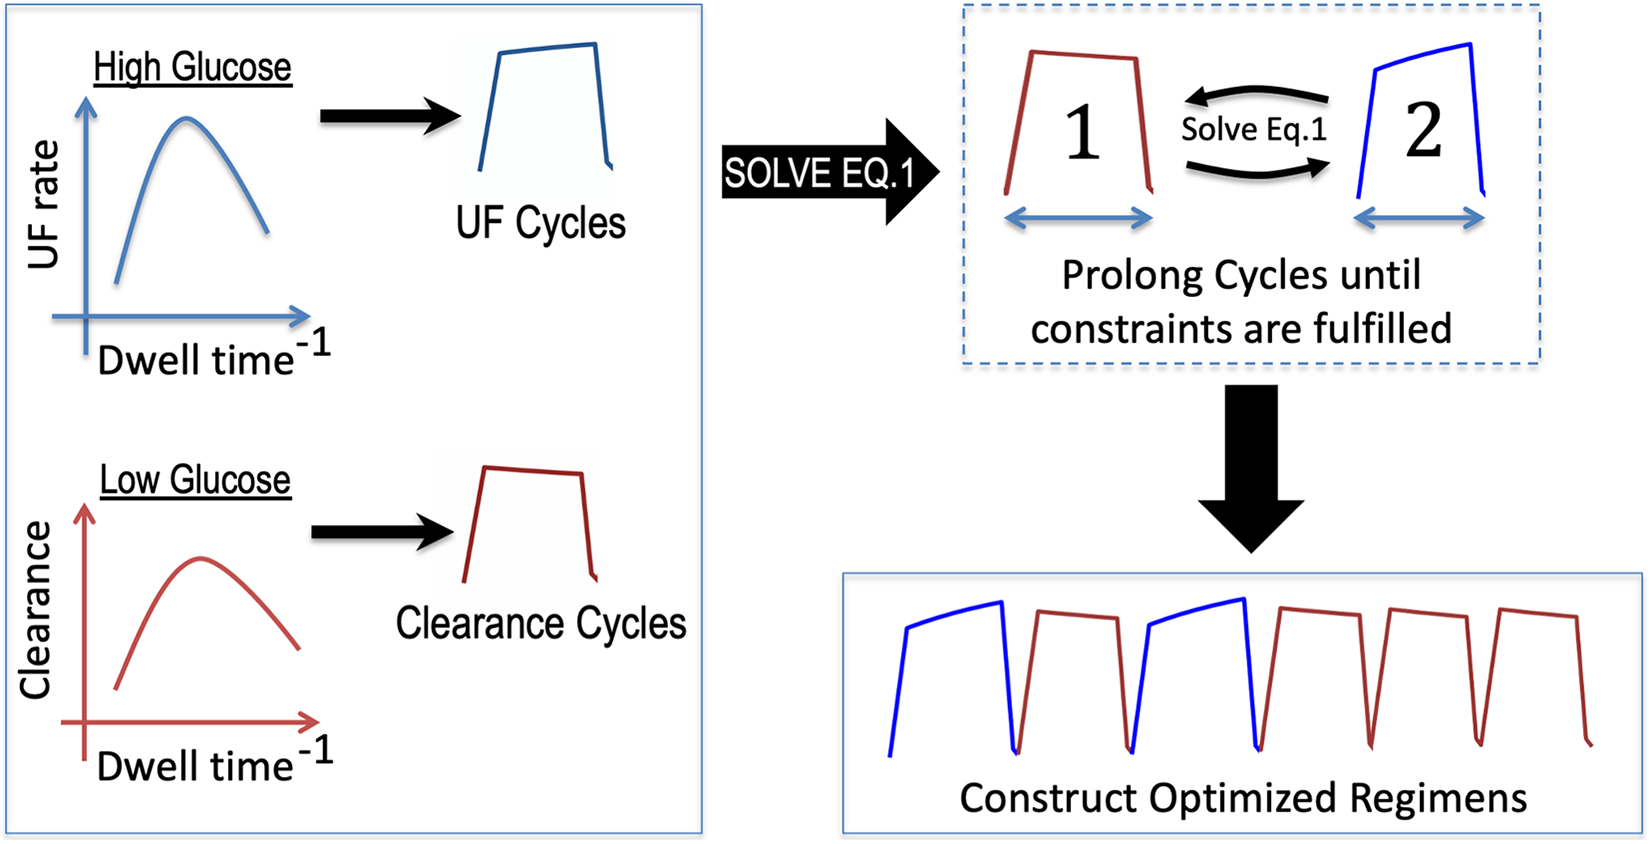
Basic principles of the optimization process. The extended 3PM is used to generate a spectrum of different dwell times. The solute clearance and UF rate are inversely correlated to the dwell time. 1 The optimal dwell times in terms of solute clearance and UF are selected for clearance cycles and UF cycles, respectively. If there are constraints (dashed line), for example, that the total treatment volume is limited to, for example, 12 L, the dwell time of the cycles is prolonged in a stepwise fashion, starting with the clearance cycle, and equation (1) is solved. When the constraint is fulfilled, an optimized regime is created using the obtained cycle times.
Intermittent regimens optimized for urea clearance and UF
To investigate the properties of intermittent APD regimens optimized for urea Kt/V and UF, simulations were performed using volume limitations of 12 and 16 L as well as a non-limited simulation (24 L) using a target Kt/V of 1.4 per week (APD session only) and a daily UF of 0.5 L (APD session only, does not include daytime treatments). The different optimized regimens were compared to two different reference prescriptions having very similar outcomes in terms of transport: 8 a 6 × 2 L 1.36% (Kt/V 1.38/w, UF 503 mL/day) regime or the adapted APD regime, as described by Fischbach et al. (Kt/V 1.41 per week, UF 501 mL/day). 12 In Figure 2(a), the intraperitoneal volume is plotted as a function of session time (h) for regimes using 0% and 3.86% glucose for the urea and UF cycles, respectively. In accordance with previous results, 1 the optimized bimodal regimens exhibit a markedly lower glucose absorption, being up to 40% lower compared to both the adapted and standard APD regimens. As can be seen, the 16 and 24 L optimized regimes also have shorter treatment times. The weekly creatinine and phosphate clearance for the optimized regimens, given in Table 2, were 10–15% lower compared to the non-optimized regimens. Also, a simulated regimen using a volume limitation of 10 L (i.e. lower than both reference regimes) exhibited lower glucose absorption despite a longer treatment time. Indeed, as a general trend, it would appear that lower total treatment volumes imply longer treatment times and vice versa. Despite the fact that stronger glucose solutions result in a higher free water clearance 13,14 and, as a consequence, lower NaR per dL UF, the NaR for optimized bimodal regimens was only slightly (approximately 5%) smaller in relation to adapted and standard APD (Table 2). Indeed, most of the sodium transport is convective (approximately 80%) 13 and, therefore, for regimes giving a similar amount of UF, the NaR should be similar.
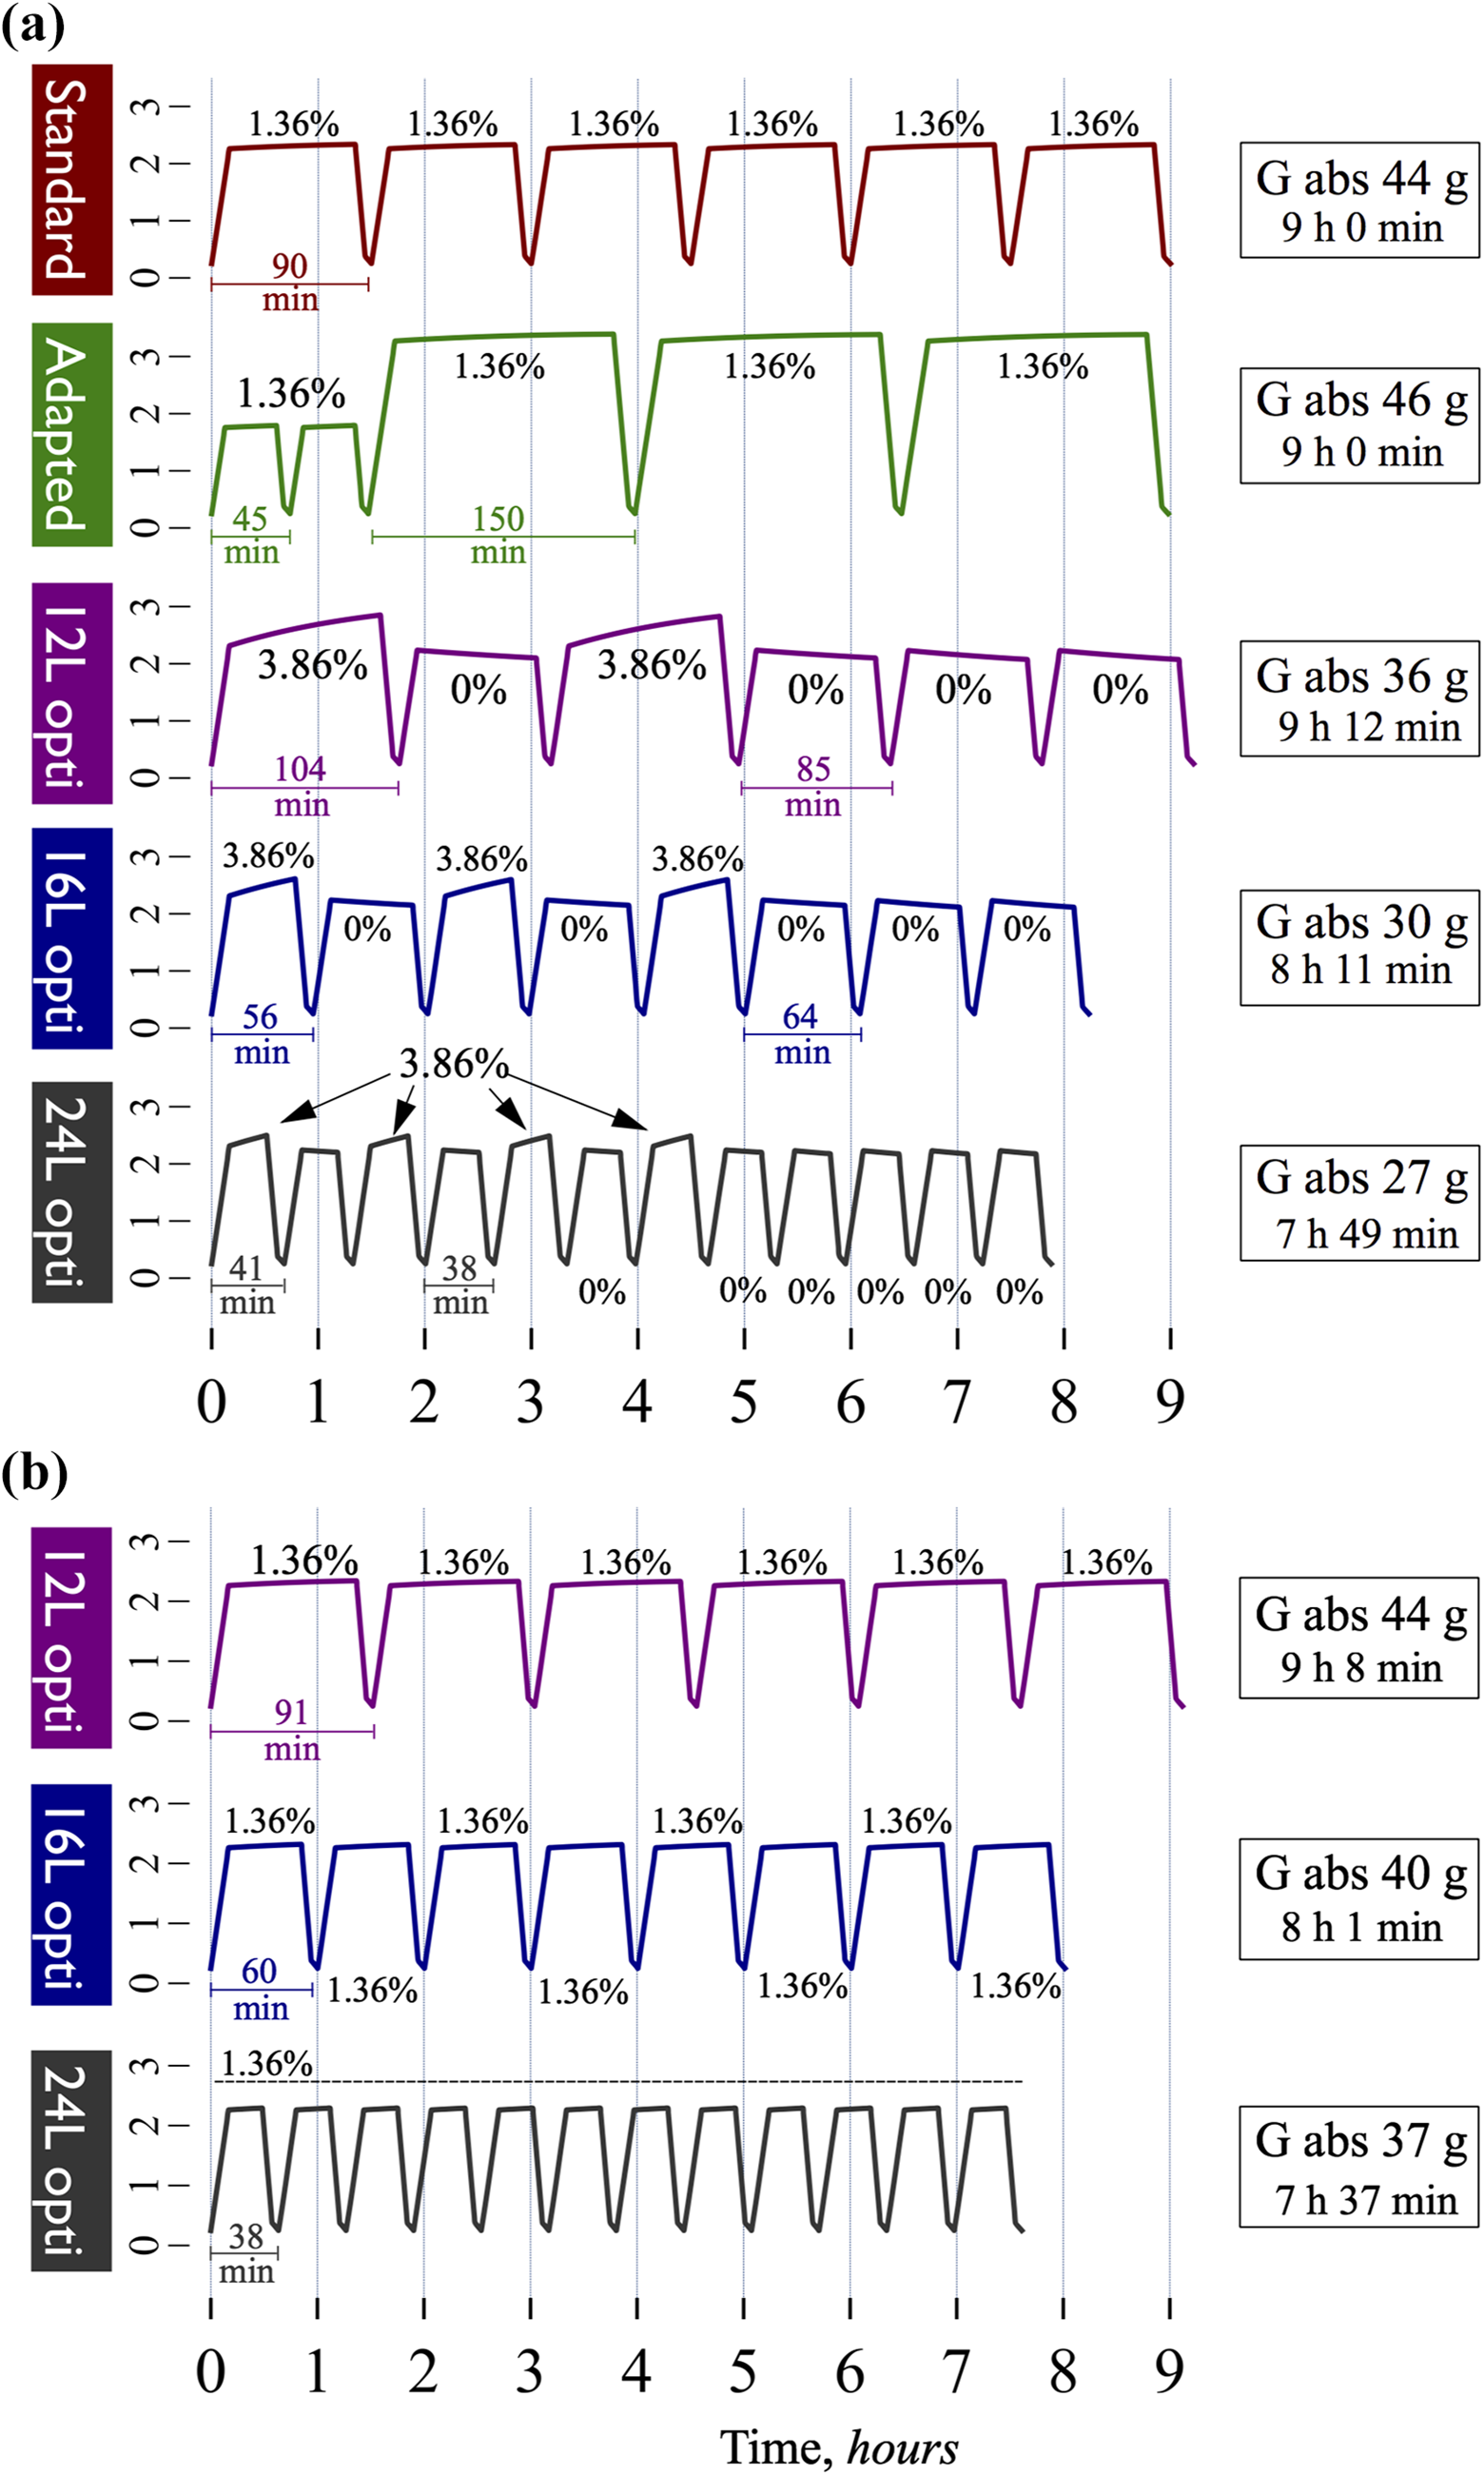
Optimized intermittent APD regimens with urea cycles and UF cycles result in marked reductions in glucose absorption (G.abs.) and treatment time. (a) A standard 12 L (6 × 2 L) 1.36% prescription (red line) and an adapted 12 L APD prescription (green line) compared with optimized intermittent APD regimens using 0% glucose for the urea cycles and 3.86% glucose for the UF cycles. All regimes resulted in a weekly urea Kt/V of approximately 1.4 and a daily UF of approximately 0.5 L. NaR, creatinine and phosphate clearance as well as other details can be found in Table 2. (b) Intermittent optimized regimes using 1.36% glucose. No UF cycles were needed to attain the target UF of 0.5 L. See also Table 2 for more details.
Intermittent regimens giving a weekly urea Kt/V of 1.4 and daily UF of 0.5 L.
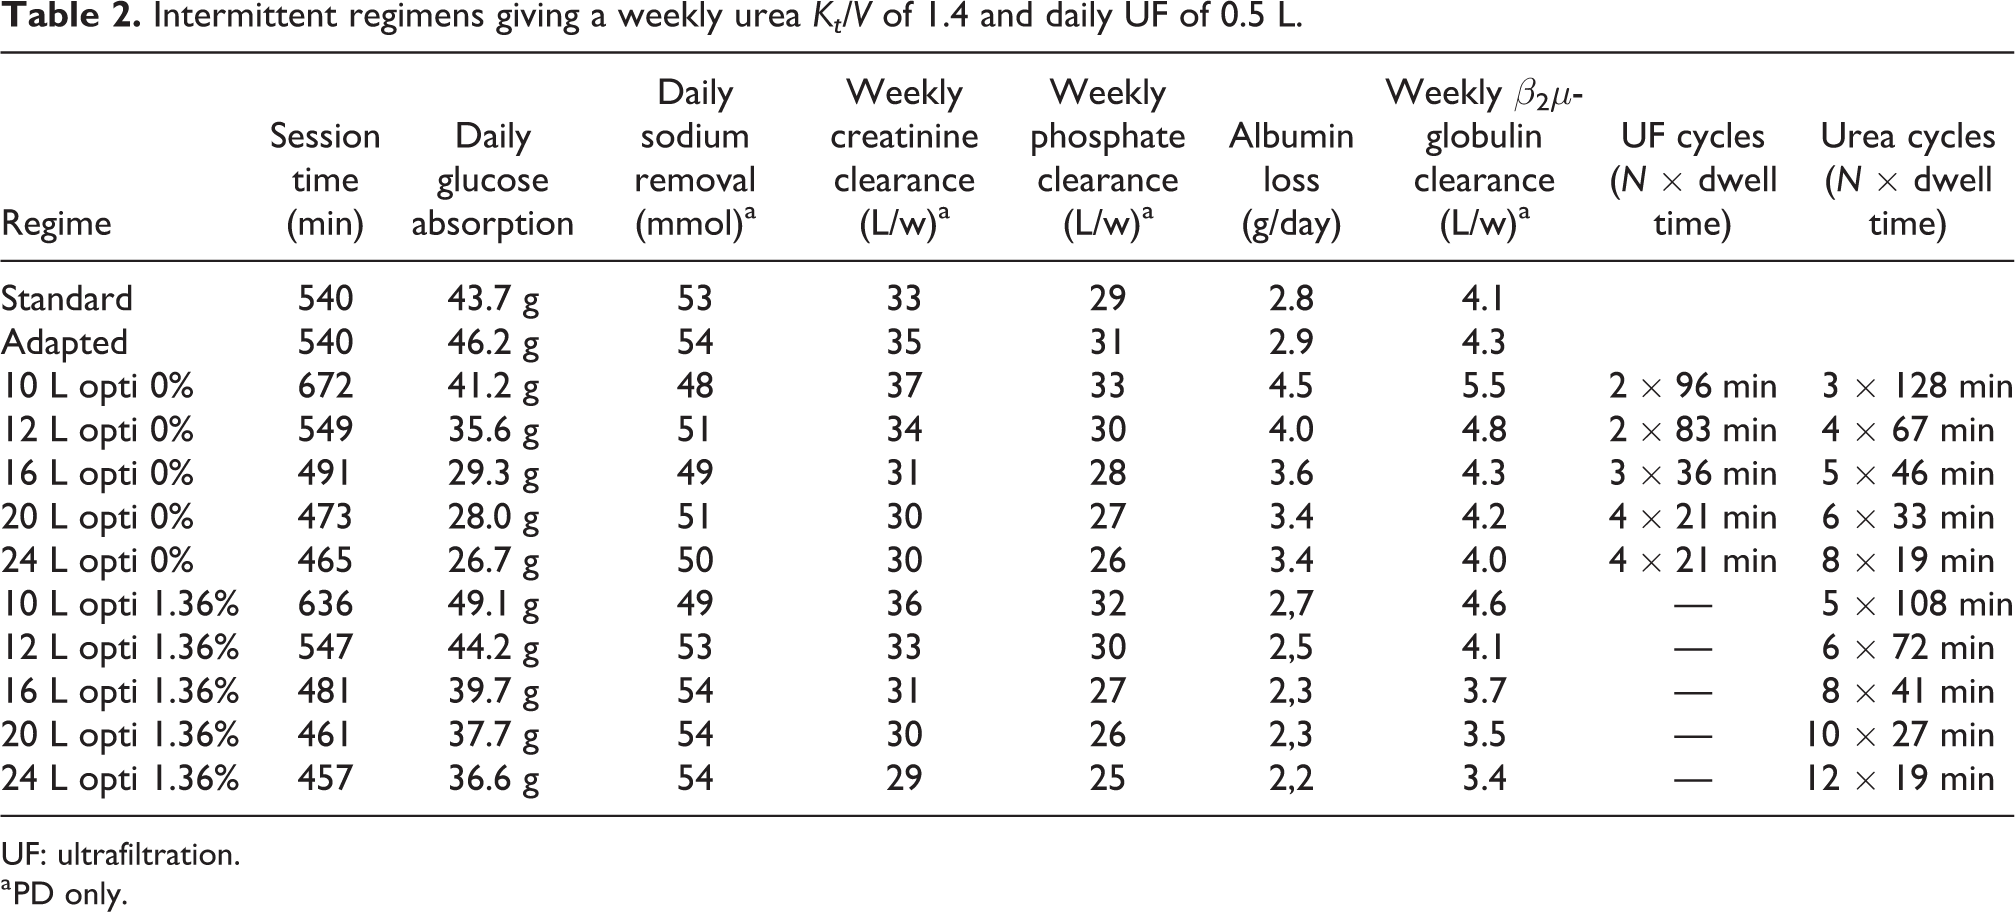
UF: ultrafiltration.
a PD only.
Since 0% glucose solutions are currently not available, the author also performed simulations of intermittent regimens using 1.36% glucose for the urea cycles, which are shown in Figure 2(b). Again, the optimized regimes display a lower glucose absorption, being up to approximately 20% lower compared to the non-optimized regimes, and shorter treatment times, being as short as 7 h 37 min for the 24 L regime. In these simulations, there are no UF cycles since the urea cycles themselves provide an adequate amount of UF to reach the target of 0.5 L. As given in Table 2, the NaR was here higher than that in the 0% intermittent regimens, which is mainly due to the fact that 0% cycles exhibit a negative NaR (i.e. a net gain of sodium) and that 1.36% cycles have a lower free water transport compared to 3.86% cycles 14 and thus give a higher NaR/dL UF.
Tidal regimens optimized for urea Kt/V and UF
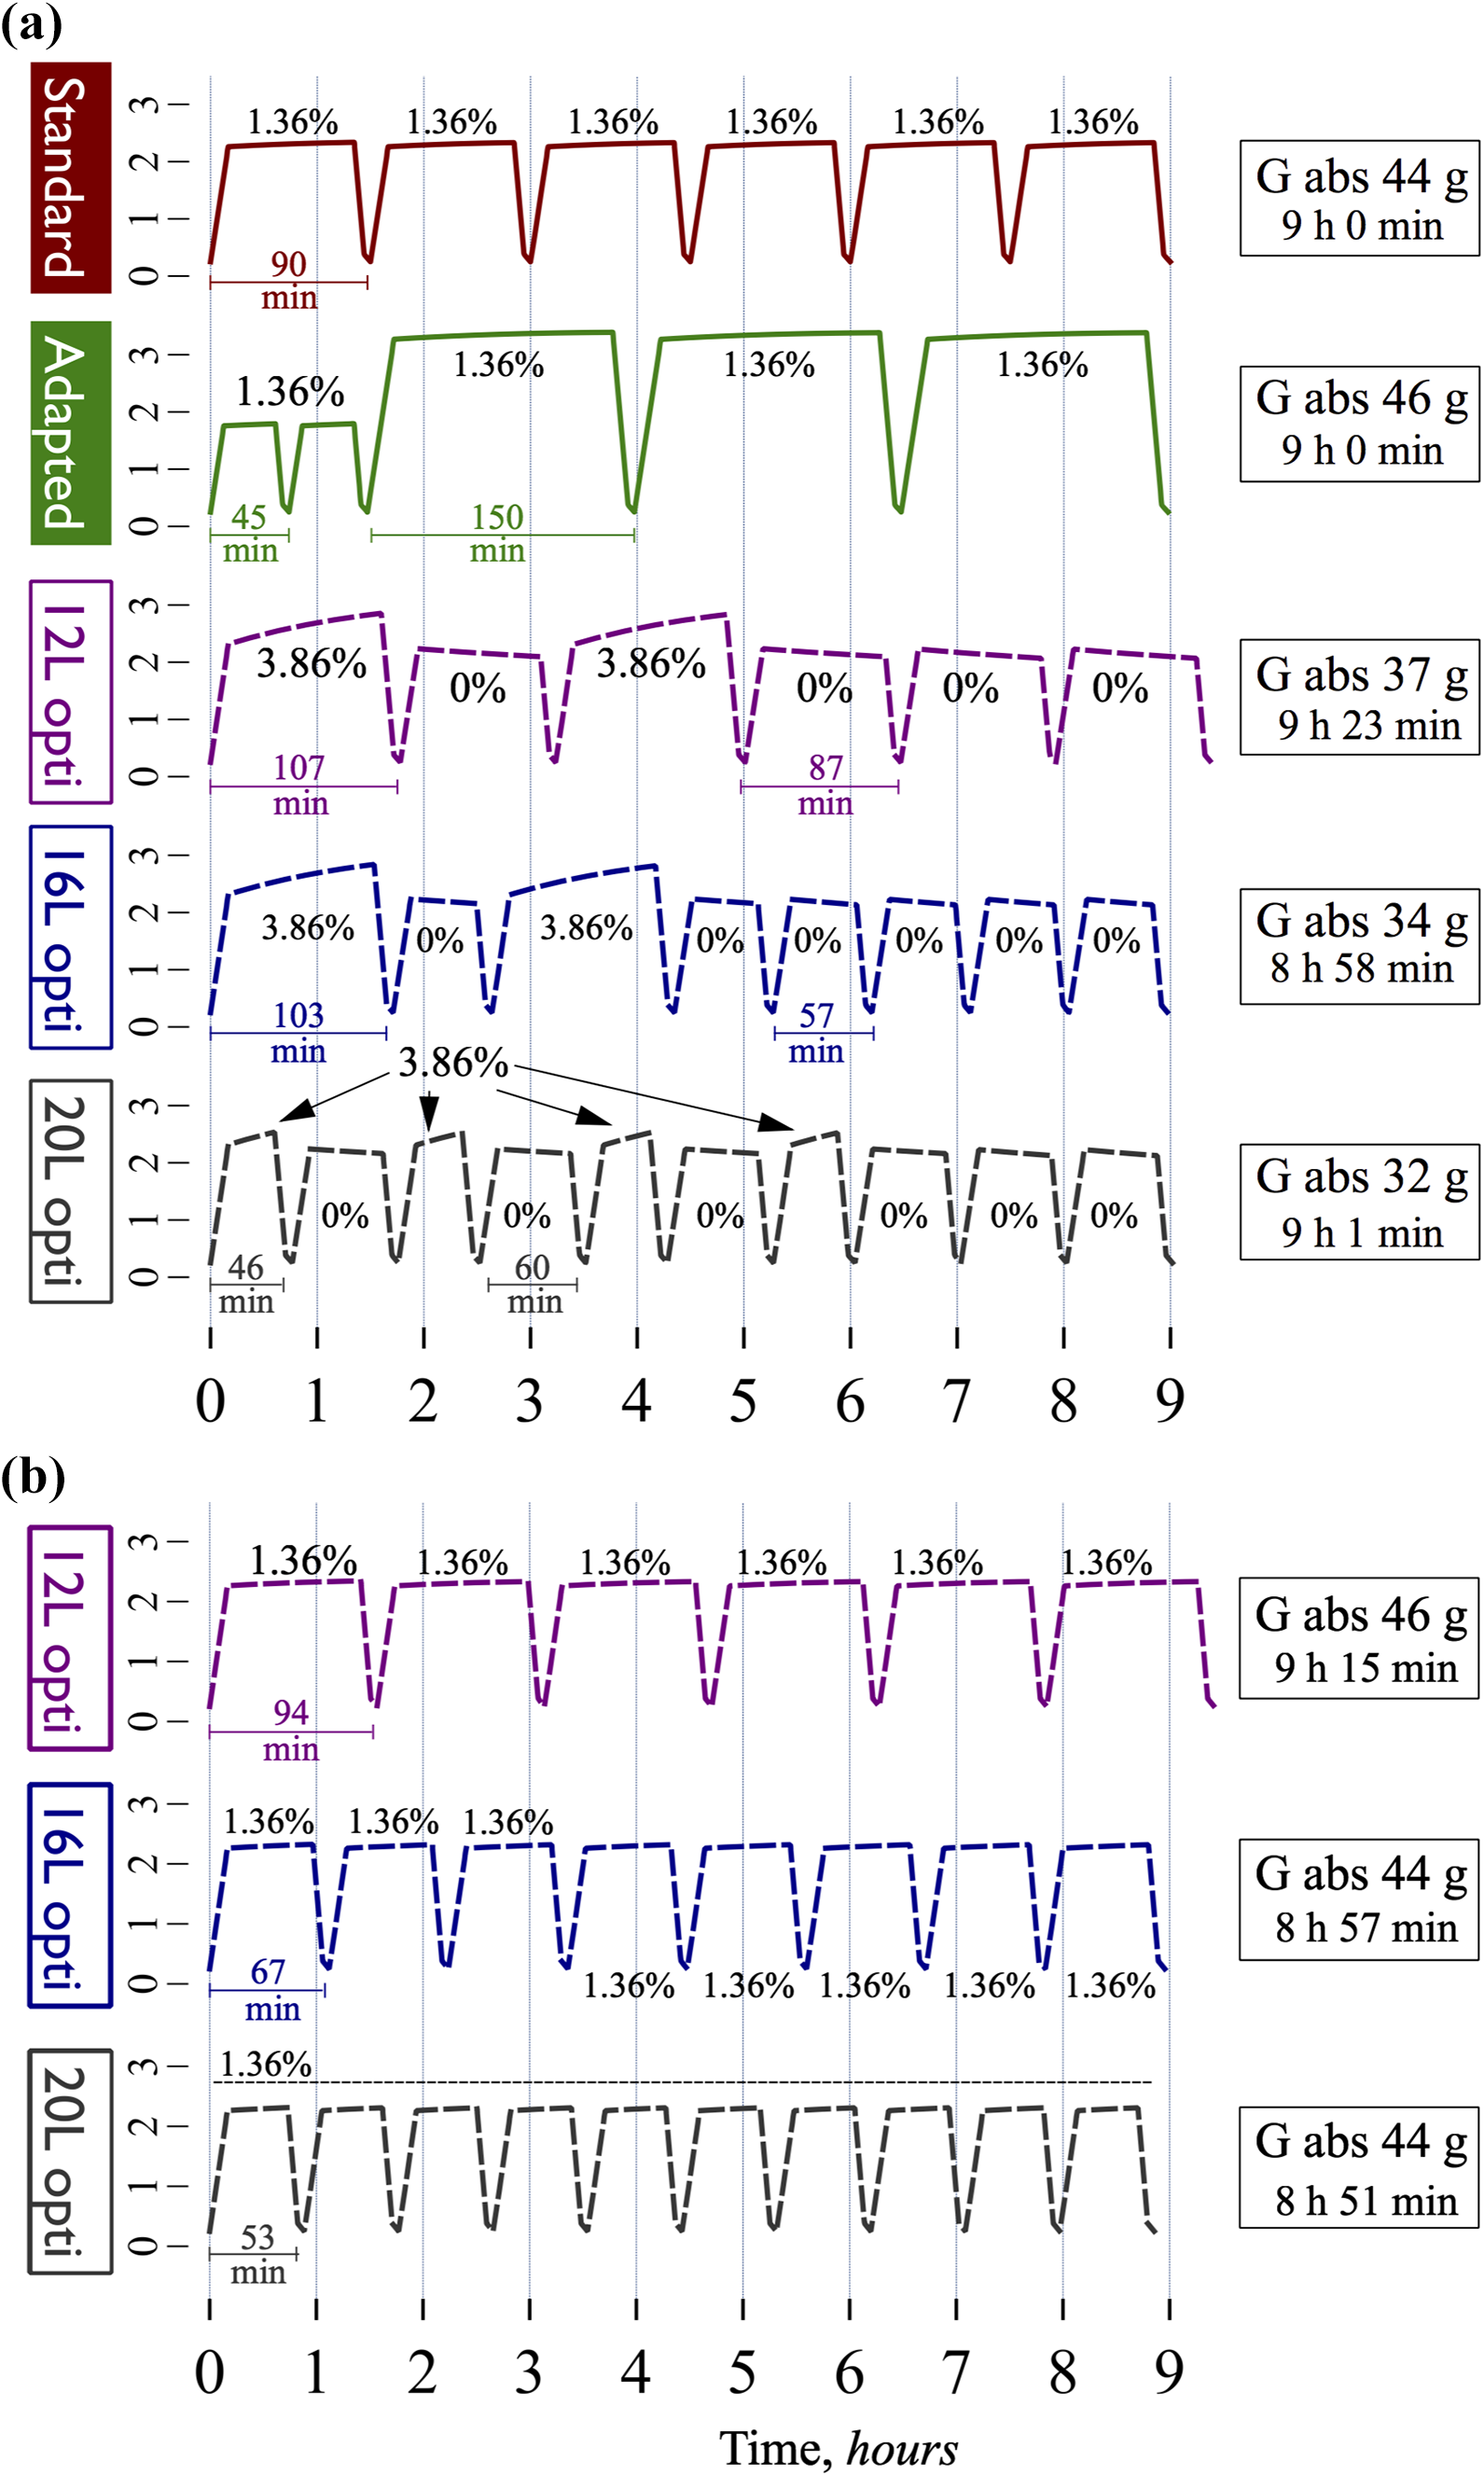
According to our previous results, 1 for intermittent APD (full drain every cycle), there is little benefit in using a dialysate flow rate exceeding 3–4 L/h which, according to the current results, seems to hold true also for optimized APD. Apparently, at higher flow rates, too much time is spent filling and draining the peritoneal cavity if intermittent exchanges are applied. The situation is different for tidal APD, where higher DFRs can be beneficial for both UF and solute clearance. 1 Simulations were therefore performed for 50% tidal APD using no volume limitation (40 L) and volume limitations of 20 and 30 L. The IPV versus time curves are displayed in Figure 3. There was little benefit in terms of treatment time to increase the volume from 30 L to 40 L but the glucose absorption was reduced by approximately 15% from 27 g to 23 g per session (compared to 46 g/session for adapted APD).
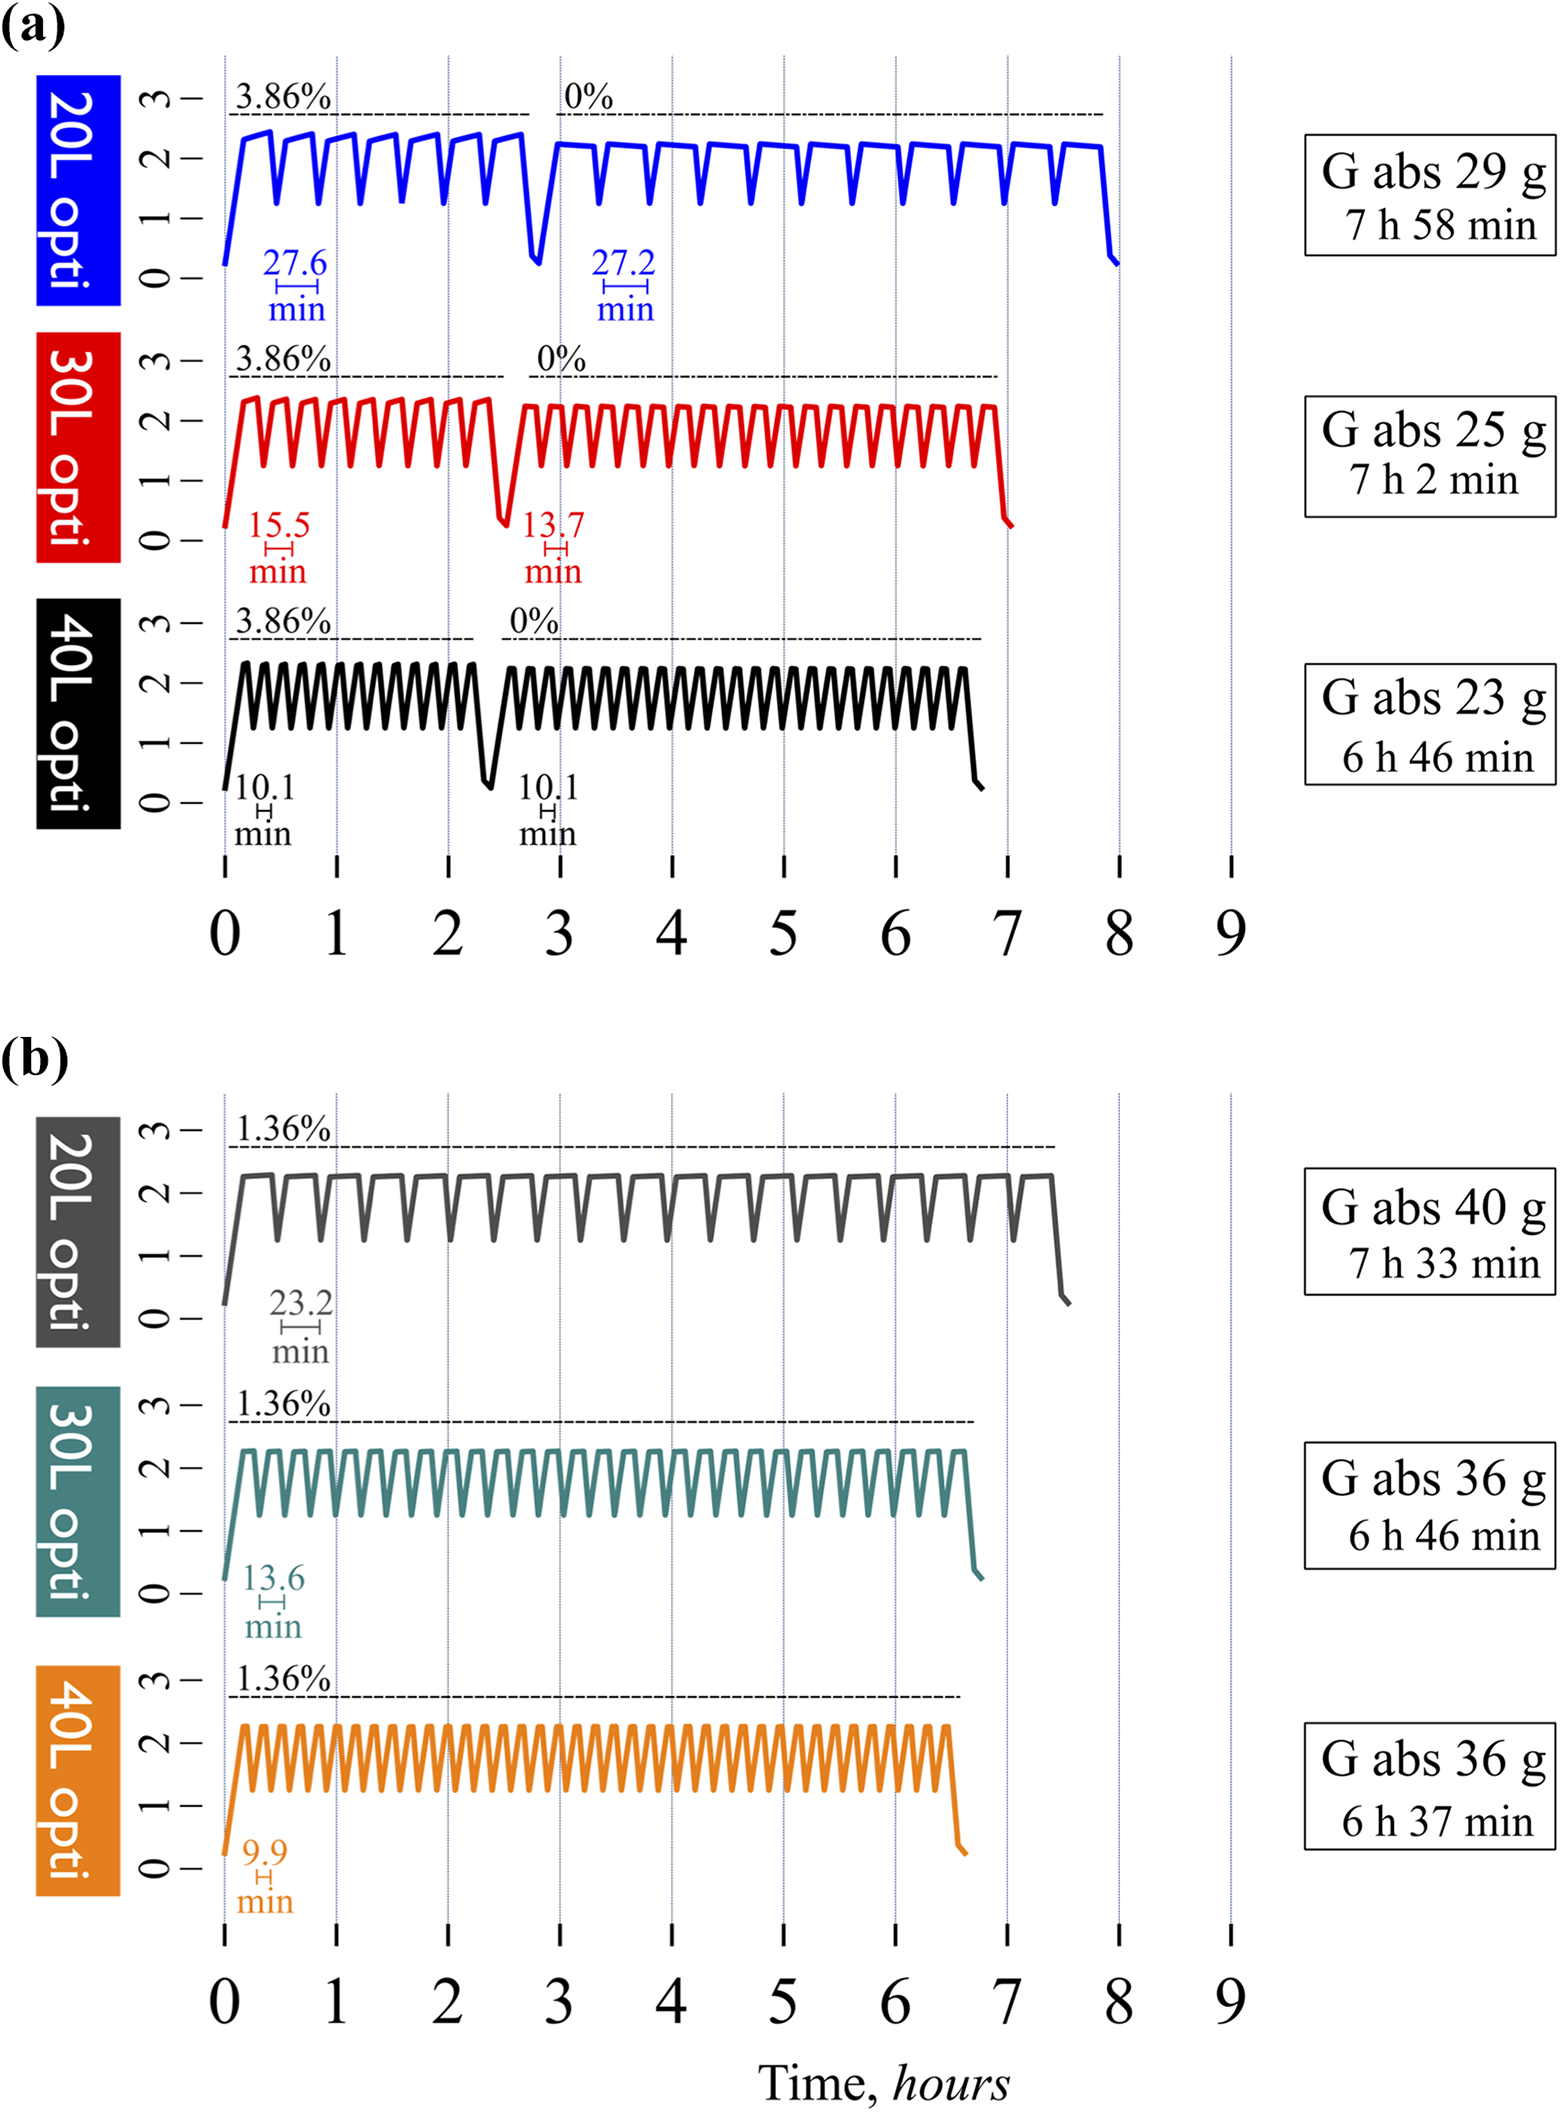
Optimized tidal APD regimens with urea cycles and UF cycles further enhance treatment time and glucose economy. (a) Optimized 50% tidal APD treatments using 0% glucose for the urea cycles and 3.86% glucose for the UF cycles. All regimes resulted in a weekly urea Kt/V of approximately 1.4 and a daily UF of approximately 0.5 L. See details in Table 3. (b) Optimized 50% tidal regimens using 1.36% glucose for the urea cycles and 3.86% glucose for the UF cycles. No UF cycles were needed to attain the target UF of 0.5 L. APD: automated peritoneal dialysis; UF: ultrafiltration.
50% Tidal regimens giving a weekly urea Kt/V of 1.4 and daily UF of 0.5 L.
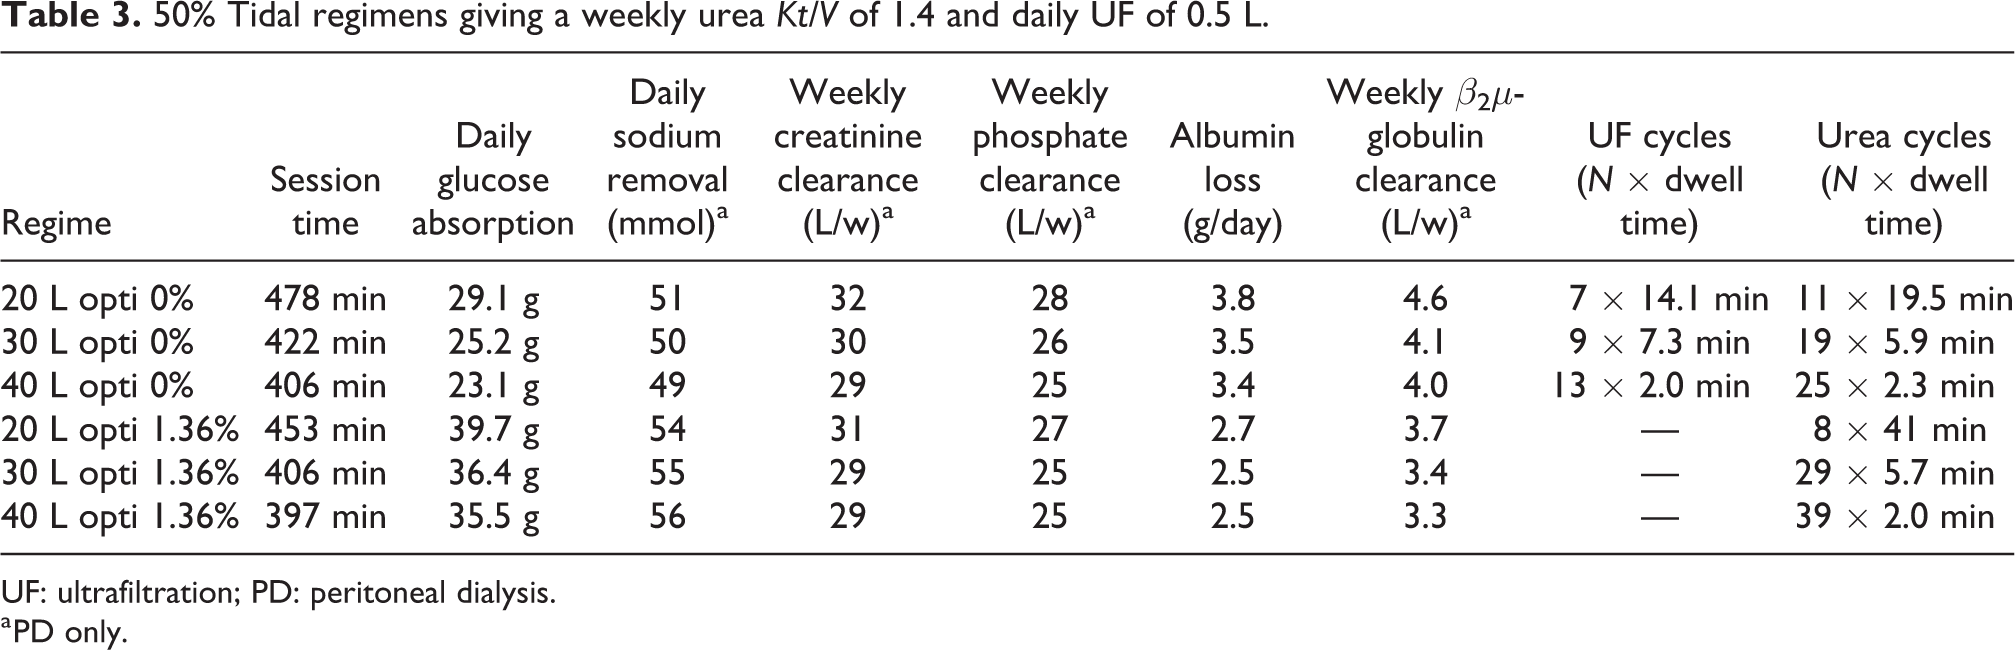
UF: ultrafiltration; PD: peritoneal dialysis.
a PD only.
Intermittent and tidal regimens optimized for weekly creatinine clearance and UF
While the urea-based optimization scheme provided superior reductions in glucose absorption and total treatment time, such regimens did however exhibit a lower creatinine and phosphate removal. Creatinine-based optimization was therefore performed using a target weekly creatinine clearance of 35 L (PD only) and a target daily UF of 0.5 L, again similar to the standard and adapted APD regimes (which give 33 and 35 L/week, respectively, see Table 2). As shown in Figure 4, creatinine-based optimization also exhibited marked reductions in glucose absorption being up to approximately 30% lower compared to the non-optimized regimes. Compared to the regimes optimized using urea cycles, these regimes are longer in duration, being at least as long as the non-optimized cases. Also, going from 16 L to 20 L gives nearly the same results except for a lower glucose absorption. To investigate whether tidal exchanges could decrease the total treatment time for the creatinine-based optimized regimes, the author performed simulations shown in Figure 5(a) (0% glucose) and Figure 5(b) (1.36% glucose). Using 50% tidal, the total treatment time could be reduced compared to the non-optimized prescriptions by nearly an hour while also giving large reductions in glucose absorption. Similar to the intermittent cases, it appears that little is gained (in terms of a shorter treatment time) by increasing the treatment volume from 30 L to 39 L.
Optimized intermittent APD regimens with creatinine cycles and UF cycles result in marked reductions in glucose absorption (G. abs.) but no improvement in treatment time. (a) A standard 12 L (6 × 2 L) 1.36% prescription (red line) and an adapted 12 L APD prescription (green line) compared with optimized intermittent APD regimens using 0% glucose for the creatinine cycles and 3.86% glucose for the UF cycles. All regimes resulted in a weekly creatinine clearance of approximately 35 L and a daily UF of approximately 0.5 L. NaR, urea Kt/V and phosphate clearance as well as other parameters can be found in Table 4. (b) Intermittent optimized regimes using 1.36% glucose for the creatinine cycles and 3.86% glucose for the UF cycles. No UF cycles were needed to attain the target UF of 0.5 L. See also Table 4 for more details.
Intermittent regimens giving a weekly creatinine clearance of 35 L and daily UF of 0.5 L.
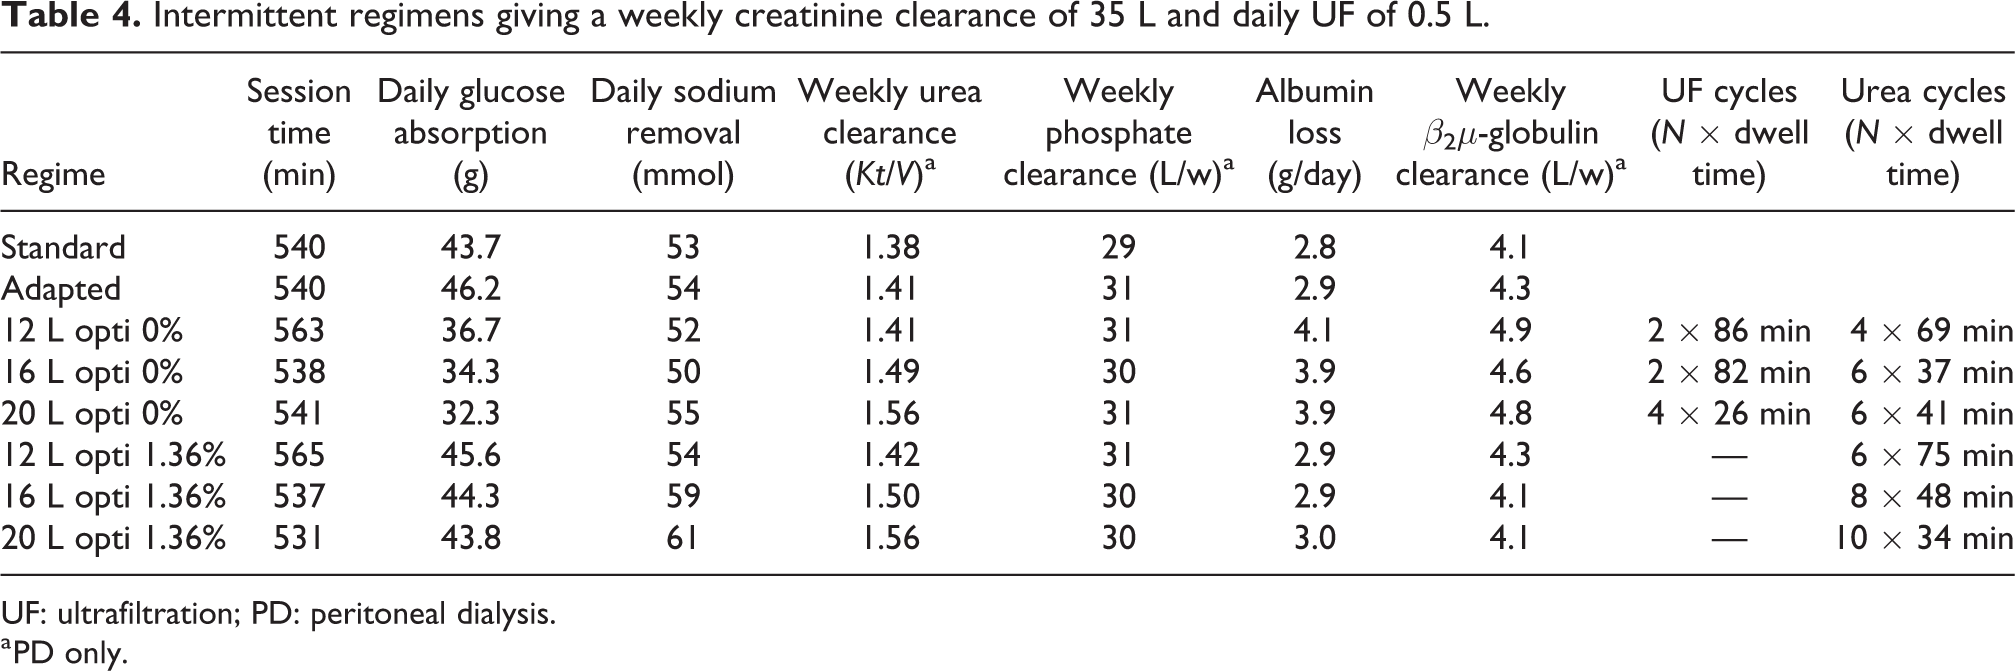
UF: ultrafiltration; PD: peritoneal dialysis.
a PD only.
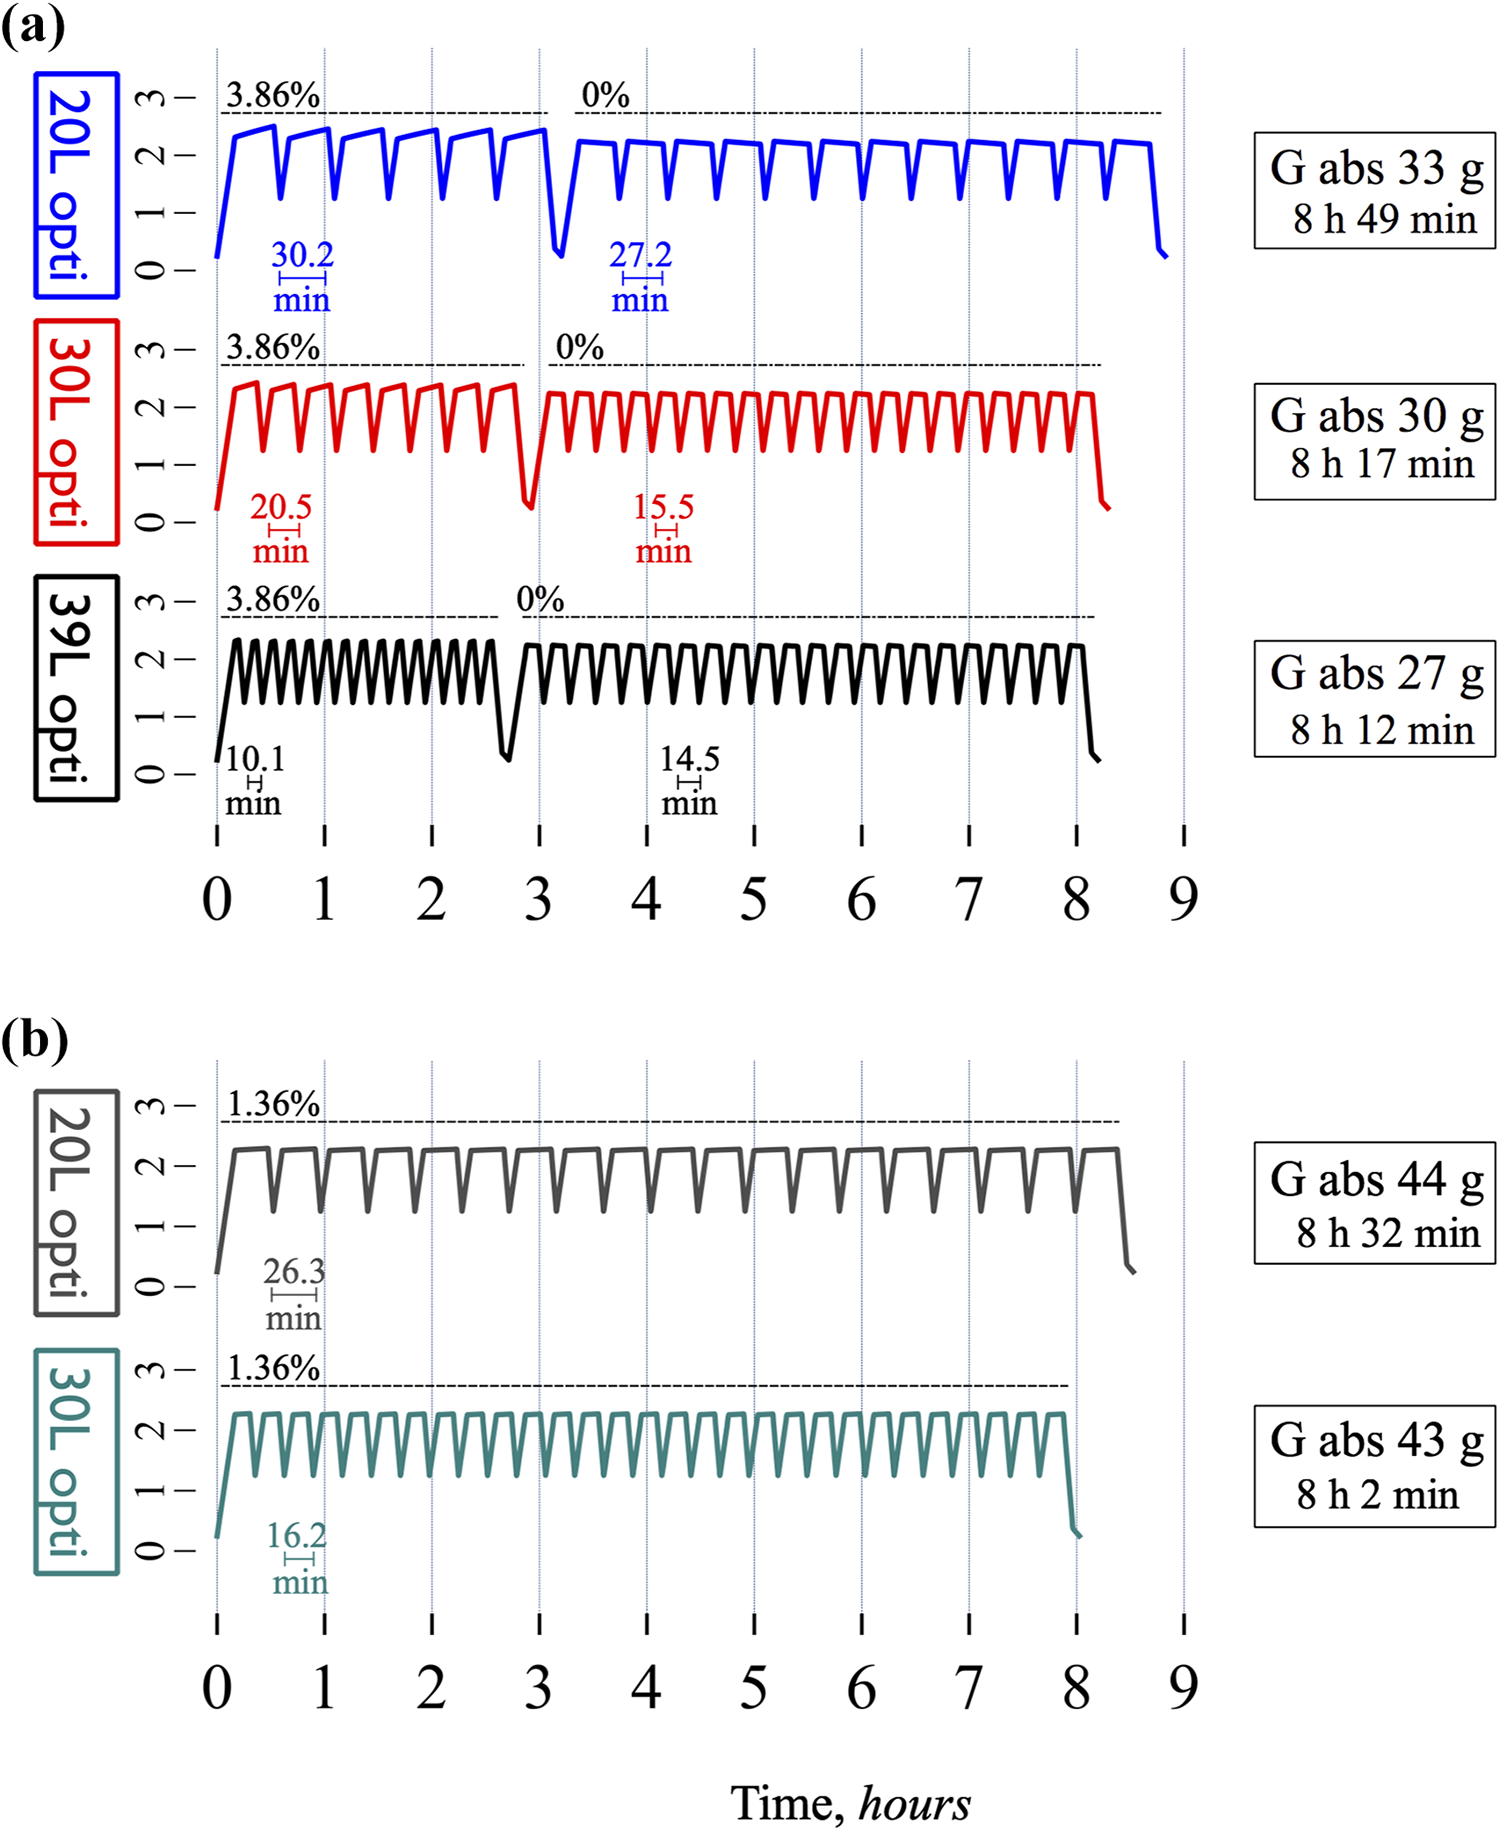
Optimized tidal APD regimens with creatinine cycles and UF cycles further decrease glucose absorption and treatment times. (a) Optimized 50% tidal APD treatments using 0% glucose for the creatinine cycles and 3.86% glucose for the UF cycles. All regimes resulted in a weekly creatinine clearance of 35 L and a daily UF of approximately 0.5 L. See details in Table 5. (b) Optimized 50% tidal regimens using 1.36% glucose for the urea cycles and 3.86% glucose for the UF cycles. No UF cycles were needed to attain the target UF of 0.5 L.
50% Tidal regimens giving a weekly creatinine clearance of 35 L and daily UF of 0.5 L.
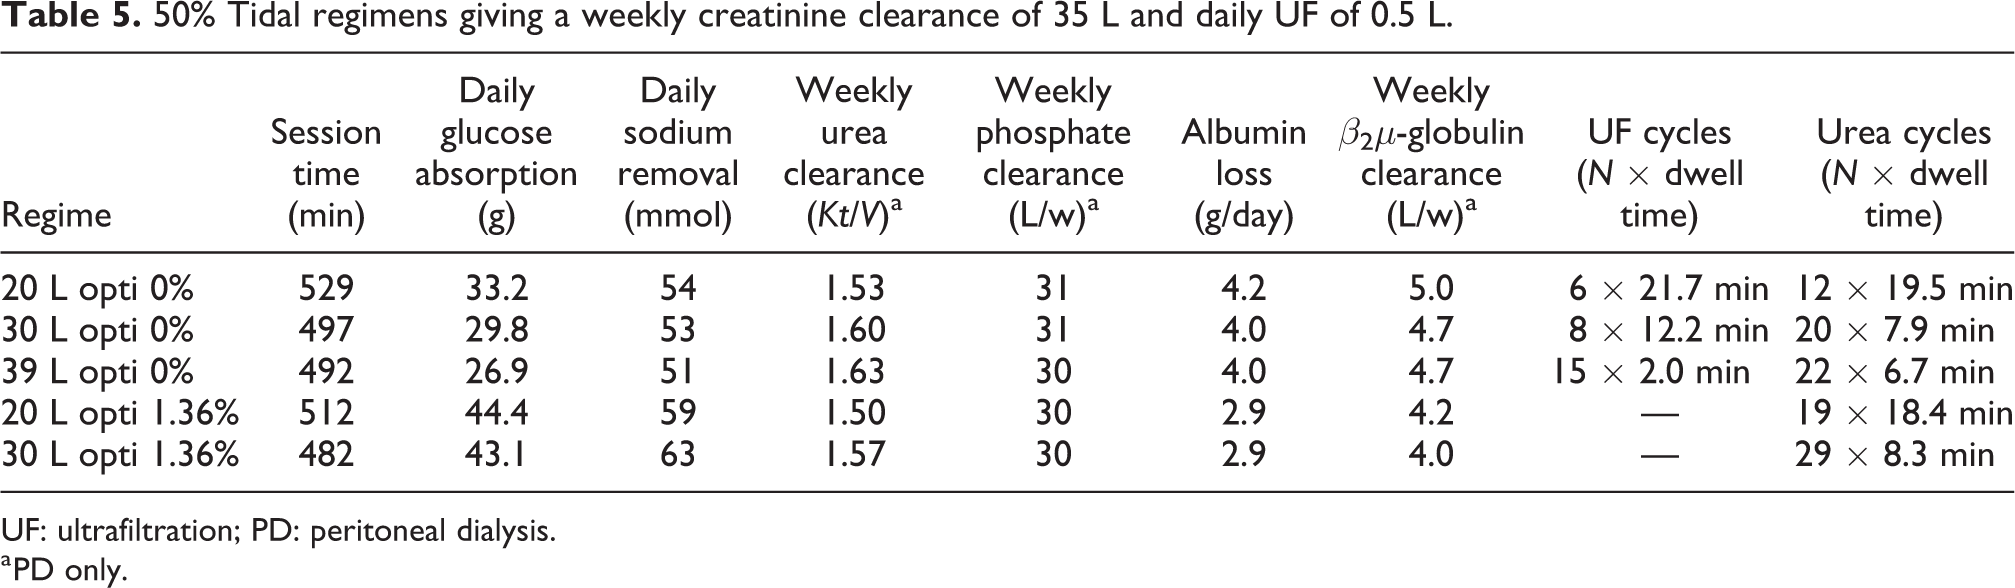
UF: ultrafiltration; PD: peritoneal dialysis.
a PD only.
Varying the fill volume between clearance and UF cycles
So far, the author has only used a fill volume of 2 L for the optimized regimes. To explore the possible benefits of a higher fill volume, he performed simulations using fill volumes chosen so that the IPP was below 13 cm H2O at all times, leading to a fill volume of 2400 mL for high-glucose dwells and 2800 mL for low-glucose dwells corresponding roughly to 1200 mL per m2 body surface area (BSA) and 1400 mL/m2 BSA, respectively. The latter fill volume is high compared to those usually prescribed, but the 0% glucose solution ensures that the IPV will not increase further after infusion. In Figure 6(a), the IPV as a function of time is plotted for three different intermittent regimes having total treatment volumes of 15.6, 20.8 and 23.6 L (unlimited). As can be seen, using the intermittent technique with higher fill volumes made it possible to shorten the treatment time by more than 1 h compared to using a 2 L fill volume (c.f. Figure 3(a), bottom regime). Optimized regimes using the higher fill volumes for 50% tidal exchanges are shown in Figure 6(b). The high-flow 39.4 L regime is about 1.5 h shorter than a standard regime and leads to a glucose absorption of only 27 g (i.e. approximately 40% reduction compared to the non-optimized regimes). As given in Table 6, this latter regime has essentially the same NaR and phosphate clearance as the standard 9 h regime. On the other hand, the high-flow regime leads to an additional loss of 1.2 g albumin daily. As seen, the 32.8 and 19.8 L regimes also provide large improvements in metabolic cost and, in comparison to the 2 L fill volume optimized regimes shown in Figure 4(a), the treatment time is considerably shorter.
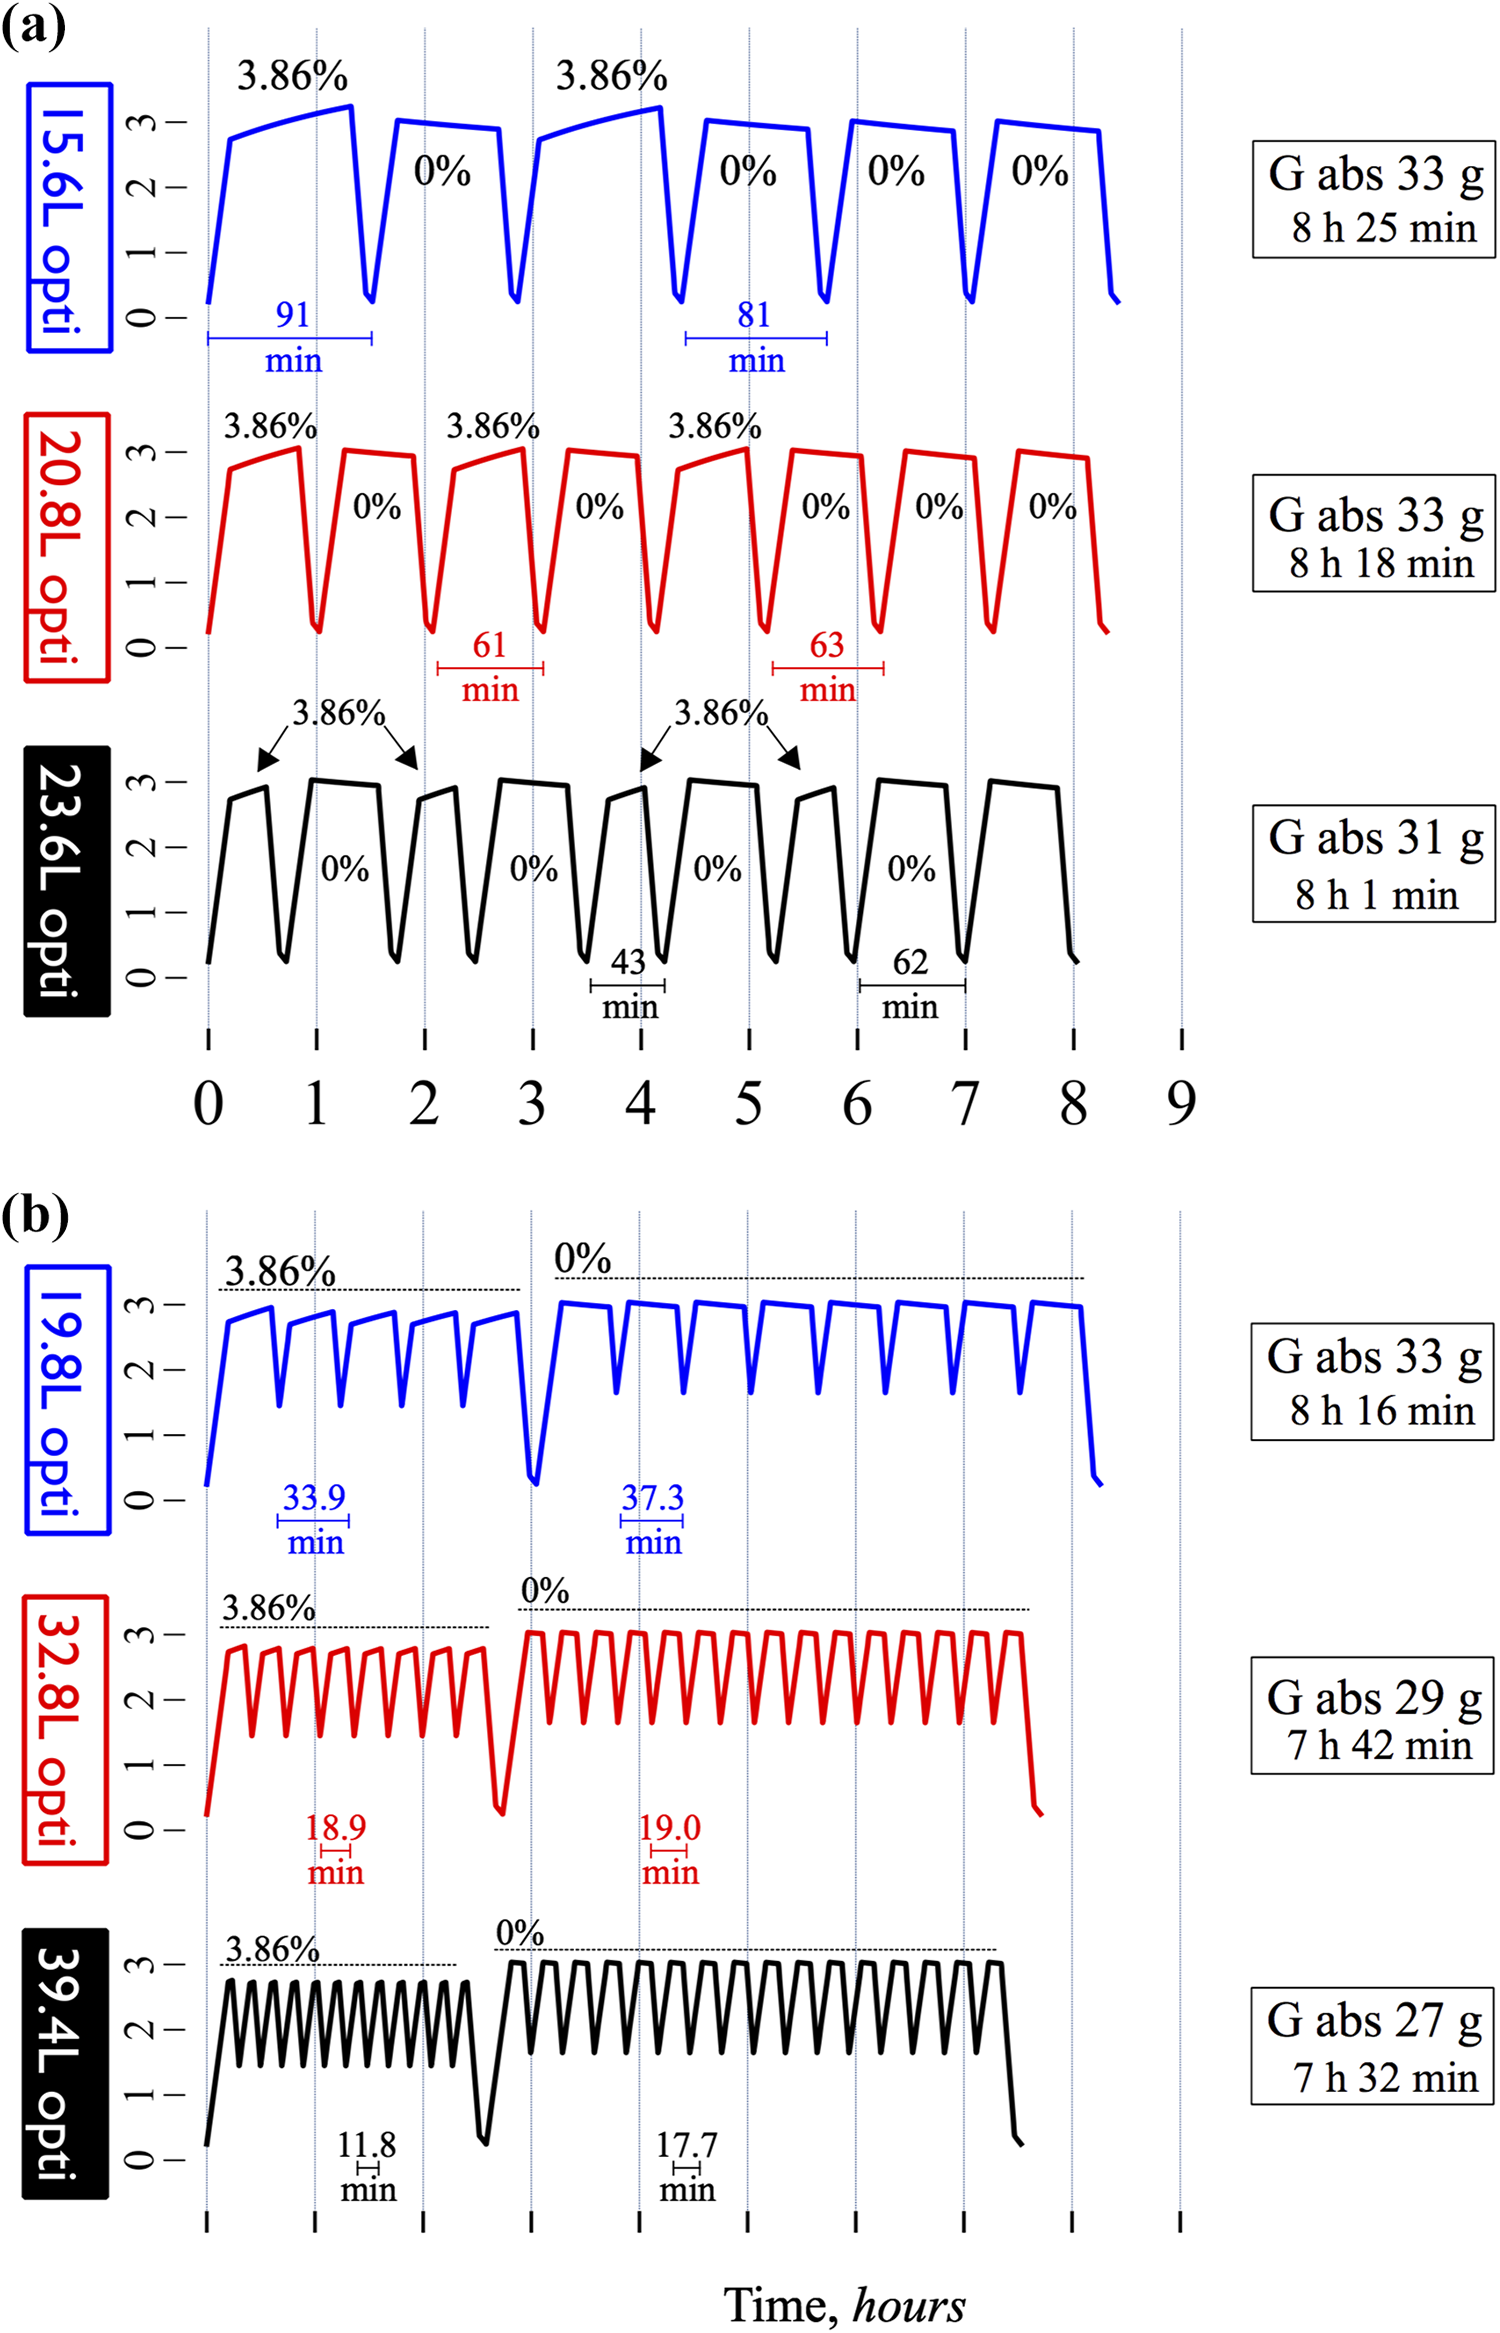
Higher fill volumes decrease glucose absorption and treatment time for both intermittent and tidal optimized APD regimens. (a) Optimized intermittent APD treatments using 0% glucose and fill volume of 2.8 L for the creatinine cycles and 3.86% glucose and a fill volume of 2.4 L for the UF cycles. All regimes resulted in a weekly creatinine clearance of 35 L and a daily UF of approximately 0.5 L. See details in Table 6. B: Optimized 50% tidal regimens using 1.36% glucose for the urea cycles and 3.86% glucose for the UF cycles. No UF cycles were needed to attain the target UF of 0.5 L.
Increased fill volume regimens giving a weekly creatinine clearance of 35 L and daily UF of 0.5 L.
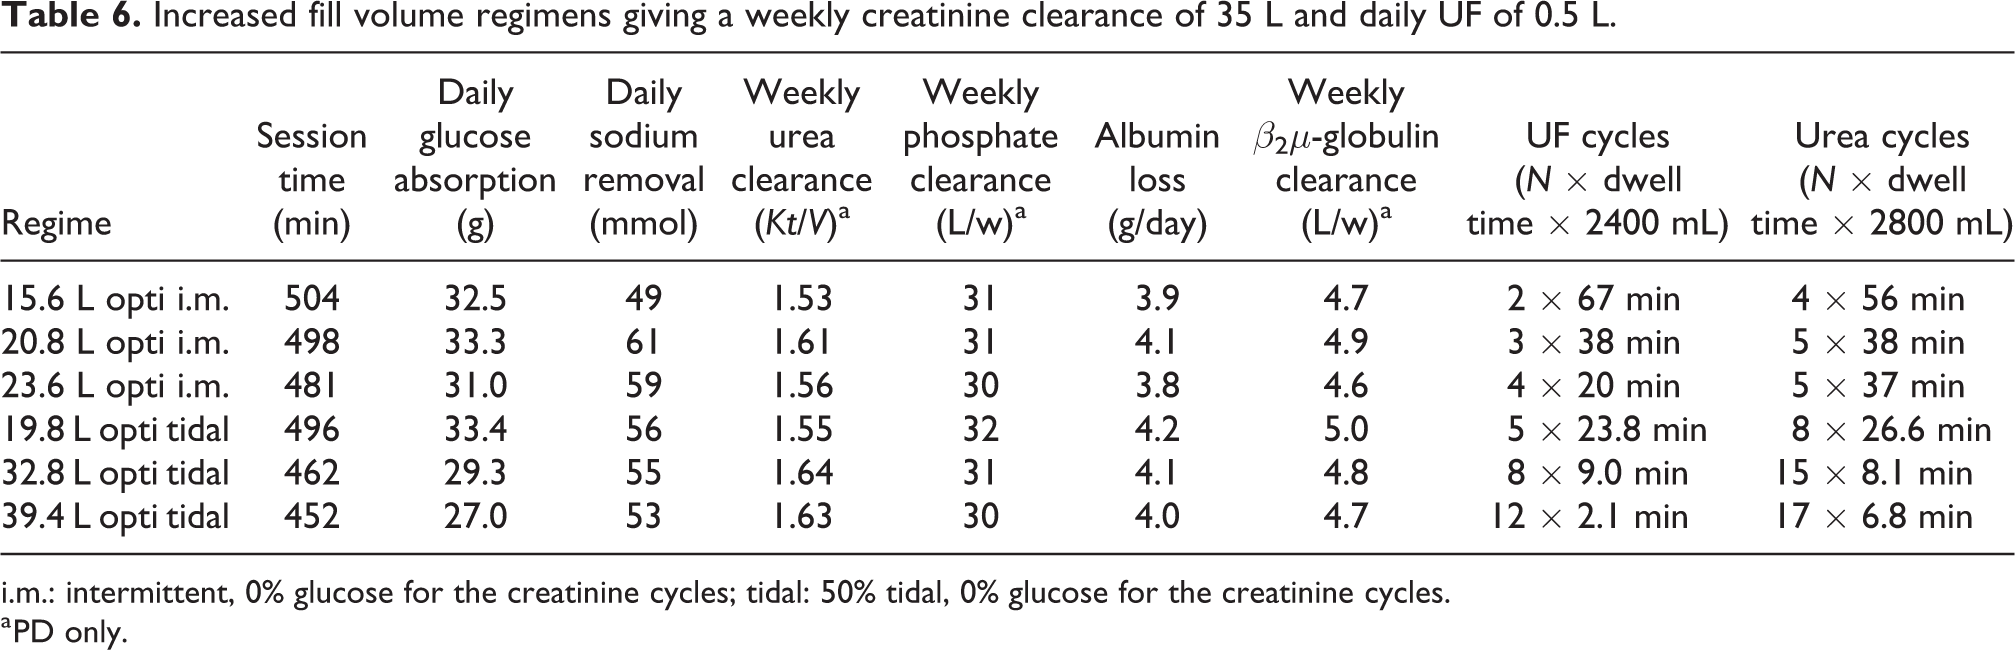
i.m.: intermittent, 0% glucose for the creatinine cycles; tidal: 50% tidal, 0% glucose for the creatinine cycles.
a PD only.
Optimized APD regimens based on peritoneal transport status, residual kidney function and urea distribution volume
Setting the clinical goals to a weekly Kt/V urea >2.0 and daily UF of 1 L, the optimization model was used to generate a spectrum of optimized nightly APD regimens based on the urea distribution volume (Vd) of the patient (Table 7). Similar to the study by Akonur et al., 15 patients were divided into three volume categories: Small < 36 L (30 L), average 34–46 L (40 L) and large > 46 L (50 L); four categories of residual kidney function (RKF): 0, 2, 4 and 6 mL/min and four arbitrary peritoneal transport categories: slow (PET 4-h D/P creatinine 0.52), slow-average (PET 4-h D/P creatinine 0.64), fast-average (PET 4-h D/P creatinine 0.75) and fast (PET 4-h D/P creatinine 0.84). As given in Table 7, when the RKF is low, the sessions tend to have an unfeasibly long duration for a nightly treatment. In such cases, regimes for a higher RKF could be used, and daytime treatments could be added, each giving about 1–2 mL/min in urea clearance per dwell. Thus, adding 2 day time dwells allows to add at least 2 mL/min in RKF in Table 7. Even so, it is apparent that slow- or slow-average patients with no RKF and a large Vd will have difficulties achieving these goals.
Optimized regimes based on transport status, residual kidney function and urea distribution volume.
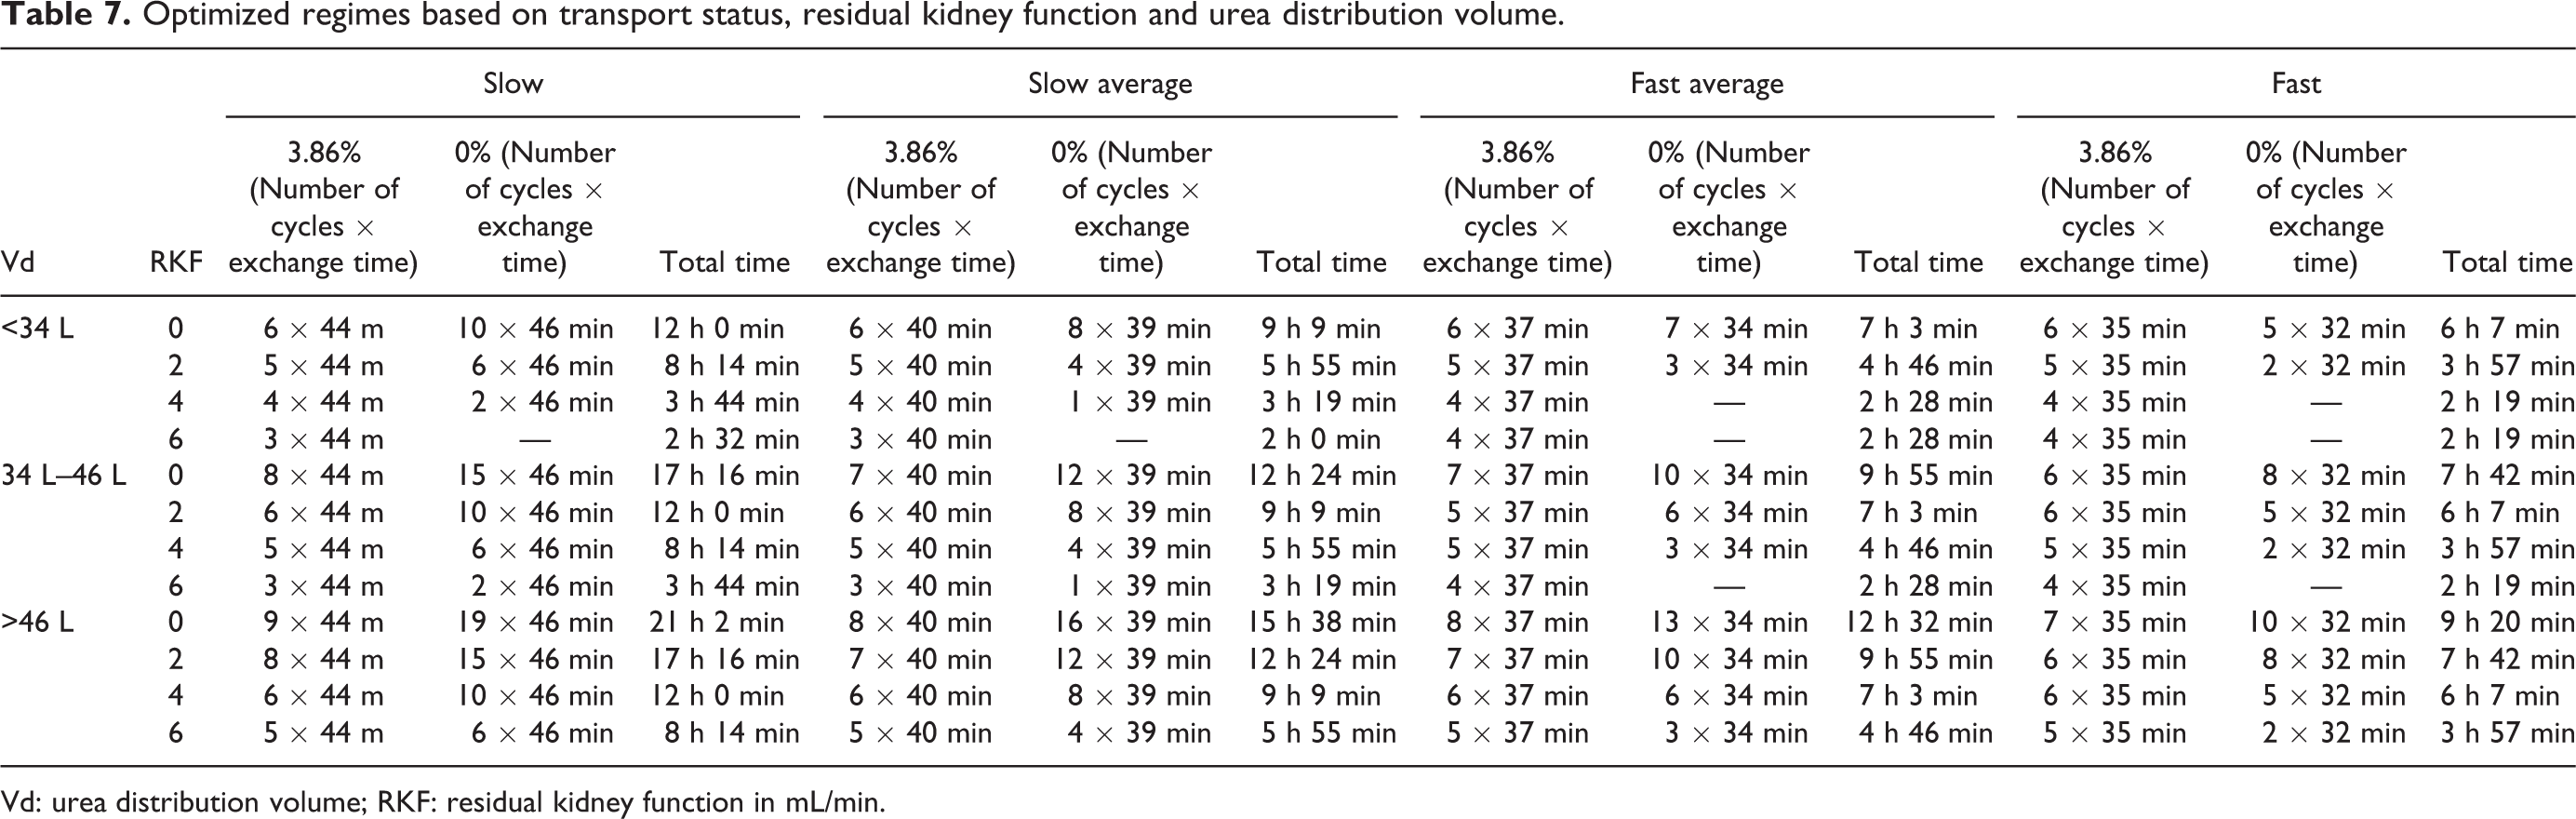
Vd: urea distribution volume; RKF: residual kidney function in mL/min.
Discussion
The present computer simulations of 3PM optimized APD are the first of its kind and show that reductions in glucose absorption and treatment time can be achieved using a bimodal prescription technique, where optimal dwell times, estimated from the extended 3PM, are chosen for clearance cycles and UF cycles. One can also conclude that if clearance cycles are optimized for urea, this will imply a 10–20% lower creatinine and phosphate clearance. Applying creatinine-based optimization could effectively prevent these reductions in transport. The higher diffusion capacity of urea leads to shorter cycle times, which greatly enhances urea transport 1,3 but is sub-optimal for creatinine transport, which requires longer cycle times. Apparently, the lower the diffusion capacity (MTAC) of a solute, the longer is the optimal dwell time. Thus, the possible enhancement in the clearance of slightly larger small solutes like uric acid and creatinine using higher DFRs is less than that of urea. For example, in a small study, Aasaroüd et al. found approximately 30% increase in creatinine clearance when increasing the DFR from 1.1 L/h to 2.7 L/h compared to approximately 50% increase in urea clearance. 3 Indeed, for the intermittent exchange technique, optimizing for creatinine clearance, there were no clear-cut advantages in terms of treatment time for optimized APD compared to the non-optimized regimens and the greatest advantage seems to be a substantial reduction in metabolic cost in terms of glucose absorption, which may be important, especially for diabetic and pre-diabetic patients or patients experiencing significant weight gain on PD. The patient herein was assumed to have a creatinine diffusion capacity of 12 mL/min, which corresponds to an average transport type having a 4-h D/P-creatinine of about 0.65–0.70 in a traditional peritoneal equilibration test. The optimization technique can however be applied to any patient as long as the cycler settings, the diffusion capacity for creatinine (to estimate A0/▵x) and the osmotic conductance to glucose 16 are known.
In line with previous results, 1 the tidal exchange technique appears to be superior to the intermittent technique at higher DFRs. For lower DFRs, IPD (or a higher tidal volume) is more efficient than TPD with low tidal volumes. 1,17 This is due to the inefficiency of intermittent APD at higher DFRs since more time is spent filling and draining compared to tidal APD. Also, low tidal volumes usually permit using higher drain rates. The choice of tidal volume seems to have only a marginal effect on transport at higher DFR and we actually found that the most efficient tidal volume was approximately 30–50% while lower tidal volumes lead to lower performance in terms of UF and solute clearance. In our previous study, we found that the clearance of β2-microglobulin (β2μ) was enhanced at higher DFRs. 1 However, most of this clearance of β2μ was an effect of a relatively high initial concentration in the residual volume in the previous simulations. In the present simulations, the author, therefore, assumed that a pre-test rinse was performed, lowering the initial dialysate concentration of both β2μ and albumin, showing that the albumin loss is actually reduced at higher treatment volumes. From a theoretical point of view, an increase in β2μ removal will almost invariably lead to an increased loss of albumin and other large molecules like immunoglobulins and coagulation factors. The importance of non-dialytic solute clearance is often overlooked and has been shown to be the most important determinant of serum concentrations of β2μ in HD patients. 18
In conclusion, compared to conventional (6 × 2 L) and adapted (2 × 1.5 L + 3 × 3 L) APD, computer simulations using the extended 3PM to generate optimized bimodal APD regimens demonstrated marked reductions in glucose absorption while giving identical Kt/V urea and/or weekly creatinine clearance and UF. A limitation in the present optimized regimes is that they assume excellent catheter function and that the peritoneal cavity is perfectly drained after each cycle, leaving a constant residual volume after each drain. In contrast, the residual volume can vary greatly between dwells. For example, in a recent clinical study from our group, 16 we found that the calculation of osmotic conductance to glucose (OCG) on the basis of drained UF (i.e. drained volume − instilled volume) was uncorrelated to the actual (transmembrane) UF. Thus, variations in residual volume can potentially have a great impact on treatment outcomes, especially ultrafiltration. An interesting finding is that larger fill volumes can be used to shorten the treatment time significantly. A possible concern is that the optimized regimens usually require larger treatment volumes, emphasizing the need for a reliable system for online production of PD solution. While the classic 3PM has been validated in numerous clinical 19,20 and experimental 21 –23 studies, the current results should be validated using experimental and clinical studies.
Footnotes
Acknowledgements
The author wishes to thank Ms Karin Bergling for fruitful discussions.
Author contributions
CMÖ researched the literature and conceived the study. He performed computer simulations and numerical computations. He wrote the first draft of the manuscript, reviewed and edited the manuscript and approved the final version of the manuscript.
Ethical approval
None.
Declaration of conflicting interests
The author(s) declared the following potential conflicts of interest with respect to the research, authorship, and/or publication of this article: Dr Öberg reports grants and consulting fees from Baxter Healthcare; grants from Fresenius Medical Care outside the current work and consulting fees from B Braun outside the current work. In addition, he has a US Patent App. 16/329,981 assigned to Baxter Healthcare.
Funding
The author(s) disclosed receipt of the following financial support for the research, authorship, and/or publication of this article: This work was supported by the Medical Faculty at Lund University (ALF-grant), by a grant from Gambro-Lundia AB (part of Baxter Healthcare) and by the Thure Carlsson foundation and Region Skåne (Medical Training and Research Agreement [Avtal om Läkarutbildning och Forskning; ALF]).