
Abstract
Background:
Accurate measurement of muscle mass is an important research and clinical tool. High-resolution ultrasound (US) has shown potential as a method to assess muscle and fat mass at specific anatomical sites. However, there is limited evidence for the reliability of US to measure muscle size in patients receiving continuous ambulatory peritoneal dialysis (CAPD). Therefore, we examined the validity and reliability of an US method compared to a gold standard comparison for the assessment of a quadriceps muscle in this clinical population.
Methods:
Twenty people receiving CAPD (mean age = 56.5 ± 16.7 years) at a single dialysis unit were assessed on two occasions, 7 days apart. Measures of the mid-thigh, such as vastus lateralis (VL) anatomical cross-sectional area (ACSA), VL muscle thickness and subcutaneous fat thickness were compared for US reliability and validity compared to magnetic resonance imaging (MRI) measures.
Results:
US had high validity against gold standard MRI measures, with intraclass correlation coefficients (ICC) equating to VL ACSA of 0.95, VL thickness of 0.99 and fat thickness of 0.98. The US measurements also exhibited high intra-rater reliability (ICCs: VL thickness = 0.98, total muscle thickness = 0.97 and fat thickness = 0.99) in measuring body composition at the mid-VL site in the study population.
Conclusions:
Valid assessment of regional body composition can be achieved via high-resolution US in patients receiving CAPD. The validity and reliability of the US in repeated measures (in comparison to the gold standard MRI) warrant further investigation in the wider chronic kidney disease population.
Keywords
Introduction
The prevalence of malnutrition and loss of muscle mass in stage 5 chronic kidney disease (CKD-5) can be an overwhelming complication of chronic uraemia. 1 Malnutrition is consistently linked to increased mortality, morbidity and reduced quality of life in the dialysis population 2 with muscle wasting recognised as one of the hallmark characteristics of renal disease. 3 Malnutrition and reduced muscle mass have both been implicated in the functional decline of chronic kidney disease (CKD) patients 2,4 and in the ageing population. 5,6 Patients treated with peritoneal dialysis (PD) are often malnourished, presenting with low protein levels and decreased fat-free (lean) mass 7 but often with increased overall adiposity (greater visceral fat/subcutaneous fat ratio 8 ). This may be partially attributed to the glucose-based dialysate used in PD as the increased availability of glucose in the dialysate promotes greater uptake and assimilation by the body, 9 thereby potentially masking the extent of the underlying muscular atrophy.
Anthropometric measures such as skinfold thicknesses and waist and limb circumferences are routinely taken with the intention of monitoring the nutritional status of CKD patients. However, basic measures such as limb circumference do not allow accurate composition analysis of the limb being measured, 10 and skinfold measures using calipers are highly prone to error, regardless of how well trained and experienced the technician is, as skin calipers have been shown to overestimate the subcutaneous fat thicknesses of the thigh in individuals with higher fat values. 11
The accurate measurement of muscle mass is an important research and clinical tool for assessing change from an intervention, monitoring progression/deterioration associated with this stage of CKD or from disuse and frailty-related ageing. 12 Direct measurement of muscle mass is not always feasible by means of magnetic resonance imaging (MRI) or other reference methods (e.g. total body potassium, dual energy x-ray absorptiometry (DEXA)) due to financial or time costs, general patient access or the sheer volume of patients that needs to be monitored. However, ultrasound (US) is a relatively expedient method of this type of data acquisition and has been shown to safely produce high-quality images of muscle size and structure. 13 Equipment is inexpensive in comparison to other clinical methods such as MRI or DEXA and can be taken to the patient at their bedside, in a research laboratory, or other nonclinical site.
High-resolution US has shown great potential as an alternative (near-bedside/near-patient) method to assess muscle and fat mass at specific anatomical sites; it has been shown to accurately measure change in muscle size resulting from anabolic interventions and also to monitor the effects of ageing and disuse in a variety of healthy and clinical populations (e.g. healthy adults, 14 people with knee-joint injury, 15 people affected by chronic respiratory disease, 16 frail and critically ill patients 17,18 ). However, there is currently limited evidence for the reliability of US to measure muscle size in renal populations 19 –22 and none in patients receiving PD.
The purpose of this study was, therefore, to examine the validity and reliability (reproducibility and potential sensitivity) of an US method compared to a gold standard comparison (MRI) for the assessment of a quadriceps muscle (vastus lateralis (VL)) anatomical cross-sectional area (ACSA), muscle thickness and fat thickness in CKD-5 patients undergoing continuous ambulatory peritoneal dialysis (CAPD) therapy.
Methods
Study design, setting and participants
A cross-sectional design was used for this validity and reliability study. Twenty (18 male and 2 female) CKD-5 patients undergoing CAPD at a single hospital dialysis unit volunteered to take part in the study. The CAPD patients received, during the day, 4 × 2 L exchanges with a 1.36% or 3.86% glucose concentration. The dialysis prescription is based on either 3 × 1.36% + 1 × 3.86% (3:1 regimen) or 2 × 1.36% + 2 × 3.86% (2:2 regimen). The PD fluid consisted of 5.38 g/l NaCl, 4.48 g/l sodium lactate, 0.184 g/l CaCl2 and 0.051 g/l MgCl2.
Patients were considered eligible if they were 18 years of age or older, were independently mobile, were fluent in written and spoken English and were able to give consent. Patients were excluded if they had any diagnosis of unstable angina, or amputation that would mean they were unable to fully participate in the required measurement site. We limited recruitment to patients on CAPD only to standardise the type of PD treatment. All participants were ambulatory and free from recent hospitalisations (i.e. in the previous month) at the time of assessment.
This research project conformed to the ethical principles for medical research involving human participants, as set out by the world medical association declaration of Helsinki, and received ethical approval by the University Hospital of North Staffordshire NHS Trust Ethics Committee. Participant incentives were not used for this research project and all participants provided written informed consent.
Standardisation of assessment procedures
Participants attended two sessions, 7 days apart. US assessments were performed in both sessions at a similar time of day, and MRI measurements were made during the second visit only. US and MRI measurements were acquired in a counter-balanced fashion. All data were acquired with dialysate in the peritoneal cavity. All outcome measures were taken by a single assessor (blinded to group allocation) highly experienced in ultrasonography and anthropometry in both clinical and laboratory settings.
US measurements
All US measurements were attained twice on each occasion in two-dimensional (2D) brightness mode (B-mode) via a portable US system (SonoSite® 180 Plus; SonoSite Inc., Bothell, Washington, USA) using a 7.5-MHz linear array probe. Participants lay supine for a period of 20 min prior to any measurements being taken to allow fluid equilibration to occur. The probe head was coated with water-soluble transmission gel which provided acoustic contact without depressing the dermal surface. Compression of the tissues was kept to an absolute minimum by maintaining a consistent low pressure with the US probe throughout scanning. All assessments were undertaken after identification of the measurement sites by palpitation and then US scanning of the key anatomical landmarks. The skin surface was marked with a nonpermanent marker and an angioma (mole) map was constructed for each participant to ensure the correct location and placement of the probe for repeat assessments.
ACSA of the VL was examined by US at mid-femur (identified as the distance halfway between the apex of the greater trochanter and the apex of the lateral epicondyle) with the US probe held transversely, perpendicular to the skin, thus allowing a view of the muscle in the axial plane. The probe was moved in a straight line from the lateral to the medial edge of the VL over external markers that were placed on the skin. All scans were captured on videotape to allow subsequent analysis. The external markers cast an acoustic shadow on each image which acted as reference points allowing the ACSA image to be reconstructed on a computer using imaging software (Adobe Photoshop; Adobe Systems Inc., San Jose, California, USA). These reconstructed ACSA images were then measured using digitising software (NIH Image, National Institute of Health, Bethesda, Maryland, USA).
US muscle and fat thickness measurements were recorded in the axial plane at the mid-femur length/mid-VL width intersect (defined as mid-VL). Once the image was located, the screen was frozen and the systems calipers were used to measure tissue thicknesses. Calipers were removed to capture a second image for later analysis. Fat thickness was measured as the distance between the skin surface and the fat/VL interface (or tissue plane). VL muscle thickness was measured as the distance from the fat/VL tissue plane to the VL/vastus intermedius (VI) tissue plane (Supplemental Figures 1 and 2). All US measurements were performed on the left leg and were repeated after 7 days.
MRI measurements
A 0.2-T MRI extremities scanner (E-Scan; ESAOTE Biomedica, Genova, Italy) with a flexible coil was used to obtain axial plane scans at mid-femur length for the left leg of all participants (Supplemental Figure 3). Axial plane scans were acquired using a T1-weighted spin echo profile with the following parameters – time to echo: 16 ms; repetition time: 38 ms and field of view: 160 × 160 mm2. All participants lay supine for 20 min prior to and during the scanning procedure. Oil capsules were placed lightly on the surface of the skin along the mid-femur length line to highlight this point precisely on the MRI scan; the oil capsules are clearly visible on T1-weighted MR images. The capsules were oriented in such a manner to allow the examiner to identify precisely the mid-VL point. ACSA of the VL muscle was determined at the mid-femur length. VL muscle thickness and fat thickness were obtained at mid-VL (as described above) from the MRI scans. Images were subsequently analysed using digitising software (NIH ImageJ).
Statistical analysis
Statistical analyses were performed with SPSS (Version 21.0 for Windows; SPSS Inc., Chicago, Illinois, USA). The Shapiro–Wilk test was used to check whether data were normally distributed, and standard statistical methods were used for the calculation of mean and SDs where appropriate. Validity assessments (US measures and MRI) were determined by intraclass correlation coefficient (ICC), using a two-way random effects model (absolute agreement definition 23 ). Bland–Altman analyses with logarithmic transformations were then performed to compare the two methods. Intra-observer reliability/repeatability for US measurement of the VL muscle, muscle thickness and ACSA was tested through ICC computed by two-way mixed effects model. 24 Typical error (standard error of the measurement (SEM)) was assessed for both intra-observer reliability of the US method and as validity between US and MRI. SEM was calculated using the equation SDdiff/√2, where SDdiff is the SD of the difference scores between the two tests. The minimal detectable changes of the US and MRI methods were defined using a 95% confidence interval (CI) and the equation (1.96)(√2)(SEM). 25 Relationships between measures of muscle mass were assessed using Pearson’s correlation coefficient. Statistical significance was set at p < 0.05, and results are presented as mean and SD unless otherwise stated.
Results
Participant characteristics
Participants had a mean age of 56.5 ± 16.7 years (median = 60, range: 18–79) with measured height, body mass and body mass index (BMI) of 170.1 ± 7.4 cm, 78.0 ± 15.4 kg and 26.8 ± 3.8 kg/m2 (median = 26.3, range: 19.9–38.7), respectively. The mean CAPD vintage of participants was 30.7 ± 32.2 months with Kt/V = 2.04 ± 0.6, haemoglobin = 11.6 ± 1.4 g/dl, albumin = 37.45 ± 4.6 g/dl, venous tCO2 = 28.8 ± 4.5 (mmol) and parathyroid hormone (PTH) = 22.7 ± 23.4 pmol/l, respectively.
Validity of US measurements
US and MRI were highly and significantly correlated (ICC for ACSA = 0.95 [95% CI 0.885–0.982], p < 0.001; VL muscle thickness = 0.988 [95% CI 0.970–0.995], p < 0.001 and fat thickness = 0.978 [95% CI 0.912–0.994], p < 0.001, Table 1) with no significant difference between the two methods (p > 0.2 for all measures). This was initially graphed with the line of equality between methods to demonstrate the correlation (Figure 1).
US validity at mid-VL site compared to MRI.a
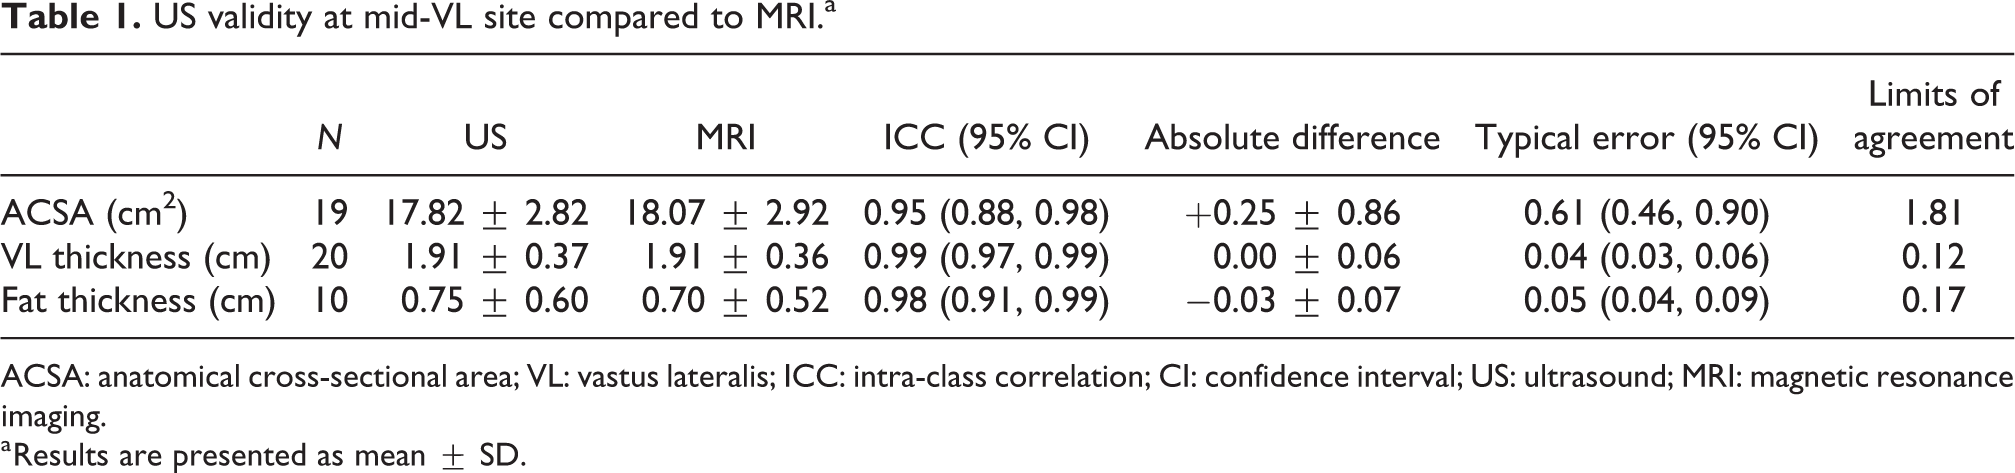
ACSA: anatomical cross-sectional area; VL: vastus lateralis; ICC: intra-class correlation; CI: confidence interval; US: ultrasound; MRI: magnetic resonance imaging.
a Results are presented as mean ± SD.
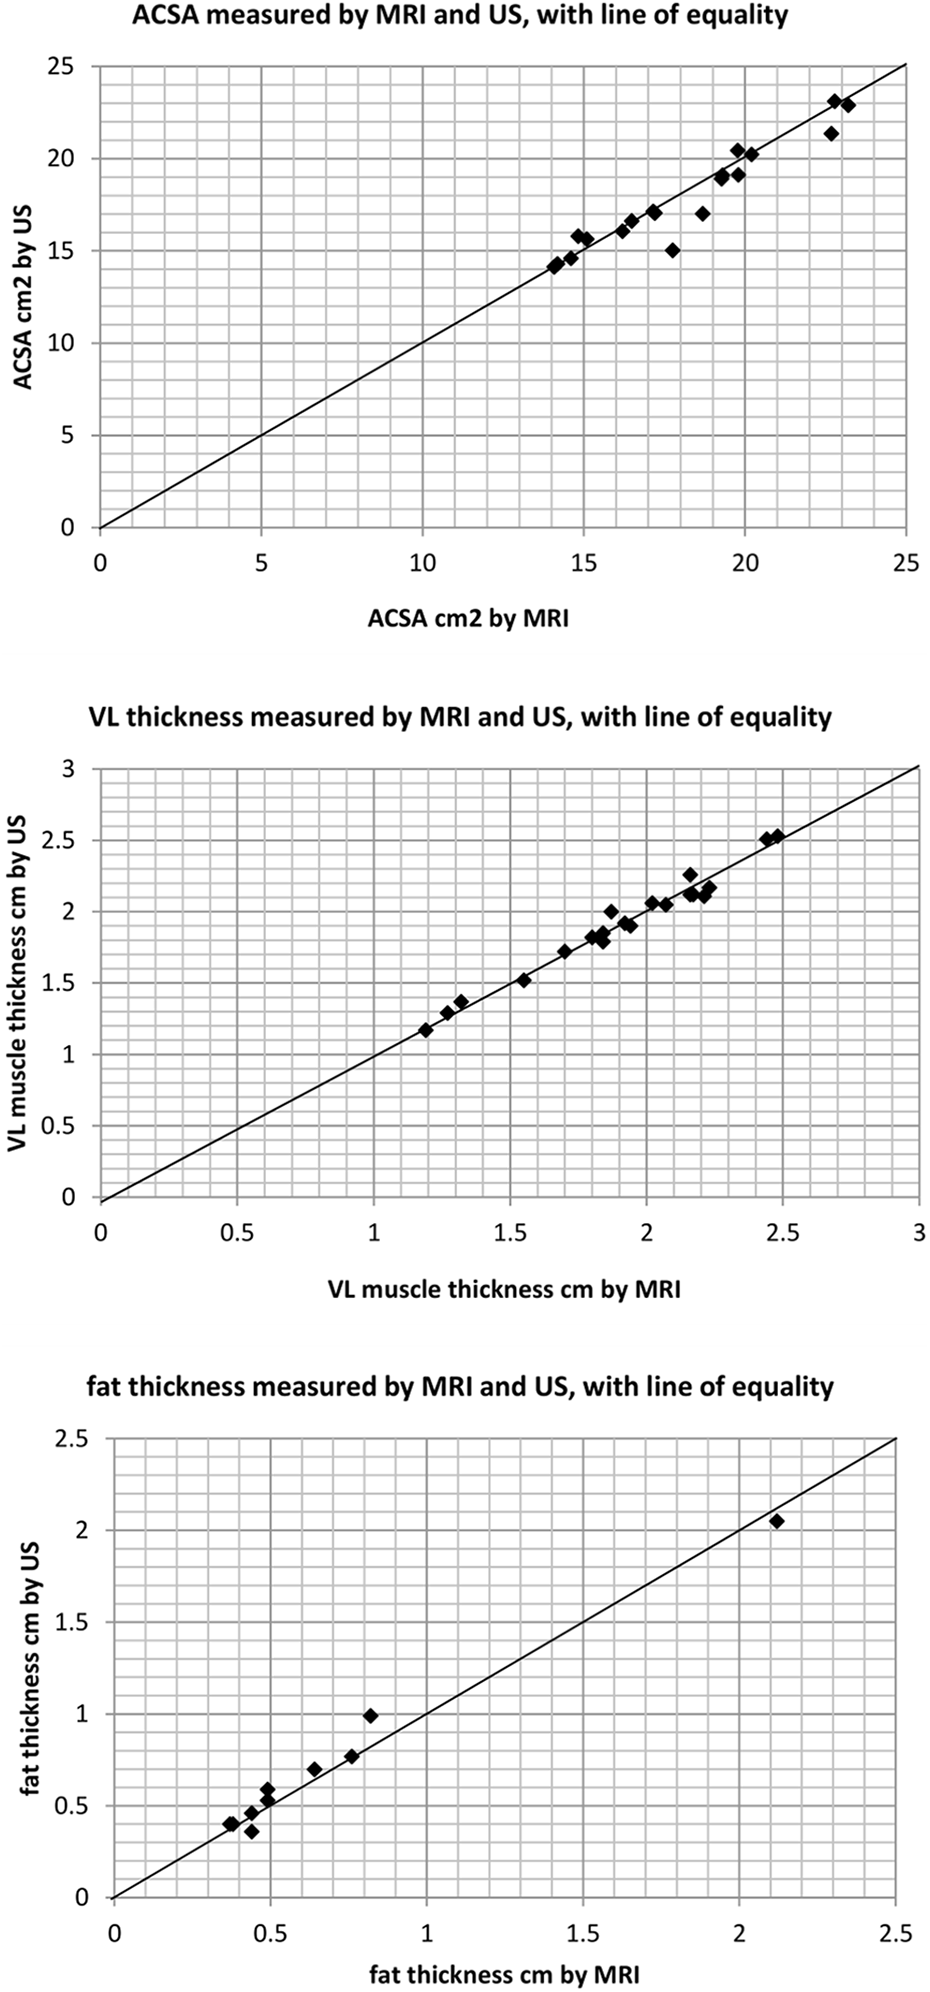
Comparison of MRI and US measures of VL ACSA, VL thickness and fat thickness.The line of equality represents perfect agreement between the methods (where x = y).
Bland–Altman analyses were then performed of the two methods being compared (MRI and US) to illustrate the agreement between them (Supplemental Figure 4). The sample size was too small to comment on whether accuracy changes with tissue size, and despite the limits of agreement being quite narrow they may still have been affected by the one or two outliers. Logarithmic transformations were performed to remove any skew, and to further investigate any linearity and correlations. The modulus of the previously calculated average and difference were used in the log-transformation, and the new data were plotted (Figure 2).
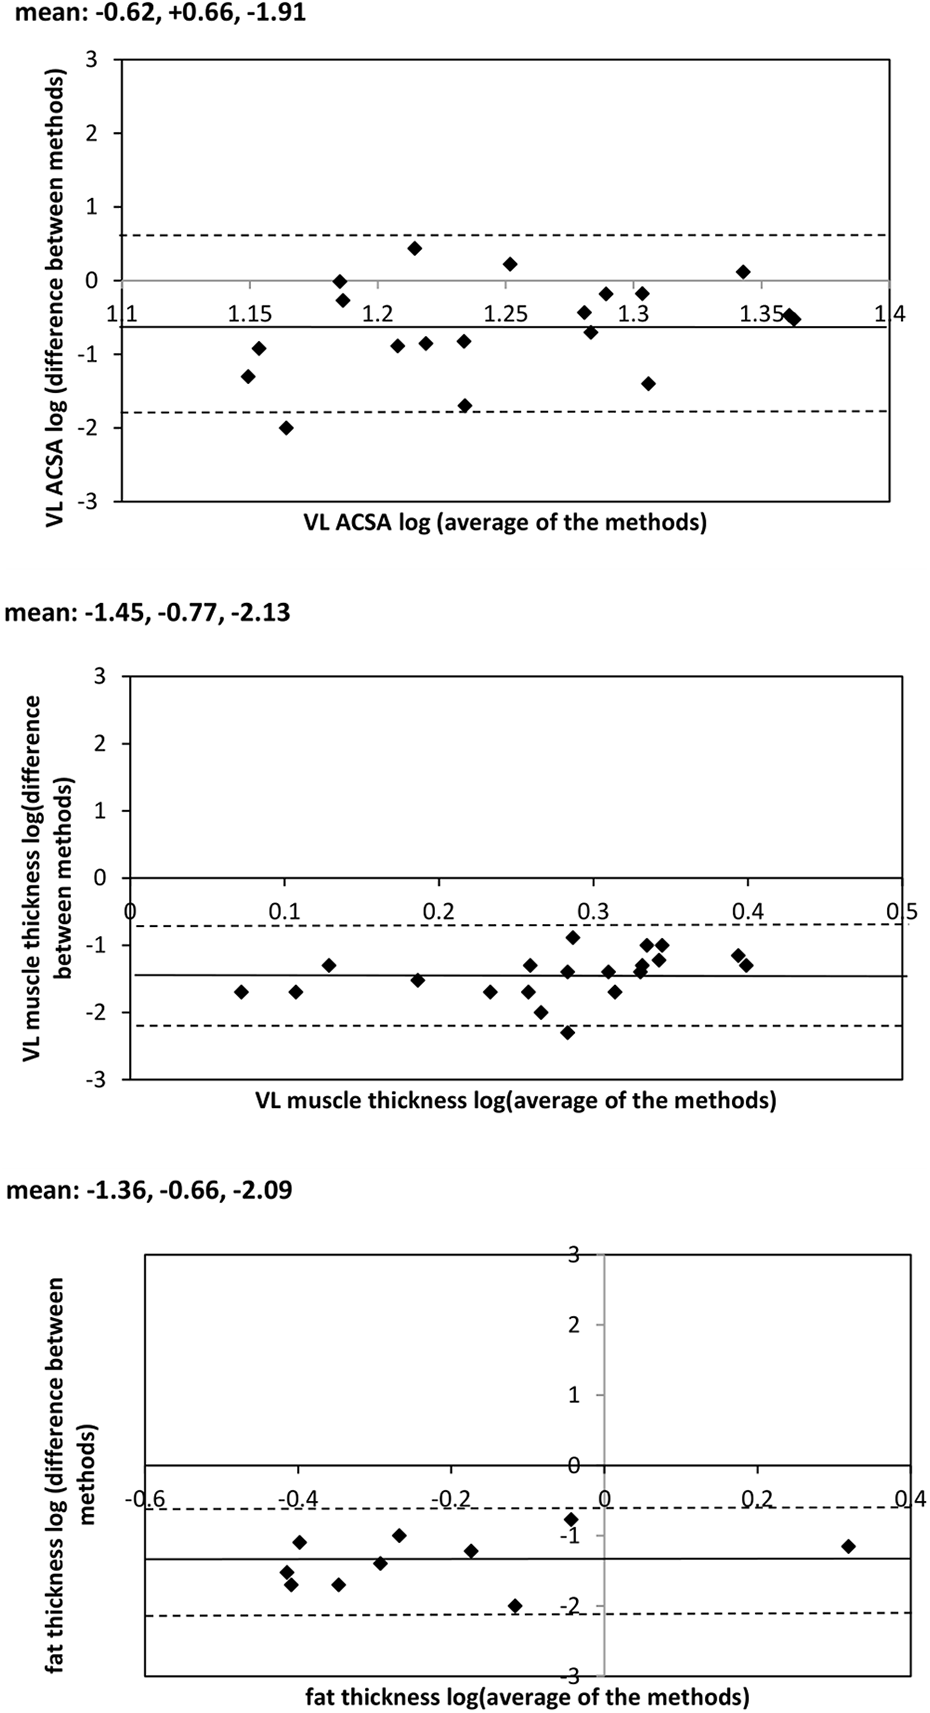
VL ACSA, VL thickness and fat thickness log-transformed Bland–Altman graphs; logaverage along the x-axis, and log|difference| on the y-axis.
The mean (average) differences between US and MRI for ACSA (0.25 ± 0.86 cm2) and VL thickness (0.00 ± 0.06 cm) show MRI yielding slightly higher values than US for each muscle index, with fat thicknesses marginally lower (−0.03 ± 0.07 cm). Table 1 summarises the validity of US measurement of the VL muscle ACSA, muscle thickness and subcutaneous fat compared to MRI measures.
Intra-rater reliability/repeatability of US
The two consecutive sets of US measures (taken 7 days apart) were highly correlated in the direct measures taken at the mid-VL site, VL muscle thickness (ICC = 0.981, [95% CI 0.953–0.992], p < 0.001) and fat thickness (ICC = 0.992 [95% CI 0.980–0.997], p < 0.001; Figure 3).
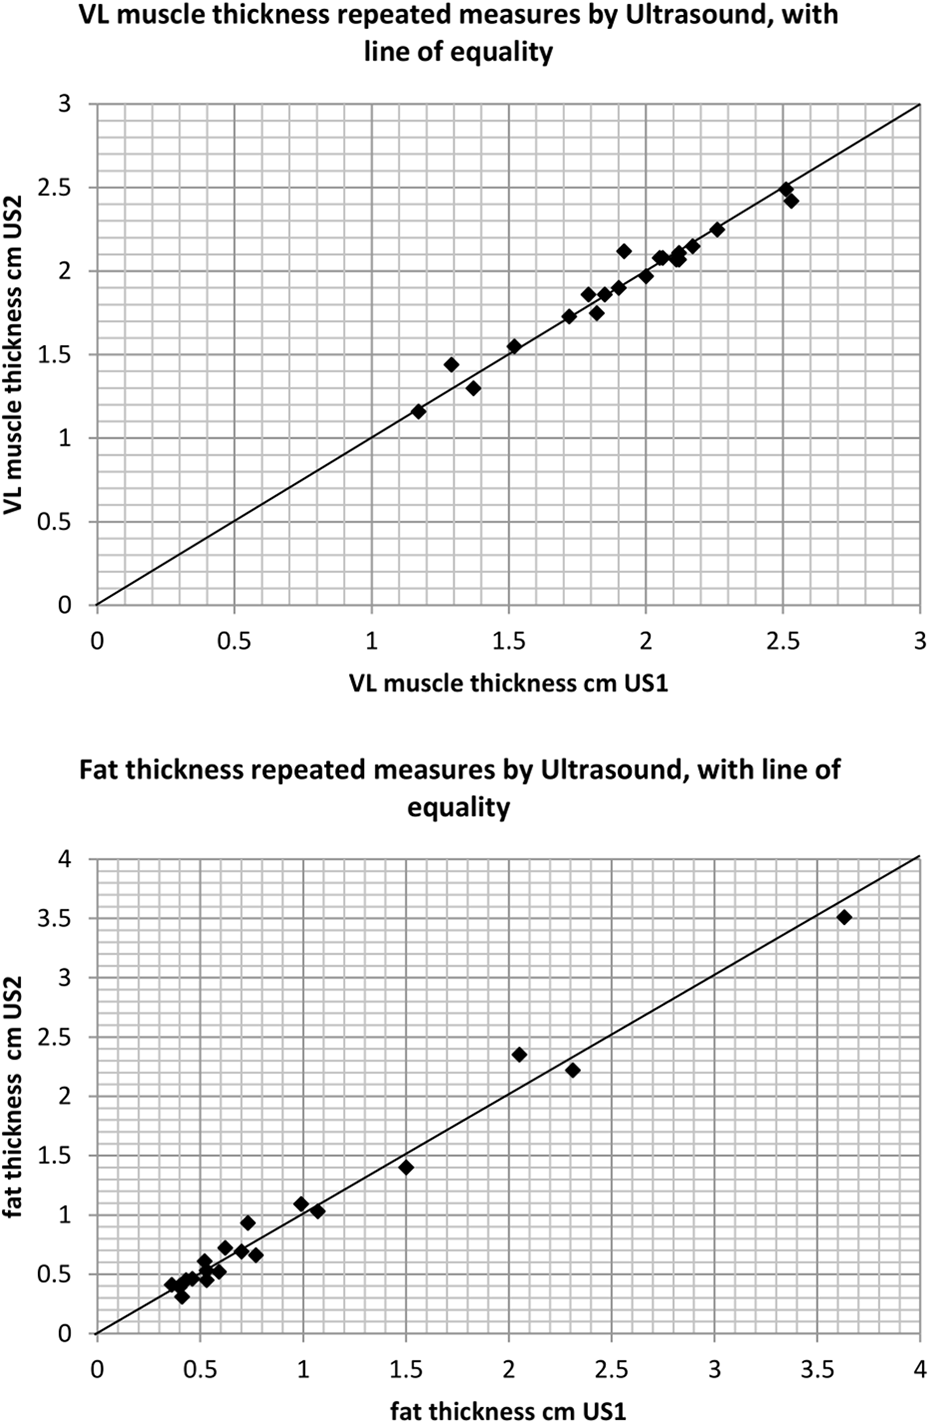
Intra-rater reliability using US for the measurement of VL muscle thickness and fat thickness at the mid-VL point.
Table 2 summarises the intra-rater reliability of US measures of the VL muscle thickness, and same site subcutaneous fat thickness. Typical error (SEM) was low, with measures equating to an error of 2.4% (VL thickness, range: 1.8–3.65%) and 10.0% (fat thickness, range: 7.3–15.6%).
Intra-rater reliability of US at mid-VL point.a
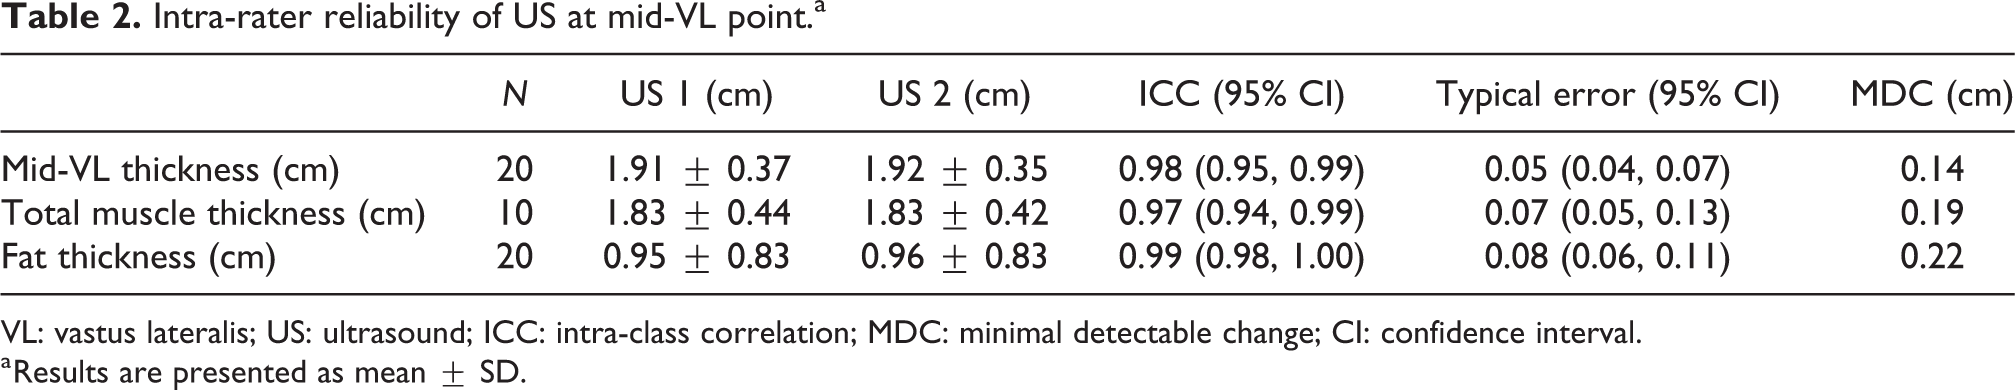
VL: vastus lateralis; US: ultrasound; ICC: intra-class correlation; MDC: minimal detectable change; CI: confidence interval.
a Results are presented as mean ± SD.
Concurrent validity (relationship between measures of muscle size)
In a further analysis, we explored the relationships between the different measures of muscle at the mid-VL site (VL ACSA, total muscle depth and VL-only depth) using US. VL ACSA was positively correlated with total muscle thickness (r = 0.530, p = 0.02), VL thickness (r = 0.582, p = 0.009) and did not correlate with fat thickness (r = 0.305, p = 0.204). Total muscle thickness was positively correlated with VL thickness (r = 0.989, p < 0.001) and did not correlate with fat thickness (r = 0.267, p = 0.229). Finally, VL thickness was not correlated with fat thickness (r = 0.326, p = 0.138).
Discussion
The results of this study indicate that in comparison with MRI measurements, the use of 2D B-mode ultrasonography (US) is a valid means of characterising VL muscle ACSA in patients receiving CAPD therapy (Table 1). However, although no statistically significant differences were revealed between MRI and US assessments of muscle and subcutaneous fat thickness at the mid-VL site, it is nonetheless evident from the log-transformed data described in Figure 2 that a small degree of negative systematic bias exists for both.
The typical error in this study (Table 1) equated to 2.6% (VL ACSA), 1.8% (VL thickness) and 6.0% (fat thickness). This is in-line with previous US-MRI validation studies (in non-renal disease populations) that have used US to measure the quadriceps muscle (VL ACSA ICC = 0.905, error = 0.38 cm2, healthy participants 14 ; VL ACSA ICC = 0.999, healthy participants 26 ; 4.4% error against computed tomography (CT), coronary arterial disease patients 27 ) and other sites (hip, ICC = 0.81–0.89, healthy participants 28 ; lower trapezius, r = 0.77, healthy/asymptomatic participants 29 ). More importantly, the study results are aligned with findings from a recent US-MRI validation study which reported a strong positive correlation between rectus femoris ACSA and total quadriceps volume (r 2 = 0.815, p < 0.001) in patients with stage 3b–5 CKD. 21 In addition, US-CT validation studies conducted in acute kidney injury, pre-dialysis CKD and haemodialysis populations have also found strong correlations between measures of quadriceps muscle (rectus femoris ACSA, r = 0.826, p < 0.001; rectus femoris and VI muscle thicknesses, ICC = 0.92–0.97, p < 0.001) as assessed by these two methods. 19,30,31
US scans are able to clearly distinguish between muscle, fat and connective tissue 32 and also allow accurate selection of measurement sites. This method can provide information on ACSA changes along the entire muscle length in response to training, disuse and sarcopenia. 26
Given that clinical disturbances such as fluid accumulation and muscle wasting are very common in CKD, measures that can distinguish between tissues (unlike BMI, body mass and limb circumference) and accurately reflect excess body fat are very useful. The ability to quickly and accurately assess change in the CKD population may contribute to further explanations and associations with prognosis or mortality, such as ongoing research into the obesity paradox/reverse epidemiology. 33
The US measurements were found to be highly repeatable (Table 2) in the study participants. Fat measurement error was greater and more variable (Table 2, repeatability, 10.0%) than VL muscle thickness using US (Table 2, VL depth 2.4%). The larger variation observed may in part be due to some compression of the subcutaneous fat beneath the probe during the procedure, but other studies have also found lower repeatability in measures of subcutaneous fat where participants were classed as overweight or obese (ICC = 0.92 34 ) as in this participant group (BMI = 26.8 ± 3.8 kg/m2).
The reported ICC of repeated measures of VL muscle depth (0.98, Table 2) of the thigh is well within, and at the better end of the range of acceptable-to-excellent reliability seen in other studies of both healthy and unwell populations (ICC = 0.72–0.99 26,35 ). Previously, repeated measurements of ACSA have been reported with ‘good’ reproducibility in young healthy subjects (ICC = 0.87, rectus femoris 36 ); lower than the accuracy found in the direct depth measurement in this CKD-5 patient study. The variation in error between VL muscle measures is small but notable; ACSA measurement error is marginally higher than measures of VL depth as there is more scope for the accumulated inflation of small errors during image collation.
The benefits of using US in cachectic patients to assess muscle quality and architecture have been previously alluded to. 37 Alongside the demonstrated validity and reliability of this method for CKD patients treated by CAPD, US is clearly a useful tool for comparative and interventional research studies, especially with the increased expediency of the US method and the reduction in participant burden (compared to gold standard and other reference methods), the advantages are even more apparent.
This study also investigated the relationship between the VL thickness and VL ACSA. Unsurprisingly, VL thickness, total muscle thickness and VL ACSA were highly correlated with each other, with VL thickness particularly well correlated to both total muscle thickness and VL ACSA (p < 0.01).
Using a thickness measure as an alternative to ACSA has been explored in other studies and found to provide very similar degrees of correlation (and therefore information) with slightly better concordance in the lower extremities such as the upper thigh (r = 0.922–0.949, p < 0.001 38 ) or mid-quadriceps (r = 0.91 39 ), compared to the upper extremities (mid-upper arm, r = 0.870–0.915, p < 0.001 40 ).
This highly significant correlation between these measures means a direct thickness measure might be able to provide acceptably similar information for monitoring and assessment purposes as the ACSA would. It is a more expedient process and measure in comparison to the more time-intensive image reconstruction and measurement of ACSA. By using one clear image at a single site, researchers and/or clinicians can minimise the risk of both measurement and processing errors.
Some limitations of our investigation should be acknowledged. Measuring the muscle and subcutaneous fat at the mid-VL site only means the validity and reliability of US cannot necessarily be applied to all body sites. Similarly, a direct comparison of our findings with those of others in similar clinical settings is not possible. In addition, this study used only a single assessor when examining reliability, and thus the results are for intra-rater reliability alone. Previous research has shown excellent inter-rater reliability in patients with acute kidney injury. 22 However, we cannot make any conclusive statement as to whether another assessor would show a similar level of accuracy in their measures. US assessments are generally performed by practitioners with specific training and experience to avoid common measurement issues such as excessive compression of tissues and misplacement of the US probe. Therefore, generalisation for use by a multitude of clinicians is not possible without further inter-rater reliability testing or training.
Conclusions
Valid assessment of regional body composition can be achieved via high-resolution US in CKD-5 patients receiving CAPD. In the study population, there was a high correlation between VL ACSA and VL muscle thickness in the axial plane, with all US measures highly repeatable and characterised by low measurement error. The validity and reliability of the US in repeated measures (in comparison to the gold standard MRI) warrant further investigation in the wider CKD patient population. Future studies aiming to investigate the clinical utility of US should also explore the relationship between US measures and nutrition/patient-related outcomes.
Supplemental material
Supplemental Material, sj-docx-1-ptd-10.1177_08968608211002384 - Validity and reliability of high-resolution ultrasound imaging for the assessment of regional body composition in stage 5 chronic kidney disease patients undergoing continuous ambulatory peritoneal dialysis
Supplemental Material, sj-docx-1-ptd-10.1177_08968608211002384 for Validity and reliability of high-resolution ultrasound imaging for the assessment of regional body composition in stage 5 chronic kidney disease patients undergoing continuous ambulatory peritoneal dialysis by Louise J Geneen, Jodie Kinsella, Tobia Zanotto, Patrick F Naish and Thomas H Mercer in Peritoneal Dialysis International
Footnotes
Acknowledgements
None.
Author contributions
Louise J Geneen conceived and designed the study, participated in data acquisition, performed the analysis and drafted the original manuscript; Jodie Kinsella participated in data acquisition and critically revised the article for important intellectual content; Tobia Zanotto participated in interpretation of data and findings and critically revised the article for important intellectual content; Patrick F Naish conceived and designed the study and critically revised the article for important intellectual content; Thomas H Mercer conceived and designed the study, participated in interpretation of data and findings and critically revised the article for important intellectual content. All authors reviewed and approved the final version of the manuscript and take public responsibility for the overall work.
Declaration of conflicting interests
The author(s) declared no potential conflicts of interest with respect to the research, authorship, and/or publication of this article.
Ethical approval
This research project conformed to the ethical principles for medical research involving human participants, as set out by the World Medical Association Declaration of Helsinki, and received ethical approval by the University Hospital of North Staffordshire NHS Trust Ethics Committee.
Funding
The author(s) received no financial support for the research, authorship, and/or publication of this article.
Informed consent to participate
All participants provided written informed consent for this research project.
Informed consent to publish
None.
Supplemental material
Supplemental material for this article is available online.
References
Supplementary Material
Please find the following supplemental material available below.
For Open Access articles published under a Creative Commons License, all supplemental material carries the same license as the article it is associated with.
For non-Open Access articles published, all supplemental material carries a non-exclusive license, and permission requests for re-use of supplemental material or any part of supplemental material shall be sent directly to the copyright owner as specified in the copyright notice associated with the article.