
Abstract
Lay summary
Peritoneal dialysis (PD) uses the peritoneal membrane for dialysis. The peritoneal membrane is a thin layer of tissue that lines the abdomen. The lining is used as a filter to help remove extra fluid and poisonous waste from the blood. Everybody is unique. What is normal for one person’s membrane may be very different from another person’s. The kidney care team wants to provide each person with the best dialysis prescription for them and to do this they must evaluate the person’s peritoneal lining. Sometimes dialysis treatment itself can cause the membrane to change after some years. This means more assessments (evaluations) will be needed to determine whether the person’s peritoneal membrane has changed. Changes in the membrane may require changes to the dialysis prescription. This is needed to achieve the best dialysis outcomes. A key tool for these assessments is the peritoneal equilibration test (PET). It is a simple, standardized and reproducible tool. This tool is used to measure the peritoneal function soon after the start of dialysis. The goal is to understand how well the peritoneal membrane works at the start of dialysis. Later on in treatment, the PET helps to monitor changes in peritoneal function. If there are changes between assessments causing problems, the PET data may explain the cause of the dysfunction. This may be used to change the dialysis prescription to achieve the best outcomes. The most common problem with the peritoneal membrane occurs when fluid is not removed as well as it should be. This happens when toxins (poisons) in the blood cross the membrane more quickly than they should. This is referred to as a fast peritoneal solute transfer rate (PSTR). Since more efficient fluid removal is associated with better outcomes, developing a personal PD prescription based on the person’s PSTR is critically important. A less common problem happens when the membrane fails to work properly (also called membrane dysfunction) because the peritoneal membrane is less efficient, either at the start of treatment or developing after some years. If membrane dysfunction gets worse over time, then this is associated with progressive damage, scarring and thickening of the membrane. This problem can be identified through another change of the PET. It is called reduced ‘sodium dip’. Membrane dysfunction of this type is more difficult to treat and has many implications for the individual. If the damage is major, the person may need to stop PD. They would need to begin haemodialysis treatment (also spelled hemodialysis). This is a very important and emotional decision for individuals with kidney failure. Any decision that involves stopping PD therapy or transitioning to haemodialysis therapy should be made jointly between the clinical team, the person on dialysis and a caregiver, if requested. Although evidence is lacking about how often tests should be performed to determine peritoneal function, it seems reasonable to repeat them whenever there is difficulty in removing the amount of fluid necessary for maintaining the health and well-being of the individual. Whether routine evaluation of membrane function is associated with better outcomes has not been studied. Further research is needed to answer this important question as national policies in many parts of the world and the COVID-19 has placed a greater emphasis and new incentives encouraging the greater adoption of home dialysis therapies, especially PD. For Chinese and Spanish Translation of the Lay Summary, see Online Supplement Appendix 1.
Key recommendations
Guideline 1:
A pathophysiological taxonomy: A pathophysiological classification of membrane dysfunction, which provides mechanistic links to functional characteristics, should be used when prescribing individualized dialysis or when planning modality transfer (e.g. to automated peritoneal dialysis (PD) or haemodialysis) in the context of shared and informed decision-making with the person on PD, taking individual circumstances and treatment goals into account. (
Guideline 2a:
Identification of fast peritoneal solute transfer rate (PSTR): It is recommended that the PSTR is determined from a 4-h peritoneal equilibration test (PET), using either 2.5%/2.27% or 4.25%/3.86% dextrose/glucose concentration and creatinine as the index solute. (
Guideline 2b:
Clinical implications and mitigation of fast solute transfer: A faster PSTR is associated with lower survival on PD. (
Guideline 3:
Recognizing low UF capacity: This is easy to measure and a valuable screening test. Insufficient UF should be suspected when either (a) the net UF from a 4-h PET is <400 ml (3.86% glucose/4.25% dextrose) or <100 ml (2.27% glucose /2.5% dextrose), (
Guideline 4a:
Diagnosing intrinsic membrane dysfunction (manifesting as low osmotic conductance to glucose) as a cause of UF insufficiency: When insufficient UF is suspected, the 4-h PET should be supplemented by measurement of the sodium dip at 1 h using a 3.86% glucose/4.25% dextrose exchange for diagnostic purposes. A sodium dip ≤5 mmol/L and/or a sodium sieving ratio ≤0.03 at 1 h indicates UF insufficiency. (
Guideline 4b:
Clinical implications of intrinsic membrane dysfunction (de novo or acquired): in the absence of residual kidney function, this is likely to necessitate the use of hypertonic glucose exchanges and possible transfer to haemodialysis. Acquired membrane injury, especially in the context of prolonged time on treatment, should prompt discussions about the risk of encapsulating peritoneal sclerosis. (
Guideline 5:
Additional membrane function tests: measures of peritoneal protein loss, intraperitoneal pressure and more complex tests that estimate osmotic conductance and ‘lymphatic’ reabsorption are not recommended for routine clinical practice but remain valuable research methods. (
Guideline 6:
Socioeconomic considerations: When resource constraints prevent the use of routine tests, consideration of membrane function should still be part of the clinical management and may be inferred from the daily UF in response to the prescription. (
This is a visual representation of the abstract.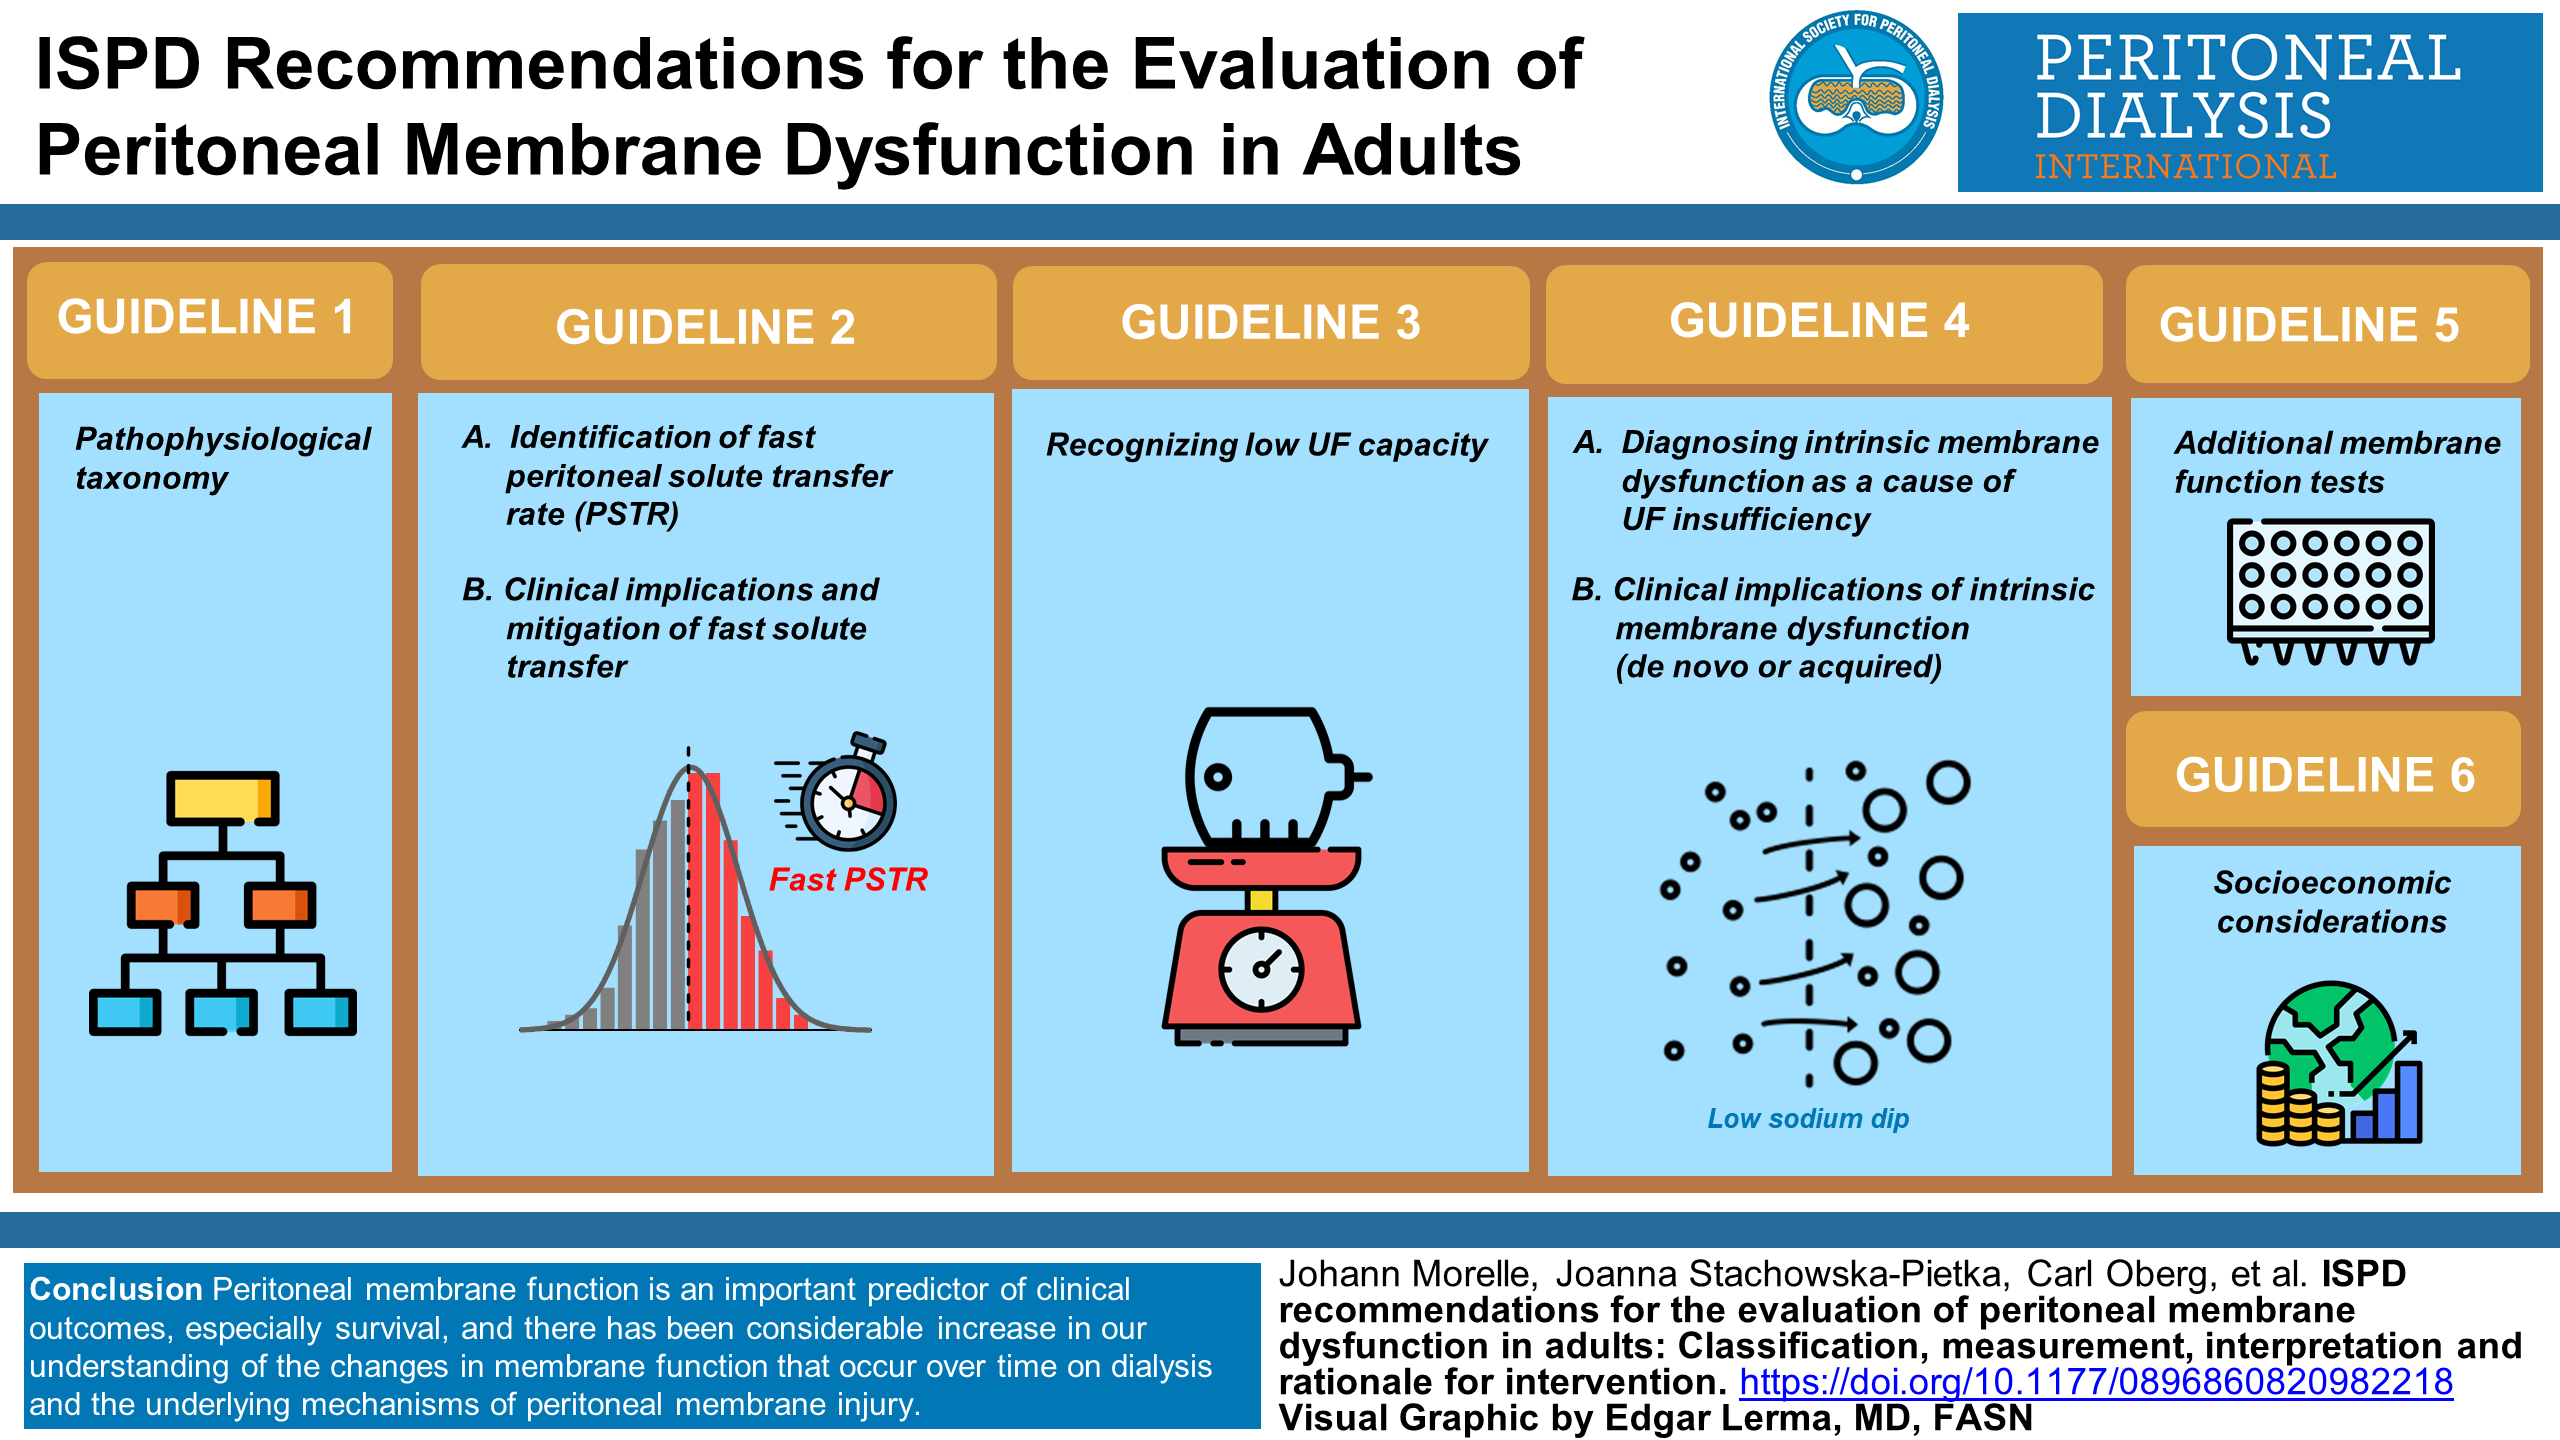
Keywords
Introduction: What is the purpose of this guideline?
The International Society of Peritoneal Dialysis has not produced a guideline on the assessment of peritoneal membrane function since 2000. 1 The most recent comprehensive guideline on this important issue was from the European Best Practice guideline group in 2010. 2 This is despite the fact that over the last two decades there has been mounting evidence that peritoneal membrane function is an important predictor of clinical outcomes, especially survival, and the considerable increase in our understanding of the changes in membrane function that occur over time on dialysis and the underlying mechanisms of peritoneal membrane injury. Other guidelines have dealt with the implications of individual variation in membrane function for clinical prescribing, especially fluid management. Over time there has been a paradigm shift away from defining the efficacy of dialysis treatment simply in terms of small solute clearance, 3 –5 with the realization that at least equal weight should be placed on fluid management and outcomes important to people on dialysis. 6,7 Recent epidemiological studies have consistently shown a strong and independent association between fluid overload and poor outcome, including mortality, among patients with kidney failure on dialysis. 8,9 Volume overload is highly prevalent among patients on peritoneal dialysis (PD), with more than 50% of individuals showing some degree of hypervolemia and 25% being severely volume overloaded. 10,11 Therefore, high-quality PD prescription should aim to achieve and maintain fluid and salt homeostasis, through preservation of residual kidney function including urine volume and natriuresis, dietary counselling and peritoneal ultrafiltration (UF), the latter being the focus of this guideline and especially important when there is little or no residual kidney function. 6,12 –14 High-quality dialysis prescription is now defined in terms of an individualized goal-directed approach. 7 This necessitates the measurement of individual membrane function and appreciation of the implications this has for shared clinical decision-making. It is also clear from the SONG-PD initiative that patients, carers and their clinicians rate the importance membrane function highly along with its implications for technique failure, survival and cardiovascular outcomes. 15,16
This guidance has been constructed with three main objectives in mind: (1) to provide a clear clinicopathological classification of membrane dysfunction which provides the clinician with a framework to be used in clinical practice, (2) to provide guidance on which membrane tests can be used to establish evidence of membrane dysfunction according to this classification and (3) to assist clinicians with the interpretation of these tests and their implications for clinical management. To do this, we have provided a brief description of how the membrane can be described by theoretical and animal models followed by an updated classification of membrane dysfunction that uses the insights from these models to integrate function with underlying membrane physiology and pathophysiology (guideline 1). This is followed by a description of the tests recommended to identify membrane problems (guidelines 2a, 3 and 4a) and coupled with these we have provided guidance on the interpretation and implications of membrane function tests for clinical management (guidelines 2b, 4b). Membrane function tests that are insufficiently evidenced or too complex for routine clinical care are described and where indicated the need for further research is made (guideline 5). Finally, it is recognized that undertaking membrane function tests is not resource neutral and approaches to its recognition in low resource settings is given (guideline 6). Clinical case examples to illustrate the different types of membrane problem, including cases in which poor net fluid removal was not due to membrane dysfunction (e.g. catheter dysfunction, leaks), are given in the Online Supplement Appendices along with a glossary of technical definitions used and a detailed description of how membrane function tests should be performed.
Methods
Grading of recommendations: Using the same approach as the recent ISPD prescribing guidelines, evidence has been graded using the Grading of Recommendations Assessment, Development and Evaluation (GRADE) system for classification of the level of certainty of the evidence and grade of recommendations in clinical guideline reports. 17,18 In this system the strength of the recommendation is indicated as Level 1 (We recommend), Level 2 (We suggest) or it is not graded and the certainty of the supporting evidence is shown as: A (high certainty), B (moderate certainty), C (low certainty) or D (very low certainty). We have taken the position, in line with recent ISPD guidelines, to label statements with low certainty evidence (2C, 2D) as practice points.
To know the prevailing clinical practices on peritoneal equilibration tests (PET) around the world, online surveys of 68 PD Units in China and 20 leading Latin-American PD nephrologists were performed (see Online Supplement Appendix 2 for countries represented). For the China survey, PD nurses were the point of contact and data were collected anonymously, which included unit size and province. We were also able to obtain data from the international Peritoneal Dialysis Outcomes and Practice Patterns Study (PDOPPS) and the Bio-PD Study. The results of these surveys and studies found that most PD Units still use Glucose 2.27% glucose/2.5% Dextrose solutions to perform the classical PET (see Online Supplement Appendix 2).
How the membrane works in PD – Insights from modelling and animal models
Theoretical models for PD
The transport of water and solutes across the endothelium and the tissues surrounding the peritoneal capillaries during PD can be described in terms of a three-pore model (TPM, TPM for PD). 19,20 According to the TPM, the peritoneal barrier can be considered as a semipermeable membrane consisting mainly of numerous small pores (radius, 4–5 nm), which mediate the diffusion of small solutes and solute-coupled fluid transport. Additionally, trans-cellular ultra-small pores (radius, <0.3 nm) mediate free water transport (FWT) (free from solutes), see Figure 1. A relatively small number of large pores (radius, 25–30 nm) account for transport of macromolecules but play a minimal role in water and small-solute transport. Their relevance to peritoneal protein loss is discussed later (see discussion underpinning guideline 5). A refinement of the TPM is the distributed model, 22 (see Figure 2), that allows for the separation of the peritoneal barrier into tissue and capillary wall components. In this approach, the spatial distribution of the blood capillaries within the peritoneal tissue, situated at different distances from the peritoneal cavity, is taken into account. 23,24 The TPM is used to describe transport across the blood capillary wall, whereas the transport of fluid and solutes through the interstitial tissue depends on the local tissue hydration, and is driven by the local interstitial hydrostatic and osmotic pressure gradients. The distributed model shows that only up to few millimetres of the tissue that surrounds peritoneal cavity takes part in the exchanges during PD. Increased tissue hydration observed within this layer, caused by the adaptation of the peritoneal tissue to the PD treatment, alters local transport properties facilitating water and solute transport across the peritoneal barrier. 23 –25
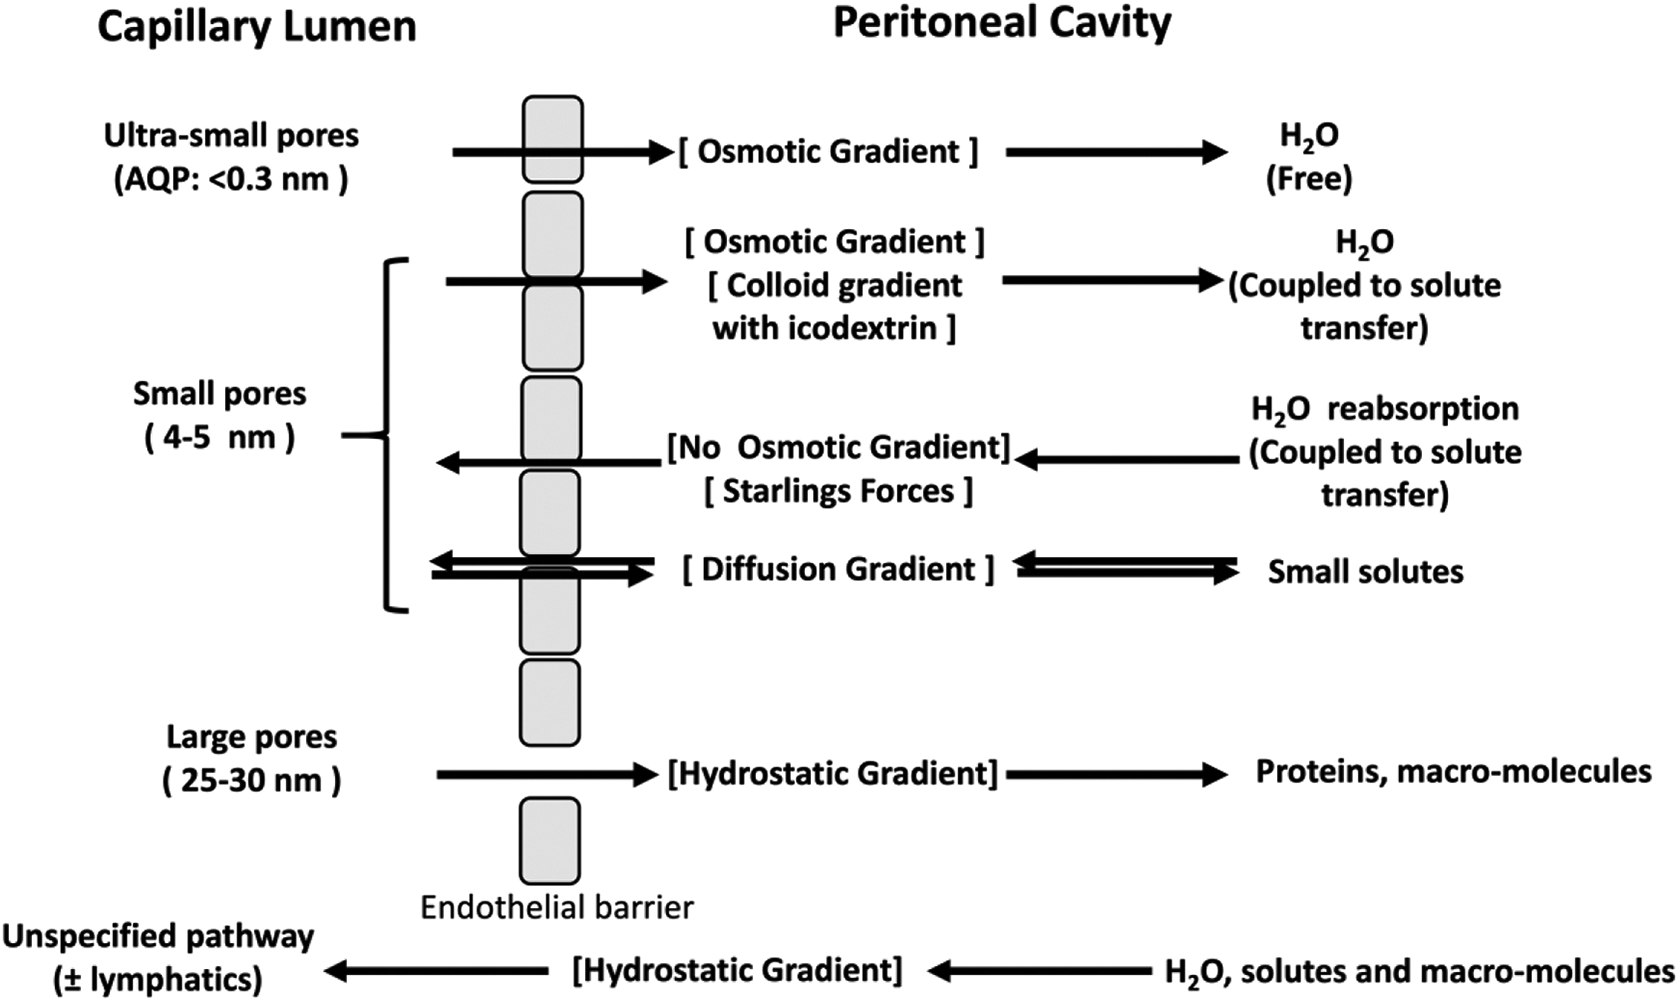
The TPM describes the membrane as two compartments, formed by the endothelium between capillary lumen and the peritoneal cavity. The three-pore systems are the trans-cellular pores (AQP), the inter-cellular small pores (tight junctions) between endothelial cells and the large pores. The driving forces for solute or fluid transfer are shown in square brackets. The mesothelium has no barrier function in this model. The disappearance of large molecular weight substances during an exchange indicates a further pathway through which fluid can be reabsorbed into the body, presumed to be either directly or indirectly entering the circulation via lymphatics. An extension of the TPM, the fiber–matrix model, 21 is also described in which the interstitium acts as a second barrier in series. The insertion of collagen fibres into the interstitium reduces the effectiveness of water flow though the membrane.
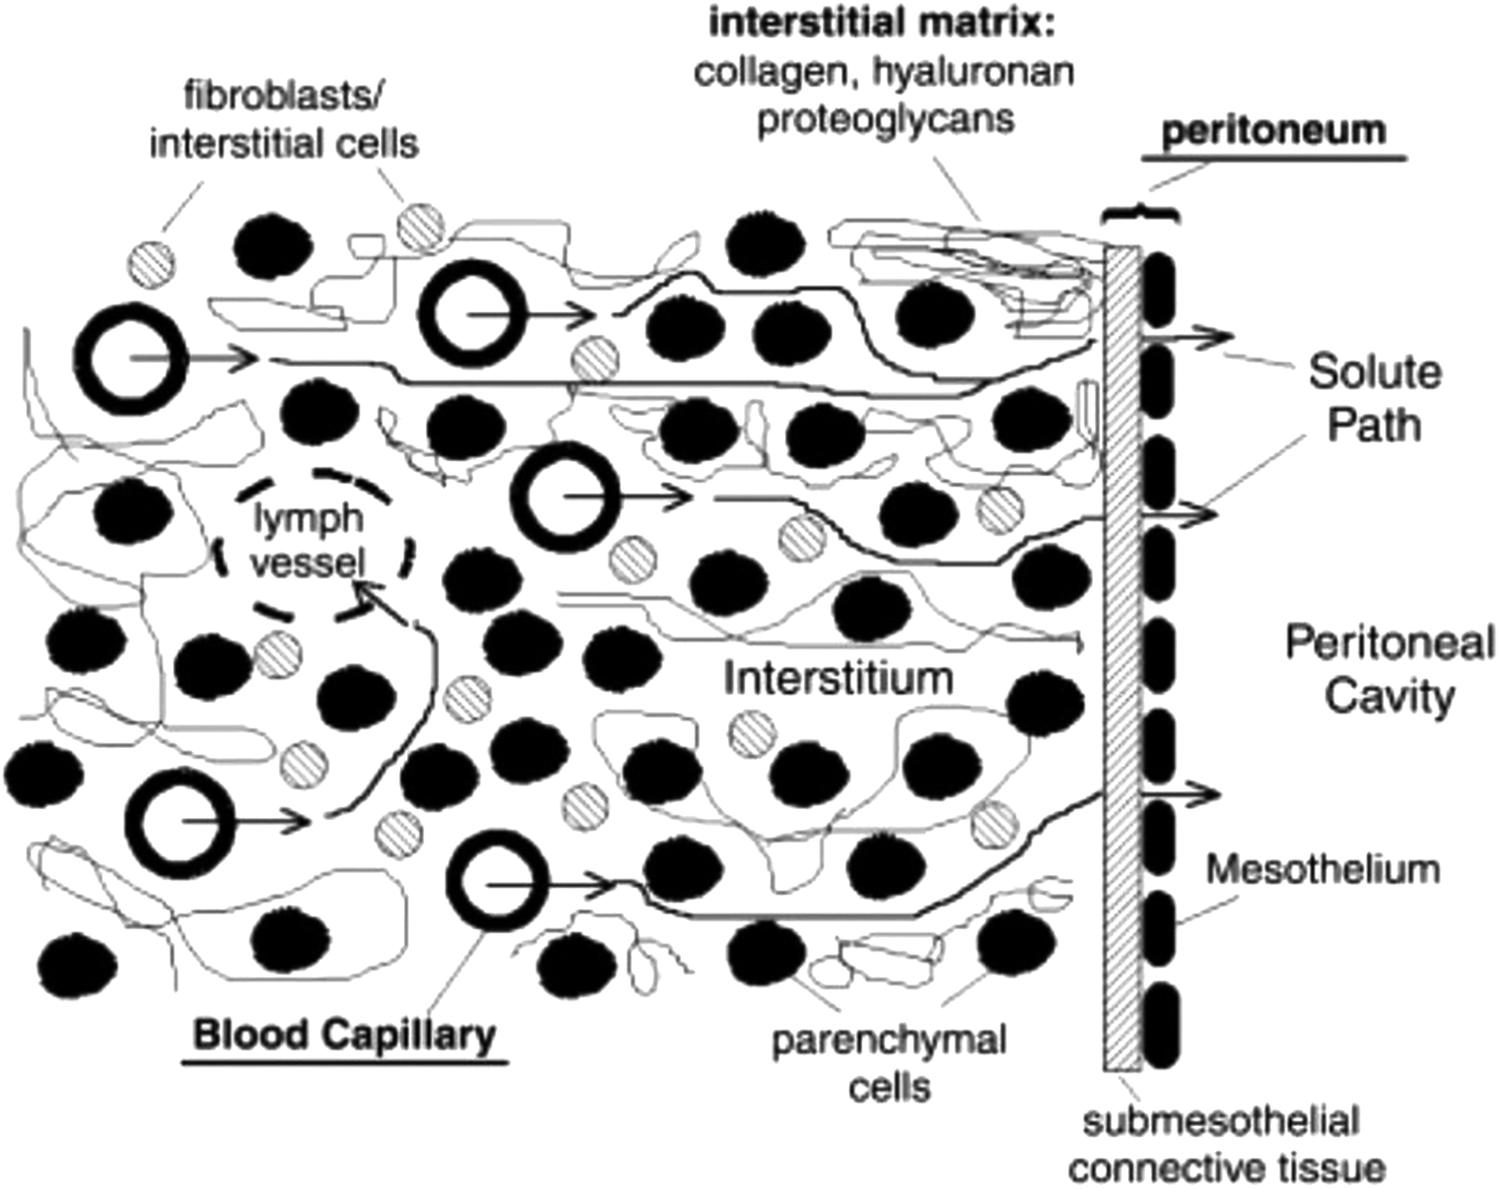
Distributed model describes the peritoneal barrier as blood and lymph capillaries spatially distributed within a peritoneal tissue space (made up of parenchymal cells, interstitial cells and matrix molecules). 22 The three-pore model is used to describe transport between blood circulation and the interstitial space across the blood capillary wall with ultra-small pores (aquaporins), small pores and the large pores taken into account. In this approach, the water and solute transport through the tissue depends not only on the local pressures, tissue hydration and concentrations that drive each transport but also on the local properties of the tissue that are changing due to physiological response to the undergoing treatment. A further extension of the distributed model that takes into account two phase structure of the interstitium (colloid and fluid phases) can be used to investigate concomitant bidirectional solute transport across the structured interstitium. 23
Peritoneal solute transfer rate
The rate at which a solute transfers across the membrane is described by its diffusion capacity, or mass transfer area coefficient (MTAC), the maximal rate of clearance by diffusion, which occurs when the concentration of the solute is zero in the dialysate (see glossary in the online supplemental material for a more complete description of MTAC and how the different theoretical models estimate this). In the clinical setting, this is estimated using the solute dialysate-to-plasma concentration ratio. For example, a 4-h dialysate:plasma ratio of 0.7 is a typical finding in a patient with average peritoneal solute transfer rate (PSTR), corresponding to a diffusion capacity (MTAC) of about 12 mL/min. It should be appreciated that this is an approximation as estimating the MTAC from a dialysate to plasma (D/P) ratio is reliable only when it greatly exceeds the UF rate. Furthermore, the diffusion capacities of small solutes such as glucose or creatinine are typically almost twice as high at the beginning of the dwell, an effect that typically disappears after 120 min. 26 –29 Moreover, both the diffusion and UF capacity of the peritoneal membrane will vary with the intraperitoneal dialysate volume. 24,30 –33 There are also recent results to suggest that TPM parameters are dependent on the glucose concentration. 32 Because of all these factors, peritoneal testing should always be performed in a standardized manner using the same glucose concentration and fill volume.
Mechanisms and pathways of water transport
The main factors determining the efficiency of peritoneal water transport during a glucose dwell are the peritoneal osmotic conductance to glucose (OCG), the rate of glucose diffusion from dialysate to blood (which as stated above is proportional to the PSTR), the peritoneal lymph flow and, finally, the glucose concentration at the start of the dwell. 34 The OCG, in turn, is proportional to the UF capacity, an intrinsic property of the membrane that is typically between 50 µL/min/mmHg and 100 µL/min/mmHg. The OCG is also determined by the efficiency of glucose as an osmotic agent, which is relatively low because the overall reflection coefficient (the proportion of glucose molecules exerting an osmotic effect) is only about 5% due to the high fraction of the small pores (or large small pore surface area) and their large diameter compared to the molecular diameter of the osmotic agent. In contrast, the efficiency of glucose across the water exclusive ultra-small pores is 100% but only accounts for half of the UF due to their much lower fraction (i.e. much smaller surface area). The addition of this third ultra-small pore to the TPM also explains the ‘sodium sieving’ phenomenon. Sodium sieving refers to the decrease in dialysate sodium concentration (‘dip’) observed during the first hour of a hypertonic glucose dwell (typically about 7–9 mmol/L at 60 min with hypertonic glucose solution). Computer simulations suggested that sodium sieving results from the dilution of dialysate sodium concentration by solute-FWT.
These predictions of the TPM were subsequently validated by the identification of aquaporin (AQP) water channels in the peritoneal membrane and by experimental models of PD. The water channel AQP1 is the archetype of a family of water channels facilitating osmotically driven water transport across biological membranes. 35 The constitutive expression of AQP1 in the plasma membrane of endothelial cells lining peritoneal capillaries and venules suggested it may have a role in water transport during PD. 36 This hypothesis was confirmed by the development of experimental models of PD and their application to transgenic mice devoid of water pores. In these models, complete or partial deletion of the Aqp1 gene resulted in a 50% decrease in net UF, and a complete abolition of sodium sieving when hypertonic glucose was used as osmotic agent. 37 –39 These studies identified AQP1 as the molecular counterpart of the ultra-small pore predicted by the TPM and validated the importance of water channels in glucose-driven free-water transport. To date, AQP1 is the only identified protein directly involved in transport processes sustaining PD.
In contrast to crystalloid osmotic agents such as glucose and amino acids, the osmotic conductance of high molecular weight osmotic agents like icodextrin is similar to the UF capacity of the membrane (since such solutes have an osmotic reflection coefficient of 90–100%). Model predictions and experimental models demonstrate that the transperitoneal water flow generated by the glucose polymer icodextrin is independent from the presence of water channels and tonicity so that it is more dependent on the UF capacity of the membrane and occurs predominantly across small pores of peritoneal capillaries, at the level of inter-endothelial junctions. 40,41 Solute-coupled water transport induced by icodextrin relies on the presence of large colloidal fractions, with a hydrodynamic radius larger than the radius of small pores.
UF insufficiency resulting from membrane dysfunction
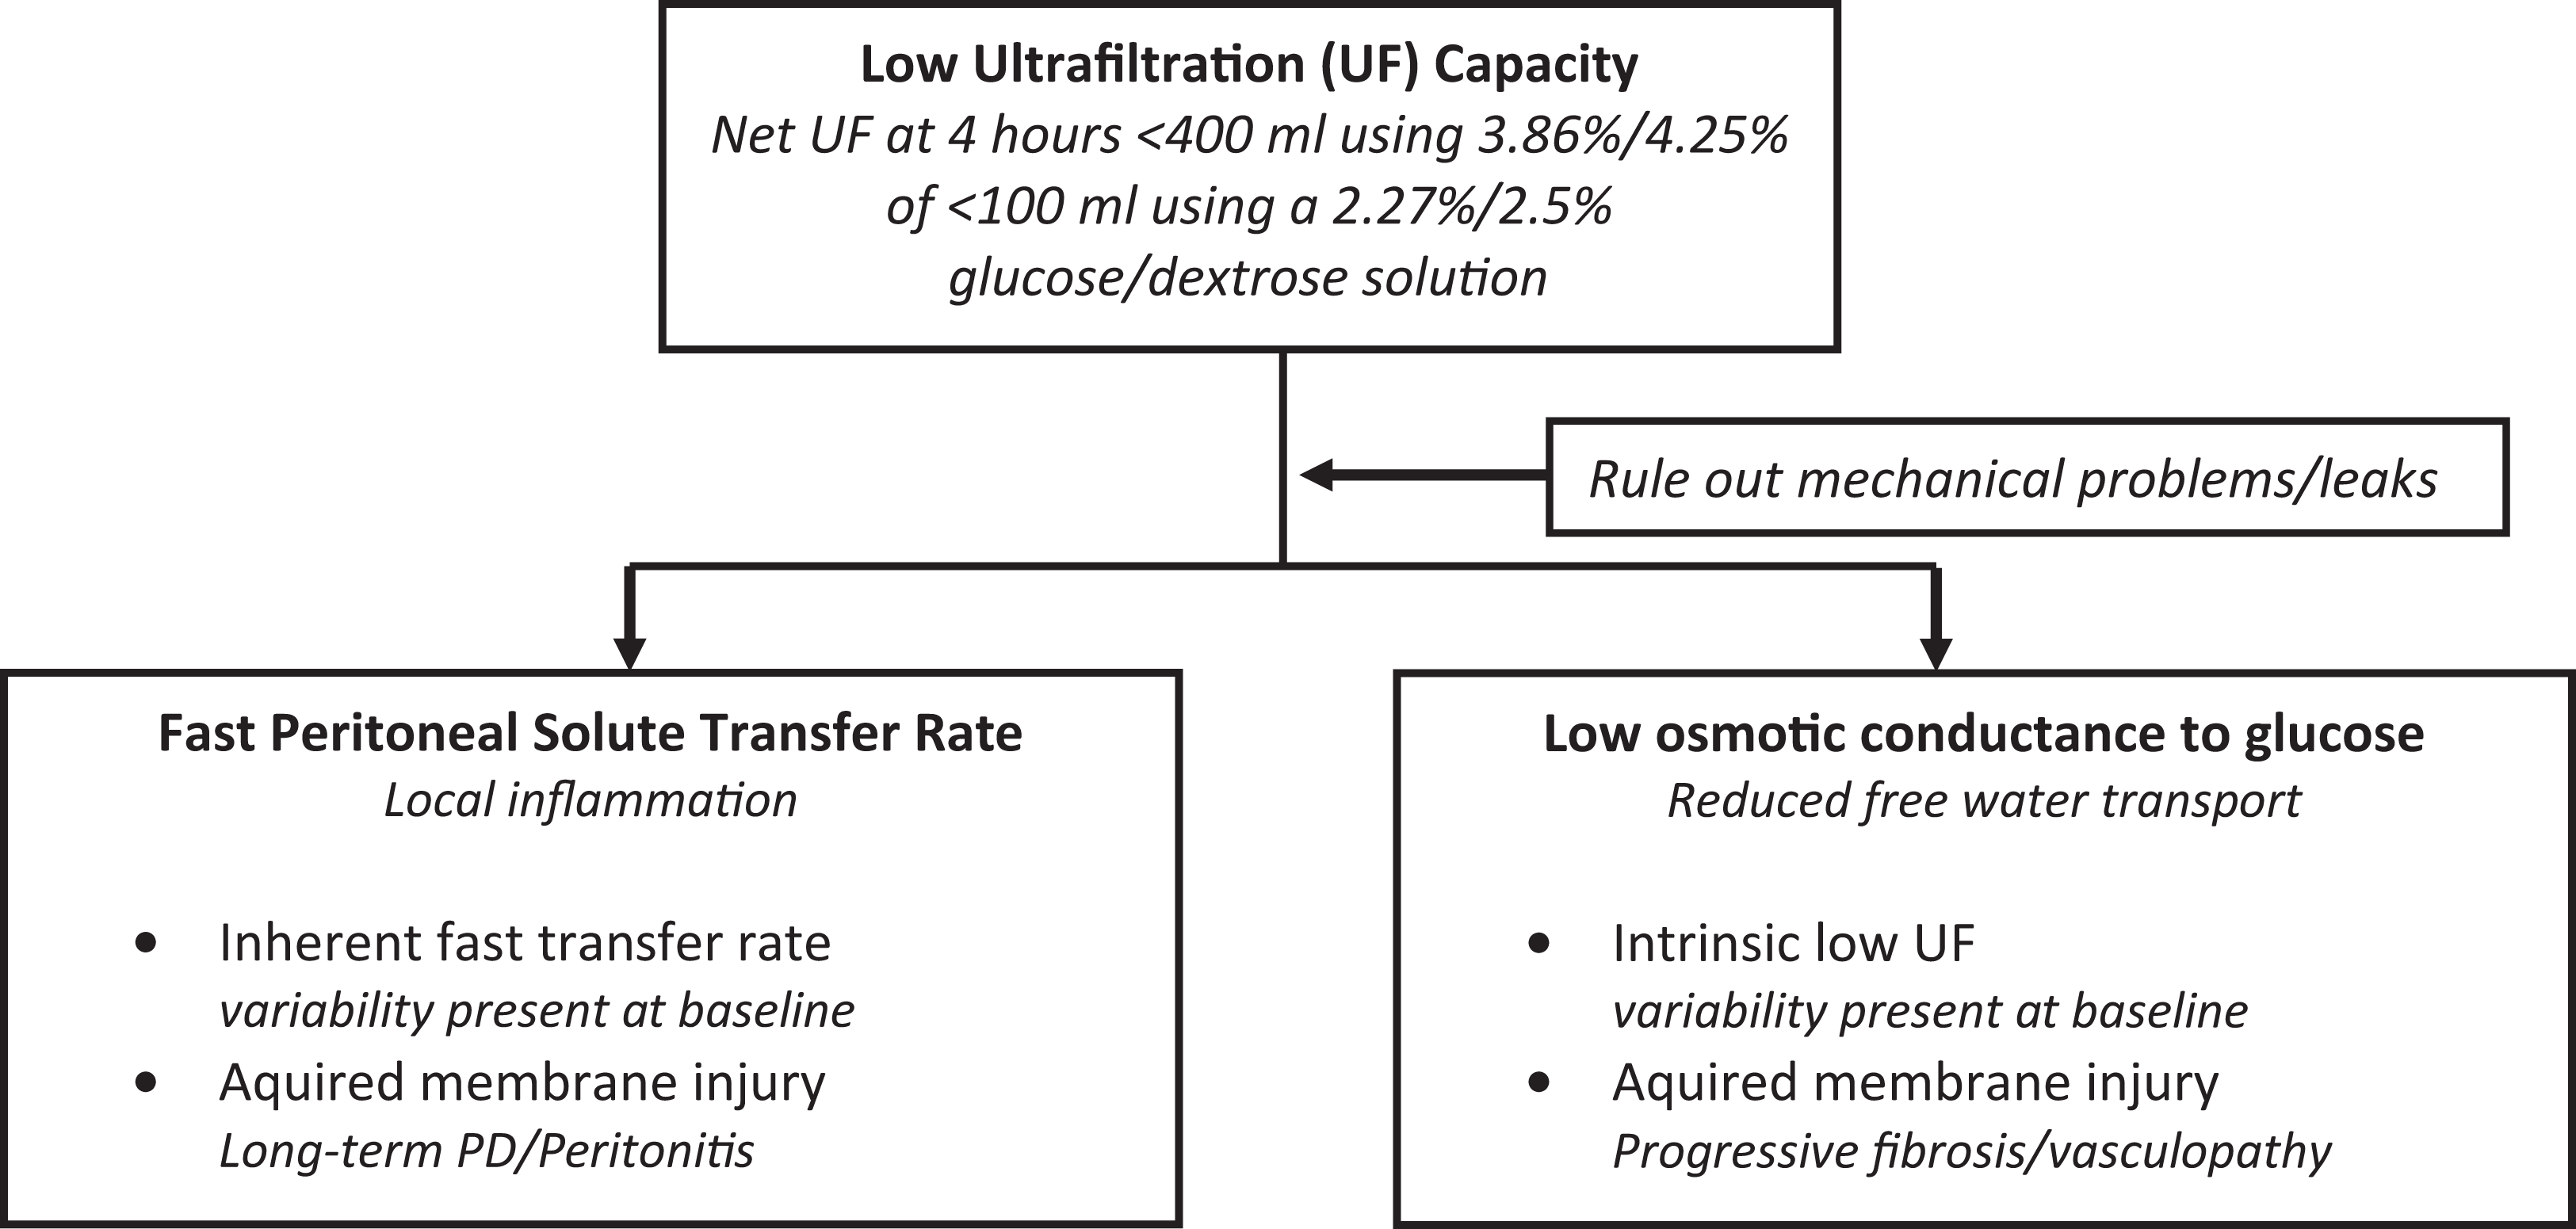
The most common cause of UF insufficiency (causing a UF capacity of less than 400 mL in a 4-h dwell with 3.86% glucose/4.25% dextrose concentration) is early loss of the osmotic gradient due to a fast PSTR of which the most important known determinant is local membrane inflammation. 42 However, membranes with low OCG will also cause UF insufficiency which will manifest as a low UF volume in a conventional PET which cannot in general be used to distinguish between UF insufficiency due to fast PSTR versus low OCG, especially as these conditions may occur simultaneously. Membranes with a low UF capacity and a D/P ratio of anything less than 0.8 raises the possibility that intrinsic membrane dysfunction is also present, for example de novo at the start of treatment or due to acquired membrane damage over time. To fully diagnose the cause of UF insufficiency, clinical tests have been designed to assess the UF capacity and/or the OCG, such as the double mini-PET 43 or a three-fold Evidence based nephrology. 2nd ed peritoneal test (see overvlow). 44 In fact, with appropriate measurements and by using non-linear regression, all mentioned parameters can be assessed using the TPM or the distributed model. However, many of these are complex and not suitable for routine clinical settings.
Nevertheless, these more sophisticated approaches to measuring membrane function have provided insights into the possible mechanisms of UF insufficiency and membrane injury. The effective glucose concentration gradient that induces UF across the blood capillary wall is not constant but decays with the distance from the peritoneal cavity across the interstitial tissue. 24,32 Since UF is driven by the local concentration gradient between tissue and blood circulation according to Starling forces, the blood capillaries situated in the peritoneal barrier closer to the peritoneal cavity will have the greater contribution to the overall UF than those situated at a greater distance. The values of the peritoneal UF capacity and glucose diffusion capacity depend on the transport properties of both barriers, that is, capillary wall and interstitium (peritoneal tissue). In the normal state, the capillary wall component has a prevailing impact, and under these circumstances, UF insufficiency might be caused by differences in the molecular structure of the membrane, for example AQP1 expression. This, however, might change in the case of long-term PD. The functional analysis of membranes with acquired UF insufficiency shows complex changes within transport properties of both components of the peritoneal barrier. In particular, the decrease in peritoneal OCG, as typically observed in acquired UF insufficiency, is related to both a decrease of glucose reflection coefficient and the UF capacity of the peritoneal membrane. Moreover, whereas decrease of the glucose reflection coefficient is related to the changes in the blood capillary wall (i.e. the decrease of the blood capillary wall reflection coefficient of glucose due to a decrease in the ultra-small pore fraction), the changes in the UF capacity are mainly caused by changes in the peritoneal tissue properties that might correspond to the processes of fibrosis. 32
Classification of causes of membrane dysfunction based on current understanding of the underlying pathophysiology (underpins guideline 1)
Clinically, it is possible to identify three main types of membrane dysfunction (see Table 1 and Figure 3): membranes that exhibit rapid small solute diffusion, termed ‘fast peritoneal solute transfer rate’ (PSTR), membranes that exhibit poor intrinsic UF from the start of PD and membranes that become less effective over time leading to acquired membrane insufficiency.
Classification of the causes of membrane dysfunction.
Classification of membrane dysfunction, including definition, underlying pathophysiology and clinical implications.
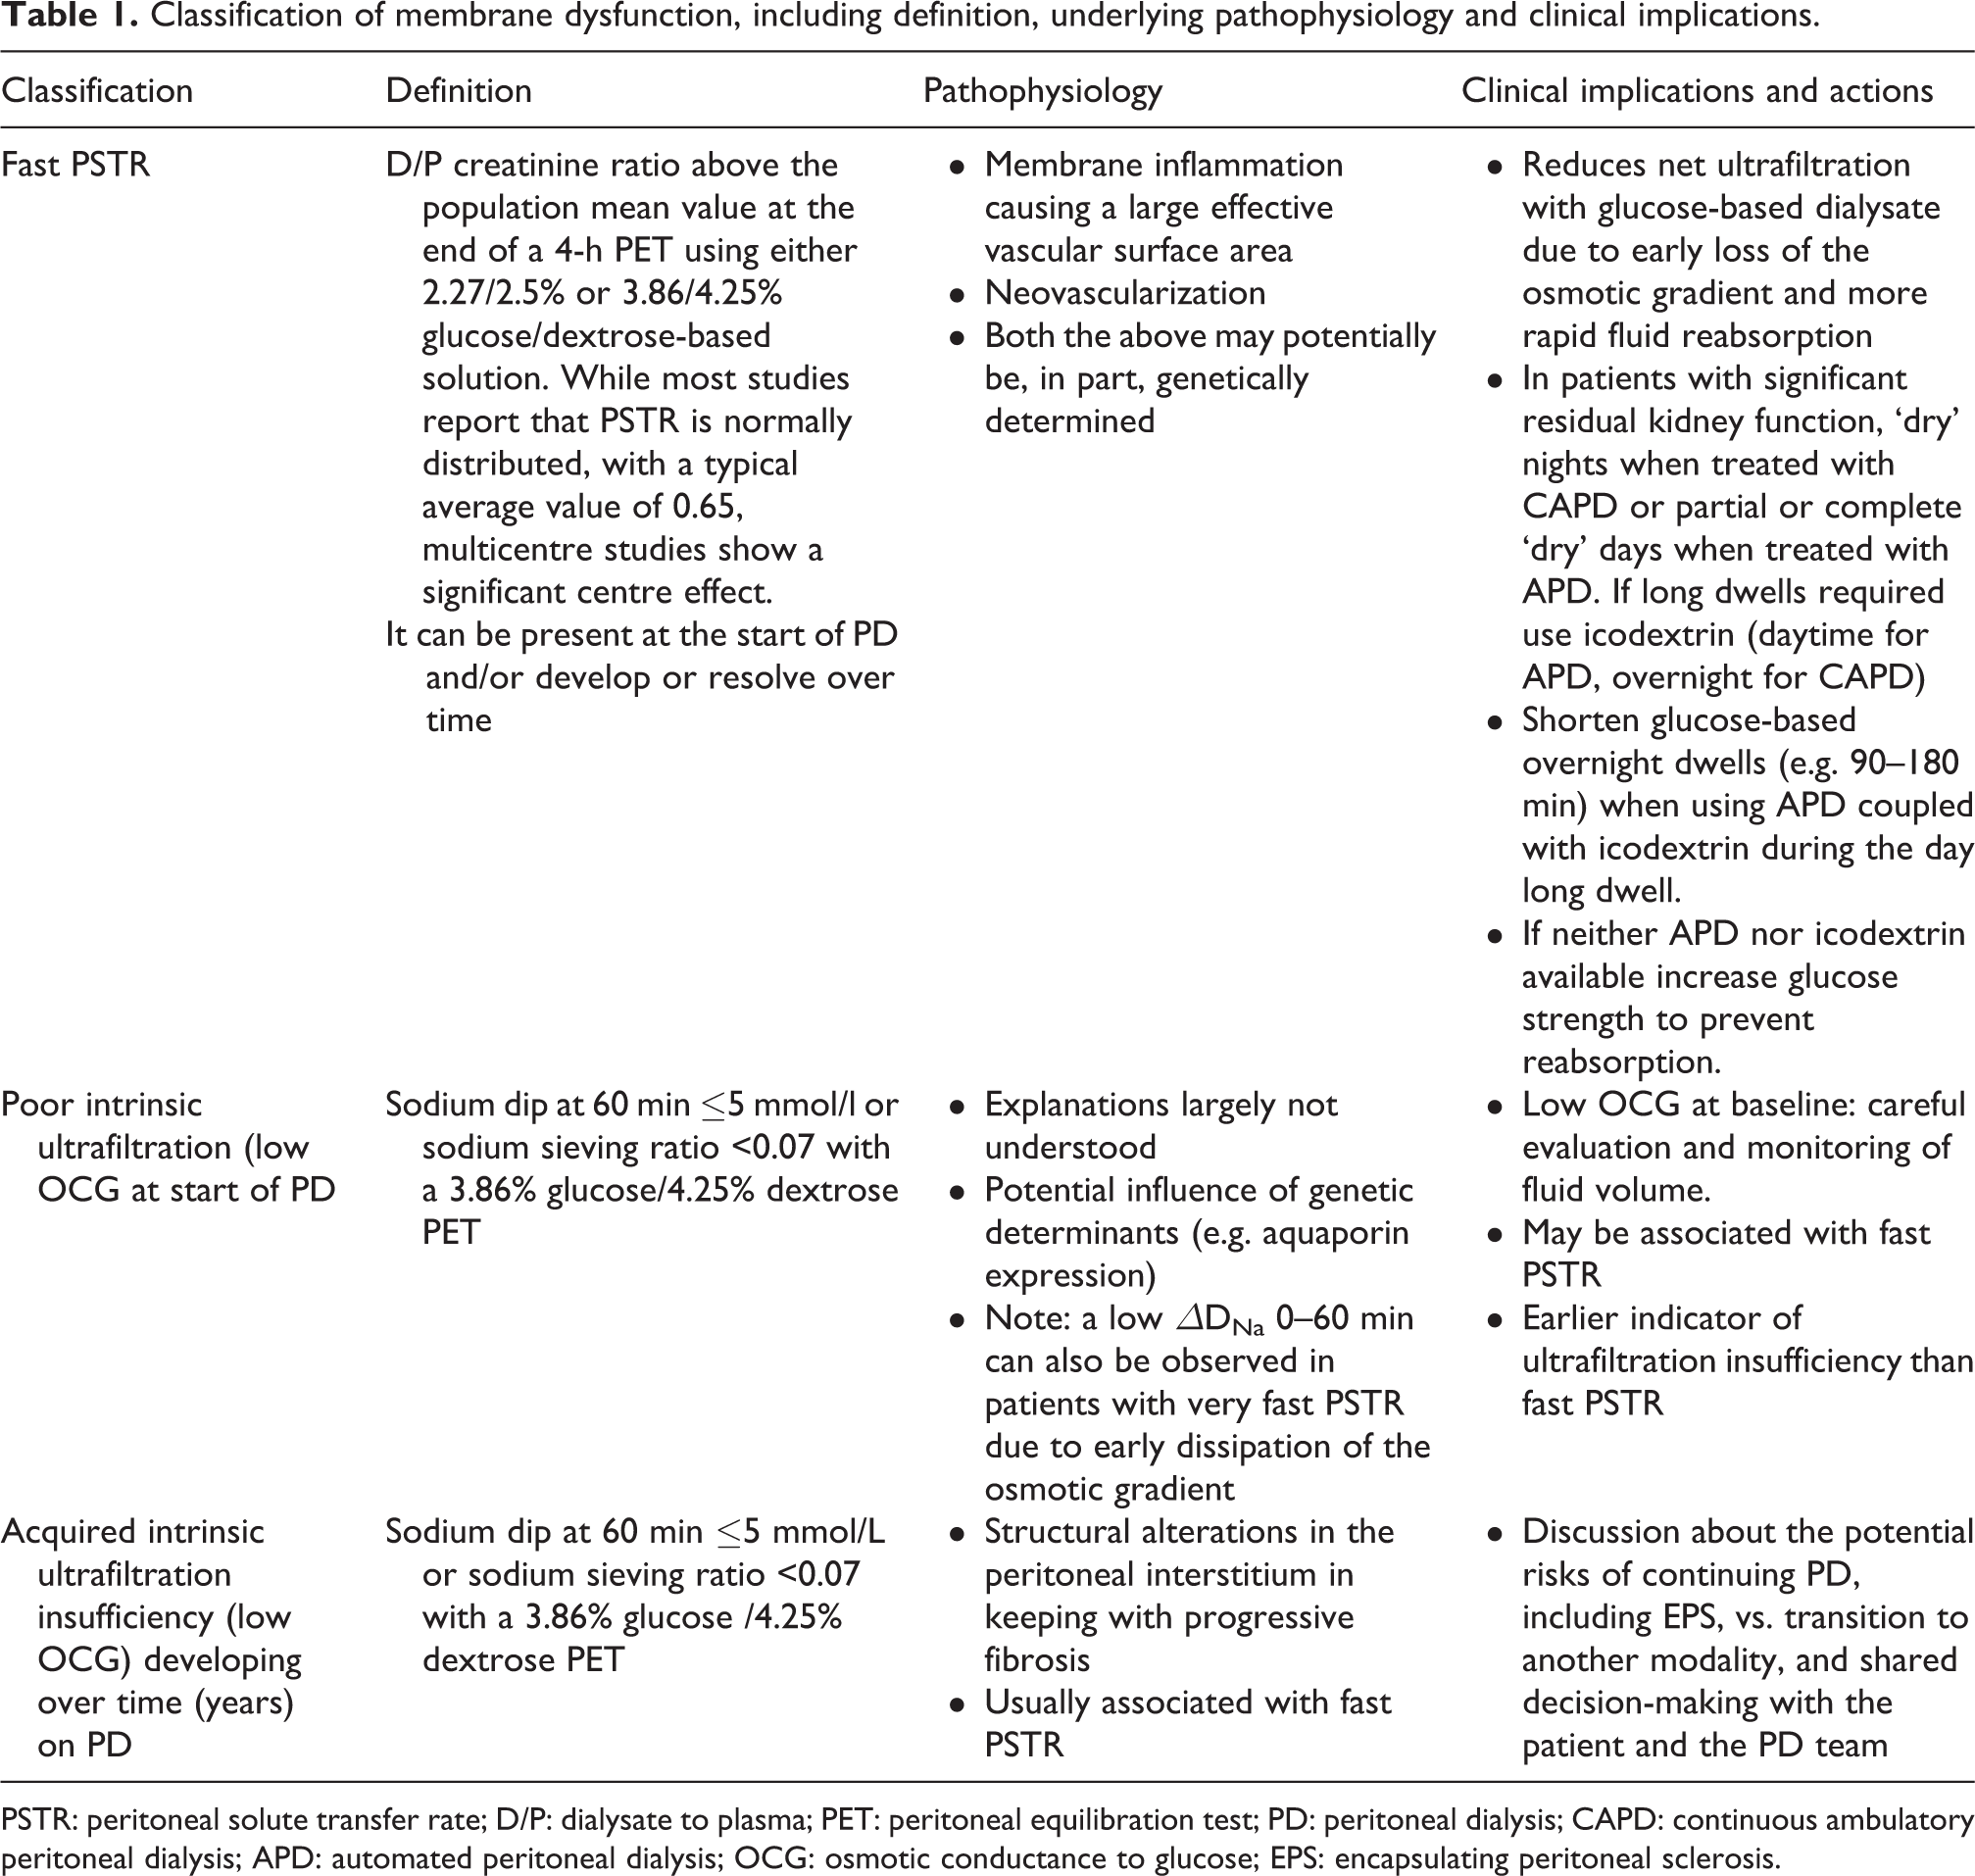
PSTR: peritoneal solute transfer rate; D/P: dialysate to plasma; PET: peritoneal equilibration test; PD: peritoneal dialysis; CAPD: continuous ambulatory peritoneal dialysis; APD: automated peritoneal dialysis; OCG: osmotic conductance to glucose; EPS: encapsulating peritoneal sclerosis.
It should be recognized that there are potentially other explanations as to why poor net UF may occur. These might include mechanical problems affecting dialysate drainage, leakage of dialysate outside the peritoneal space, high intraperitoneal pressure causing a reversal in flow of fluid, either across the capillary bed or into the peritoneal tissues, or excessive fluid ‘lymphatic absorption’. These problems cannot be described as peritoneal membrane dysfunction as such but must be considered when evaluating the peritoneal membrane (see case examples in Online Supplement Appendix 3 and text underpinning guideline 5).
It should also be remembered that different types of dysfunction may coexist.
(1)
Clinical evidence and implications
A fast PSTR can be present at the start of dialysis or can appear after exposure to PD solutions over variable lengths of time. It has long been recognized that there can be about a three-fold inter-individual variability in the PSTR at the start of PD. In a study from 764 facilities operated by a large dialysis provider organization in the United States, over 10,000 people were evaluated with 2.5% dextrose at a median of 39 days from start of PD. The mean (± standard deviation) D/P of creatinine and UF volume at 4 h were 0.65 ± 0.12 mL and 281 ± 254 mL, respectively. 45 This compares with a mean D/P creatinine ranging between 0.62 and 0.73 as reported in a number of cohort studies from around the world (see Table 2). Many of these studies, including more than 18,000 patients from all regions of the world, have shown that the faster the solute transfer rate is the higher is the risk for death and hospitalizations. The largest of these studies demonstrated that the relationship between PSTR and adverse health outcomes increases across the entire clinical range, and it is clinically important when the 4-h D/P creatinine is higher than the mean for the population (>0.65 for this population). It is not possible to give a generally applicable cut-off value, however, as multicenter studies, such as those shown in Table 2, show that there is a clear centre effect, and possible a regional effect seen when measuring PSTR, likely due to different methods for measuring blood and dialysate creatinine levels, including adjustment for glucose concentration in the dialysate. 42,45 –53 Ideally, centres would establish their own normal range (a further argument for undertaking routine measurements in all newly established patients at a standardized time point), but it is recognized that this may not be practical, especially for many smaller centres. One solution to this would be the national reporting of membrane function tests, as is achieved by the ANZDATA registry. 50
Variation in the average values of dialysate:plasma ratio of creatinine at 4 h taken from a sample of cohort studies around the world.
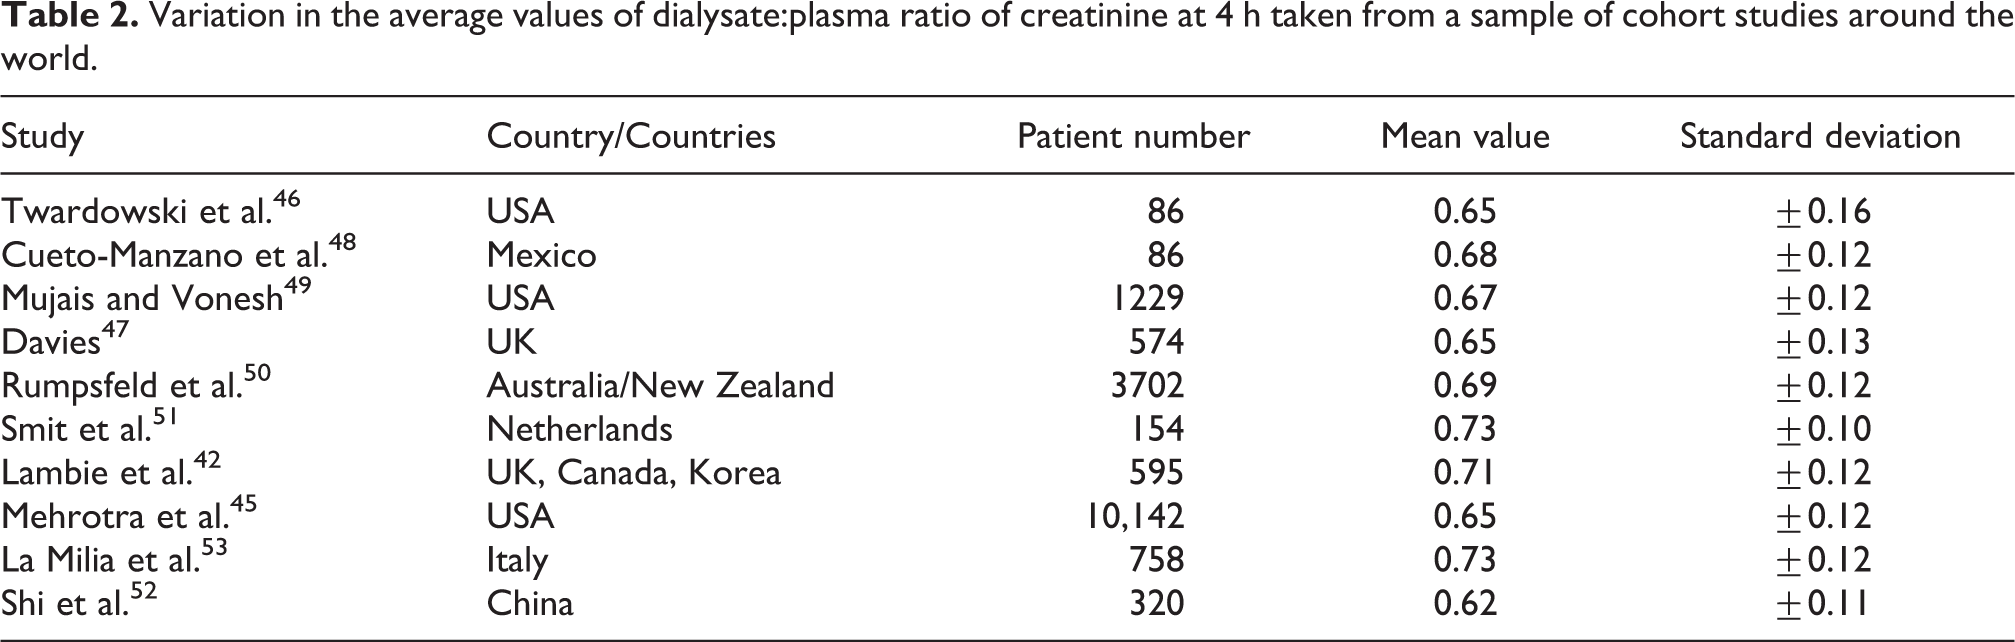
There is also strong evidence that PSTR increases with time in patients treated with PD; typically, in 1 of every 3 patients the 4-h D/P creatinine increases by at least 0.1 after 1-year treatment with PD. 47,54 –61 The drivers of this change are likely to include exposure to glucose 54,62,63 and glucose-derived products in conventional solutions, 64 infections 61,65 and earlier loss of residual kidney function, likely in part due to the increased requirements for hypertonic glucose. 62
Peritoneal inflammation
Only 5–11% of the total inter-individual variability in PSTR can be explained by demographic or clinical variables. After adjusting for the centre measurement effect, it is significantly and independently faster in men, diabetics, lower body mass index and those with more residual kidney function, but these effects are small. More important seems to be the local amount of peritoneal inflammation as determined from dialysate interleukin-6 (IL-6) levels. Dialysate IL-6 concentration is, despite the dilutional effect of 2 L of instilled dialysate, typically higher than the blood IL-6 levels (up to 3 orders of magnitude) and it correlates with other locally produced inflammatory cytokines. It is the strongest known association with PSTR, 42,66 –68 whereas systemic inflammation is associated with comorbidity and thereby patient survival. 42 The drivers of this local peritoneal inflammation remain unclear – but some of the between patient variation may by accounted for by genetic factors, as determined from small single centre studies of several different candidate genes, for example, those associated with IL-6 production. 69,70
Despite their observational nature, these studies suggest a causal relationship between higher IL-6 levels in the peritoneal effluent and PSTR. This is further supported by biological plausibility, in that local inflammation will increase the vascular surface area, so increasing the creatinine diffusion capacity, as also happens during more intense inflammation during peritonitis. 71 There is increasing evidence that the longitudinal changes in PSTR are associated with increases in the dialysate IL-6 concentration 59,68 (unpublished data, Global Fluid Study).
(2)
Clinical evidence and implications
PSTR explains less than 20% of the variation in the inter-individual differences in UF capacity. In one large cohort of incident patients with systematic evaluation of transport characteristics, using a modified 3.86% glucose-based PD solution, mean (SD) net UF (corrected for bag overfill) was 675 mL (±308), with values ranging from −570 mL to 1506 mL; that the sodium dip also varied considerably between individuals (mean (SD) dip at 60 min was 8.4 mEq/L (±3.8), ranging between −3 mEq/L and 20 mEq/L) 53 implies that other mechanisms must be important. This considerable variation in the sodium dip suggests that there are inter-individual differences in the effectiveness of glucose as an osmotic agent, and therefore difference in OCG at baseline. Because the sodium dip reflects the proportion of fluid travelling across the membrane without solute (in this case sodium), it is also referred to as ‘free water transport’. The sodium dip, as defined later in more detail, (section underpinning guideline 4a) is a reliable surrogate for OCG, 72 and it is of note that reduced dip was identified as the only independent predictor of the risk of developing UF failure during the course of PD in an Italian cohort. 73
The reason for such inter-individual variability in OCG already at the start of PD remains unknown but may potentially be explained by genetic polymorphisms, as observed for PSTR.
(3)
Clinical evidence and implications
Systematic and longitudinal follow-up of peritoneal function parameters in patients on long-term PD has contributed to a better understanding of the relationship between severe interstitial fibrosis and the uncoupling of reduced UF due to increasing PSTR and that caused by a UF reduction due to intrinsic membrane injury. 47,54,56,63 It is likely that an acquired reduction in membrane efficiency only occurs once significant fibrosis is already established and even then this is far from inevitable as the majority of individuals on long-term PD (>5 years) do not develop UF insufficiency. An even smaller proportion go on to develop encapsulating peritoneal sclerosis (EPS), an extremely rare but dramatic complication of long-term PD that is characterized by an exaggerated, inflammatory fibrogenic response of the visceral peritoneum that cocoons the bowel, leading to episodes of intestinal obstruction. 74,75 Retrospective cohort studies show that peritoneal UF capacity decreases well before the clinical manifestations of EPS, which may present after dialysis has been stopped. Progressive membrane fibrosis, therefore, seems to be a risk factor for EPS as in these individuals there is a progressive reduction of OCG prior to the development of the condition. 55,56,63,75,76 Based on these observations, a progressive and excessive decline in OCG (e.g. loss of sodium sieving or sodium dip) might be used as an independent predictor for the risk of EPS. 55 –57,75,76 At a structural level, this functional defect can be linked to specific alterations of the collagen matrix in the peritoneal interstitium of patients with EPS, including increased density of collagen fibres, whereas AQP-1 expression remains unchanged. 56 These observations are supported by predictions from the serial three-pore membrane/fibre matrix and the distributed model for peritoneal transport. These models predict that interstitial fibrosis constitutes an additional resistance to water transport, outside the capillary wall, or a mechanical barrier limiting the penetration of glucose around peritoneal capillaries, thereby reducing the OCG across the capillary wall. 56,21
Progressive fibrosis
Prolonged exposure to PD solutions, possibly exacerbated by episodes of peritonitis, causes sustained inflammation and progressive damage to the peritoneal membrane, which undergoes angiogenesis, hyalinizing vasculopathy and fibrosis. 77 –82 These morphologic alterations have been associated with increased PSTR and UF failure, 77,78 thereby constituting a major barrier to long-term PD, through an increased risk of technique failure, morbidity (including increased risk of EPS) and mortality. The role of peritonitis in developing EPS is less clear, partly because it often precludes long-term PD. It should be pointed out that the morphological features of EPS are different to those of progressive fibrosis, characterized by inflammation, fibrin deposition and expression of thrombospondin 83 and that there is no role for routine peritoneal biopsy in the prediction of this condition. 84
A full discussion of the cellular and molecular mechanisms of peritoneal fibrosis is beyond the remit of this guideline. Extracellular matrix-producing myofibroblasts play a role, although controversy still exists about their origin, with potential sources including local resident fibroblasts, bone morrow-derived pericytes, mesothelial-to-mesenchymal transition and endothelial-to-mesenchymal transition. 85,86 The local production of pro-inflammatory (e.g. IL-6, TNF-α, MCP-1), proangiogenic (e.g. VEGF) and profibrotic (e.g. TGF-beta, CTGF, PDGF) molecules raises the possibility of using biomarkers to assess this process, but so far their validation is insufficient to recommend their use in clinical practice. 57,87 –91
Overview of the available membrane function tests and what they measure
Over the years, a number of membrane functions tests have been developed to investigate peritoneal membrane dysfunction. The first test to provide clinical useful information was pioneered by Twardowski in 1987 and is called the PET. 46,92 A number of modifications of this test have evolved and been combined with additional measures, some primarily for research purposes for which they remain very important. These are summarized in Table 3. For everyday clinical purposes, this guidance is based on the PET, that is, the estimation of PSTR at 4 h and the UF capacity, and the 1 h sodium dip, tests for which the clinical evidence is greatest.
Summary of different peritoneal function tests and the membrane characteristics they measure.
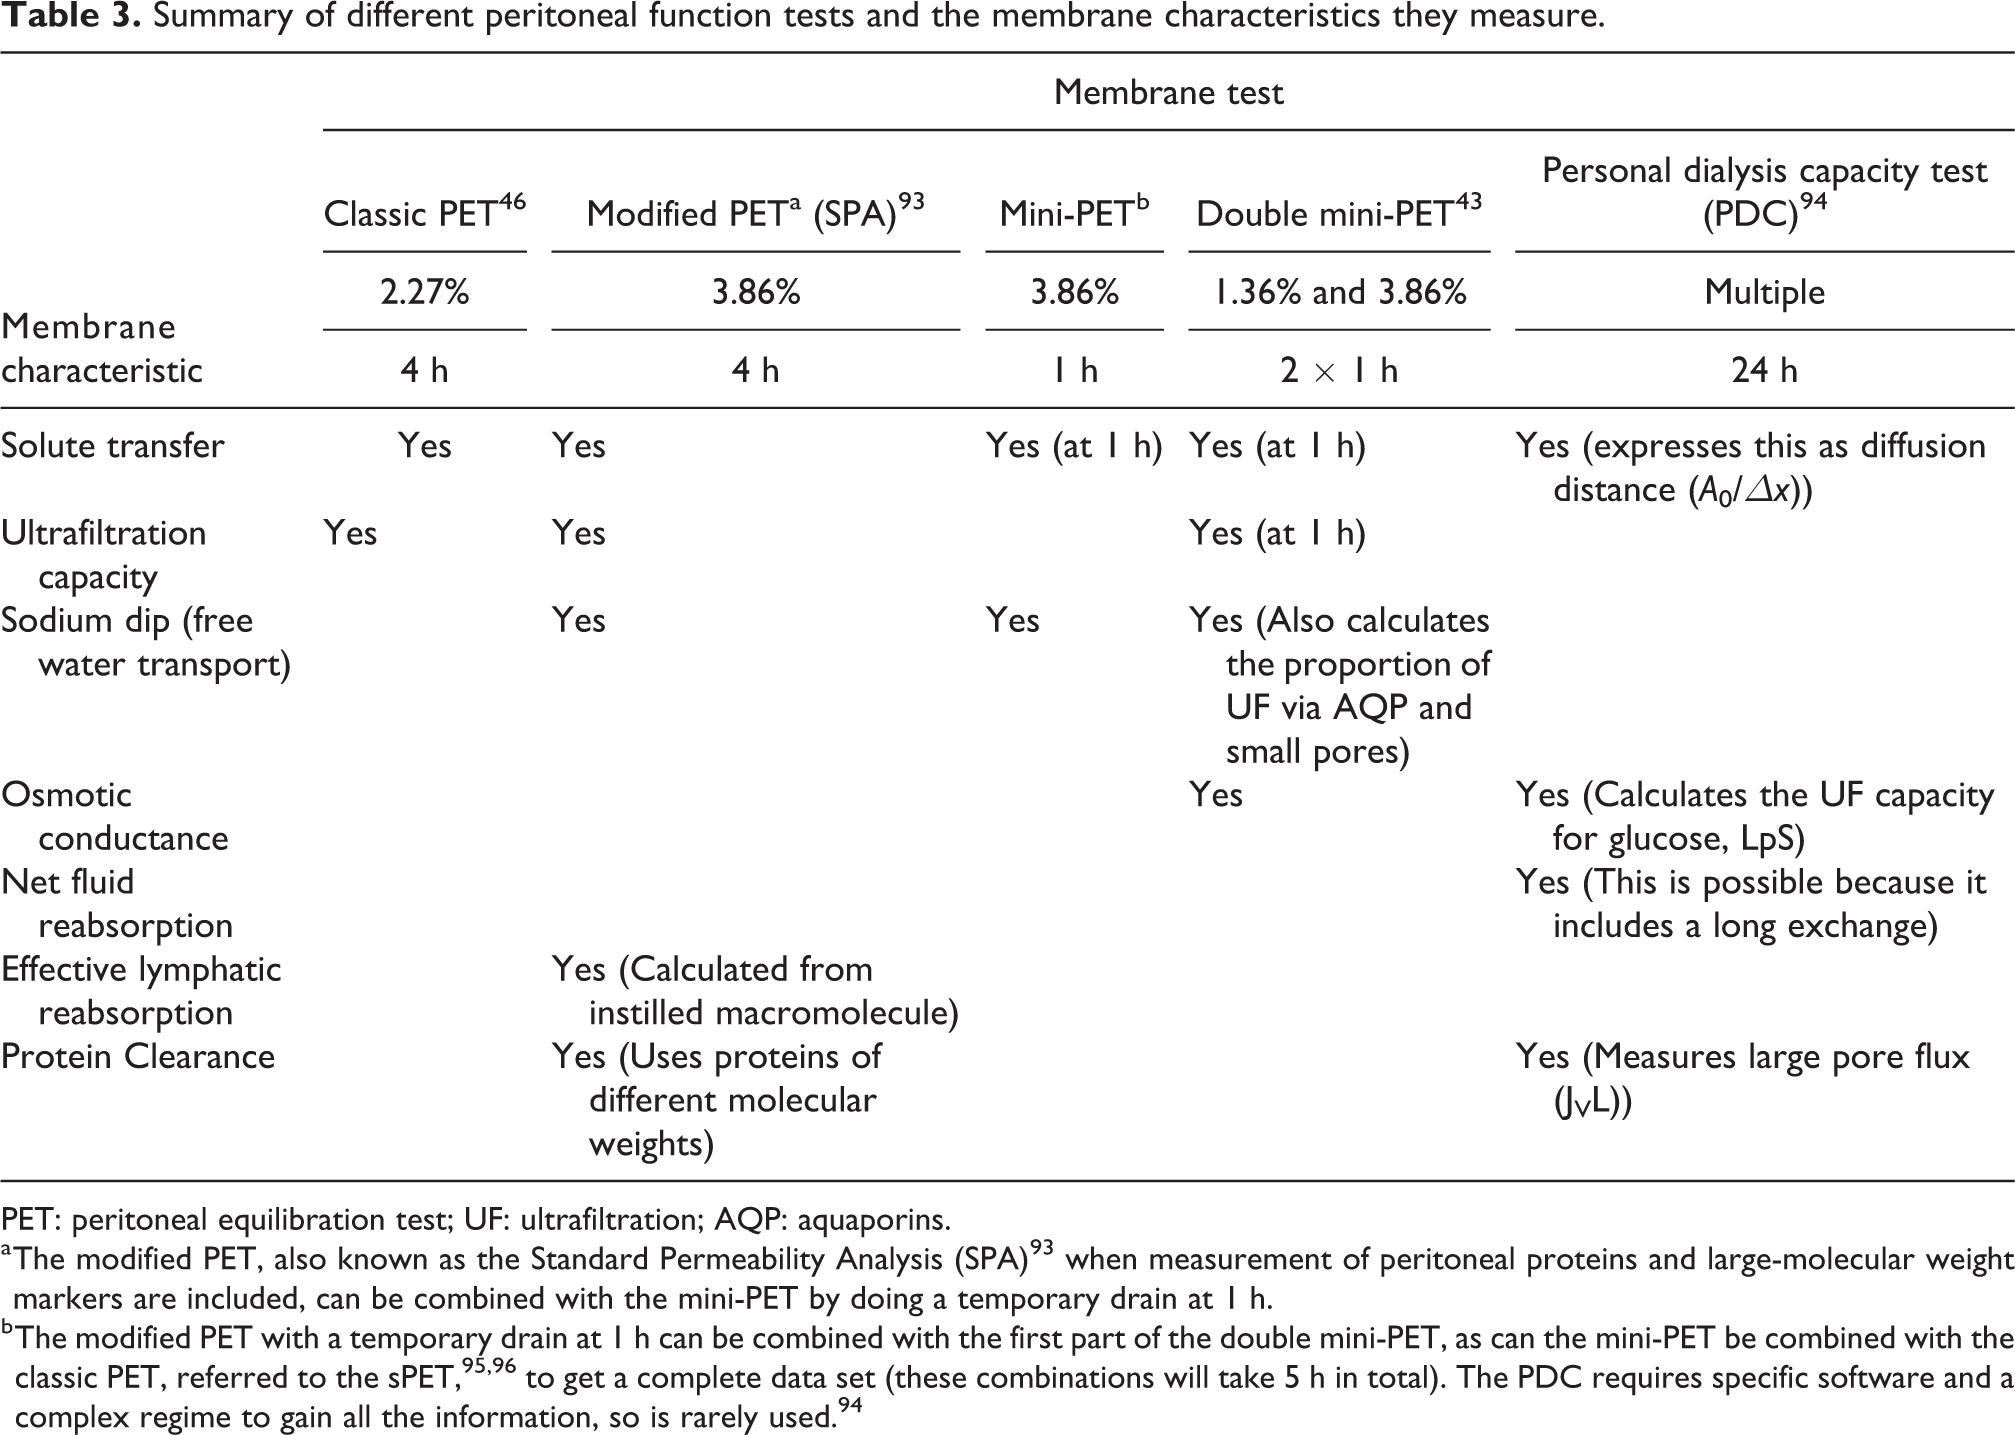
PET: peritoneal equilibration test; UF: ultrafiltration; AQP: aquaporins.
a The modified PET, also known as the Standard Permeability Analysis (SPA) 93 when measurement of peritoneal proteins and large-molecular weight markers are included, can be combined with the mini-PET by doing a temporary drain at 1 h.
b The modified PET with a temporary drain at 1 h can be combined with the first part of the double mini-PET, as can the mini-PET be combined with the classic PET, referred to the sPET, 95,96 to get a complete data set (these combinations will take 5 h in total). The PDC requires specific software and a complex regime to gain all the information, so is rarely used. 94
Measuring PSTR: The Peritoneal Equilibration Test, PET (underpins guideline 2a)
Standard PET (4-h exchange)
The detailed procedure for undertaking a PET is shown in Online Supplement Appendix 3. This may be performed using either a 2.27% glucose/2.5% dextrose exchange as originally described by Twardowski 46,92 or a 3.86% glucose/4.25% dextrose exchange. 1,51,97 The primary result is expressed as the 4-h D/P creatinine ratio; additional results often include 4-h dialysate:0-h dialysate glucose, and UF volume (see next section on UF capacity). There is no meaningful difference in the estimation of PSTR (specifically D/P creatinine at 4 h) between the different glucose concentrations. 44,98 –101 Indeed, differences such as there are, are within the reproducibility of the test, typically a ratio value of 0.1, which is no greater than the between–centre variation in this measurement already referred to.
In choosing which glucose strength to use for the PET, the pros and cons are outlined in Table 4. Broadly, the advantages of using 2.27% glucose/2.5% dextrose are that clinical validation with large registry studies is much stronger whereas the use of higher glucose concentration enables the combined estimate of PSTR with the sodium dip at 1 h and the maximal UF capacity, strengthening the diagnostic value of the test (see section underpinning guideline 4). Evidence from our survey of practice in China, South America and in the PDOPPS and Bio-PD study suggests that despite the ISPD guidance in 2000 recommending that the stronger glucose strength be used, this has not been adopted (see Online Supplement Appendix 2).
Comparison of the use of middle and high strength glucose when undertaking a 4-h Peritoneal Equilibration Test.
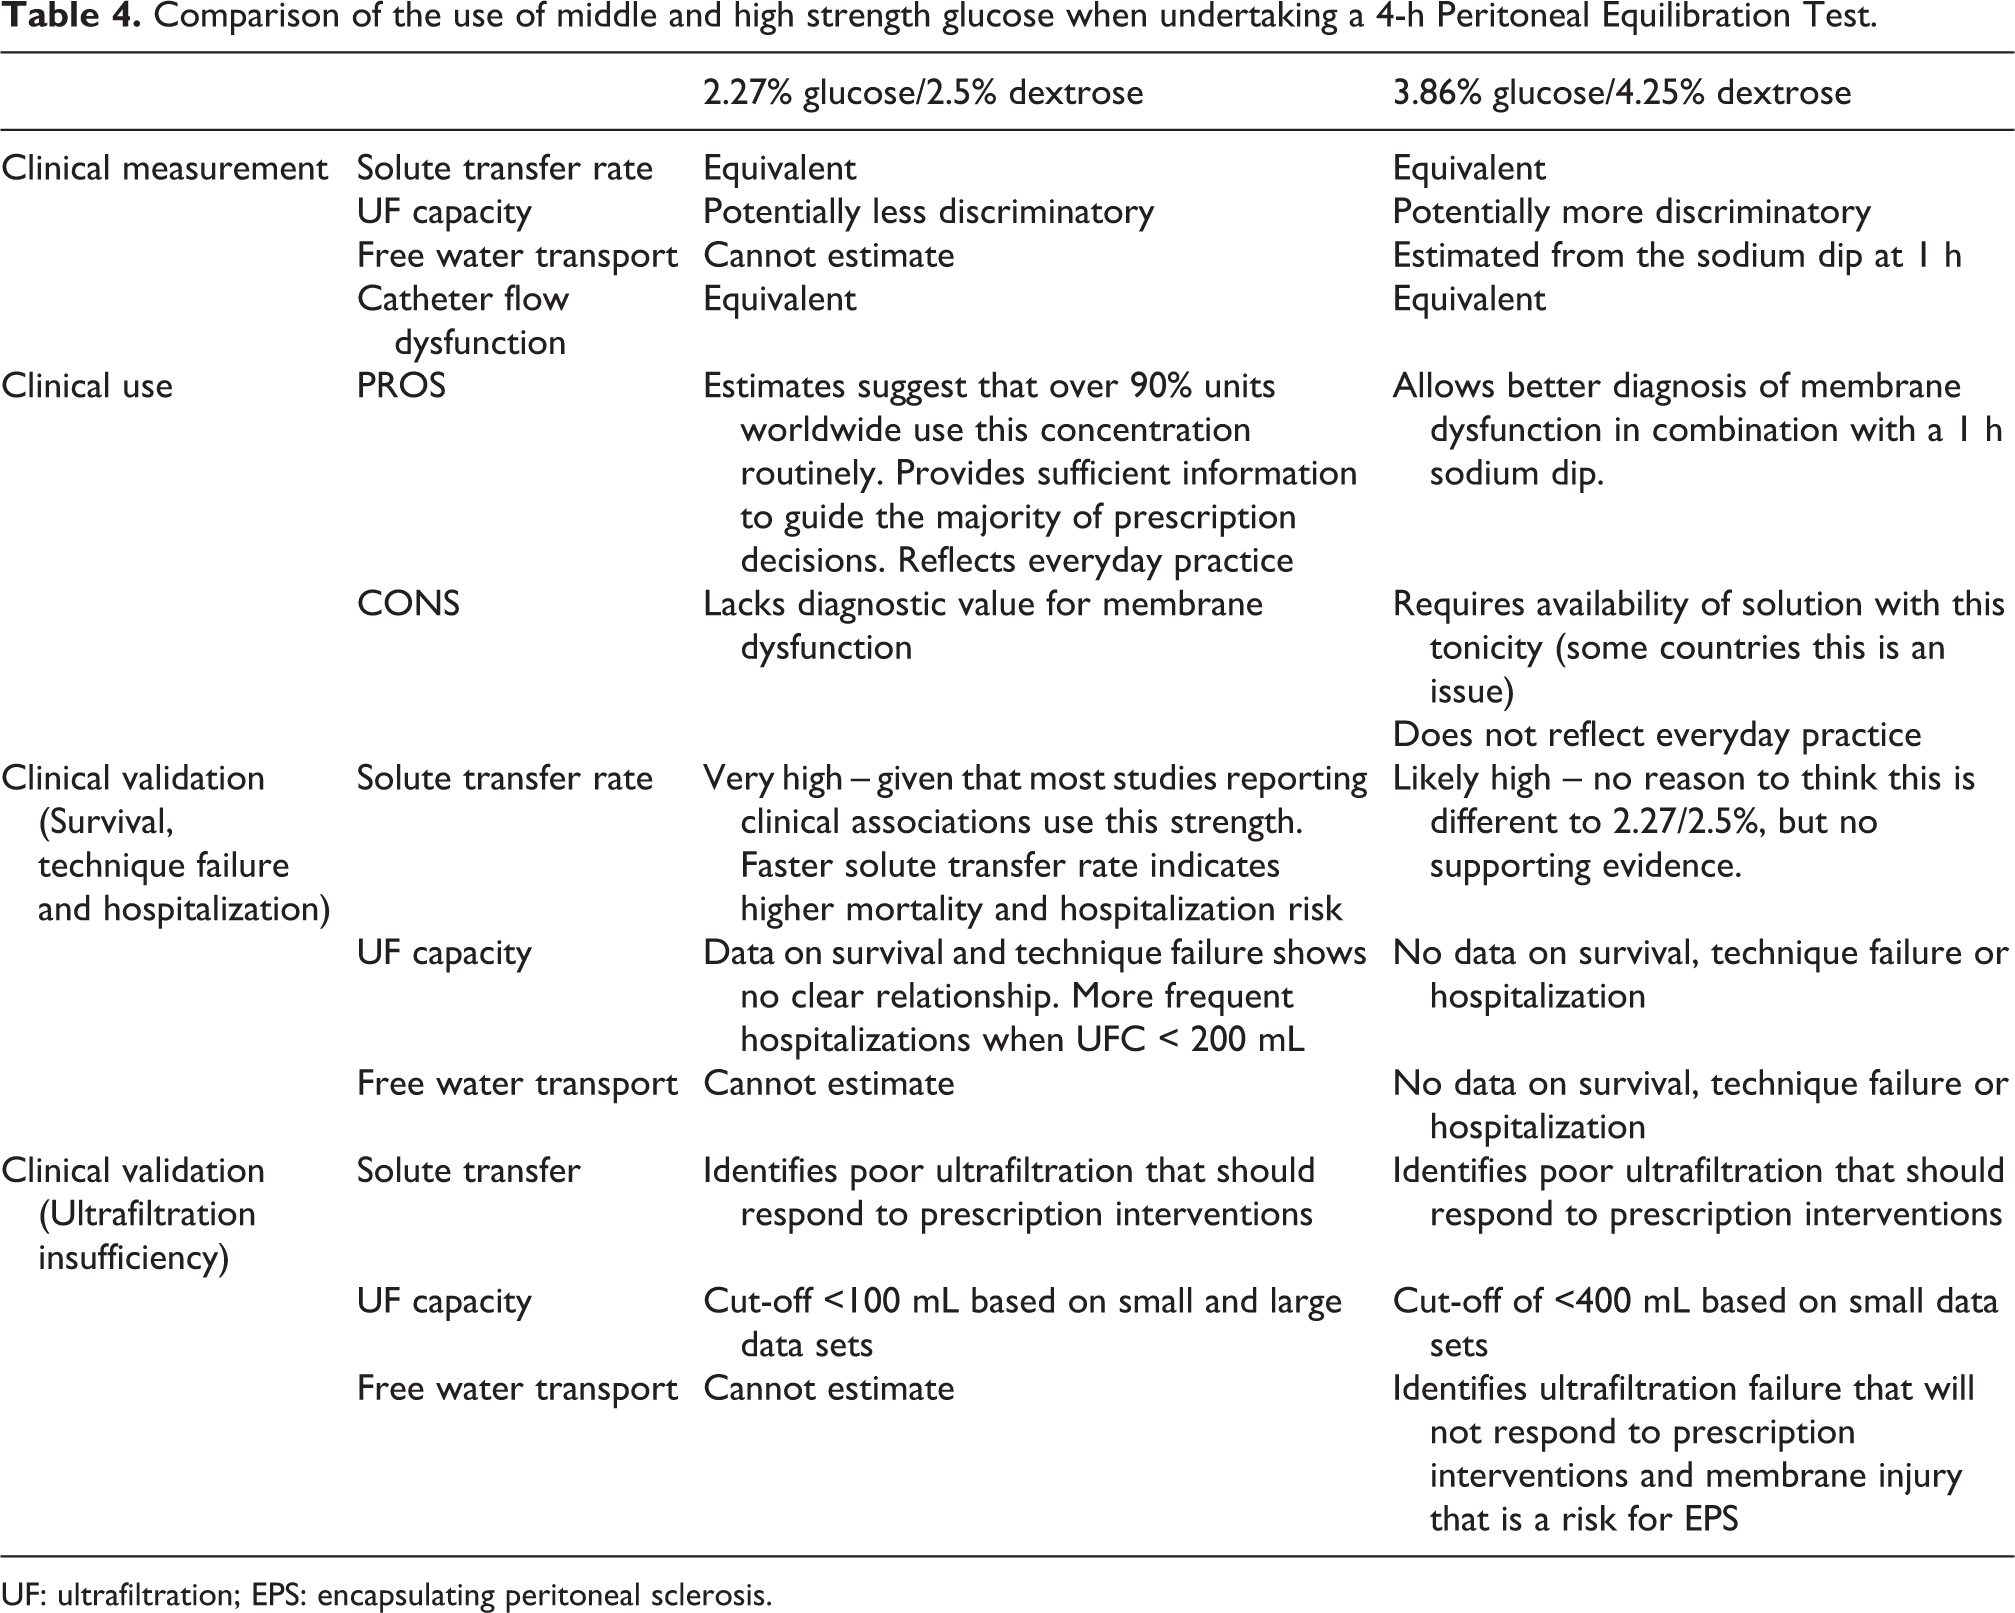
UF: ultrafiltration; EPS: encapsulating peritoneal sclerosis.
Due to its prognostic value, it is recommend that the PET is undertaken in all patients early in the course of PD (between 6 weeks and 3 months). 47,102 The reason for this is that there are significant earlier changes PSTR (in either direction, but more commonly an increase in PSTR). Given the known centre effects on the measurement, one of the advantages in screening all patients at this standardized time is that the mean value for the population can be established. PSTR is normally distributed with a very reproducible standard deviation (0.12) across different studies. It is also reproducible within the individual with a coefficient of variation of <10% within a month of testing. There is no evidence of the benefit of repeat testing (although a significant number of centres will do this at least on an annual basis), but given that it is clear that PSTR can change over time it is appropriate to repeat the test to explain a clinical change – for example a worsening in fluid status or an apparent change in UF. Whereas long-term treatment with PD is associated with increased PSTR, this is not discriminatory when predicting the development of EPS. 55,88
Interpretation of and mitigation of fast PSTR (underpins guideline 2b)
As already discussed, a faster PSTR is associated with higher mortality and hospitalization risk in PD (see Table 5). The hazard ratio for overall mortality risk is 1.11 (1.05, 1.17) for every 0.1 higher D/P creatinine ratio. 106 This is thought to be due to in part to the important effects faster PSTR has on the net achieved UF volume. The mechanism is due to the combination of less actual UF (early loss of glucose gradient) 107 and increased time for fluid reabsorption once the osmotic gradient has dissipated (disproportionately greater with fast PSTR). 108 There is also a risk of underestimating the problem in continuous ambulatory peritoneal dialysis (CAPD) patients, as bags are typically overfilled (to account for evaporation and the flush-before-fill procedure), which might – unless subtracted – lead to a significant overestimate in actual UF of 400–800 mL per day. 109,110
Adverse outcomes associated with faster PSTR.
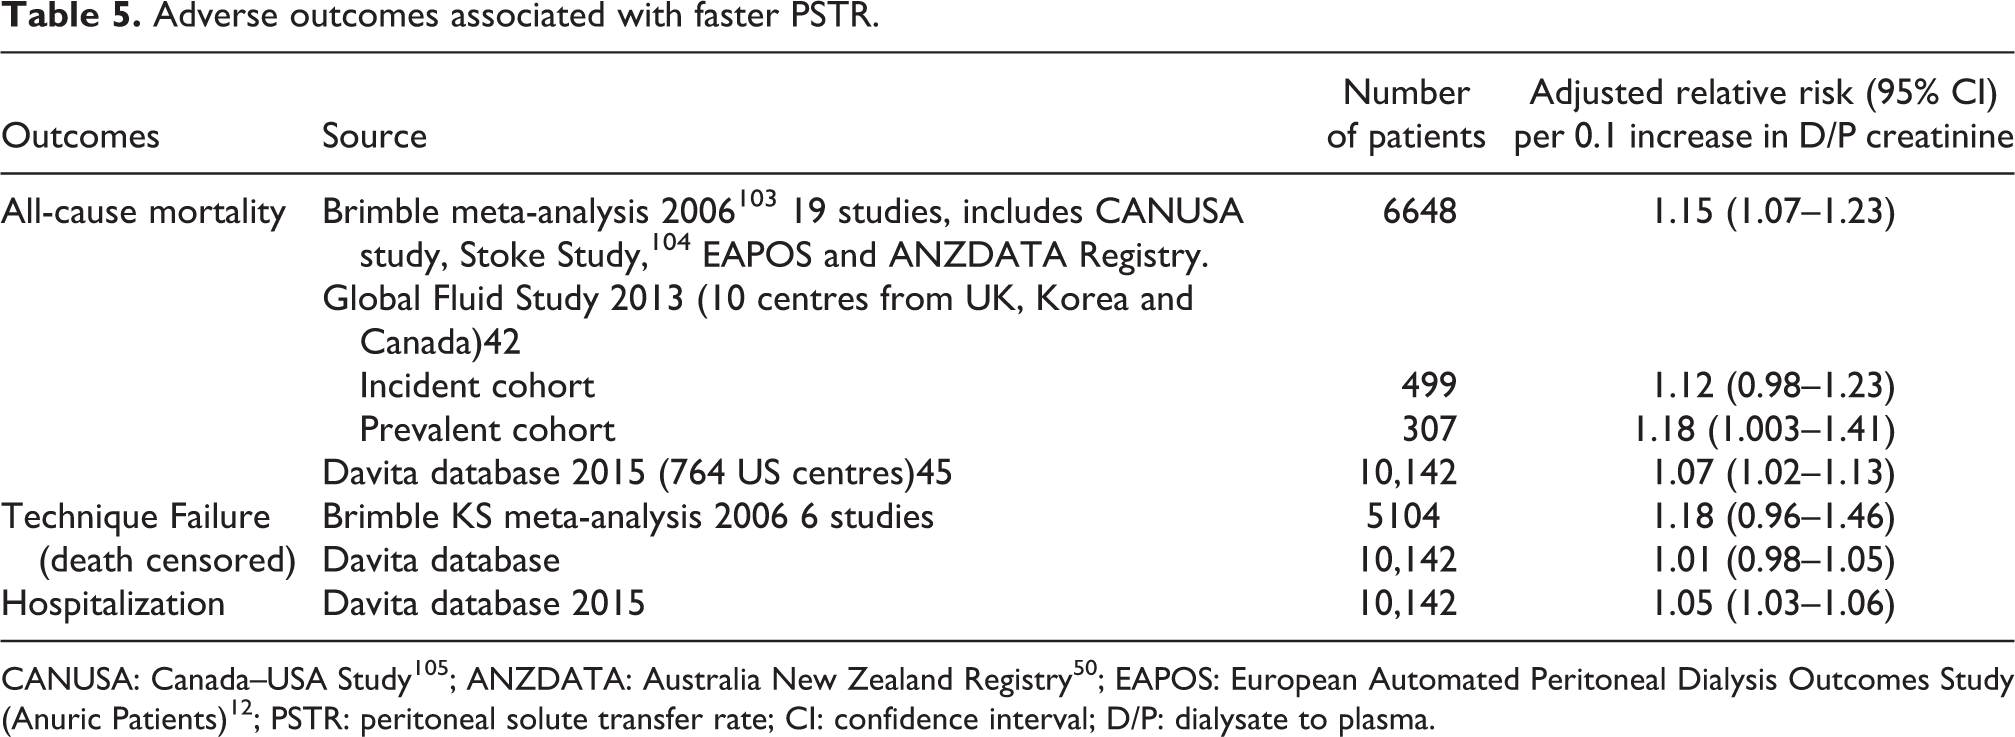
Other than using dialysate with higher glucose concentration, two rational approaches to the problem are to (a) shorten the length of dwell with fluid reabsorption and (b) to use a solution that does not lose its efficacy during a long exchange, that is, a polyglucose solution (icodextrin) by achieving colloidal osmosis. Automated peritoneal dialysis (APD) can be used to shorten the dwell length for part of the day, and there is non-randomized observational data that indicate some mitigation of the mortality risk. 45,103,111 When combined with a dry day strategy, which is possible when there is residual kidney function present, this might be sufficient. However, the risk of fast PSTR was not fully mitigated by the use of APD in the largest (North American) study looking at this. 45 This could mean that the problem of fluid reabsorption in the long day dwell was not being addressed or that there is some other explanation for the association between PSTR and mortality, such as other unknown determinants (e.g. genetic factors) or increased peritoneal protein losses (see later). It is possible that very slow PSTR is associated with worse outcomes on APD;111 the reason for this is not certain but could reflect poor solute clearance (e.g. sodium or phosphate) especially if used with a dry day. It should be emphasized that provided the choice is available, most can be treated with either CAPD or APD according to lifestyle references, provides care is taken to ensure that significant fluid reabsorption is not occurring.
There is substantial evidence that using icodextrin in the long exchange avoids the prolonged fluid reabsorption phase that occurs with glucose-based solutions, even up to 16 h, 112 so increasing net UF which then translates into an improvement in fluid status. 113,114 Cochrane reviews and a recent enriched meta-analysis of trials that includes unpublished registration studies show that icodextrin does increase net UF, especially in those with faster PSTR and that it reduces episodes of fluid overload. 115 –117 There is no impact on technique survival and a marginal benefit on patient survival (based on small numbers of events – hence the grading of this recommendation).
Measuring UF capacity (underpins guideline 3)
The previous ISPD guideline on assessing membrane function1 focused on using the UF capacity to define UF failure. While this updated guideline recognizes the literature on which this was based, it has de-emphasized its significance for three reasons. First, the emphasis of this guideline is to identify membrane dysfunction as a relative problem rather than failure as a binary event using an absolute cut-off value. This recognizes the fact that these measures are all, in truth, continua and do not represent clear cut ‘disease’ entities. People come in different shapes, sizes and with varying behaviours. Some will need more UF to maintain health and well-being, others will wish to use less glucose. Second, the measurement of UF capacity (which is included in the PET, see also Table 2) while very simple is open to a high degree of error, especially when there is any degree of catheter dysfunction, or as in some people the pelvic sump volume of undrained fluid is high or variable. Accurate measurement of this residual volume is not easy in routine practice. Third, it has little diagnostic value.
Nevertheless, measuring UF capacity is very simple and thus an excellent screening tool. Insufficient UF should be suspected when the net UF from a 4-h PET is <400 mL (3.86% glucose/4.25% dextrose) or <100 mL (2.27% glucose /2.5% dextrose). With the exception of the large North American study,45 the number of patients with UF failure in the studies upon which these values are obtained are quite small (<100 in total) but they are well characterized. 51,92,97 Membrane dysfunction should always be considered in anyone who is struggling to maintain adequate fluid status.
Measuring sodium sieving/sodium dip (underpins guideline 4a)
The detailed procedure for undertaking a measurement of the sodium dip, including the measurement of dialysate sodium, is shown in Online Supplement Appendix 3. The sodium dip during a high concentration 3.86% glucose/4.25% dextrose exchange is maximal between 1 h and 2 h of the exchange and represents the rapid influx of free water into the peritoneal cavity via AQPs. The test is undertaken at 1 h so as to minimize the amount of sodium diffusion through the small pores, but it should be understood that this will occur, and more so when PSTR is at the higher end. Dialysate sodium should be measured using the indirect electrode method. 118
The sodium dip is expressed as the absolute fall in the dialysate sodium concentration from baseline, [Na+] t = 0 − [Na+] t = 60 min .
It can also be expressed as the sodium sieving ratio: 1 − ([Na+] t = 60 min/[Na+] t = 0.
It should be noted that the initial dialysate sodium differs according to the manufacturer and solution type, ranging between 131 mmol/L and 134 mmol/L.
The normal range for sodium dip, established from a cohort of 758 incident patients, is 9 mmol/L, interquartile range 6–11 mmol/L. 53 This is equivalent to a sodium sieving ratio of approximately 0.07, range 0.055–0.085.
Interpreting sodium sieving/dip (underpins guideline 4b)
The sodium dip can be considered as an indirect assessment of FWT. 43,76,119 It will be affected by the PSTR to some extent, in that this is associated with more rapid diffusion of sodium and less efficient UF, but it does provide the clinician with additional information. The sodium dip is effectively lost in the presence of severe UF insufficiency 120,121 and a progressive decline in the sodium dip over some years is a better discriminator for subsequent UF failure than the longitudinal change in PSTR. 73 In several studies, the progressive reduction in the sodium dip was also a better discriminator of those patients who were more likely to go on to develop EPS. 55,56,76 These studies identified a sodium dip ≤5 mmol/L or a sodium sieving ratio of <0.03 as high risk for EPS.
In interpreting the sodium dip, it is important to recognize that it indicates a reduction in FWT for whatever reason. It is not simply a measure of AQP expression as FWT may be impeded by other mechanisms, most notably the development of progressive fibrosis and damage to the capillaries affecting barrier function. 32,56 At the start of PD, it may reflect other mechanisms of intrinsic membrane function. There is insufficient evidence to recommend sodium dip measurement as a matter of routine in all people on long-term dialysis. However, in line with ISPD guidance, staying on PD long-term should always be considered carefully for many reasons, of which membrane function may be one, and the pros and cons interpreted in the context of competing risks. 75,122
Peritoneal protein loss and other aspects of membrane function (underpins guideline 5)
(1)
Pathophysiology and measurement of protein clearance
As already discussed, macromolecules mainly cross the peritoneal capillaries via convection through large pores (25–30 nm) with the primary drivers for the rate of peritoneal protein loss being the transcapillary hydrostatic pressure gradient and the number of large pores available for transport. 123 The precise nature of the ‘large’ pores has been debated, but they do not appear to represent a charge selective barrier or be due to transcellular transport by intracellular vesicles. 124 In other vascular beds, large pore numbers are increased in the presence of inflammation, 123 so it would be anticipated that patients with fast PSTR also have high protein losses – and this is indeed the case. 125 However, it is not quite this simple as albumin, which represents about half of peritoneal protein losses is also able to pass through small pores, 34 which are also associated with inflammation. In fact, intraperitoneal IL-6 concentration is associated with peritoneal protein losses independently from PSTR, so it would seem that both are important. 125 Interestingly, peritoneal protein loss is also associated with comorbidity and this has led to the idea that it also reflects systemic endothelial dysfunction. There is indeed strong evidence for endothelial dysfunction in PD patients 126 with a significantly greater systemic transcapillary escape. 127 However, this seems to be associated with markers of endothelial barrier function (one possible candidate being damage to the endothelial glycocalyx) rather than systemic inflammation, which in multivariable models is clearly not associated with peritoneal protein loss. 125 Hydrostatic back-pressure in patients with right-sided heart failure has also been proposed as a possible mechanism. 128
It is important to say something about how peritoneal protein loss is measured and whether it is expressed as total loss or clearance as these are reported differently. Protein loss is the direct measurement of dialysate protein, typically over 24 h (expressed in mg or g/d), whereas the clearance would be this value divided by the serum total protein (expressed as per unit time, such as mL/min, or L/week). If serum total protein is not available, the corrected serum albumin/0.4783 has been used. 29 It should be remembered when interpreting peritoneal protein losses that other factors will be important – for example systemic inflammation with suppressed albumin synthesis which will affect protein losses. Equally, higher peritoneal protein losses will exacerbate hypoalbuminemia.
Clinical significance of peritoneal protein losses
A number of studies have found that higher peritoneal protein loss is associated with lower survival, 129 –132 although this is not a universal finding, 125,126,133 more cardiovascular events 134,135 and higher peritonitis risk. 136 Most of these studies adjust for PSTR, which, as already mentioned, is strongly associated with protein loss, primarily through the mechanism of local, but not systemic, inflammation. 125 A low serum albumin is an important predictor of survival in both peritoneal and haemodialysis patients 137 and it may be that peritoneal protein losses are contributing to this association, although this is likely to be dominated by the associations with comorbidity and systemic inflammation, which when fully adjusted for negate the direct association with survival. 125 Overall, there is significant uncertainty in the interpretation and value of peritoneal protein clearance in routine clinical measurement, so it cannot be recommended at this point.
(2)
Net UF according to the TPM (see Figure 1) will be affected by the transcapillary hydrostatic pressure gradient. In particular, there is concern that a high intraperitoneal pressure will increase the amount of fluid reabsorption, especially when the osmotic or oncotic pressure gradients have dissipated. Some of this fluid will return to the peritoneal capillary circulation, driven by Starling’s forces (especially likely when the PSTR is high), 108 some will be pushed into the extracellular space of the membrane and subsequently find its way into the circulation via lymphatics. The precise route is unknown but can be inferred from the disappearance rates of large exogenous or radiolabelled molecules. 107,108,123,93 It is not feasible to measure fluid reabsorption via these two pathways in the routine clinical setting, as it requires the more complex sPET (see Table 3).
Intraperitoneal pressure, however, can be easily measured using the peritoneal catheter, and there are several studies showing that this increases in a linear fashion as the volume of fluid placed in the peritoneal cavity is increased 138 –140 with a normal range of 8–18 cm H2O when supine. It has been suggested that a supine pressure above this should be avoided, primarily to avoid the risks of leak and hernia formation. It should be remembered, however, that intraperitoneal pressure is very different in other situations (sitting, standing, coughing), so supine measurements are likely of limited value. 141 There is no strong evidence that this affects other clinical outcomes or UF (except perhaps in children) 142 and it is not recommended as a routine aspect of membrane function testing.
Resource implications and guidance for low resource settings (underpins guideline 6)
Undertaking measurements of membrane function does not come without resource implications. There is both a consumable and a human resource cost – the latter being no less important for the patient who has to give of their time and the likely associated out of pocket expenses than for the clinical staff time for undertaking a test. There has never been a comprehensive health economic evaluation of the value of membrane function testing, but in some resource settings the cost has been shown to be prohibitive – equating to the cost of between 10 and 30 dialysis exchanges. 143 In countries, such as the United States, over 90% of patients starting PD are eventually treated with APD without regard to PSTR. Indeed, there is no difference in the mean 4-h D/P creatinine of patients treated with APD or CAPD. 45 However, there is evidence that testing has an impact on prescription practice – for example in the Global Fluid Study APD was more likely to prescribed in the context of faster PSTR 42 and in the ANZDATA Registry the propensity to prescribe icodextrin was greater in centres that routinely measure membrane function. 144
Whereas previous guidance and some authors have recommended regular routine testing of membrane function, 2,145 at present the evidence to support this approach is not available. Obtaining a baseline assessment is justified on the basis of its strong association with clinical outcome, implications for dialysis prescription and the value of having a numerical baseline measure with which to compare and interpret subsequent changes.
In resource settings where testing is not financially viable, or restricted (e.g. during a pandemic), it is still important that attention is paid to membrane function. A simple 4-h measurement of UF capacity can be done as part of the normal therapeutic schedule and fast PSTR can be inferred from the excessive reabsorption of fluid when using an overnight low-strength glucose. Whether routine testing is in place or not, actual daily dialysis regimes should be scrutinized to ensure that systematic fluid reabsorption is not happening, remembering that CAPD bags are usually over-filled, and the prescription of glucose titrated so as to avoid this.
Discussion
Given the long period of time since the last ISPD 1 and European guidance 2 on membrane function testing, it is useful to draw attention to the important differences in recommendations introduced here. During this period, a significant amount of epidemiological evidence has accrued, and mechanisms of membrane injury are better understood. We have sought to change the terminology and definitions in a number of areas.
First, the term UF failure, which is pejorative, is replaced by UF insufficiency which better describes the problem. The former use implied a single process, with an absolute cut-off value, whereas in reality the amount of UF required will depend on other factors, such as residual kidney function, fluid intake and the willingness of clinicians to prescribe, or people on dialysis to use higher concentration glucose exchanges or polyglucose solution. For this reason, we have moved away from defining UF failure as a single metric obtained from the PET, changing the role of measurement of UF capacity (guideline 3) to one of a screening test. This should be combined with the other clinical factors and more detailed diagnostic tests to inform clinical decision-making.
Second, we have changed the terminology from solute transport to transfer. This decision was carefully considered by the guideline group and made for the following reasons: It avoids the potential confusion that transport implies an active process rather than passive diffusion, but more importantly, on consultation, lay readers found this an easier terminology to understand. Against this decision was the entrenched use of the term solute transport, which will still have to be included in any future literature searches on this subject. However, with the support of the PD community and leading journals publishing on this topic it was felt possible, along the same lines as the recent examples of changes achieved with terminology such as acute kidney injury and chronic kidney disease. We also removed any references to low, high, fast or rapid categorization of PSTR. This is a normally distributed, continuous variable that cannot, due to the centre and country effects be neatly divided into threshold values.
Third, whereas previous guidelines strongly advocated the use of hypertonic glucose to undertake a PET, we chose to be less prescriptive. This was in recognition of the fact that the vast majority of testing worldwide employs glucose at a concentration of 2.27% (dextrose 2.5%), as documented by our survey, and that a substantial amount of the clinical epidemiological data that link the result of this test to clinical outcomes uses this concentration. Our survey has some limitations, not covering some parts of the world so well (e.g. continental Europe, South Asia), but is sufficient to push us towards a guideline that encompasses both glucose concentrations. Nevertheless, centres should consider switching to the stronger 3.86%/4.25% glucose/dextrose solution and adding a 1 h sodium dip measurement, given that this provides additional information.
Fourth, we added to this guideline advice on how to assess the OCG to glucose. We have based this on measuring the sodium dip, which is a surrogate of OCG that is far easier to do than the various tests summarized in Table 3. There is now more clinical data available linking this measure to outcomes, but we have limited its use to diagnostic purposes rather than routine measurement until more data becomes available. For the same reason, we have not advocated regular routine PETs as the clinical value of this approach is not yet clear and has the potential to divert resources from more pressing concerns such as prevention of peritonitis. However, repeat testing does clearly have value in interpreting a clinical change or supporting a decision as to whether staying on long-term PD or switching to haemodialysis is appropriate.
Fifth, we have linked the findings from membrane function tests both to their underlying pathophysiological mechanisms and to the evidence of prescription interventions designed to ameliorate the problem of membrane dysfunction. We chose to use this term recognizing that dysfunction does not necessarily relate to disease in the conventional sense: the peritoneum was not evolved for the purposes of PD. It is very much in the context of what we are asking of the repurposed peritoneal membrane (synonymous here with peritoneum), although it must also be recognized that real pathological processes do occur in response to dialysis, and observational data strongly link this injury to a subsequent higher risk for EPS. The pathology of this condition is different to progressive membrane fibrosis which does not inevitably progress to EPS and it should be emphasized that length of time on treatment remains the strongest risk factor. 122,146 It is also important to take competing risks of death into account when assessing EPS risk, as older, more comorbid individuals are far more likely to die from non-EPS causes. 122
Recommendations for future research
Development of new methodologies to predict, identify or monitor membrane function or injury.
identification of genes associated with membrane function that might enable genetic testing and potentially molecular targets
Biomarkers. A number of candidate biomarkers have been identified but to date these are not sufficiently discriminatory to inform clinical decision-making. Reliable biomarkers will require external validation and the development of reliable prognostic models.
more advanced mathematical models to underpin membrane function testing, for example, detailed descriptions of icodextrin, macromolecular or trans-capillary aspects of membrane function
less labour intensive methods of measuring membrane function (e.g. determination of solute transfer rates from ionic conductance). 118
Evaluation of membrane function testing strategies.
Optimal timing and frequency of repeat testing
Evaluation of the patient experience, burden and understanding of the purpose of membrane function testing.
Health economic analyses of the resource implications of membrane testing and their trade off, recognizing different resource settings
Therapeutic interventions to protect the peritoneal membrane.
Trials of oral or dialysate additives that prevent peritoneal inflammation or fibrosis
Novel dialysis solutions with lower toxicity
Solution or device development to optimize clinical management
Solutions that reduce systemic side effects (e.g. glucose)
Continuous dialysate flow or wearable technologies
Supplemental material
Supplemental Material, sj-docx-1-ptd-10.1177_0896860820982218 - ISPD recommendations for the evaluation of peritoneal membrane dysfunction in adults: Classification, measurement, interpretation and rationale for intervention
Supplemental Material, sj-docx-1-ptd-10.1177_0896860820982218 for ISPD recommendations for the evaluation of peritoneal membrane dysfunction in adults: Classification, measurement, interpretation and rationale for intervention by Johann Morelle, Joanna Stachowska-Pietka, Carl Öberg, Liliana Gadola, Vincenzo La Milia, Zanzhe Yu, Mark Lambie, Rajnish Mehrotra, Javier de Arteaga and Simon Davies in Peritoneal Dialysis International
Supplemental material
Supplemental Material, sj-pdf-1-ptd-10.1177_0896860820982218 - ISPD recommendations for the evaluation of peritoneal membrane dysfunction in adults: Classification, measurement, interpretation and rationale for intervention
Supplemental Material, sj-pdf-1-ptd-10.1177_0896860820982218 for ISPD recommendations for the evaluation of peritoneal membrane dysfunction in adults: Classification, measurement, interpretation and rationale for intervention by Johann Morelle, Joanna Stachowska-Pietka, Carl Öberg, Liliana Gadola, Vincenzo La Milia, Zanzhe Yu, Mark Lambie, Rajnish Mehrotra, Javier de Arteaga and Simon Davies in Peritoneal Dialysis International
Supplemental material
Supplemental Material, sj-pdf-2-ptd-10.1177_0896860820982218 - ISPD recommendations for the evaluation of peritoneal membrane dysfunction in adults: Classification, measurement, interpretation and rationale for intervention
Supplemental Material, sj-pdf-2-ptd-10.1177_0896860820982218 for ISPD recommendations for the evaluation of peritoneal membrane dysfunction in adults: Classification, measurement, interpretation and rationale for intervention by Johann Morelle, Joanna Stachowska-Pietka, Carl Öberg, Liliana Gadola, Vincenzo La Milia, Zanzhe Yu, Mark Lambie, Rajnish Mehrotra, Javier de Arteaga and Simon Davies in Peritoneal Dialysis International
Supplemental material
Supplemental Material, sj-pdf-3-ptd-10.1177_0896860820982218 - ISPD recommendations for the evaluation of peritoneal membrane dysfunction in adults: Classification, measurement, interpretation and rationale for intervention
Supplemental Material, sj-pdf-3-ptd-10.1177_0896860820982218 for ISPD recommendations for the evaluation of peritoneal membrane dysfunction in adults: Classification, measurement, interpretation and rationale for intervention by Johann Morelle, Joanna Stachowska-Pietka, Carl Öberg, Liliana Gadola, Vincenzo La Milia, Zanzhe Yu, Mark Lambie, Rajnish Mehrotra, Javier de Arteaga and Simon Davies in Peritoneal Dialysis International
Supplemental material
Supplemental Material, sj-png-1-ptd-10.1177_0896860820982218 - ISPD recommendations for the evaluation of peritoneal membrane dysfunction in adults: Classification, measurement, interpretation and rationale for intervention
Supplemental Material, sj-png-1-ptd-10.1177_0896860820982218 for ISPD recommendations for the evaluation of peritoneal membrane dysfunction in adults: Classification, measurement, interpretation and rationale for intervention by Johann Morelle, Joanna Stachowska-Pietka, Carl Öberg, Liliana Gadola, Vincenzo La Milia, Zanzhe Yu, Mark Lambie, Rajnish Mehrotra, Javier de Arteaga and Simon Davies in Peritoneal Dialysis International
Supplemental material
Supplemental Material, sj-png-2-ptd-10.1177_0896860820982218 - ISPD recommendations for the evaluation of peritoneal membrane dysfunction in adults: Classification, measurement, interpretation and rationale for intervention
Supplemental Material, sj-png-2-ptd-10.1177_0896860820982218 for ISPD recommendations for the evaluation of peritoneal membrane dysfunction in adults: Classification, measurement, interpretation and rationale for intervention by Johann Morelle, Joanna Stachowska-Pietka, Carl Öberg, Liliana Gadola, Vincenzo La Milia, Zanzhe Yu, Mark Lambie, Rajnish Mehrotra, Javier de Arteaga and Simon Davies in Peritoneal Dialysis International
Footnotes
Acknowledgements
The authors are grateful to those with personal experience of peritoneal dialysis who have helped us with the construction of lay summaries in English, Spanish and Chinese. In particular, the authors thank Glenda Roberts, Director of External Relations and Patient Engagement, Kidney Research Institute, University of Washington, Paul Conway, Paste President of the American Association of Kidney Patients and members of the Asociación de Trasplantados del Uruguay.
Author contributions
All the authors were involved at each stage of the guideline development, including scoping, literature searches, agreeing modified nomenclature, guideline statements and reviewing the multiple drafts and final manuscript. Particular areas of responsibility were ZY and LG for the Chinese and Latin America surveys; CO and JS-P for the descriptions of membrane models; JM for animal models, genetic and mechanisms of membrane injury; JM and VL reviewed the content on sodium dip; ML and RM on solute transfer and inflammation; JA provided oversight from the ISPD guidelines committee; and SD assembled the final document and led on the discussion.
Declaration of conflicting interests
The author(s) declared the following potential conflicts of interest with respect to the research, authorship, and/or publication of this article: SD reports unrelated research funding from Baxter HealthCare Inc. andhas undertaken collaborative research with Fresenius MC and honoraria for Advisory Board Membership for Baxter HealthCare Inc, Ellen Medical and Zytoprotec. ML reports honoraria from Fresenius Medical Care, Baxter Healthcare and NxStage and an unrelated research grant from Baxter Healthcare. JM is supported by the Fonds National pour la Recherche Scientifique and the Fondation Saint-Luc (Brussels, Belgium), and reports speaker honoraria from Baxter Healthcare and Fresenius Medical Care, travel grants from Sanofi-Genzyme, research grants from Baxter Healthcare and Alexion Pharmaceuticals, and consulting fees from Astra-Zeneca and Alexion Pharmaceuticals. RM has received occasional fees for consultancy work for Baxter HealthCare Inc. CO reports unrelated research grant funding and speaker’s honoraria from Baxter Healthcare Inc. None of the other authors report conflicts of interest.
Ethical approval
Not applicable
Funding
The author(s) received no financial support for the research, authorship, and/or publication of this article.
Informed consent
Not applicable
Not applicable
Supplemental material
Supplemental material for this article is available online.
References
Supplementary Material
Please find the following supplemental material available below.
For Open Access articles published under a Creative Commons License, all supplemental material carries the same license as the article it is associated with.
For non-Open Access articles published, all supplemental material carries a non-exclusive license, and permission requests for re-use of supplemental material or any part of supplemental material shall be sent directly to the copyright owner as specified in the copyright notice associated with the article.