
Abstract
The transient nature of K–12 English Learner (EL) status and services makes it difficult for researchers to follow their educational pipeline. ELs’ backgrounds and experiences vary considerably, with differences in grade of entry into U.S. schooling, duration in EL status, and, for some, waiving out of English language development services. We use longitudinal administrative data with repeated measures of EL status to examine K–12 EL-programmatic experiences and postsecondary trajectories of Spanish-speaking ever-EL students in Texas. We control for differences in students’ demographic and academic characteristics and examine the association between their EL programmatic experiences and postsecondary outcomes.
Keywords
Introduction
Approximately one in 10 students in K–12 U.S. public schools is currently identified as an English learner (EL), a status reserved for students who, as determined by educators, require English language development (ELD) programming and services (de Brey et al., 2023). In Texas, this number is nearly one in five, with one in four Texas kindergarteners receiving EL services at some point K–12 (Callahan et al., 2023). The full population of students who ever receive EL services (ever-ELs) differs in noteworthy ways from the subset who are EL-identified during their high school years. Yet most research on college outcomes focuses on students who are EL-identified in high school—most often recent immigrants or long-term ELs—and finds them less likely to go to college than non-ELs (Kanno & Cromley, 2015). The EL educational policies and practices enacted in public K–12 schools largely draw from this research.
Given data limitations in many national datasets, it has been difficult for researchers to capture a broad population of ever-ELs, much less examine heterogeneity—both in background and academic experiences—within this group. In this study, we use state administrative data to describe heterogeneity in the ever-EL population, with a focus on Spanish speakers, the largest subgroup of ELs nationally (77%) and in Texas (91%) (de Brey et al., 2023). We examine how varied EL programmatic experiences are associated with ever-ELs’ postsecondary outcomes.
Organizational structures shape how students experience schooling (Barr & Dreeben, 1983; Dallavis & Berends, 2023). Although EL status is often viewed as a monolith, considerable variation exists in how ELD support is structured; for example, EL programming may provide support in either only English (English as a second language [ESL]) or in the student’s primary language and English (bilingual education; Sugarman, 2018). Students remain in EL status until educators determine that they meet English proficiency exit requirements, at which point they are reclassified as English proficient (Estrada & Wang, 2018). Due to variation in exit requirements (Linquanti & Cook, 2015), some EL-identified students participate in ELD services for only a short time (~3 years or less), whereas others remain in EL status for much longer (7-plus years). Finally, federal guidelines allow parents to elect to opt out of—to waive—ELD services (bilingual or ESL) for their child (U.S. Department of Education, 2015). These three programmatic experiences—EL program type, duration in EL status, and waivers—serve as ELD structures with implications for students’ long-term academic outcomes.
The Present Study
To understand variation in the programmatic experiences of ever-EL students and how those experiences may predict postsecondary trajectories, we use longitudinal state administrative data with repeated measures of EL status and programming to examine college entrance; college type; and early, intermediate, and long-term college outcomes of ever-EL students. We follow ever-EL high school seniors in Texas—a state that educates 10% of all students in the nation—into and through college, examining a variety of postsecondary milestones and outcomes (de Brey et al., 2023). We capture the full population of students who received EL services at any point during their K–12 education; ever-ELs comprise 22% of Texas high-school seniors (author’s calculations). By linking K–12, postsecondary, and workforce data, we control for differences in students’ demographic and academic characteristics to understand ever-EL students’ educational pathways. By focusing explicitly on Spanish-speaking ever-EL students (~90% of Texas’s ever-ELs), we can examine their programmatic experiences and how those experiences predict postsecondary pathways and outcomes net of student background.
Research has linked the organizational contexts of schooling, including how classes and student pathways are structured, to student outcomes for decades (e.g., Barr & Dreeben, 1983; Dallavis & Berends, 2023; Gamoran et al., 2000). Within-school differences, including distinct curricular pathways and access to resources, have consequences for student learning and performance (Domina et al., 2023). Our results illustrate that Spanish-speaking ever-EL students experienced a mix of EL program types, where nearly a quarter (24%) of our analytic sample experienced more than one program type (often moving between ESL and bilingual education) and 14% ever waived ELD services during their time in EL status. Overall, our findings show that many of the associations between K–12 EL programmatic experiences and college outcomes are strongest for college entrance and early college outcomes. For example, ever-ELs who spent the majority of their time in bilingual education programs were more likely than their peers to enter college and, among those who entered college, to attend a four-year institution. We also found that those who remained EL-identified in the long term (7 years or more) appeared less likely than their peers to attend college. And when they did enter college, they were more likely to enter a two-year institution and less likely to persist, even after controlling for a host of demographic and academic background measures. Given the stratified nature of our higher education system, the associations between EL-specific educational experiences and students’ probabilities of college entry and initial institution type suggest that EL programming has important implications for students’ college attainment and returns (Schudde & Ryu, 2023).
Review of Relevant Literature: Implications of ELD Support Structures
There are several models of EL programming, with evidence indicating variation in educational outcomes across different structures (Sugarman, 2018). Optimizing EL achievement is not solely a question of program type because ever-ELs’ backgrounds and experiences vary considerably, with differences in age and grade of entry into the U.S. school system, duration in EL status, and, for some, waiving ELD services. All these experiences may predict students’ educational trajectories. In the subsequent sections, we explore extant research linking EL instructional program type, duration in EL status, and waiving of ELD to students’ long-term academic outcomes.
Instructional Program Models: Bilingual Education as the Preferred Model
One facet of EL-identification derives from the presence of a non-English language in the home; the second derives from educators’ determination of the student’s need for ELD support (Linquanti & Cook, 2013). The type of EL program—ranging from ESL to bilingual—that students are sorted into is often dependent on both state policy and local resources. Some state laws dictate specific programming (e.g., English-only education); at other times, districts are limited by institutional capacity (e.g., having or not having bilingual teachers available to staff a bilingual program; Garcia & Kleifgen, 2018). Research suggests that EL program type shapes not only how students experience EL status but also a range of short- to long-term outcomes.
Educational researchers value bilingual education for its potential to transfer skills and knowledge from the student’s primary language to their second—English in the case of U.S. schools (August & Hakuta, 1997; Cummins, 1980; Goldenberg & Coleman, 2010). ELs in bilingual programs show faster academic growth (e.g., in math and in English language proficiency) and higher achievement than their peers in English-only instructional contexts (Morita-Mullaney et al., 2020; Umansky et al., 2015; Valentino & Reardon, 2015). Bilingual programs are generally found to be more effective than ESL (push-in or pull-out), structured English immersion (SEI), or waiving services entirely (Collier & Thomas, 2017; Thomas & Collier, 2002). In a study that analyzed longitudinal data for nine cohorts of kindergarteners in a large district, Umansky and Reardon (2014) found that ELs in English-only contexts reclassified earlier than their peers in bilingual programs, but bilingual programming ultimately produced higher rates of reclassification (exit from EL programming), English proficiency, and academic attainment. Duration of enrollment in bilingual programming may also shape later outcomes, as ELs in dual language programs outperform their peers in early-exit programs in math and reading achievement in English (Marian et al., 2013), though most bilingual education programming occurs during elementary schooling (Gándara & Rumberger, 2009; Palmer, 2011). The academic and noncognitive skills associated with bilingualism have been linked to college entrance (Callahan, 2008; Santibañez & Zarate, 2014), but further research is needed to understand whether those benefits transfer to subsequent postsecondary outcomes.
Duration in EL Status
Duration in EL status is largely a structural or programmatic decision; the school system exits students from EL status when it recognizes that they met district- and state-mandated levels of English proficiency and potentially other academic indicators (Linquanti & Cook, 2013; Wolf et al., 2008). In Texas, EL program exit occurs when students achieve (as assessed by English proficiency and academic test scores) at the levels deemed necessary for them to successfully master academic content in English without further support (Mavrogordato & White, 2020). Sufficient mastery of English is necessary for ELs to move into mainstream instruction without support. Premature exit may constrain students’ later achievement but unnecessary retention in EL status may limit academic exposure and experiences.
Researchers have examined the timing of EL program exit in an attempt to identify the optimal duration of EL services. Using 9 years of longitudinal data and consistent with previous research in this area (Hakuta et al., 2000), Thompson (2017) found that most ELs in her sample took between 4 and 7 years to develop English proficiency. However, she also found that a window exists in the late elementary grades after which, if the school system has not yet exited a student, it might never do so. Careful attention to K–12 EL reclassification policies may help ensure ever-ELs are exited in a timely manner and improve their long-term academic outcomes.
As Thompson (2017) found, schools exit most ELs in late elementary but keep some EL-identified for 7 years or longer—a group described in the literature as “long-term English learners” (LTELs) (Cashiola & Potter, 2020; Umansky & Avelar, 2023). LTELs differ from ELs who reclassify earlier in their academic careers in several ways. For example, they often possess strong social oral language proficiency but struggle with academic literacy in both languages, resulting in lower performance and higher course failure rates than their peers (Menken & Kleyn, 2010; Menken et al., 2012; Olsen, 2010). Even in cases where students who experience long-term EL status have the requisite academic skills for college, some LTELs experience unstable schooling due to transnational mobility and programmatic variation across schools, making it difficult for them to maintain motivation and engagement in high school, challenges that likely carry forward into college (Brooks, 2018; Thompson, 2015). Transnational mobility also makes it essential that researchers account for both student mobility and nativity (S. M. Flores et al., 2012; Menken et al., 2012). Critiques have been leveraged against research that frames LTEL students as a problem to be solved rather than as a reflection of a structural or systemic barriers inherent to the U.S. educational system (e.g., see Brooks, 2020; N. Flores et al., 2015; Kim, 2017; Siordia & Kim, 2022; Strong & Escamilla, 2023; Umansky & Avelar, 2023). Framing duration in EL status as a structural factor, our analysis bridges this gap by examining duration in EL status alongside a myriad of student demographic and academic attributes in addition to school controls.
Beyond duration in EL status, the timing of exit from EL programming may also play a role in ever-ELs’ achievement (de Jong, 2004; Thompson, 2017). As students move into and through middle school, academic segregation and curricular distinction of the EL track may mean that EL-identified students are channeled into lower-track and remedial courses (Barr & Dreeben, 1983; Dabach, 2014; Estrada & Wang, 2018; Morita-Mullaney et al., 2020), which stigmatizes students and limits their access to learning opportunities (Umansky & Avelar, 2023). ELD structures often preclude students’ entering college and career preparatory programs, whereas more proficient peers benefit from comprehensive college-going culture support to achieve postsecondary readiness (Mendoza, 2019). Students who are exited from EL status not-too-early (<4 years of services) nor too late (after 7 years) may have more access to a broader range of college preparatory resources (Thompson, 2017). In our longitudinal analysis, we address this gap by investigating whether duration in EL status (<4 years; 4–7 years; ≥7 years) and the length of time between EL program exit and high school graduation are associated with a broad array of postsecondary outcomes.
Waiving ELD Services
Finally, research suggests that a small subgroup of EL students may have substantively different educational experiences based on their parents’ decision to decline ELD services for their child. Although research in this area is sparse at best, it is possible that there are downstream consequences when the parents of ELs choose to decline services. In one of the early standard-bearing studies comparing EL outcomes across program types, Thomas and Collier (2002) found the highest number of high school dropouts among ELs whose parents waived services; in addition, students in this group scored significantly lower on standardized tests in fifth and 11th grades, far below their peers who received ELD services. Nearly a decade later, using Boston Public School system data, Uriarte et al. (2011) found that waiver students were more likely to drop out than their peers in EL programs (9% vs. 6%).
Parental social and cultural capital—parents’ networks and the knowledge they use to make decisions about their child’s education—likely also shape which families waive EL programming and services. Evidence from Rhode Island found that waiver students reported English as a home language, the U.S. as their country of origin, and having an individualized education plan (IEP) more often than ELs who did not waive (Shields et al., 2016), all suggesting differential selection into waiver status. However, research on “who” waives—not to mention outcomes associated with waiver status—is limited.
Recently, researchers drew on Texas state administrative data to compare outcomes for students who waive out of EL programming with those who participate. Hispanic ELs who waived ELD services appeared to be less likely to attend college than their peers who participated in EL programming; among those who went to college, however, waived ELs were significantly less likely to need remediation in writing (S. M. Flores et al., 2012; S. M. Flores & Drake, 2014). Whereas other Hispanic students’ likelihood of testing into remedial coursework was largely tied to their school contexts, Hispanic ELs with parents that waived ELD services had academic trajectories more strongly associated with their high school curriculum—for example, taking Advanced Placement (AP)/International Baccalaureate (IB) courses and Trigonometry—than school contexts (S. M. Flores & Drake, 2014). Although ELD waiver status does not appear to predict students’ likelihood of reclassification (Mavrogordato & White, 2017), it may be correlated with content area test scores. One study found that waiver students were more likely to score proficient in English but slightly less likely to score proficient in math than non-waiver ELs (Slama et al., 2017), although evidence is mixed (e.g., see Shields et al., 2016).
Research Questions
In line with research on the organizational contexts of schooling (e.g., Barr & Dreeben, 1983; Domina et al., 2023), the extant research suggests that EL programming, including program type, duration in EL status, and ELD waivers, is associated with students’ K–12 trajectories, with potential for predicting longer-term outcomes such as college entrance and success. We first examined the demographic composition, academic characteristics, and long-term outcomes of Spanish-speaking ever-EL students across EL programmatic experiences (exposure to majority bilingual education, duration in EL status, and ever having waived EL services) before examining the link between those experiences and student outcomes. We asked:
Methods
To answer our research questions, we used Texas statewide administrative data, provided through a restricted-use agreement with the Texas Education Research Center (ERC) at the University of Texas at Austin. Among the population of high school seniors in fall 2012 and 2013 (pooled), we focused on Spanish-speaking ever-ELs to examine their college entrance and early (i.e., persistence, developmental-education [dev-ed] 1 participation), intermediate (i.e., vertical or reverse transfer), and long-term (i.e., grade point average [GPA], credential attainment) college outcomes. We used descriptive statistics to address RQ1 and fitted regression models, holding constant students’ academic and demographic backgrounds, to answer RQ2.
Data
We merged student-level data collected by the K–12 Texas Education Agency (TEA) and the Texas Higher Education Coordinating Board (THECB) with employment data from the Texas Workforce Commission (TWC) to construct a longitudinal dataset that follows Spanish-speaking ever-ELs in Texas from K–12 into college. Our dataset consists of data collected from 1999 (when the oldest would have started kindergarten) through 20222 (the final wave of data available). Compared with national datasets that provide EL program information only for students who were EL-identified during the survey data collection window, our data offer a key advantage in that they include recurring, annual indicators of EL status and relevant program involvement. These indicators enable us to track the complete history of EL programming for all students who ever received EL services during Texas public school enrollment. As a result, we can explore heterogeneity in Spanish-speaking ever-EL students’ K–12 experiences as they relate to their postsecondary outcomes.
Analytic Sample
Our analytic sample includes the population of ever-ELs from Spanish-speaking households who were in 12th grade in a Texas public school in 2012 or 2013 (pooled) and graduated from high school (N = 103,410). This focal sample enabled us to investigate the relationship between students’ K–12 EL programmatic experiences and their college readiness and success. To ensure we had adequate background information to construct the variables used in the regression analysis for every observation in the dataset, we removed students who were missing Texas Assessment of Knowledge and Skills (TAKS) scores in Math or English Language Arts (N = 237) and/or relevant EL program information (N = 1,050), resulting in a final analytic sample of 102,128 students used in our descriptive analyses and regressions for college entrance. To predict college type, we restricted the sample to students who entered any college, including those outside Texas (N = 72,214). To predict early, intermediate, and long-term college outcomes, we restrict the analytic sample to public college entrants in Texas, as these are the only institutions that have detailed transcript data (N = 66,586). In addition, institution type plays a salient role in degree attainment, as two-year colleges offer different credentials than many four-year colleges, typically requiring students to transfer to earn a baccalaureate (Schudde & Ryu, 2023). For this reason, we estimated college entrants’ outcomes separately by college type, distinguishing between students who entered a public two-year college (N = 47,807) and those who entered a public four-year university (N = 18,779) in Texas.
Key Analytic Variables
Independent Variables of Interest: EL Programming Measures
Our three independent variables of interest, informed by the research described above, summarize the programmatic experiences of Spanish-speaking ever-EL students. The first is having spent the majority of EL programming in bilingual education; the second is the duration of time spent in EL status; and the third is ever having waived EL services. We also capture several other factors likely to be associated with students’ programmatic and broader educational experiences (e.g., when they entered Texas schools and the length of time between exit from EL programming to high school graduation) in our analysis.
Majority Bilingual and Ever-Waived
Prior research shows that different EL program models produce different academic outcomes (Sugarman, 2018). A sizeable proportion of ever-ELs in our analytic sample—24%—experienced more than one type of EL program during their time in EL status. To address this, we created a measure that captured which type of EL program students enrolled in for the majority of their time in EL status. This variable captures the type of EL program that students were most frequently observed in while EL-identified. For example, a student who spent one year in an ESL program, one year with a waiver, and two years in a bilingual program was classified as majority bilingual (i.e., bilingual education being their most frequently observed programmatic experience). Among our full analytic sample of high-school graduates, most spent the majority of their time as an EL in either bilingual (58%) or ESL (32%) programs, with small shares of students spending equal time in both (4%) or waiving for the duration (5%). It is worth noting that Texas Education Code (TEC) requires districts provide bilingual education programming during the elementary grades if 20 or more ELs of the same language group enroll in the same grade level (TEC § 29.053, 1995). During our analytic window (1999–2013), transitional, early-exit programs (2–4 years) were the most prevalent bilingual model in Texas (Gándara & Rumberger, 2009; Palmer, 2011), making bilingual placement most common in grades K–5, and relatively rare in 6 to 12 (especially during our analytic window).
Drawing on the research on academic success and bilingual education, we created a dichotomous indicator to capture if students spent the majority of time in bilingual programming while EL-identified during K–12, with the other programmatic types combined in the reference group. Preliminary analyses also revealed that ever waiving EL programming was another programmatic experience that characterized heterogeneity across ever-EL students. We therefore include an indicator for ever having waived EL programming in our models.
Duration in EL Status
Leveraging repeated measures of EL status and programming, we could capture duration of time in EL status that was consistent with existing literature correlating LTEL status with students’ outcomes (Mendoza, 2019; Shin, 2020; Thompson, 2017). Although the number of years that a student remained in EL status, as opposed to a binary indicator for long-term EL status, may capture more of the variance, it proves difficult to meaningfully interpret the role that each additional year in EL programming plays. Therefore, drawing on previous research, we constructed a three-category measure for students’ duration in EL status, setting medium-term (4–6 years) ELs as the reference category for comparison to short-term (0–3 years) and long-term (7 or more years).
Even among students who remained in EL status for the same duration, experiences may vary based on the grades in which the students participated in or entered EL programming, which might have implications for their postsecondary trajectories. Although we control for students’ participation in college preparatory courses, the timing of reclassification in relation to high school graduation is likely to shape students’ experience beyond course taking, such as exposure to a comprehensive college-going culture or access to college preparatory resources (Mendoza, 2019; Thompson, 2017). To assess the extent to which the timing of exit from EL status affects students beyond what is captured by course participation or duration of EL status, we include a measure of the number of years between EL program exit and high school graduation, which serves as a proxy for their potential exposure to those additional resources.
Additional Student Characteristics and Academic Measures
In addition to programmatic features, both immigrant status and grade of school entrance are key to understanding Spanish-speaking ELs’ educational experiences. Grade (or age) of entry is correlated with time taken to reach grade-level proficiency; ELs who enter U.S. schools earlier tend to catch up to their peers faster (Collier, 1987). Using indicators of recent immigrant status combined with first appearance in the TEA data, we construct a categorical variable denoting whether the student is a non-immigrant (reference group), early elementary immigrant (grades K–2), late elementary immigrant (grades 3–5), or secondary immigrant (grade 6 or above). The recent immigrant identifier is taken directly from the TEA dataset, which flags recent immigrant status to distinguish international arrivals, as opposed to students who moved from other U.S. states to Texas. The TEA’s definition of immigrant status aligns with Title III of the No Child Left Behind Act of 2001 (NCLB), where the term immigrant children and youth is defined as “individuals who are aged 3 through 21; were not born in any state; and have not been attending one or more schools in any one or more states for more than 3 full academic years” (U.S. Department of Education, n.d., p. 2). For the purposes of this study, we define the “non-immigrant” group as including both EL students born in the U.S. to foreign-born parents and students who immigrated to the U.S. before starting kindergarten (i.e., they are not labeled with the recent immigrant flag when they enter kindergarten). We are limited in our ability to account for more complicated migration patterns; although this definition does not perfectly capture movement in and out of the country, it enables us to distinguish between recent international and inter-state student mobility.
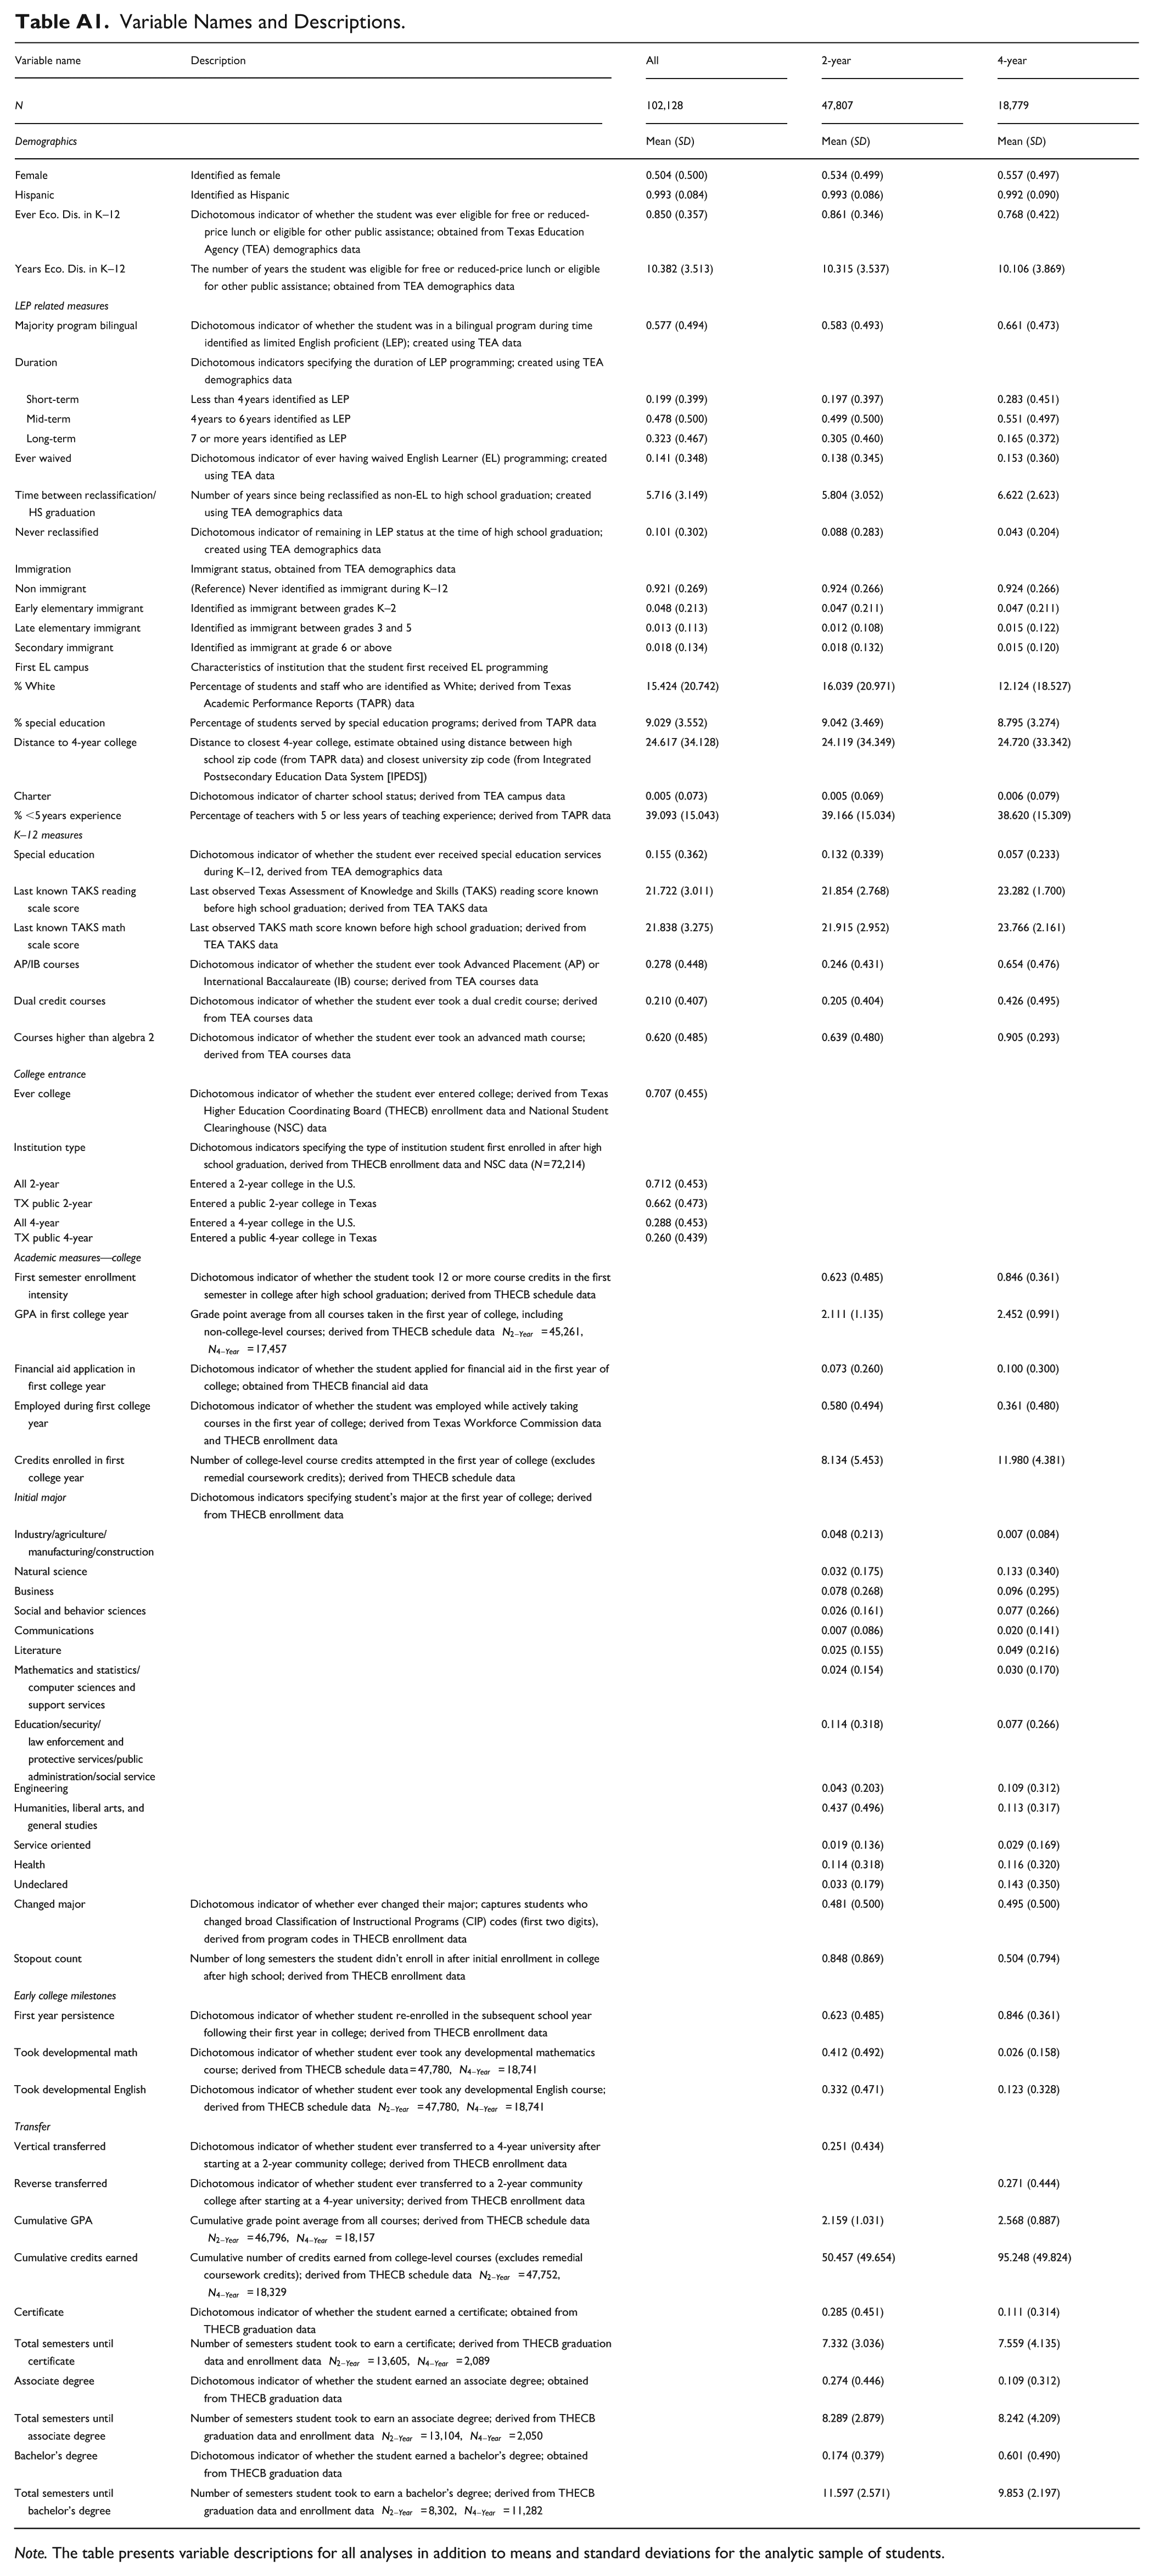
We also capture a wide range of covariates hypothesized to influence students’ academic trajectories during K–12 and higher education. Appendix A (Table A1) depicts variables included in our models along with descriptive statistics for each of our analytic samples. Demographic characteristics include gender and the years during K–12 enrollment when the student was reported as economically disadvantaged by their school (typically a proxy for whether students were eligible for free or reduced-price lunch). We capture K–12 academic experiences using indicator variables such as ever having received special education services; participation in dual enrollment, AP or IB courses, or advanced math courses (higher than Algebra II, required for high school graduation); and last observed TAKS math and reading test scores. In addition, given our interest in EL program-related variables, we control for the characteristics of the first institution from which the student received EL programming (i.e., percentage of White students, of special education students, and of teachers with experience of 5 years or less, along with distance to nearest four-year college and charter school status).
Among college entrants, we also account for a variety of measures focused on students’ postsecondary experiences. We capture whether students in the first year of college enrolled in college immediately after high school graduation, enrolled full time in the first semester, applied for financial aid, worked for pay, and persisted to the next year, in addition to their initial major, GPA, and college-level credits attempted. These variables let us control for the early-college factors associated with long-term college outcomes. In addition, we capture students’ enrollment behavior and achievement during college, including the number of stop-outs (ceased and then restarted enrollment), credits attempted in dev-ed math and English courses, instances of vertical and reverse transfer, changed majors, total college-level credits attempted, and cumulative GPA.
Dependent Variables
Given our interest in students’ postsecondary trajectories, we include a wide range of outcomes, from college entry and early college milestones through degree attainment. Our college entry outcomes include enrollment at any college after high school graduation and, among those who attend any college in the U.S., whether they initially enrolled in any two-year or four-year college and whether they initially enrolled at a public two-year or four-year college in Texas during the time at which our follow-up data was collected (for at least 8 years after high school graduation). Among public college entrants, we then (separately by college type) capture early college outcomes such as persistence into the second year of college and enrollment in dev-ed math and English courses. Intermediate college outcomes include vertical transfer for two-year entrants (transferring to a four-year college) and reverse transfer for four-year entrants (transferring to a two-year institution). Long-term outcomes include cumulative GPA (also a statistical control for credential outcomes); credits earned; credential attainment (with separate dichotomous measures for certificate, associate, and bachelor’s attainment); and time to credential (separate for each credential).
Analytic Strategy
To examine our first two research questions—which ask about Spanish-speaking ever-ELs and variation among those who experience different EL programming—we use descriptive statistics paired with t-tests to compare means for significant differences across subgroups of students. To estimate the relationship between EL programmatic experiences and postsecondary outcomes in response to our third research question, we use regression analyses. Using an ordinary least squares regression (OLS; i.e., a linear probability model) for dichotomous outcomes, which comprise the majority of our dependent variables, enables us to interpret coefficients as changes in the predicted probability of the outcome. Our models employ variables capturing EL programming along with students’ academic and demographic characteristics. In all analyses, we set our alpha level at a higher threshold (ranging from * for p < .01 to *** for p < .0001) than is typical because of the large sample size. For the t-tests, we used the Holm-Bonferroni method to account for multiple comparisons across the subgroups.
For all outcomes occurring after initial college entrance, we used a subsample of students who went to college and included institutional fixed effects for the first college attended in the regression models. In addition, we ran all regression analyses for post-entrance outcomes separately for students who initially enrolled at public two-year and four-year colleges, as students’ academic course taking and educational trajectories differ across institution type (Holzman et al., 2020; Schudde & Ryu, 2023).
To capture the association between school context and ever-ELs’ outcomes, we include variables capturing the characteristics of the first school where students were EL-identified. School characteristics include the percentage of students identified as White, students in special education programs, and teachers with 5 or less years of experience, along with distance to the nearest four-year college and charter school status. In Appendix B (Tables B1–B3), we include the results of a supplemental set of regression analyses where we replace the school characteristics with school fixed effects. Our results are largely robust to this alternative specification.
Because we rely on regression, our results do not represent causal relationships. However, given the observational nature of our data, a regression with rich covariates is our strongest analytic strategy for examining how EL programmatic experiences predict postsecondary outcomes. We included a variety of statistical control variables capturing student background, along with school fixed effects; nevertheless, the estimated relationships could still partially be explained by unobserved factors. Several factors that may predict students’ educational trajectories and outcomes, such as motivation, social networks, or instructional quality, are unobservable in the data. Thus, we interpret our results as correlations. Despite these limitations, the results stand to inform the extant literature on ever-EL students’ postsecondary trajectories and the state of knowledge about the role played by ELD structures and programs.
Results
To answer our research questions, we first explore descriptive patterns among our population of Spanish-speaking ever-EL high school graduates. We describe the common ELD structures they experienced and then compare students across those three EL programming experiences. We then turn to our regression results to examine the association between EL programming experiences and a variety of postsecondary outcomes.
Descriptive Patterns
Column 1 in Table 1 offers descriptive statistics on the analytic sample of Spanish-speaking ever-EL high school graduates. Unsurprisingly, the vast majority (99.3%) identified as Hispanic and were ever classified as economically disadvantaged (85%), remaining so for most of their time in K–12 (µ = 10.4 years, SD = 3.5). Neary three in five (58%) experienced the majority of their EL services in bilingual education. In terms of duration in EL status, we classify the largest share (47.8%) as medium-term ELs (MTELs, our reference group). MTELs received EL services for 4 to 6 years; in contrast, short-term ELs (STELs) who received EL services for less than 4 years constitute 19.9% of our analytic sample, while long-term ELs (LTELs) who received EL services for 7 or more years comprise 32.3%. Fourteen percent of ever-ELs waived ELD services at least once in their K–12 career. Approximately 92.1% of the ever-ELs were labeled non-immigrants (i.e., either born in the U.S. or arrived before kindergarten). Nearly 8% were recent immigrants who entered Texas public schools in early elementary (4.8%), late elementary (1.3%), and secondary school (1.8%) respectively.
Descriptive Statistics for Spanish-Speaking Ever-ELs: Overall Means and Standard Deviations and Variation Across EL Programmatic Experiences.
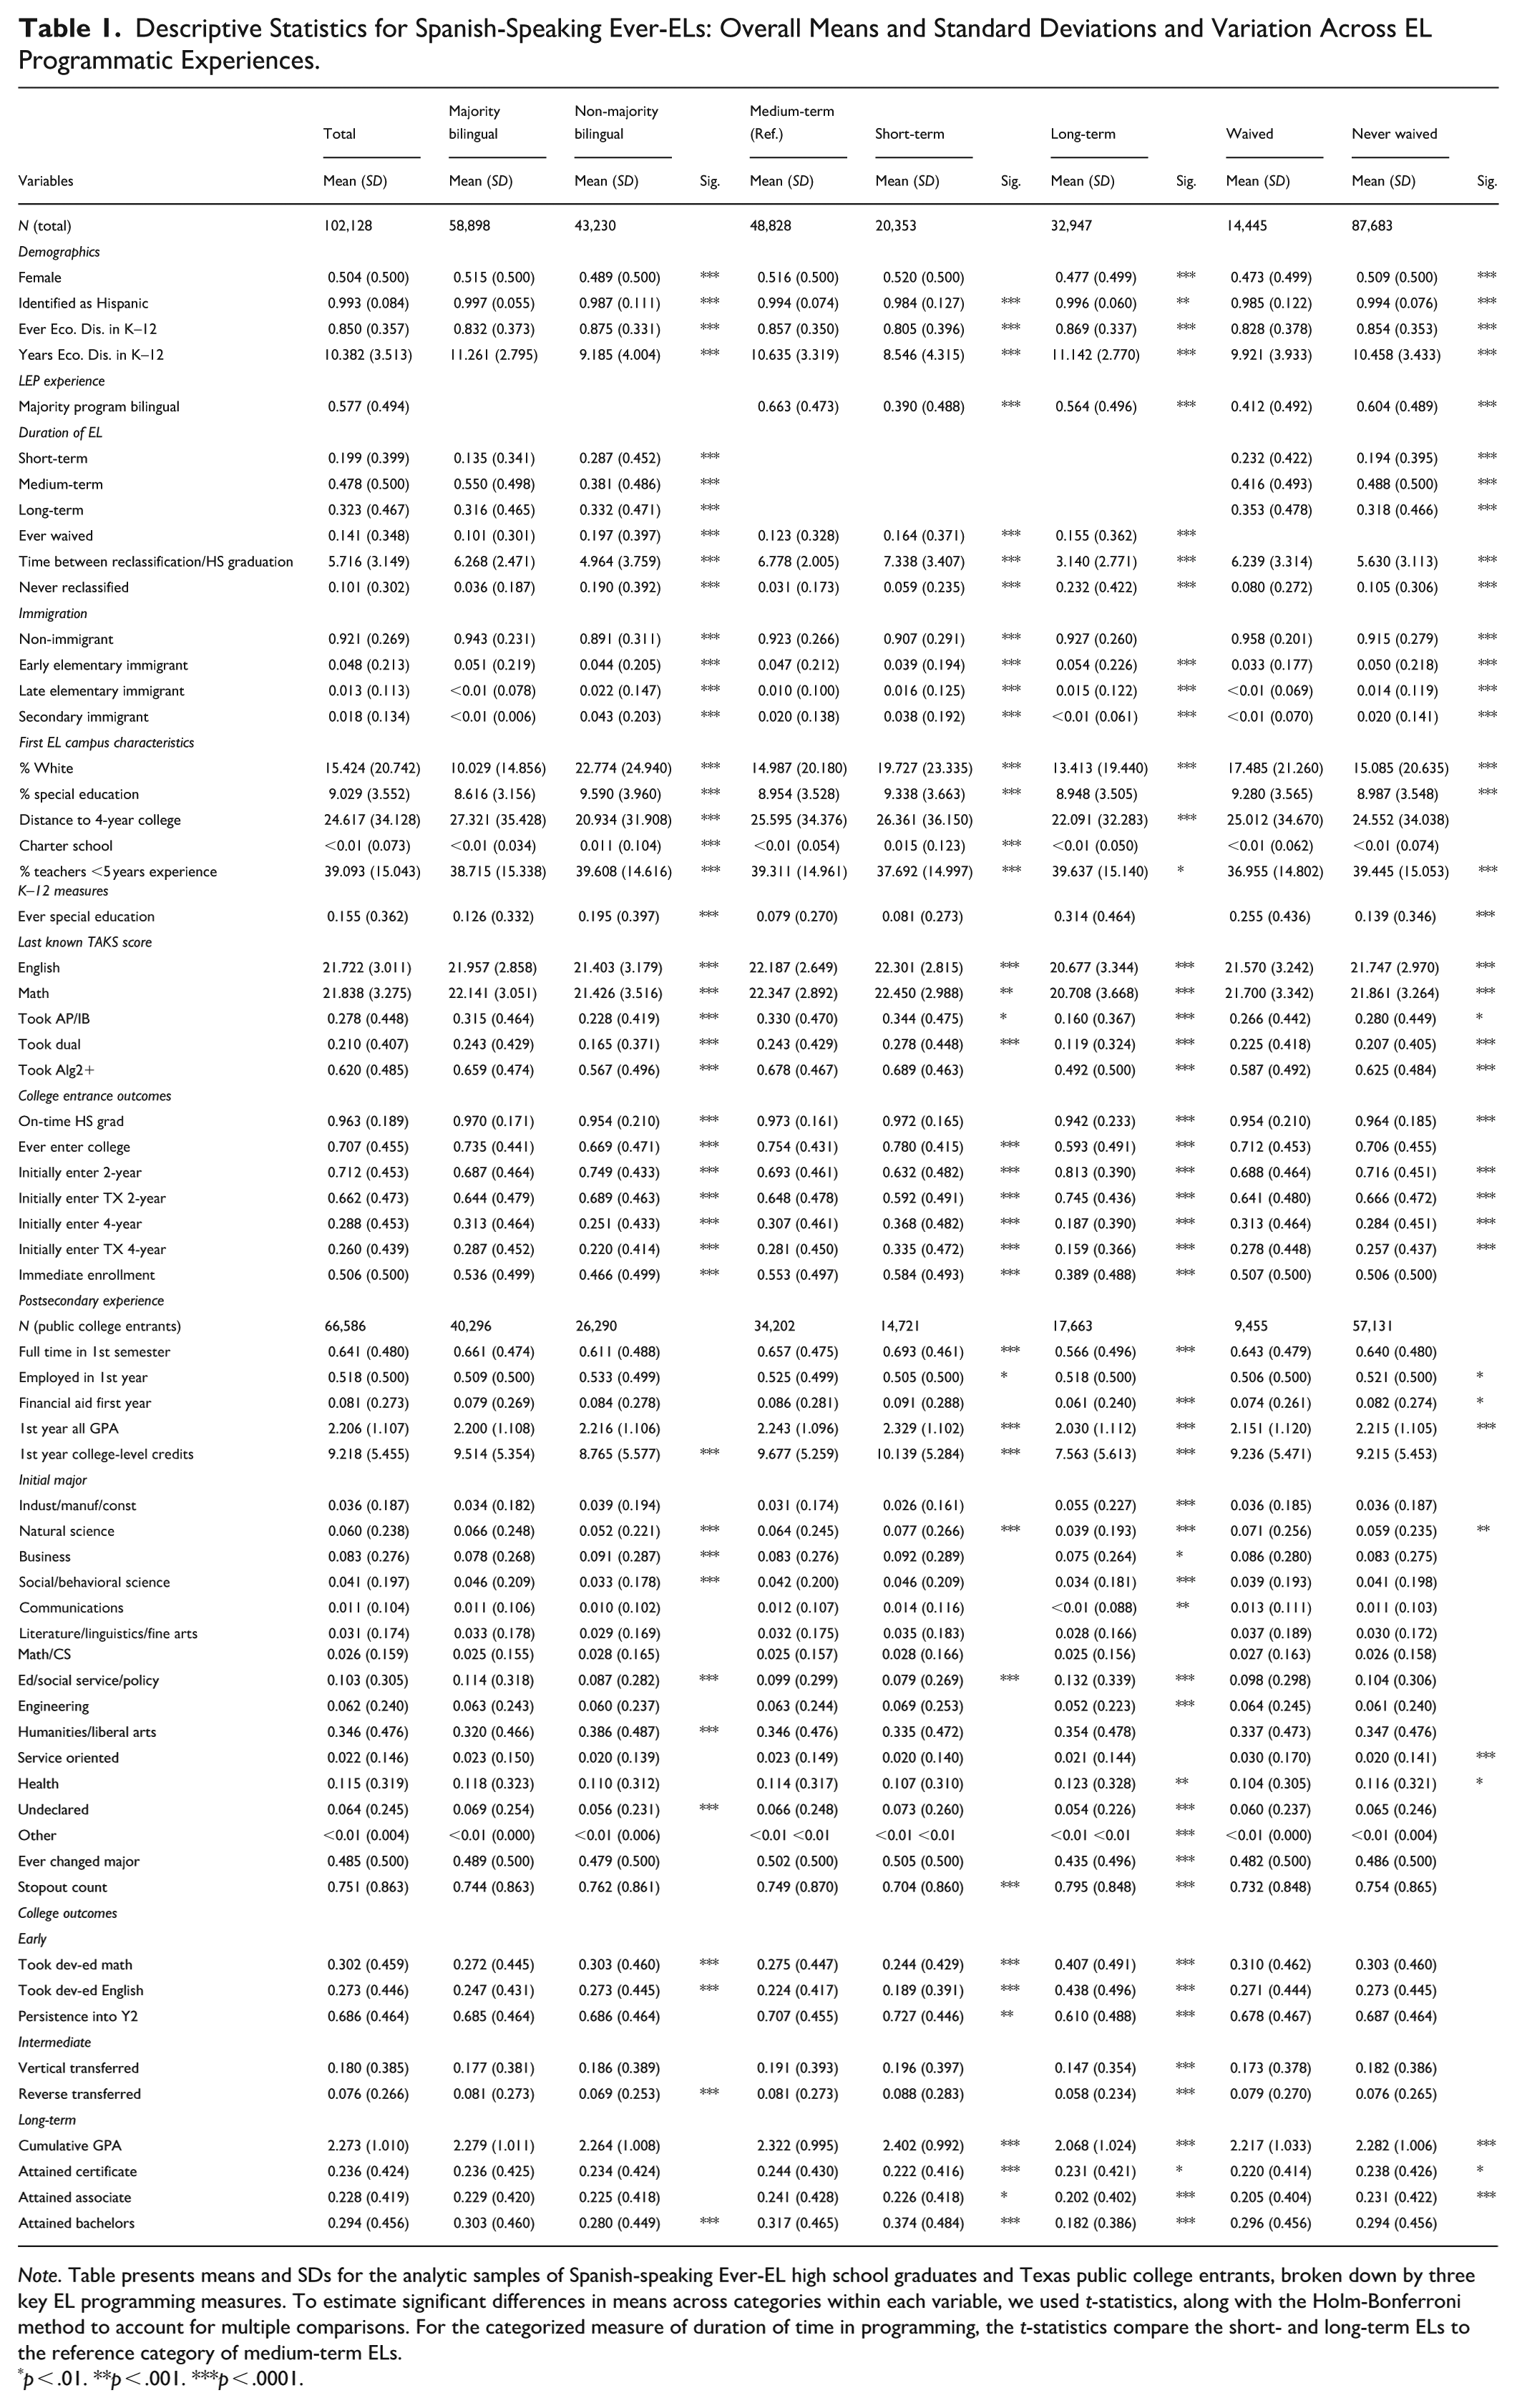
Note. Table presents means and SDs for the analytic samples of Spanish-speaking Ever-EL high school graduates and Texas public college entrants, broken down by three key EL programming measures. To estimate significant differences in means across categories within each variable, we used t-statistics, along with the Holm-Bonferroni method to account for multiple comparisons. For the categorized measure of duration of time in programming, the t-statistics compare the short- and long-term ELs to the reference category of medium-term ELs.
p < .01. **p < .001. ***p < .0001.
To further address RQ1, we consider the differences in student backgrounds across each set of our three focal EL programmatic conditions: (a) majority bilingual programming, (b) duration of time in EL status, and (c) ever having waived EL services. We first examine students experiencing majority bilingual education for their EL program placement (as opposed to ESL, or for a small minority of students—6%—waiving ELD altogether). A smaller share of majority bilingual students (83%) was identified as economically disadvantaged than their non-majority bilingual peers (88%), but they remained economically disadvantaged longer (11 years vs. 9). During their K–12 career, majority bilingual students spent 14%, 55%, and 32%, respectively, in short-, medium-, and long-term EL status; those in non-majority bilingual conditions were spread more evenly across the three duration categories. Compared with their peers, majority bilingual students also took more college-preparatory coursework such as dual enrollment, AP/IB, and advanced math courses. Moreover, a larger portion of majority bilingual students went on to enter college, and they enrolled in four-year institutions at higher rates than those in the nonmajority bilingual group; once in college, majority bilingual students enrolled in dev-ed at lower rates and attained a bachelor’s degree at higher rates than their peers.
We now turn to examine variation in student backgrounds across the duration of time spent in EL status. There is variation in the proportion of students flagged as economically disadvantaged across the three duration categories. Compared with MTELs (86%), a smaller share of the STEL subgroup was ever-economically-disadvantaged (81%). LTEL students looked more similar to MTELs in terms of economic disadvantage. A gender difference emerged as well, with boys more highly represented among LTELs (52%) compared with both STEL and MTEL status (48% for both). The three groups diverged in terms of programmatic experiences as well, with the highest share of MTEL students enrolled in bilingual programs for the majority of their time in EL status (66%), compared to LTELs (56%) and STELs (39%). Higher shares of both STELs and LTELs ever waived EL program participation (16% of each) than MTELs (12%). LTELs averaged 3.6 fewer years between EL program exit and graduation than their METL peers. Moreover, small differences existed in college preparatory coursework between STELs and MTELs (e.g., a greater proportion of STELS took dual-enrollment or AP/IB courses), and they graduated from high school on time at about the same rate. However, LTELs experienced significantly and substantively lower access to college preparatory coursework than their MTEL peers. Only 16% of LTELs took AP/IB courses, and 12% took dual enrollment courses, compared with 33% and 24% of MTELs, respectively, and a larger portion of LTELs did not graduate from high school on time. Moreover, although STELs’ and MTELs’ college entrance rates were very close (78% vs. 75%), LTELs were notably lower (59%). Even when LTELs enrolled in college, more of them entered two-year institutions (81%), compared with MTELs (69%) and STELs (63%). Among the students who entered college, LTELs enrolled in more dev-ed courses than their peers, with larger differences in dev-ed English participation than in dev-ed math participation. Finally, bachelor’s degree completion was higher for STELs than MTELs, while certificate completion was lower. LTELs attained all credentials at lower rates than MTELs, with the largest difference being in bachelor’s degree attainment.
Finally, we turn to variation by waiver status. A slightly smaller share of students whose parents ever waived ELD were identified as economically disadvantaged (83%) than their never-waived peers (85%). Girls are underrepresented among ever-waived students (47% vs. 51%); likewise, a notably smaller share of ever-waived experienced majority bilingual programming (41% vs. 60%) than never-waived students. In general, ever-waived students had slightly more variation in terms of duration in EL status than never-waived students. In high school, students who never waived enrolled in AP/IB and advanced math coursework at higher rates than ever-waived students, though ever-waived students were somewhat more likely to participate in dual enrollment. However, college enrollment rates were similar across the two groups, with about 71% of both groups attending any college during the follow-up period, although the students who waived were about 3% more likely to enter a four-year institution than their never-waived peers. Among those who went to college, the cumulative GPA of ever-waived students was slightly lower than that of never-waived students. Ultimately, both groups earned bachelor’s degrees at similar rates, but students who never waived attained certificates and associate degrees at slightly higher rates than those who waived.
Regression Results
Now we turn to models designed to examine the relationship between EL programmatic experiences and postsecondary outcomes (RQ2). We explore how EL educational experiences—majority bilingual programming, duration in EL status, and whether students ever waived ELD services—are associated with students’ initial college entrance and early-, intermediate-, and long-term college outcomes. After accounting for students’ demographic and academic characteristics and for the institutions they attended, we found that students’ K–12 EL programmatic experiences are correlated with college entrance and, among college entrants, early college outcomes.
College Entry
Table 2 presents regression results predicting whether students attend college at any point during the follow-up and, among college goers, whether they attend a two- or a four-year institution. Because our models of first college type are restricted to college goers, the models for entering any two- or four-year institution result in the same coefficients but with opposite signs. From there, we also predict attendance at public two-year and four-year institutions.
Linear Regression Models Predicting College Entrance Outcomes.
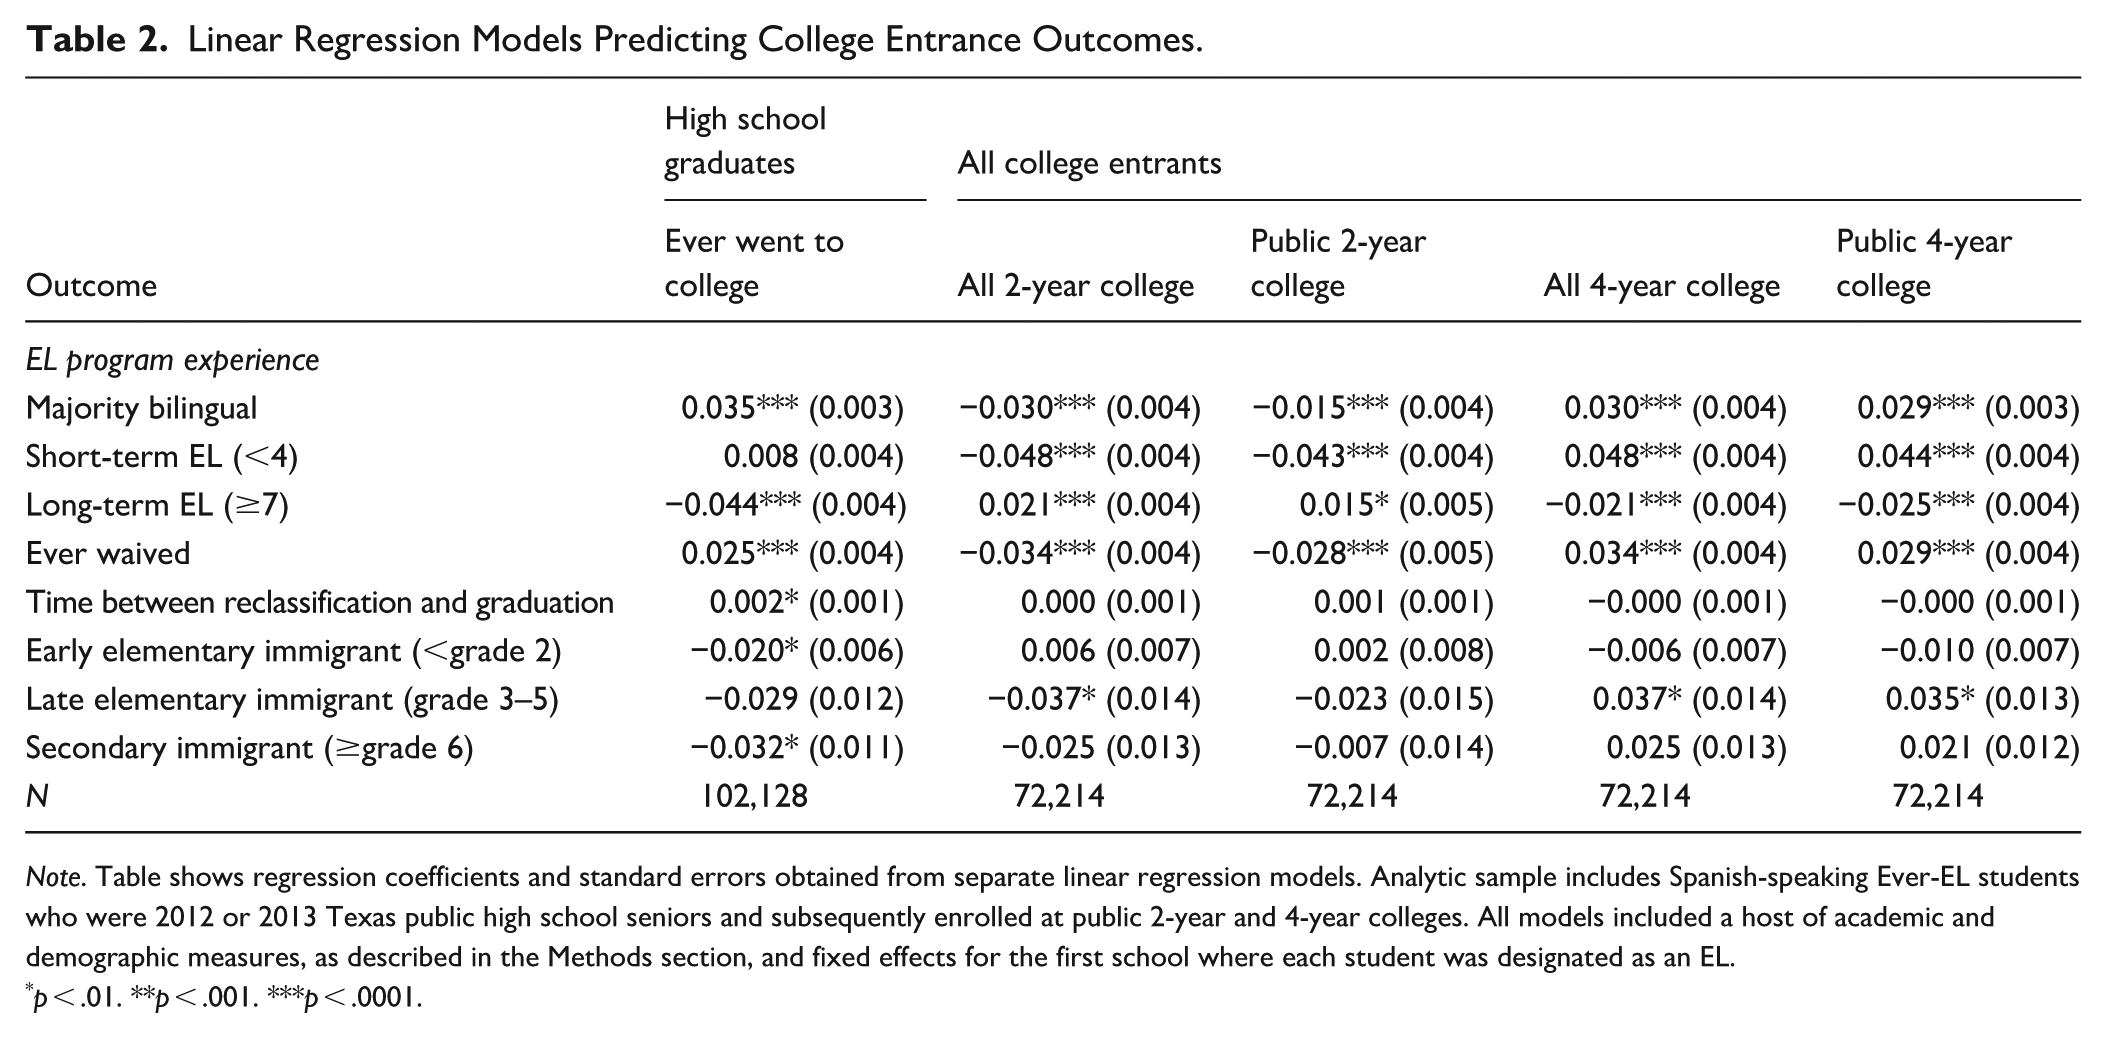
Note. Table shows regression coefficients and standard errors obtained from separate linear regression models. Analytic sample includes Spanish-speaking Ever-EL students who were 2012 or 2013 Texas public high school seniors and subsequently enrolled at public 2-year and 4-year colleges. All models included a host of academic and demographic measures, as described in the Methods section, and fixed effects for the first school where each student was designated as an EL.
p < .01. **p < .001. ***p < .0001.
We find that majority participation in bilingual programs positively predicts college entrance, where majority bilingual status is associated with a 3.5-percentage-point increase in the probability of ever going to college (in any level/sector; p < .0001). This positive relationship appears to be primarily driven by enrollment in four-year institutions, as majority bilingual programing is negatively correlated with entering any two-year college (and with entering a public two-year college) but positively correlated with entering a four-year institution.
Duration of EL status is associated with both college entrance itself and the type of college that the student enters. Compared with the reference group (MTELs), LTELs experienced a 4.4-percentage-point decrease in their probability of entering college. Those who did enter college were significantly less likely to enter through a four-year college and more likely to enter through a two-year college than their medium-term peers. Meanwhile, STELs had a similar probability of attending college as MTELs but were significantly more likely to initially enroll at a four-year college and less likely to enroll at a two-year college than MTELs.
Ever having waived EL program participation is associated with attending college; students who waived ELD services at least once experienced a 2.5-percentage-point increase in the probability of ever going to college. This small statistical bump in the probability of college attendance appeared to occur primarily through a decrease in the probability of their initially entering a two-year institution and, correspondingly, an increase in the probability of their initially entering a four-year institution compared with students who never waived.
Two other indicators of EL experience also appear to be correlated with college entrance outcomes. Students with a greater gap between reclassification and high school graduation saw a small increase in their probability of attending college; each additional year is associated with a .2-percentage-point increase in the probability of college enrollment (p < .01). Additionally, recent immigrants who entered in late elementary school (grades 3–5) appear to be more likely to enter a four-year institution (p < .01) than students who either were born in the U.S. or immigrated before starting kindergarten, though students who immigrated during secondary school were somewhat less likely to ever attend college than their peers (p < .01).
Short- and Intermediate-Term Outcomes
Table 3 presents the results from regressions on early and intermediate-term postsecondary outcomes, with separate results for public two-year and four-year college entrants. Among college entrants at both two- and four-year public colleges, majority bilingual programming is correlated with a decrease in students’ probability of enrolling in dev-ed English classes. Regarding duration in EL status, LTEL students who enter both institution types appear more likely than their MTEL peers to participate in dev-ed English; among public two-year college entrants only, however, STELs are less likely to take dev-ed English than MTELs (with no significant difference observed among four-year entrants). Moreover, LTEL status, compared with MTEL status, is associated with a 3.8- and 2.8-percentage-point decrease in the probability of persisting at two- and four-year colleges, respectively (p < .0001; p < .001).
Linear Regression Models Predicting Early and Intermediate Postsecondary Outcomes for 2-Year and 4-Year Texas Public College Entrants.
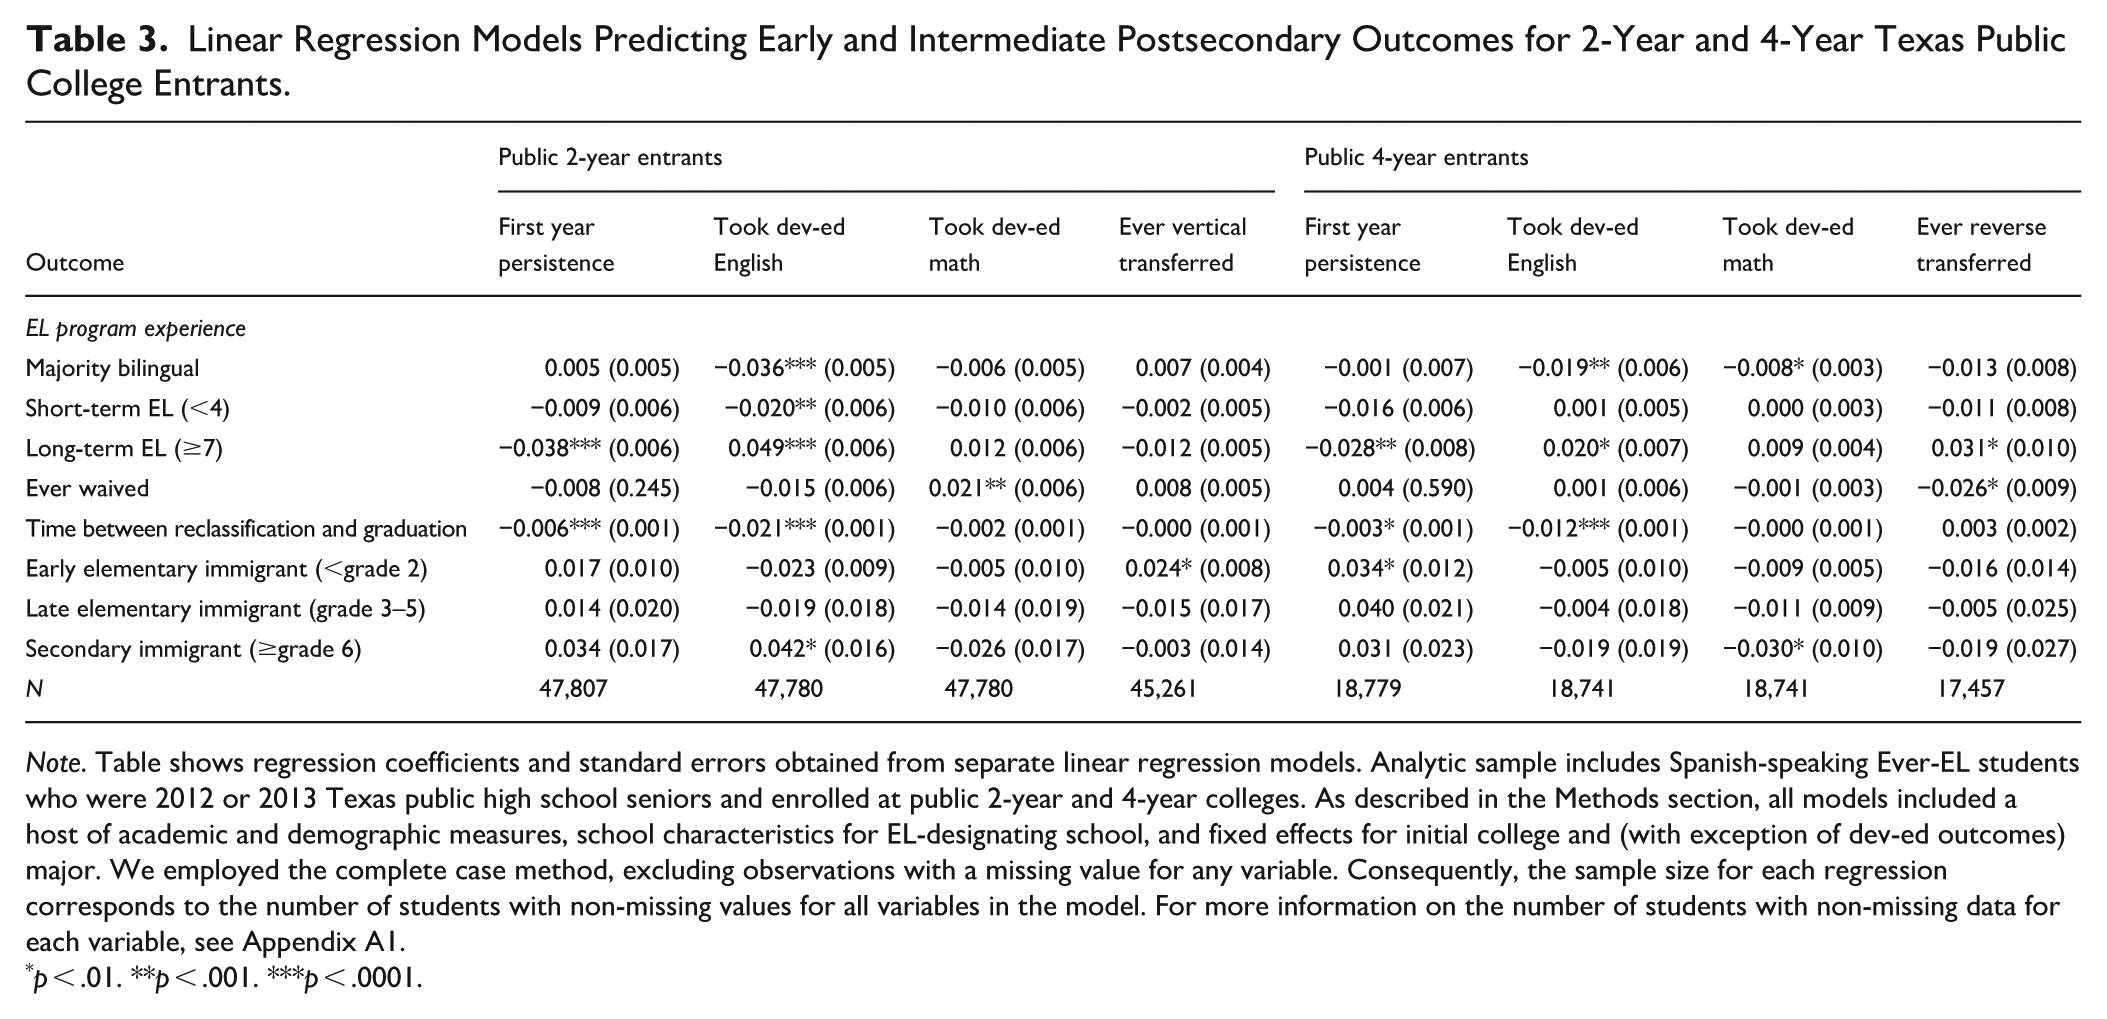
Note. Table shows regression coefficients and standard errors obtained from separate linear regression models. Analytic sample includes Spanish-speaking Ever-EL students who were 2012 or 2013 Texas public high school seniors and enrolled at public 2-year and 4-year colleges. As described in the Methods section, all models included a host of academic and demographic measures, school characteristics for EL-designating school, and fixed effects for initial college and (with exception of dev-ed outcomes) major. We employed the complete case method, excluding observations with a missing value for any variable. Consequently, the sample size for each regression corresponds to the number of students with non-missing values for all variables in the model. For more information on the number of students with non-missing data for each variable, see Appendix A1.
p < .01. **p < .001. ***p < .0001.
Once we move into intermediate-term college outcomes—that is, vertical and reverse transfer for two- and four-year college entrants, respectively—we see very few significant relationships between EL programming and transfer outcomes. Among four-year college entrants, LTELs experienced a 3.1-percentage-point larger increase in their probability of moving from a four-year to a two-year institution than MTELs, while those who ever waived experienced a 2.6-percentage-point larger drop in their probability of moving from a four-year to a two-year institution than non-waivers (p < .01; p < .01).
Long-Term Outcomes
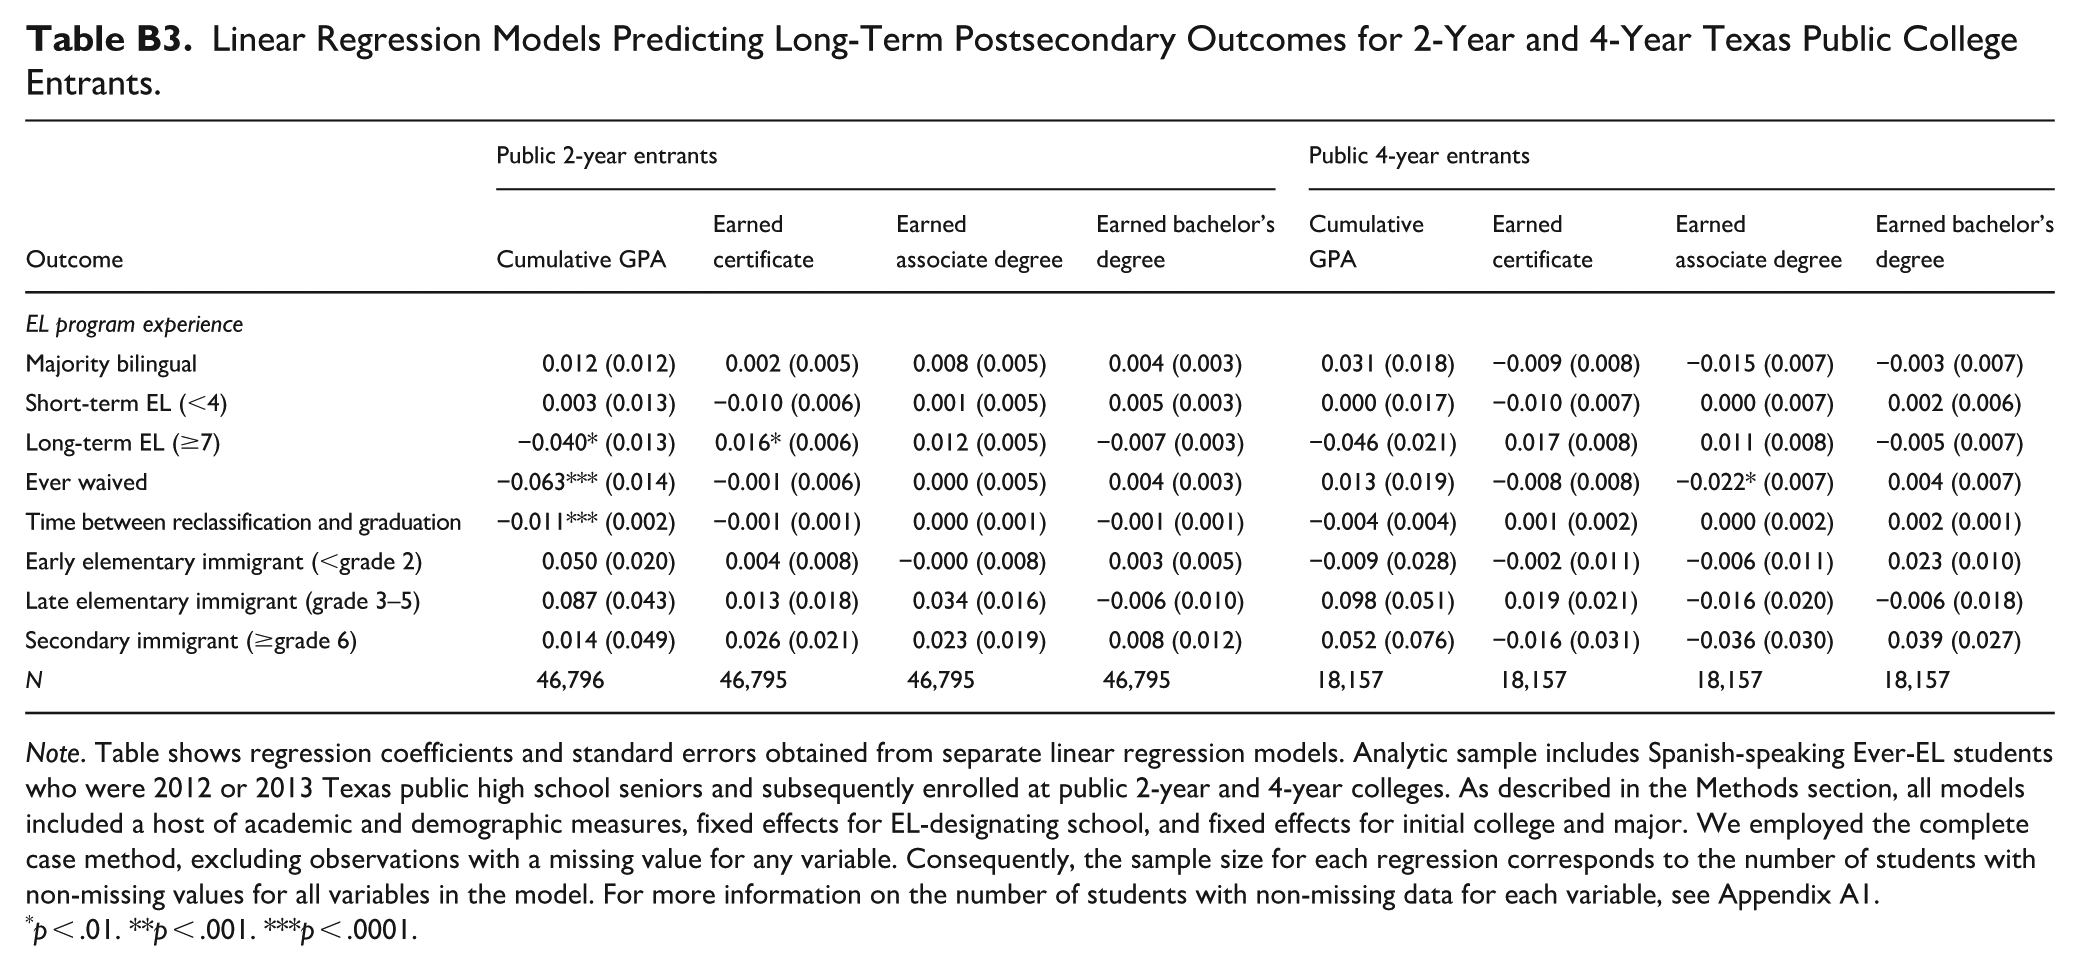
Table 4 presents regression results for long-term college outcomes broken down by initial institution type. Students’ EL programming experiences appear to be strongly associated with their cumulative GPA but not attainment. For both two-year and four-year enrollees, LTEL status is associated with a decrease in GPA—of .056- and .077 units, respectively—compared with MTEL status. Likewise, each additional year between reclassification and graduation is associated with a decrease in GPA of between .011–.012 units, respectively, for four-year and two-year entrants. Among two-year college entrants, ever waiving EL program participation (compared with never waiving) is associated with a 0.069-unit greater decrease in GPA. There is also a small positive relationship between immigration timing and cumulative GPA, where those who immigrated in early elementary and secondary school appear to experience a greater boost in their GPA than students who were never flagged with a recent immigrant indicator in the data, but this was only the case among those who initially enrolled in a two-year institution.
Linear Regression Models Predicting Long-Term Postsecondary Outcomes for 2-Year and 4-Year Texas Public College Entrants.
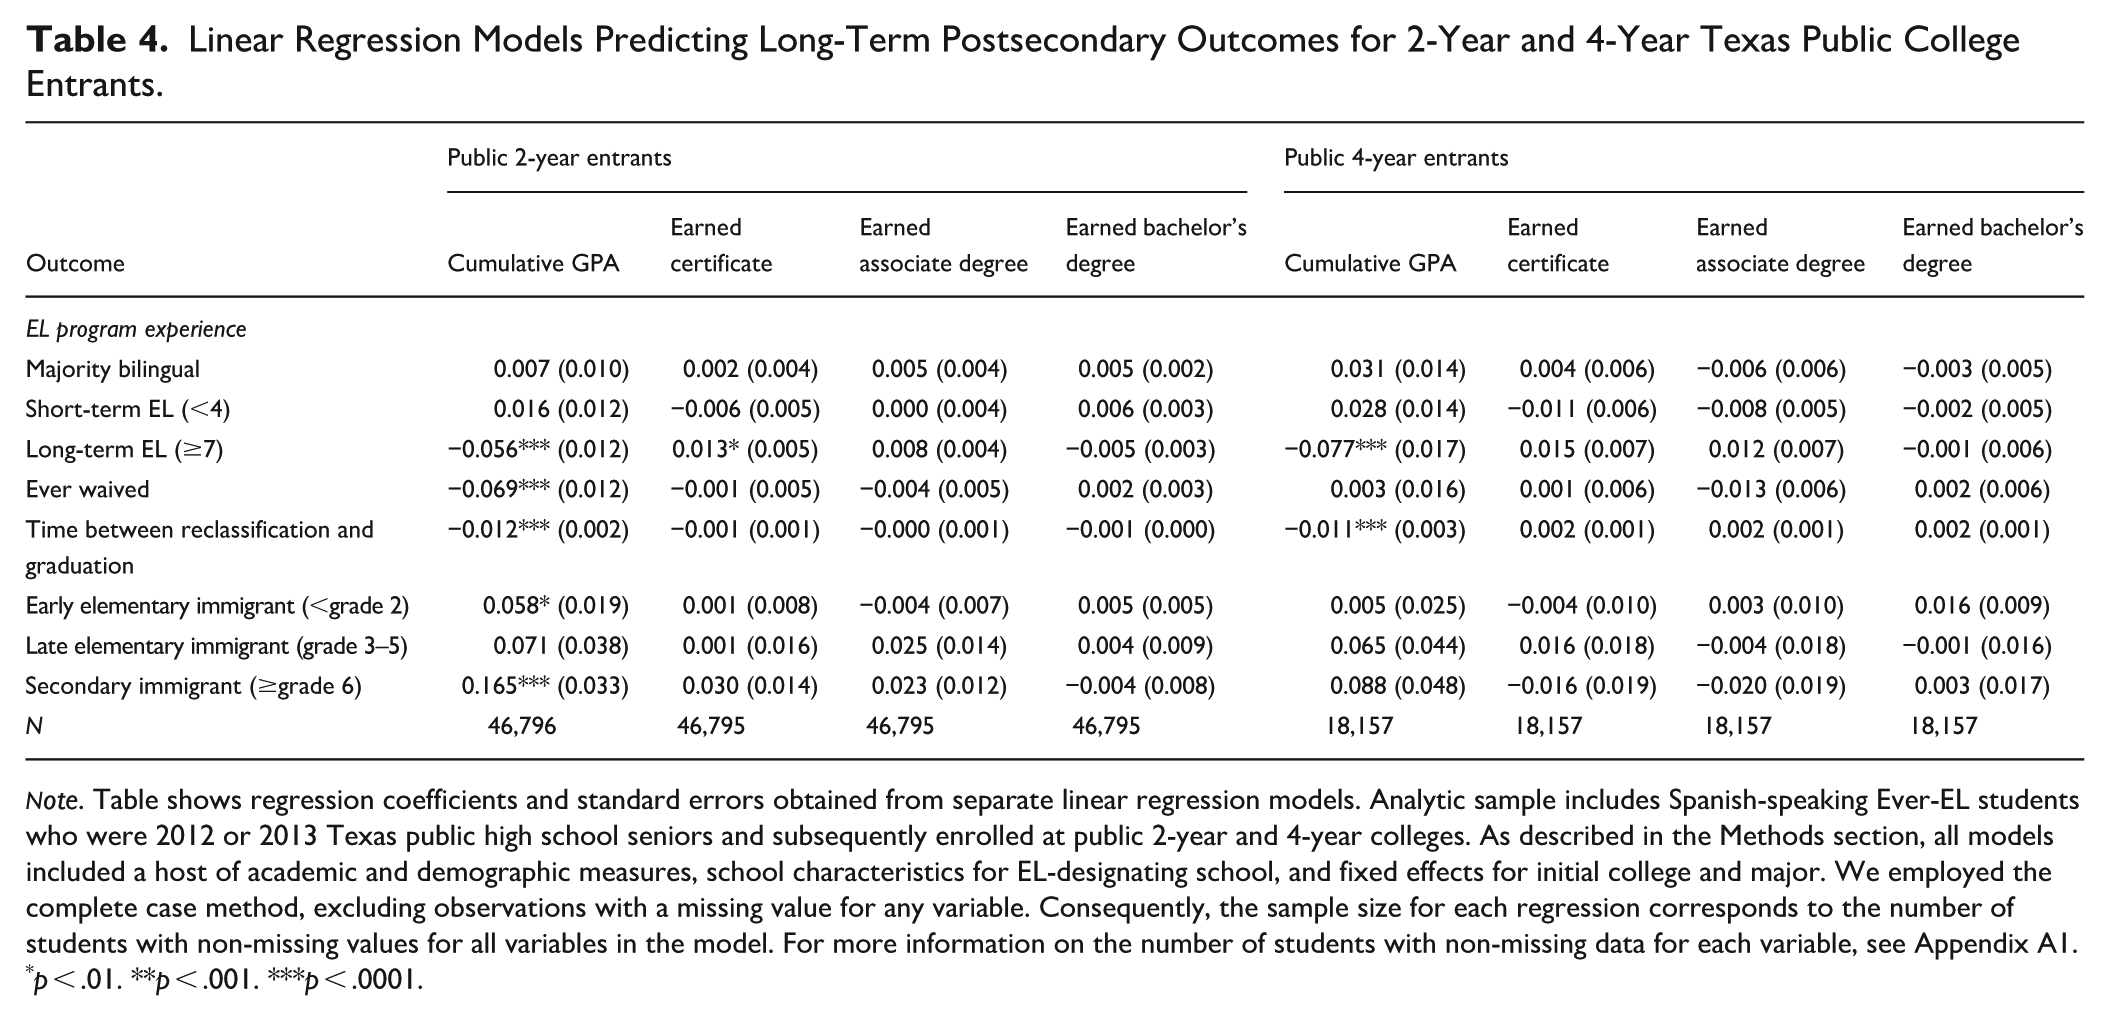
Note. Table shows regression coefficients and standard errors obtained from separate linear regression models. Analytic sample includes Spanish-speaking Ever-EL students who were 2012 or 2013 Texas public high school seniors and subsequently enrolled at public 2-year and 4-year colleges. As described in the Methods section, all models included a host of academic and demographic measures, school characteristics for EL-designating school, and fixed effects for initial college and major. We employed the complete case method, excluding observations with a missing value for any variable. Consequently, the sample size for each regression corresponds to the number of students with non-missing values for all variables in the model. For more information on the number of students with non-missing data for each variable, see Appendix A1.
p < .01. **p < .001. ***p < .0001.
Finally, we turn to credential outcomes. EL programming experiences, along with most of the variables summarizing students’ K–12 experience, are not notably correlated with these long-term outcomes. The only exception is that LTELs appear to experience a slightly higher probability—1 percentage point—of earning a certificate than MTEL students.
Discussion
Ever-EL students experiences with ELD support are structured through various programmatic pathways, including differences in EL program type, duration in EL status, and waiving of services. To highlight variation in the programmatic experiences of ever-EL students and illuminate how ELD structures predict postsecondary trajectories, we tracked Spanish-speaking ever-EL high school seniors in Texas into and through college. We used descriptive statistics to examine how their demographic and academic characteristics and academic experiences and outcomes differ across three distinct, but non-exclusive EL programmatic experiences: (a) exposure to majority bilingual education, (b) duration in EL status, and (c) ever having waived EL services. We then used linear probability models to understand how those three experiences predict ever-ELs’ college outcomes after controlling for students’ demographic background and prior academic experiences.
Our findings suggest that most Spanish-speaking ever-EL students experienced a mix of EL program types. We originally planned to compare students who were in three conditions—bilingual, ESL, and waiving service—but quickly learned (as shown in our descriptive results) that a sizeable portion of students moved between program types. A quarter of our analytic sample experienced more than one program type during their time in EL status. Because we were not classifying students based on one point in time but rather were examining their programmatic experience across the entirety of their time in EL status, we could not simply compare across those three groups. Instead, we created a majority measure (necessary, since creating a measure of cumulative years in a EL program type would be correlated with the measure for duration in EL status), from which we found that almost three-fifths of the students experienced the majority of their EL services in bilingual education. This datum suggests that researchers using observational data who wish to study ELs over time may need to similarly adopt a “majority” program measure. It also means that a useful next step in the literature would be for researchers to explore the effects of moving between program types on students’ academic and social experiences and development.
In line with previous research, our results suggest positive returns to spending the bulk of EL programming in bilingual education (rather than ESL, equal time in both, or waiving; Morita-Mullaney et al., 2020; Umansky et al., 2015; Valentino & Reardon, 2015). Students who experienced majority bilingual education were more likely to enter college and to attend a four-year rather than a two-year institution. Once in college—at both two- and four-year publics—ever-ELs who experienced majority bilingual programming appeared less likely to enroll in dev-ed English than their peers who experienced alternative programming for the bulk of their time as an EL. These findings align with extant evidence suggesting that bilingual education participation correlates positively with academic performance and English proficiency (e.g., Morita-Mullaney et al., 2020; Umansky & Reardon, 2014; Umansky et al., 2015; Valentino & Reardon, 2015), meaning that bilingual education likely prepares the students well for entering four-year institutions. However, after initial selection into colleges (and into college-level English coursework), there does not appear to be an association between majority bilingual education and longer-term postsecondary outcomes such as degree attainment. The field would benefit greatly from future research examining variation in outcomes by type of bilingual programming—for example, examining whether these relationships vary for dual language programs relative to other forms of bilingual programming (Freire et al., 2024). Our analytic window precedes both the expansion of dual-language bilingual education in Texas in the early 2010s and the coding of those programs as distinct from other bilingual offerings in TEA data, offering a ripe opportunity for future research when additional follow-up data becomes available.
Extending previous research on the role of LTEL status (Menken & Kleyn, 2010; Menken et al., 2012; Olsen, 2010), we observed long-term implications—well into the college years—for remaining in EL status for the long term. LTEL students appeared less likely than their peers to attend college, bolstering support for previous evidence about the repercussions of remaining in EL status over the long term. LTELs who did attend college were more likely than their MTEL peers to do so through a two-year institution, even after controlling for a host of demographic and academic background measures. The LTELS who entered a four-year institution were more likely than MTELs to reverse transfer (move to a two-year institution). The LTEL flag was also associated with taking dev-ed English, decreased college persistence, and lower cumulative GPA. These results align with qualitative findings that LTELs may be less academically engaged than their peers in high school, which may lower their postsecondary preparation (Brooks, 2018; Thompson, 2015). The lasting consequences of earlier educational trajectories for LTELs’ postsecondary outcomes supports arguments for further developing pedagogical, programmatic, and structural approaches in secondary EL education (Brooks, 2020; Thompson & Rodriguez-Mojica, 2023).
Given this study’s findings and prior literature on LTELs (Brooks, 2018; Menken et al., 2012; Thompson, 2015), our recommendations are twofold: first, we suggest that this subgroup of students would likely benefit from additional academic support during college, perhaps in the form of targeted academic advising (Tovar, 2015), peer mentoring (Rios-Ellis et al., 2015), or other interventions to support persistence and attainment. Second, we suggest that school systems review the policies surrounding EL program exit to ensure that students are being exited in a timely manner. Long-term EL status may be shaped by subjective judgement of educators, potentially related to racialized or linguistic bias (Mavrogordato & White, 2017; Umansky et al., 2020). Eliminating human error or bias from the reclassification process could avoid leaving students in ELD services longer than necessary. Auto-reclassification policies (i.e., student nomination per state-level objective criteria) appear to increase reclassification rates. In Michigan, districts that shifted to automatic reclassification—as opposed to manual reclassification by district staff—experienced a 35-percentage-point increase, on average, in reclassification, with even greater effects for EL-identified Spanish speakers (Bartlett et al., 2024). Addressing the issue at the systems-level in other contexts may also have the potential to increase reclassification rates and reduce the prevalence of LTEL status.
It is possible there are other characteristics related to long-term retention in EL status that are not available in our state administrative data. Socioemotional skills, student motivation, and teacher preferences may predict both LTEL status and postsecondary outcomes (Brooks, 2018; Thompson, 2015). Our analyses capture a rich set of demographic and academic measures that are likely correlated with those factors. For example, we include indicators of socioeconomic status (e.g., an economic disadvantage indicator) and academic achievement (e.g., test scores, college preparatory coursework, special education participation). We recommend that future research further examine additional socioemotional and relationship-based characteristics to better understand their associations with both LTEL status and college enrollment.
Interestingly, our results suggest that ever having waived ELD services correlates positively with going to college, where students who ever waived are more likely to enter a four-year institution and less likely to enter a two-year institution than their peers. Given the dearth of literature on waiving ELD services, this finding illustrates how important it is that we better understand the intentions of parents who waive their children out of ELD and the consequences of their doing so. Our results could suggest two possibilities: (1) that students—and their parents—who waive differ systematically from those who do not waive in ways that our models do not fully capture; and (2) that waiving may give students an advantage by giving them greater exposure to general academic content (which students in ELD services might otherwise miss). We posit that parents who waive students out of ELD services may be those who have both the information and the social capital to remove their students from the status quo (an EL program). This nascent link between waiving and college-going (and entering four-year institutions) may very well be driven by having a parent who would advocate for the student (to be in English-only education); such parents probably also have the social or cultural capital to advocate for their student’s attending a university rather than a community college. At the same time, we cannot know with certainty what drives this pattern of results, especially since students who waive appear to be very different than their peers. We call for more research to be conducted on which students waive, why students waive, and the consequences of waiving.
Our findings show that many of the associations between K–12 EL programmatic experiences and college outcomes are strongest for college entrance and early college outcomes, with very few downstream associations predicting intermediate- or long-term outcomes (not surprisingly, in our full regression results, we see that college-specific experiences are more predictive for those outcomes). However, because EL programmatic experiences predict college entrance and college type, this result suggests that these factors still shape ever-ELs’ postsecondary opportunities for attainment, since both entering college and the type of institution initially attended are strong antecedents for earning college credentials (Schudde & Brown, 2019). These findings are some of the first showing a clear link between type of EL programmatic experiences and these young adult outcomes.
Overall, our descriptive and inferential results suggest that substantial variation exists in how Spanish-speaking ever-ELs experience EL programming. At the very least, those programming experiences—including whether these students spend the majority of their time in bilingual education, the duration of time they spent in EL status (particularly, exiting before year 7), and whether they ever waived ELD services—are correlated with early college outcomes, with implications for long-term educational attainment and, relatedly, labor market opportunities.
Footnotes
Appendix A
Variable Names and Descriptions.
| Variable name | Description | All | 2-year | 4-year |
|---|---|---|---|---|
| N | 102,128 | 47,807 | 18,779 | |
| Demographics | Mean (SD) | Mean (SD) | Mean (SD) | |
| Female | Identified as female | 0.504 (0.500) | 0.534 (0.499) | 0.557 (0.497) |
| Hispanic | Identified as Hispanic | 0.993 (0.084) | 0.993 (0.086) | 0.992 (0.090) |
| Ever Eco. Dis. in K–12 | Dichotomous indicator of whether the student was ever eligible for free or reduced-price lunch or eligible for other public assistance; obtained from Texas Education Agency (TEA) demographics data | 0.850 (0.357) | 0.861 (0.346) | 0.768 (0.422) |
| Years Eco. Dis. in K–12 | The number of years the student was eligible for free or reduced-price lunch or eligible for other public assistance; obtained from TEA demographics data | 10.382 (3.513) | 10.315 (3.537) | 10.106 (3.869) |
| LEP related measures | ||||
| Majority program bilingual | Dichotomous indicator of whether the student was in a bilingual program during time identified as limited English proficient (LEP); created using TEA data | 0.577 (0.494) | 0.583 (0.493) | 0.661 (0.473) |
| Duration | Dichotomous indicators specifying the duration of LEP programming; created using TEA demographics data | |||
| Short-term | Less than 4 years identified as LEP | 0.199 (0.399) | 0.197 (0.397) | 0.283 (0.451) |
| Mid-term | 4 years to 6 years identified as LEP | 0.478 (0.500) | 0.499 (0.500) | 0.551 (0.497) |
| Long-term | 7 or more years identified as LEP | 0.323 (0.467) | 0.305 (0.460) | 0.165 (0.372) |
| Ever waived | Dichotomous indicator of ever having waived English Learner (EL) programming; created using TEA data | 0.141 (0.348) | 0.138 (0.345) | 0.153 (0.360) |
| Time between reclassification/HS graduation | Number of years since being reclassified as non-EL to high school graduation; created using TEA demographics data | 5.716 (3.149) | 5.804 (3.052) | 6.622 (2.623) |
| Never reclassified | Dichotomous indicator of remaining in LEP status at the time of high school graduation; created using TEA demographics data | 0.101 (0.302) | 0.088 (0.283) | 0.043 (0.204) |
| Immigration | Immigrant status, obtained from TEA demographics data | |||
| Non immigrant | (Reference) Never identified as immigrant during K–12 | 0.921 (0.269) | 0.924 (0.266) | 0.924 (0.266) |
| Early elementary immigrant | Identified as immigrant between grades K–2 | 0.048 (0.213) | 0.047 (0.211) | 0.047 (0.211) |
| Late elementary immigrant | Identified as immigrant between grades 3 and 5 | 0.013 (0.113) | 0.012 (0.108) | 0.015 (0.122) |
| Secondary immigrant | Identified as immigrant at grade 6 or above | 0.018 (0.134) | 0.018 (0.132) | 0.015 (0.120) |
| First EL campus | Characteristics of institution that the student first received EL programming | |||
| % White | Percentage of students and staff who are identified as White; derived from Texas Academic Performance Reports (TAPR) data | 15.424 (20.742) | 16.039 (20.971) | 12.124 (18.527) |
| % special education | Percentage of students served by special education programs; derived from TAPR data | 9.029 (3.552) | 9.042 (3.469) | 8.795 (3.274) |
| Distance to 4-year college | Distance to closest 4-year college, estimate obtained using distance between high school zip code (from TAPR data) and closest university zip code (from Integrated Postsecondary Education Data System [IPEDS]) | 24.617 (34.128) | 24.119 (34.349) | 24.720 (33.342) |
| Charter | Dichotomous indicator of charter school status; derived from TEA campus data | 0.005 (0.073) | 0.005 (0.069) | 0.006 (0.079) |
| % <5 years experience | Percentage of teachers with 5 or less years of teaching experience; derived from TAPR data | 39.093 (15.043) | 39.166 (15.034) | 38.620 (15.309) |
| K–12 measures | ||||
| Special education | Dichotomous indicator of whether the student ever received special education services during K–12, derived from TEA demographics data | 0.155 (0.362) | 0.132 (0.339) | 0.057 (0.233) |
| Last known TAKS reading scale score | Last observed Texas Assessment of Knowledge and Skills (TAKS) reading score known before high school graduation; derived from TEA TAKS data | 21.722 (3.011) | 21.854 (2.768) | 23.282 (1.700) |
| Last known TAKS math scale score | Last observed TAKS math score known before high school graduation; derived from TEA TAKS data | 21.838 (3.275) | 21.915 (2.952) | 23.766 (2.161) |
| AP/IB courses | Dichotomous indicator of whether the student ever took Advanced Placement (AP) or International Baccalaureate (IB) course; derived from TEA courses data | 0.278 (0.448) | 0.246 (0.431) | 0.654 (0.476) |
| Dual credit courses | Dichotomous indicator of whether the student ever took a dual credit course; derived from TEA courses data | 0.210 (0.407) | 0.205 (0.404) | 0.426 (0.495) |
| Courses higher than algebra 2 | Dichotomous indicator of whether the student ever took an advanced math course; derived from TEA courses data | 0.620 (0.485) | 0.639 (0.480) | 0.905 (0.293) |
| College entrance | ||||
| Ever college | Dichotomous indicator of whether the student ever entered college; derived from Texas Higher Education Coordinating Board (THECB) enrollment data and National Student Clearinghouse (NSC) data | 0.707 (0.455) | ||
| Institution type | Dichotomous indicators specifying the type of institution student first enrolled in after high school graduation, derived from THECB enrollment data and NSC data (N = 72,214) | |||
| All 2-year | Entered a 2-year college in the U.S. | 0.712 (0.453) | ||
| TX public 2-year | Entered a public 2-year college in Texas | 0.662 (0.473) | ||
| All 4-year | Entered a 4-year college in the U.S. | 0.288 (0.453) | ||
| TX public 4-year | Entered a public 4-year college in Texas | 0.260 (0.439) | ||
| Academic measures—college | ||||
| First semester enrollment intensity | Dichotomous indicator of whether the student took 12 or more course credits in the first semester in college after high school graduation; derived from THECB schedule data | 0.623 (0.485) | 0.846 (0.361) | |
| GPA in first college year | Grade point average from all courses taken in the first year of college, including non-college-level courses; derived from THECB schedule data |
2.111 (1.135) | 2.452 (0.991) | |
| Financial aid application in first college year | Dichotomous indicator of whether the student applied for financial aid in the first year of college; obtained from THECB financial aid data | 0.073 (0.260) | 0.100 (0.300) | |
| Employed during first college year | Dichotomous indicator of whether the student was employed while actively taking courses in the first year of college; derived from Texas Workforce Commission data and THECB enrollment data | 0.580 (0.494) | 0.361 (0.480) | |
| Credits enrolled in first college year | Number of college-level course credits attempted in the first year of college (excludes remedial coursework credits); derived from THECB schedule data | 8.134 (5.453) | 11.980 (4.381) | |
| Initial major | Dichotomous indicators specifying student’s major at the first year of college; derived from THECB enrollment data | |||
| Industry/agriculture/manufacturing/construction | 0.048 (0.213) | 0.007 (0.084) | ||
| Natural science | 0.032 (0.175) | 0.133 (0.340) | ||
| Business | 0.078 (0.268) | 0.096 (0.295) | ||
| Social and behavior sciences | 0.026 (0.161) | 0.077 (0.266) | ||
| Communications | 0.007 (0.086) | 0.020 (0.141) | ||
| Literature | 0.025 (0.155) | 0.049 (0.216) | ||
| Mathematics and statistics/computer sciences and support services | 0.024 (0.154) | 0.030 (0.170) | ||
| Education/security/law enforcement and protective services/public administration/social service | 0.114 (0.318) | 0.077 (0.266) | ||
| Engineering | 0.043 (0.203) | 0.109 (0.312) | ||
| Humanities, liberal arts, and general studies | 0.437 (0.496) | 0.113 (0.317) | ||
| Service oriented | 0.019 (0.136) | 0.029 (0.169) | ||
| Health | 0.114 (0.318) | 0.116 (0.320) | ||
| Undeclared | 0.033 (0.179) | 0.143 (0.350) | ||
| Changed major | Dichotomous indicator of whether ever changed their major; captures students who changed broad Classification of Instructional Programs (CIP) codes (first two digits), derived from program codes in THECB enrollment data | 0.481 (0.500) | 0.495 (0.500) | |
| Stopout count | Number of long semesters the student didn’t enroll in after initial enrollment in college after high school; derived from THECB enrollment data | 0.848 (0.869) | 0.504 (0.794) | |
| Early college milestones | ||||
| First year persistence | Dichotomous indicator of whether student re-enrolled in the subsequent school year following their first year in college; derived from THECB enrollment data | 0.623 (0.485) | 0.846 (0.361) | |
| Took developmental math | Dichotomous indicator of whether student ever took any developmental mathematics course; derived from THECB schedule data = 47,780, |
0.412 (0.492) | 0.026 (0.158) | |
| Took developmental English | Dichotomous indicator of whether student ever took any developmental English course; derived from THECB schedule data |
0.332 (0.471) | 0.123 (0.328) | |
| Transfer | ||||
| Vertical transferred | Dichotomous indicator of whether student ever transferred to a 4-year university after starting at a 2-year community college; derived from THECB enrollment data | 0.251 (0.434) | ||
| Reverse transferred | Dichotomous indicator of whether student ever transferred to a 2-year community college after starting at a 4-year university; derived from THECB enrollment data | 0.271 (0.444) | ||
| Cumulative GPA | Cumulative grade point average from all courses; derived from THECB schedule data |
2.159 (1.031) | 2.568 (0.887) | |
| Cumulative credits earned | Cumulative number of credits earned from college-level courses (excludes remedial coursework credits); derived from THECB schedule data |
50.457 (49.654) | 95.248 (49.824) | |
| Certificate | Dichotomous indicator of whether the student earned a certificate; obtained from THECB graduation data | 0.285 (0.451) | 0.111 (0.314) | |
| Total semesters until certificate | Number of semesters student took to earn a certificate; derived from THECB graduation data and enrollment data |
7.332 (3.036) | 7.559 (4.135) | |
| Associate degree | Dichotomous indicator of whether the student earned an associate degree; obtained from THECB graduation data | 0.274 (0.446) | 0.109 (0.312) | |
| Total semesters until associate degree | Number of semesters student took to earn an associate degree; derived from THECB graduation data and enrollment data |
8.289 (2.879) | 8.242 (4.209) | |
| Bachelor’s degree | Dichotomous indicator of whether the student earned a bachelor’s degree; obtained from THECB graduation data | 0.174 (0.379) | 0.601 (0.490) | |
| Total semesters until bachelor’s degree | Number of semesters student took to earn a bachelor’s degree; derived from THECB graduation data and enrollment data |
11.597 (2.571) | 9.853 (2.197) | |
Note. The table presents variable descriptions for all analyses in addition to means and standard deviations for the analytic sample of students.
Appendix B: Models with School Fixed Effects
Linear Regression Models Predicting Long-Term Postsecondary Outcomes for 2-Year and 4-Year Texas Public College Entrants.
| Outcome | Public 2-year entrants | Public 4-year entrants | ||||||
|---|---|---|---|---|---|---|---|---|
| Cumulative GPA | Earned certificate | Earned associate degree | Earned bachelor’s degree | Cumulative GPA | Earned certificate | Earned associate degree | Earned bachelor’s degree | |
| EL program experience | ||||||||
| Majority bilingual | 0.012 (0.012) | 0.002 (0.005) | 0.008 (0.005) | 0.004 (0.003) | 0.031 (0.018) | −0.009 (0.008) | −0.015 (0.007) | −0.003 (0.007) |
| Short-term EL (<4) | 0.003 (0.013) | −0.010 (0.006) | 0.001 (0.005) | 0.005 (0.003) | 0.000 (0.017) | −0.010 (0.007) | 0.000 (0.007) | 0.002 (0.006) |
| Long-term EL (≥7) | −0.040* (0.013) | 0.016* (0.006) | 0.012 (0.005) | −0.007 (0.003) | −0.046 (0.021) | 0.017 (0.008) | 0.011 (0.008) | −0.005 (0.007) |
| Ever waived | −0.063*** (0.014) | −0.001 (0.006) | 0.000 (0.005) | 0.004 (0.003) | 0.013 (0.019) | −0.008 (0.008) | −0.022* (0.007) | 0.004 (0.007) |
| Time between reclassification and graduation | −0.011*** (0.002) | −0.001 (0.001) | 0.000 (0.001) | −0.001 (0.001) | −0.004 (0.004) | 0.001 (0.002) | 0.000 (0.002) | 0.002 (0.001) |
| Early elementary immigrant (<grade 2) | 0.050 (0.020) | 0.004 (0.008) | −0.000 (0.008) | 0.003 (0.005) | −0.009 (0.028) | −0.002 (0.011) | −0.006 (0.011) | 0.023 (0.010) |
| Late elementary immigrant (grade 3–5) | 0.087 (0.043) | 0.013 (0.018) | 0.034 (0.016) | −0.006 (0.010) | 0.098 (0.051) | 0.019 (0.021) | −0.016 (0.020) | −0.006 (0.018) |
| Secondary immigrant (≥grade 6) | 0.014 (0.049) | 0.026 (0.021) | 0.023 (0.019) | 0.008 (0.012) | 0.052 (0.076) | −0.016 (0.031) | −0.036 (0.030) | 0.039 (0.027) |
| N | 46,796 | 46,795 | 46,795 | 46,795 | 18,157 | 18,157 | 18,157 | 18,157 |
Note. Table shows regression coefficients and standard errors obtained from separate linear regression models. Analytic sample includes Spanish-speaking Ever-EL students who were 2012 or 2013 Texas public high school seniors and subsequently enrolled at public 2-year and 4-year colleges. As described in the Methods section, all models included a host of academic and demographic measures, fixed effects for EL-designating school, and fixed effects for initial college and major. We employed the complete case method, excluding observations with a missing value for any variable. Consequently, the sample size for each regression corresponds to the number of students with non-missing values for all variables in the model. For more information on the number of students with non-missing data for each variable, see Appendix A1.
p < .01. **p < .001. ***p < .0001.
Author Note
The opinions expressed in this report are those of the authors and do not necessarily reflect the views of the granting agencies or any director, officer, or employee thereof.
Funding
The authors disclosed receipt of the following financial support for the research, authorship, and/or publication of this article: This research was supported by the Greater Texas Foundation, grant “English Learner Status and Postsecondary Outcomes: Exploring Patterns and Policy Levers to Close Gaps” (Project #7497). The authors were also supported by grant P2CHD042849, Population Research Center, awarded to the Population Research Center at The University of Texas at Austin by the Eunice Kennedy Shriver National Institute of Child Health and Human Development.
Declaration of Conflicting Interests
The authors declared no potential conflicts of interest with respect to the research, authorship, and/or publication of this article.