
Abstract
Teacher coaching has the potential to improve instructional quality and student learning. However, little research explores measures of coach effectiveness. The current study examines the properties, assumptions, correlations, and predictors of five measures of instructional coach quality in a large, district-wide coaching program. We consider three professional ratings of coaches, including assessments from school leaders, mentee teacher surveys, and coach self-assessments. We also construct measures of a coach’s value-added to their mentee teachers’ observation scores and those teachers’ students’ test scores. We find that all five measures have substantial limitations including limited construct coverage, bias, and imprecision. We also find few correlations among the five measures and few predictors of these measures. Implications for future research on coaching and coach effectiveness are discussed.
Introduction
Teacher coaching is a promising intervention for improving classroom instruction. While traditional professional development (PD) often has little to no effect on instruction or student outcomes (Garet et al., 2008; Hill et al., 2013; Yoon et al., 2007), coaching can improve instruction and student achievement (Kraft et al., 2018). Coaching is also popular. In 2020 to 2021, about half of all U.S. schools had instructional coaches (National Center for Education Statistics, 2021). However, there are concerns about the scalability of instructional coaching. Many of the studies driving positive meta-analytic results of coaching’s effectiveness were small efficacy trials with under 100 teachers and ideal conditions (Kraft et al., 2018). Larger programs have smaller estimated average effects, likely due to the challenge of recruiting and retaining high-quality coaches. Despite coach quality being key to understanding why some coaching programs fail while others succeed (Blazar & Kraft, 2015), it remains poorly defined and under-studied.
Careful consideration of coach quality is necessary both for understanding whether and how teacher coaching programs can be taken to scale effectively and for districts to support coach improvement. The current study is among the first to consider coach quality, exploring multiple measures of the construct, their validity, and their relationship with coach characteristics and each other. Using data from a district-wide teacher coaching program in a large urban district in the United States, we create multiple measures of coach quality, evaluating their validity, correlations with other measures, and predictors.
We address the following research questions:
What measures can be used to estimate coach effectiveness, and how valid are the scores they produce for identifying coaches that are more and less effective?
How do these measures correlate with each other?
What aspects of coach identity and their prior work as a teacher predict these measures?
Prior Research
Understanding Coaching
The goal of coaching is generally considered to be supporting instructional improvement through focused practice and study (Joyce & Showers, 1981; Showers & Joyce, 1996). There are many ways coaches can pursue this goal. Coaches are often asked to work with individual teachers and/or small groups, coach at the school-level, and complete administrative tasks (Bean et al., 2010; Mangin & Dunsmore, 2015). Coaching individual or small groups of teachers is most proximal to supporting their instructional improvement and first requires building relationships with mentees 1 (Galey, 2016; Heineke, 2013; L’Allier et al., 2010; Lowenhaupt et al., 2014). After building trust, coaches can engage in coaching cycles (preparation, observation, de-brief), co-planning, analyzing student data, and modeling instructional strategies to support mentee teachers (Denton & Hasbrouck, 2009; Gibbons & Cobb, 2017). School-wide coaching aims to increase collective instructional capacity and is more diffuse than individual or small group coaching. It can involve working with school leaders to improve coherence across programs and curricula, analyzing student data, leading whole-group PD, and facilitating principal instructional leadership (Neufeld & Roper, 2003). Finally, coaches are often asked to perform administrative tasks that are disconnected from their core duties including coordinating student assessments, substitute teaching, and paperwork (Bean et al., 2010; Deussen et al., 2007; Russell et al., 2020). Multiple coach tasks suggest the possibility of multiple dimensions of coach effectiveness. There may be coaches who excel at school-wide coaching but not individual coaching, for example. While coaching may include multiple tasks, it maintains a singular goal: improving instruction and student learning (Kraft et al., 2018).
Coach Effectiveness
While there is substantial research on the overall effects of coaching programs, there is little evidence on individual coach effectiveness and its measurement. Marsh et al. (2012) explored coach quality in Florida’s statewide reading coaching program, examining qualifications such as education, experience, and training. They also surveyed principals, teachers, and coaches regarding perceptions of coach effectiveness. The authors found associations between qualifications, perceptions of coach quality and influence, and schoolwide student test score growth. However, limitations include a lack of causal warrant and reliance on surveys about perceptions of quality as opposed to direct measures (Marsh et al., 2012).
In a small-scale RCT of a teacher coaching program, Blazar and Kraft (2015) disaggregated treatment effects of coaching on teacher instructional quality at the individual coach level. They found statistically significant differences between coaches in their estimated contribution to teacher effectiveness as measured by observation scores, principal surveys, and the Tripod student survey. However, generalizability is limited as the study included only five coaches. Blazar et al. (2023) estimated the effectiveness of coaches in a larger pre-service teacher program using a single measure, value-added to teacher observations. Blazar et al. (2023) document that coach quality varies widely in terms of coach value-added to observed instruction and show that issues of bias and imprecision were likely minimal in their context. However, the study used a single measure, and the authors could not take the additional step of exploring associations between the value-added measure and coach characteristics or behaviors. Additionally, the same or similar measures may perform differently in pre-service and in-service contexts. The nascent body of research on coach effectiveness is useful but limited in terms of guidance to researchers for understanding coaching program variability and guidance to practitioners for supporting coaches. As our coach effectiveness measures draw from the literature on measuring teaching effectiveness, we share insights from research on measuring teacher effectiveness below.
Teacher Effectiveness and Coaching
Most modern teacher evaluation systems use multiple measures, including classroom observations, measures of teacher professionalism, value-added, and student surveys. 2 Below, we describe evidence on teacher measures that we either used in creating coach effectiveness measures or have clear analogs for coaches.
Classroom Observations
Classroom observation scores are important for understanding coach effectiveness. As direct measures of instruction, observation results are arguably the most relevant coaching outcome. Classroom observations are a near-universal component of teacher evaluation (Cohen & Goldhaber, 2016). Widely used observational instruments such as the Danielson Framework for Teaching (Danielson, 2013) or the Classroom Assessment Scoring System (CLASS, Pianta et al., 2008) highlight different aspects of teaching, but most involve observers using a rubric to give teachers categorical scores on multiple aspects of instruction.
Observations can provide detailed information on instructional strengths and weaknesses (Cohen & Goldhaber, 2016; Patrick & Mantzicopoulos, 2016). Studies indicates that teacher observations can be systematically biased based on classroom composition or teacher demographics (Campbell & Ronfeldt, 2018; Gill et al., 2016; Grissom & Bartanen, 2022), though some work finds that systematic sorting of students to teachers produces observation scores very similar to random assignment (Bacher-Hicks et al., 2019).
Teacher observations can lack reliability due to differences across raters, lessons, and time of year (Briggs & Alzen, 2019). Rater bias is of particular concern, as it is unique to observations. Systematic differences between raters account for substantial variation in observation scores, in part because observing instruction is a cognitively demanding task that is difficult to master (Bell et al., 2015; Casabianca et al., 2015). While observations have reliability and bias limitations, their usefulness in providing practical feedback and the fact that all teachers can be observed have made them near-universal in teacher evaluation (Cohen & Goldhaber, 2016).
Teacher Professionalism
Evaluation systems that measure teacher professionalism aim to rate teacher performance on out-of-classroom responsibilities including data use, reflection, collaboration, and connection with students’ families. Because teacher coaching is connected to teacher collaboration, especially when coaches are also teachers, these professionalism measures could be used as part of a coach effectiveness measurement system. The properties of teacher professionalism measures have not been thoroughly studied, though professionalism ratings tend to be highly correlated with other observation domains when considering observation rubrics that include professionalism (Chaplin et al., 2014; Grissom & Bartanen, 2022).
Teacher Value-Added to Student Test Scores
Value-added measures (VAMs) aim to causally attribute a portion of student test score growth to their teacher by controlling for students’ prior achievement, demographics, and classroom composition. Using statistical modeling to causally attribute growth to an instructor is also relevant to coaching. Though we found no prior work that used student test scores to estimate coach effectiveness, teacher VAMs have been well-studied. There are many concerns about bias resulting from systematic sorting of students to teachers (e.g., Kalogrides et al., 2013; Rothstein, 2009). However, there is some evidence that controlling for key covariates can sufficiently account for sorting (Bacher-Hicks et al., 2019; Kane et al., 2013). Students with high value-added teachers have more positive long-term outcomes, including higher lifetime earnings and lower rates of teen pregnancy (Chetty et al., 2014). Although VAMs provide important signal about teaching quality, concerns remain about both imprecision and bias.
Surveys
Student surveys provide actionable, specific feedback to teachers at a lower cost than observations (Balch, 2016). Though students are not trained observers, they are the primary recipients of teaching and their experiences can shed light on teacher quality (Wallace et al., 2016). Following this logic, the current study uses teacher surveys about their coaches, as teachers are the primary recipients of coaching.
Relationships Among Multiple Measures of Teaching Effectiveness
Work that considers multiple measures of teaching effectiveness regularly finds small to moderate correlations among observations (including professionalism), VAMs, and student surveys. Correlations between VAMs and teacher observations range between 0.06 and 0.29 for ELA (Chaplin et al., 2014; Grossman et al., 2014; Kane & Staiger, 2012) and between 0.09 and 0.45 for math (Bell et al., 2012; Chaplin et al., 2014; Hill et al., 2011; Kane & Staiger, 2012). Chaplin et al. (2014) estimated correlations with student surveys, which correlated with observations at about 0.30 and with VAMs ranging between 0.04 and 0.21, depending on the test. These low to moderate correlations have lent themselves to a range of interpretations. These correlations have been interpreted variously as evidence of an underlying construct, that multiple measures capture different aspects of teacher effectiveness, or of flaws in different measures due to imperfect correlation with other, more preferable measures. Multiple measures intend to capture a wide range of information about teaching and improve the accuracy and stability of teacher effectiveness ratings (Grossman et al., 2014; Steele et al., 2010). However, combining multiple measures does not guarantee that the final measure is necessarily better, only more complex (Martínez et al., 2016). Additionally, we must consider the experiences of actual practitioners, who are trying to use multiple measures to improve their practice and may receive contradictory signals across measures or across time (Headden, 2011; Strunk et al., 2014).
Conceptual Framework for Evaluating Measures
The current study, to our knowledge, is the most thorough exploration of means for measuring coach effectiveness to date. We consider the following five measures:
Principal or assistant principal (AP) ratings of coach professionalism (similar to ratings of teacher professionalism),
Coach self-assessments of professionalism,
Mentee teacher surveys about their coach (similar to student surveys about teachers),
Coach value-added to teacher observation scores (used in Blazar et al., 2023), and
Coach value-added to mentee teachers’ student test scores (similar to traditional teacher VAMs, estimated instead for a teacher’s coach).
For RQ1 we consider each measure’s validity, building on prior research on teacher effectiveness. Researchers will eventually want to establish the validity of certain measures for providing coaches with formative or summative feedback or to understand the mixed effects of coaching programs. With the aim of contributing to these eventual goals, we examine a validity claim that will be essential for all uses of these measures moving forward: A measure is valid if coaches rated higher on that measure are indeed more effective.
We evaluate each measure’s validity using three key characteristics: construct coverage, bias, and precision. To have high validity, first, a measure must have strong construct coverage, focusing on coach impact on teacher instructional improvement. Second, a measure must have minimal bias, such that its variance primarily captures variance in underlying coach effectiveness. Finally, a measure must be precise enough to establish that a substantial portion of its variation represents true variation in scores rather than error.
Only some of these criteria can be analyzed empirically. To explore construct coverage, we consider what the measure aims to represent and whether it is likely to do so effectively. We consider potential sources of bias for each measure and the extent to which that bias is addressed with statistical controls. We also explore how otherwise-similar coaches who differ in terms of gender and ethnoracial identity are rated. We are able to estimate precision empirically for some measures. We calculate Cronbach’s alpha for survey items and Empirical Bayes estimates of random effects from multi-level modeling for which we can calculate standard errors. However, it is less clear how to evaluate precision for measures that are single ratings on a categorical scale (i.e., principal and coach ratings). We explore cross-year consistency for these measures.
Study Context: Key District Programs
Instructor Coaching Program (ICP): The Coaching Program
The Instructor Coaching Program (ICP) aimed to move effective teachers into part-time instructional coaching positions, so they could support other teachers while remaining in the classroom. Coaches in ICP receive both monetary compensation and release time. The program had a staggered, voluntary rollout across 5 years, and our study takes place over a period of 7 years which bridges the height of the COVID-19 pandemic. By the end of the rollout, all of the approximately 150 schools in the district were implementing ICP. On average, each participating school had three to four coaches and about twenty mentee teachers. Across the study period, the program has included about 1,000 distinct coaches supporting 6,000 distinct teachers.
Coaches are released from teaching part time to coach their assigned mentee teachers, lead professional learning communities, and contribute to teacher evaluations. Teachers must have been rated a three or four (out of four) in the district’s multi-measure teacher evaluation system (MMTES), for two prior years to be considered for a coach role. 3 Typically, 60% to 70% of teachers are eligible to apply to become coaches. Principals determine which applicants, including teachers seeking to transfer schools, will be coaches.
The district’s teacher coaching program is unusually large compared with almost all coaching programs previously studied (Kraft et al., 2018). ICP coaching is not targeted to a specific curriculum, program, grade, or subject but is intended to function as ongoing professional development. All coaches are current district teachers. Mentees who are assigned to these coaches likely have varying levels of interest, skills, and compatibility with their coach, something we are unable to explore as we do not have data on the matching process. ICP’s full integration in district schools, combined with extensive district administrative data, provides a unique opportunity for exploring means to measure coach effectiveness.
Our descriptive analysis found that implementation of ICP varied widely across schools. While we do not speak to the effectiveness of the ICP program overall here, the large scale of the program and heterogeneity across schools in terms of implementation provide a useful context for exploring multiple measures of coach effectiveness. These data allow us to investigate coach effectiveness as an explanatory factor in understanding scaling challenges in coaching (Blazar & Kraft, 2015). Estimating coach effectiveness using data that represents a fully scaled coaching program is informative for districts considering adopting such programs. Additionally, coach effectiveness work can ultimately be used to help districts provide feedback to coaches and improve their coaching programs, so the ICP context (in which the program has evolved, and the district strives for continuous improvement) can be beneficial for building a healthy evidence base for practitioners.
Multi-Measure Teacher Evaluation System (MMTES)
Under the district’s MMTES, teachers receive a continuous score out of 100 points which translates to one of four categorical ratings each year. These result from a combination of up to six MMTES sub-measures: student surveys, classroom observations, professionalism, schoolwide performance growth, Student Learning Objectives, and a teachers’ students’ test score growth.
Coaches often complete parts of their mentee teachers’ MMTES evaluations. Coaches may provide both professionalism ratings and/or classroom observation scores, which can be worth as much as half of a teacher’s total evaluation score. About 60% of teachers with coaches are rated on professionalism by their coach, and about 80% of their observations are performed by coaches (the remainder of ratings are performed by principals and assistant principals).
Coaches are also evaluated by the MMTES because all coaches are also teachers. Coach MMTES evaluations differ in a single way from those of non-coach teachers: On the professionalism rubric, coaches have an additional indicator intended to evaluate their coaching and leadership.
Data
Data for the current study are part of a multilevel, longitudinal data system that includes data on courses, students, teachers, coaches, and schools for the approximately 150 schools in the district. Student data includes demographics, test scores, and course-taking, as well as links to their ELA and math teachers. Teacher data includes employment history, teacher evaluations and observations, and teacher survey responses. ICP-specific data is detailed further below.
Coach Data and Coach-Teacher Links
Data on ICP identifies coaches and links them to their teacher mentees. To address potential false positives that might not reflect a true coaching relationship, additional restrictions are used for the coach-teacher analytic sample: Coaches must observe linked mentee teachers at least once, and coaches and teachers must be in the same school location. Additionally, each teacher can have only one coach. Originally, 1.9% of teacher-year observations with coaches were linked to multiple coaches. Primary coaches were identified using the following criteria in priority order: 1) had conducted the most observations of the mentee teacher, 2) was in a more senior teacher-leader position, or 3) had a smaller caseload. About 200 coach-year observations (8%) were not connected to any teachers. While it is likely that these coaches were supporting teachers, the lack of any linking data resulted in their being dropped from the analytic sample.
Analytic Samples
In addition to including only coaches connected to teachers, coach roles changed during the height of the COVID-19 pandemic. As a result, data from 2019/2020 and 2020/2021 are excluded. 4 Samples vary across measures, however, as each measure has different data requirements. Table 1 shows descriptive statistics for all coaches and teachers contributing to each measure of coach effectiveness. Some patterns are relatively consistent across samples. For example, coaches and teachers are predominately female and White. Coaches tend to be more experienced, more likely to have a master’s degree, and receive higher MMTES scores (about 0.6 standard deviations above the mean).
Analytic Sample Descriptive Statistics by Measure of Coach Effectiveness.
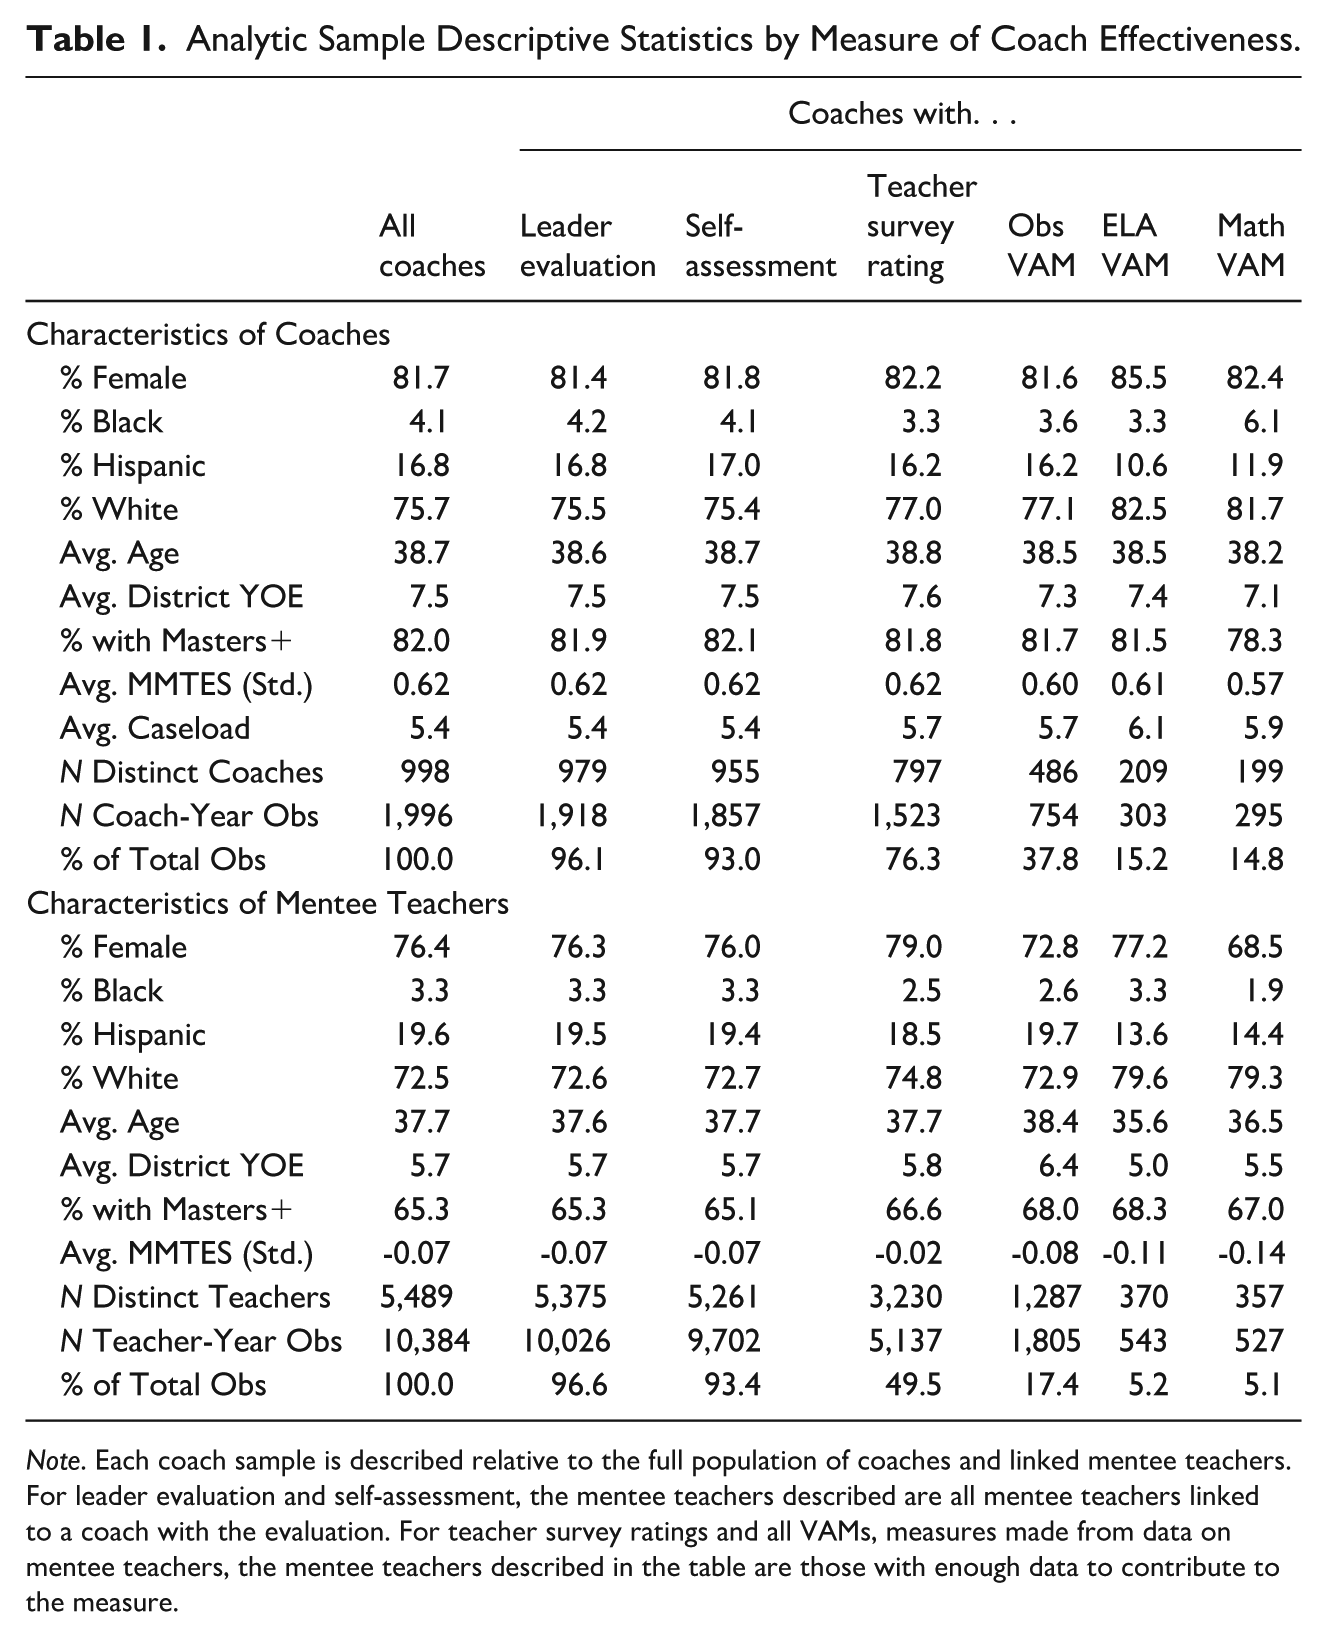
Note. Each coach sample is described relative to the full population of coaches and linked mentee teachers. For leader evaluation and self-assessment, the mentee teachers described are all mentee teachers linked to a coach with the evaluation. For teacher survey ratings and all VAMs, measures made from data on mentee teachers, the mentee teachers described in the table are those with enough data to contribute to the measure.
Measures
The five coach effectiveness measures we consider fall into two broad categories: ratings and VAMs. Ratings are provided by a school leader (almost always the principal or assistant principal), the coach themselves, and surveys of their mentee teachers. Coaches can see these ratings at the end of the year. We also estimate VAMs for a coach’s value-added to mentee teachers’ classroom observation scores and mentee teachers’ students’ test scores which remain unknown to coaches.
Professionalism Ratings (From School Leader and Self-Assessment)
For teachers who are also coaches, school leaders respond to an additional “professionalism” item in their evaluations about how well the coach supports colleague improvement and serves their school and district. Coaches also rate themselves on the item. The item is rated on a 4-point scale, and virtually all coaches are rated by leaders and themselves (97% and 93%, respectively). Both leader and coach ratings on this item are almost always 3 or 4, as shown in Figure 1, leading to limited variability in these measures.
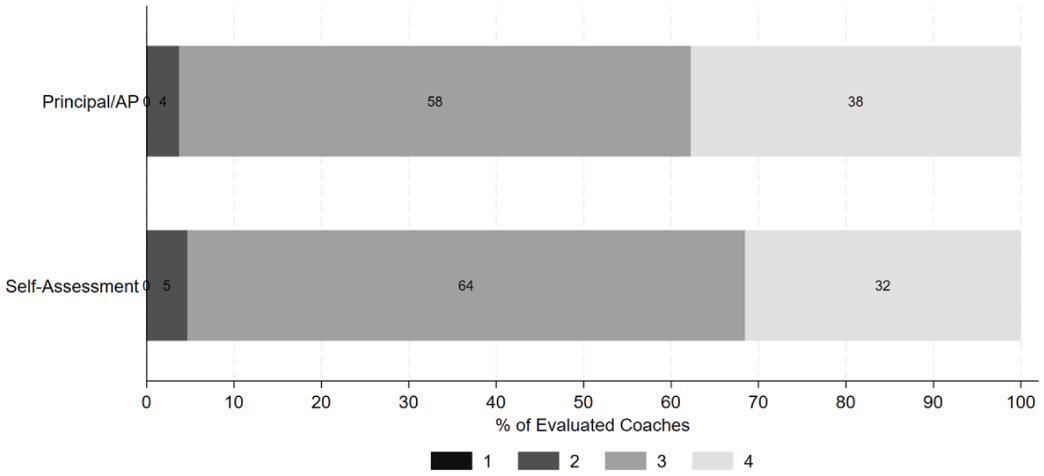
Professionalism categorical ratings distribution by principal/AP ratings & self-assessment.
Mentee Teacher Surveys
We use surveys administered by the district in early spring where teachers evaluate their leaders, including their coaches. Response rates are about 70% each year. As small changes were made to the survey across years, we use only the 18 items that remained the same over time. All 18 items are positive statements about coaches with responses recorded on a 5-point Likert scale ranging from “strongly disagree” to “strongly agree.” We kept responses where teachers answered at least half of the questions. 5 Table 2 reports the items, percentage of teachers who “agreed” or “strongly agreed,” as well as means and standard deviations. In general, teacher responses are very positive about their coaches: Agreement for each item ranges from 78% to 96% across all teacher-year observations.
Responses to teacher survey items about coaches where teachers “Agree” or “Strongly Agree.”
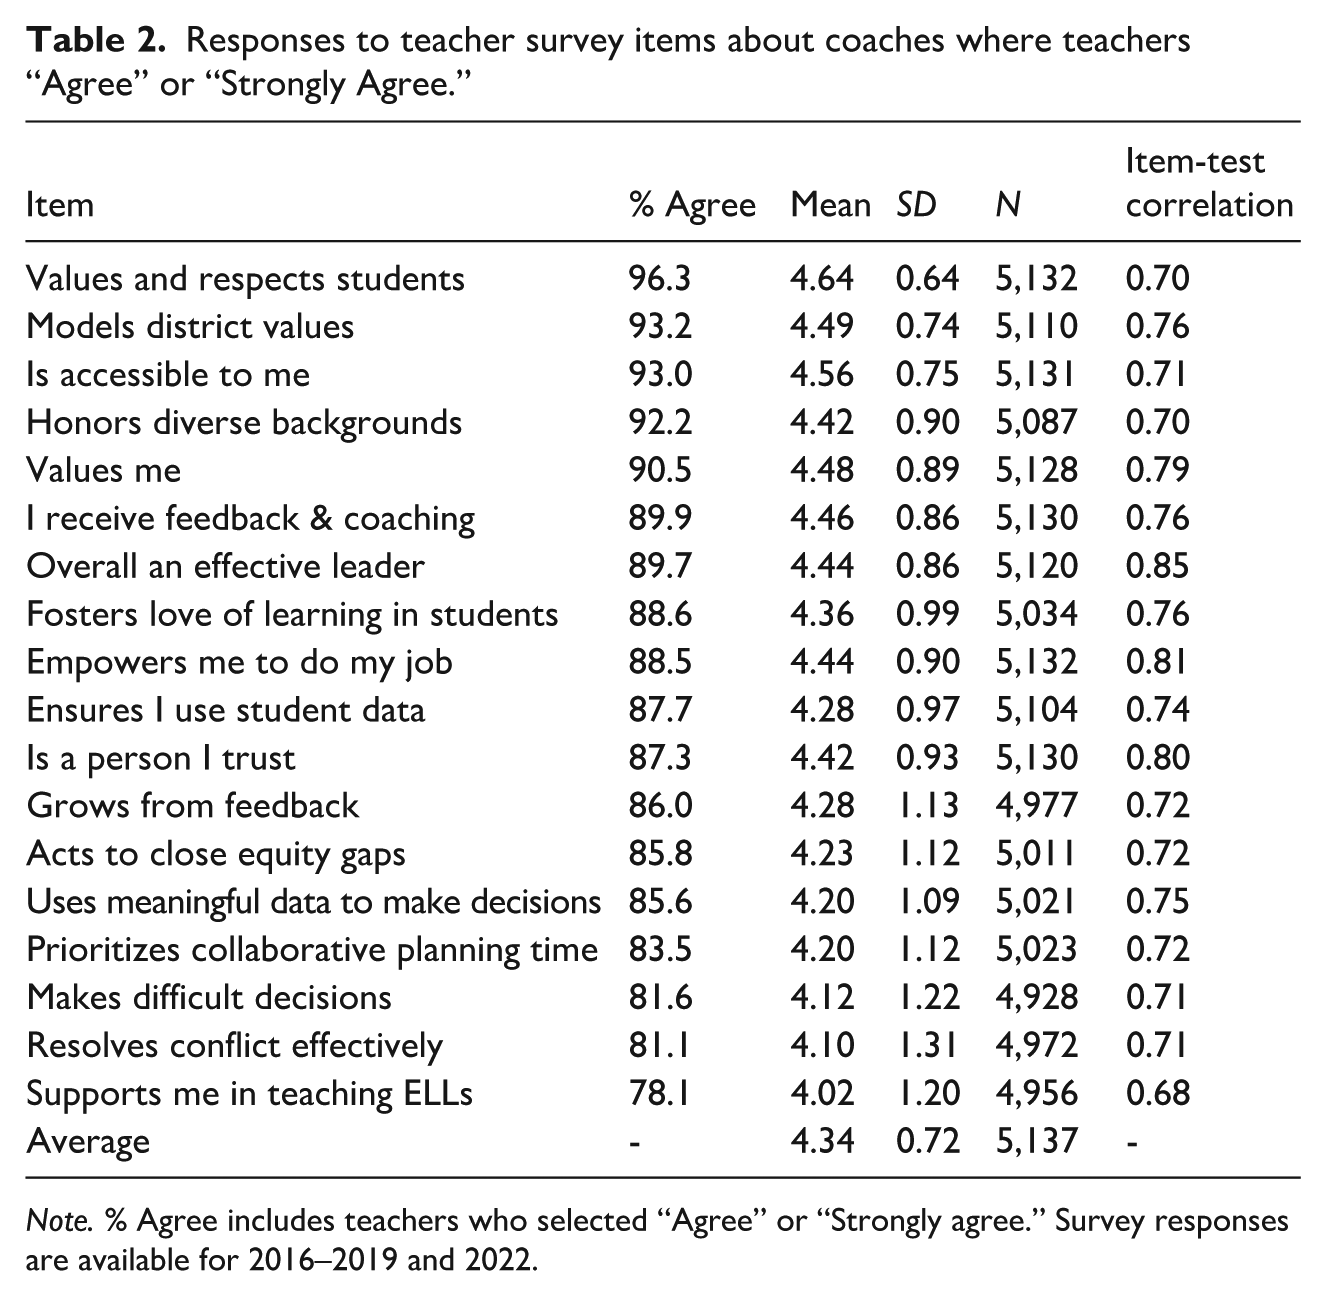
Note. % Agree includes teachers who selected “Agree” or “Strongly agree.” Survey responses are available for 2016–2019 and 2022.
To summarize the 18 items, we performed exploratory factor analysis using iterated principal axis factoring. Both the scree plot and parallel analysis showed a single factor for all survey responses and for each year of responses separately. We produced factor scores from all responses, factor scores from each year’s responses separately, and simple averages of all responses. All scores were correlated at r > .99, so we use the simple average of the 18 items to calculate a mentee’s teacher’s average sentiment about their coach. We then take the average score across all a coach’s mentees to create a measure for each coach. The distribution of this measure (and the following value-added measures) is shown in Figure 2.
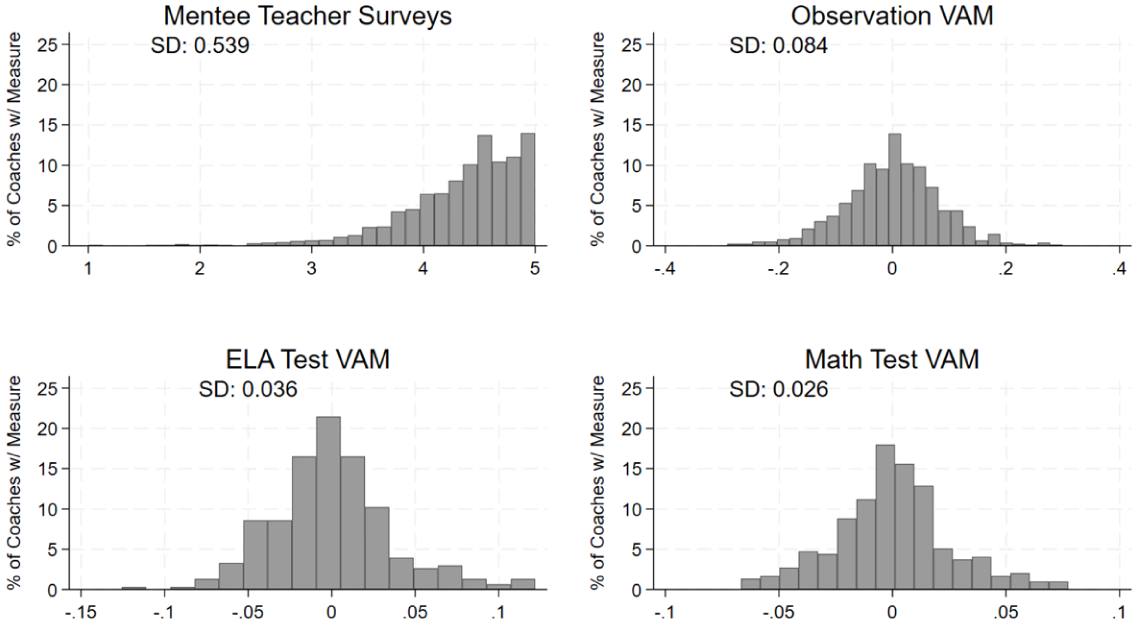
Distribution of ratings for continuous measures (Teacher Surveys, Observation VAM, and Test Score VAM).
Value-Added Measures
Two separate value-added measures were created to estimate an individual coach’s contribution to 1) the growth of their mentee teachers’ observation scores and 2) the growth of their mentee teachers’ students’ test scores. Value-added models control for key teacher and school characteristics (and student characteristics, when appropriate). Detailed information about the models is provided in the online supplementary materials.
Methods
For RQ 1, determining validity, we report descriptive statistics and evaluate each measure according to the three criteria described above. To evaluate if measures differ systematically by coach demographics, we regress each coach effectiveness measure on three categories of predictors: coach demographics (gender, age, and race/ethnicity), coach characteristics (caseload, average number coach observations per mentee, and years of coaching experience), and pre-coaching characteristics (degree status, teacher evaluation rating, and years of experience as a teacher). Coach characteristics and pre-coaching characteristics are discussed in RQ 3. Results for demographic predictors explore whether there are systematic patterns by race, gender, and age that could indicate bias. Finally, we estimate precision for each measure differently: We calculate Cronbach’s alpha for survey items and cross-year correlations for professionalism ratings. For VAMs, because each coach’s value-added is an Empirical Bayes estimate of random effects, we can calculate a standard error related to the precision of the individual estimate and its shrinkage to the mean. The measure’s standard error is the mean of each coach’s standard error, which we can compare to the range of estimates to explore the relative sizes of error variance and true variance.
For RQ 2 (cross-measure correlations), we correlate all measures. Due to different data requirements for each measure, we use pairwise correlations to maximize sample size. As both categorical and continuous measures are included, we calculate polychoric (two categorical), polyserial (one categorical, one continuous), and Pearson (two continuous) correlations.
For RQ 3, predicting the measures, we use the same regressions used to investigate bias in RQ 1. Our preferred model, shown here, includes all categories of predictors and school fixed effects.
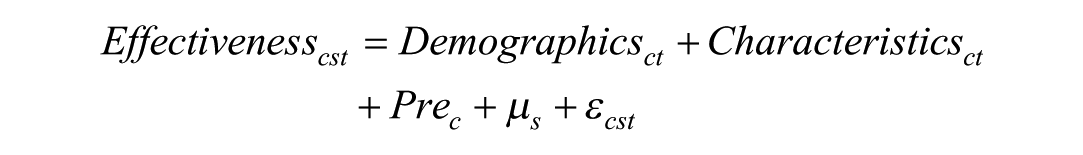
This model predicts a given measure of coach effectiveness for coach c in school s and year t using the three categories of predictors described above, Demographics, Characteristics, and Pre-Coaching Characteristics (Pre).
Results
RQ 1: Validity of Coach Effectiveness Measures
Leader Ratings of Coach Professionalism
Construct Coverage
This item has broad construct coverage. It directly addresses the coach’s core work of improving instruction among colleagues but also includes a general statement about service that could include completion of administrative tasks or other work within the school. The item includes multiple topics, making it difficult to disentangle which aspect(s) of a coach’s work an evaluator is rating. The district’s MMTES guidance recommends that principals and APs look for coaches to support teachers in attaining goals, use data inquiry cycles with their mentee teachers, collaborate with school leadership for change, model school and district initiatives, and promote equity. Principals and APs may discuss some of these topics with teachers or coaches, but they are most likely to directly observe how well coaches collaborate with school leadership for change and promote school and district initiatives—much of the other work typically occurs outside of the view of school leadership. Thus, principals and APs can directly observe school-wide coaching and administrative tasks but are much less likely to have first-hand information on individual or small group coaching. Despite the item’s broad wording, the limitations of principals and APs as evaluators means that this item’s construct coverage probably lacks information on the central work of one-on-one or small group coaching.
Bias
Leader ratings may reflect interpersonal bias from the school leader, because a principal or AP’s relationship with a coach may strongly influence the professionalism rating. While there is training and guidance for evaluators, there are no other means for deterring this bias. Table 3 shows that male coaches, older coaches, and coaches of color may be rated lower than similar female, younger, and White coaches (though differences by race/ethnicity are not statistically significant in our preferred model).
Coefficients and standard errors from regression models using coach characteristics to predict measures of coach effectiveness.
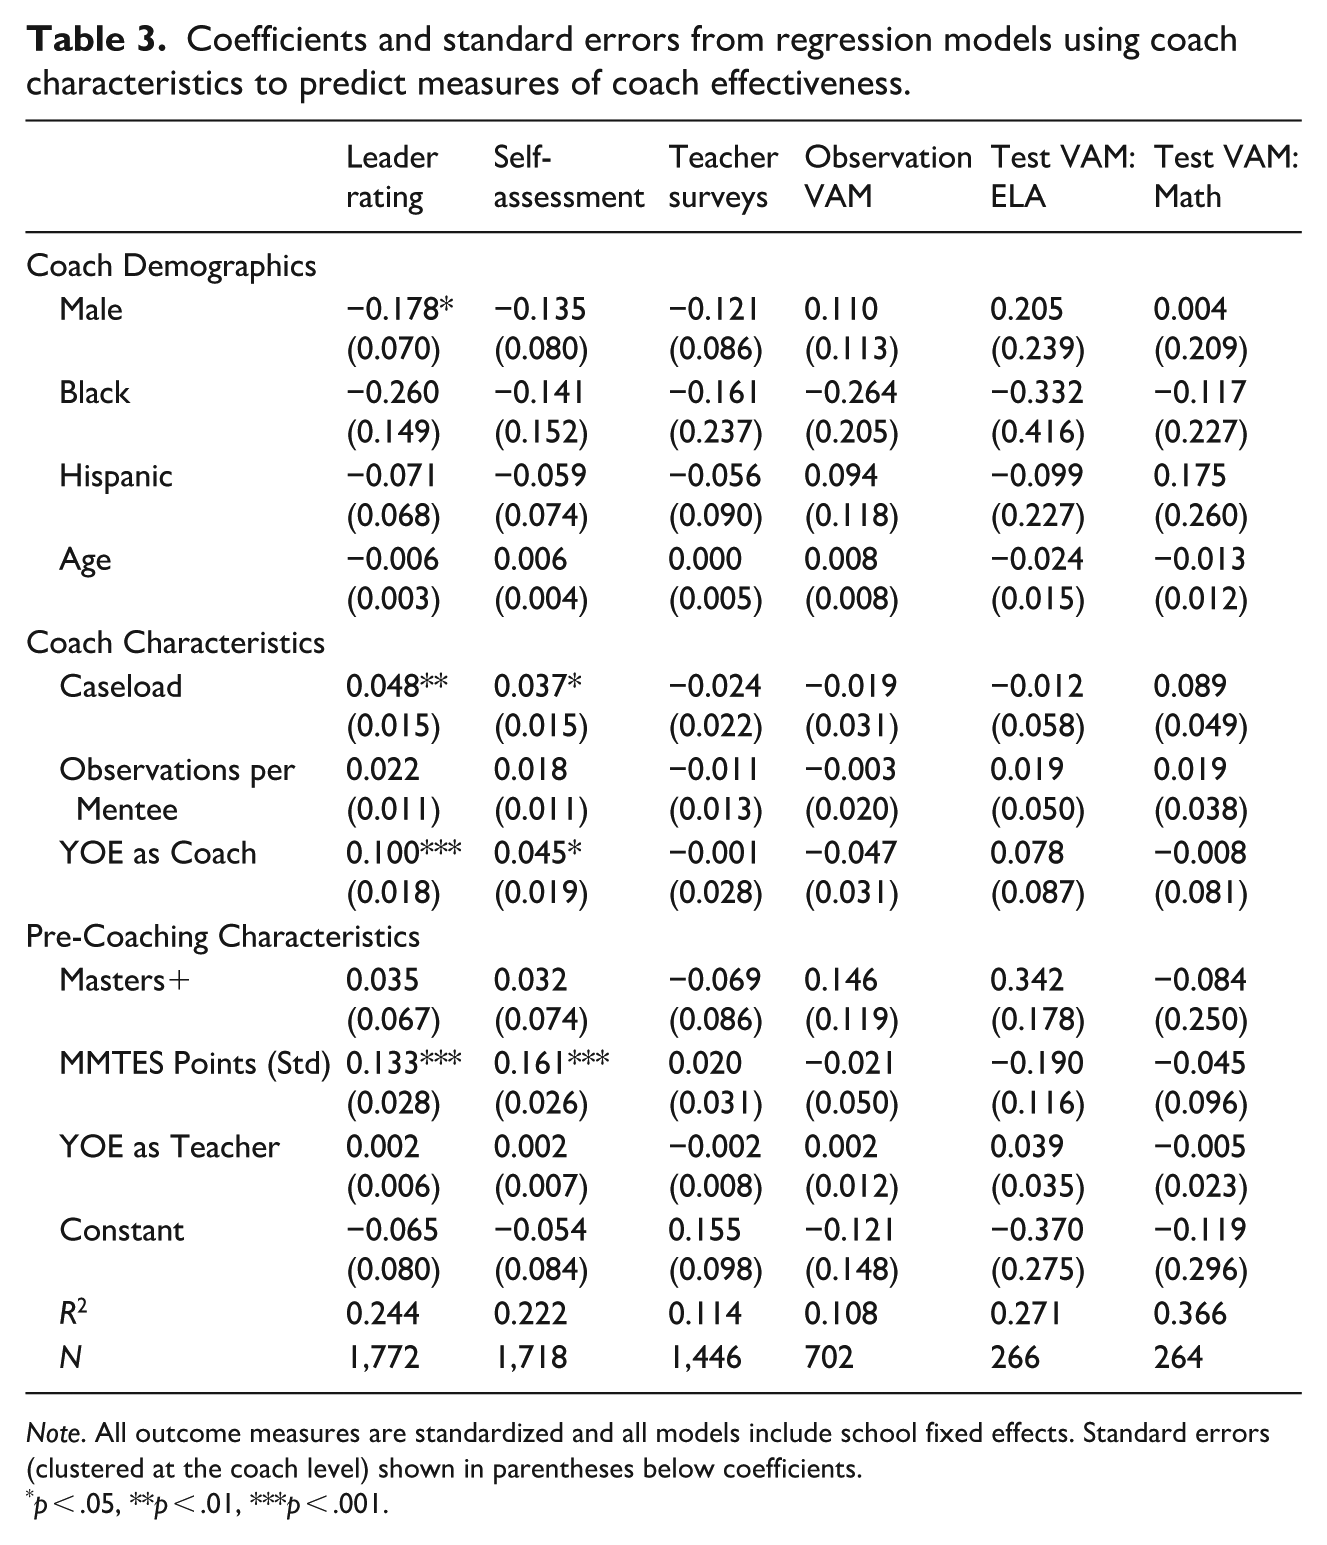
Note. All outcome measures are standardized and all models include school fixed effects. Standard errors (clustered at the coach level) shown in parentheses below coefficients.
p < .05, **p < .01, ***p < .001.
Precision
As this measure is a single item reported once a year, we cannot estimate the precision of each rating, but we can look across years. Coaches who are rated multiple years receive the same rating from their principal or AP as the previous year about 66% of the time, resulting in a cross-year correlation of 0.50. However, this variation could be due either to imprecision or to the development of a coach’s skills. Correlations for the same coach two years apart are smaller than for the same coach one year apart, indicating that there could be coach development over time. Therefore, we are unable to draw clear conclusions regarding measure precision.
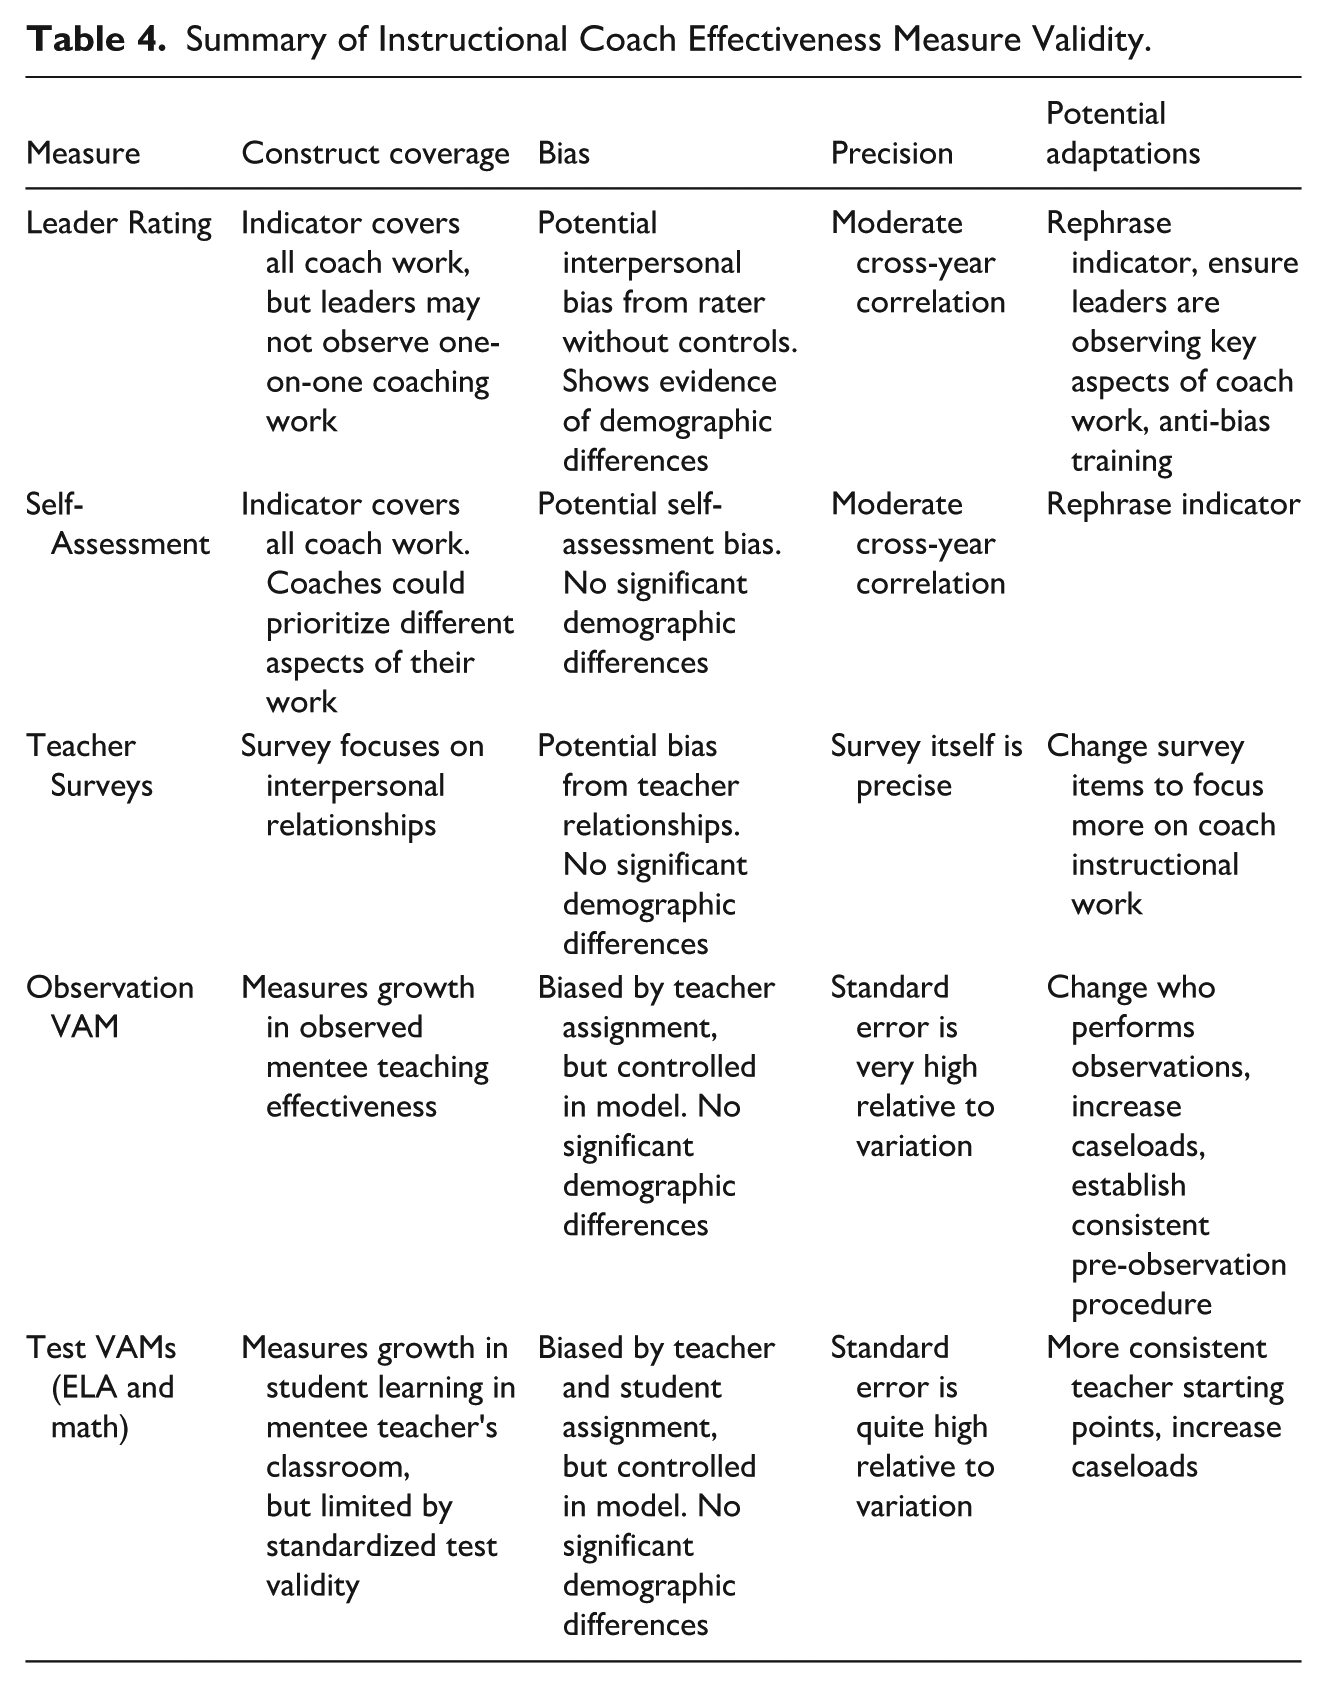
As is summarized in Table 4, this item’s limited construct coverage, potential bias, and minimal information on precision makes it difficult to justify this measure as a valid measure of coach effectiveness. We consider these ratings to be a coarse measure of school leader views of coach effectiveness at school-wide coaching and administrative tasks.
Summary of Instructional Coach Effectiveness Measure Validity.
Coach Self-Rating of Professionalism
Construct Coverage
The indicator wording, identical to that used in the school leader rating, covers virtually any coaching task. However, unlike school leaders, coaches are engaged in and observe all aspects of their own work. In responding to the item, coaches may be assessing their overall effectiveness across all tasks, or they may be assessing aspects of their work they consider to be most important. Thus, construct coverage for this item remains unclear, given its broad wording and lack of knowledge on interpretation and response.
Bias
We do not detect any statistically significant demographic predictors in our preferred model, as shown in Table 3. However, bias concerns regarding this item are salient as coaches are likely biased observers of themselves.
Precision
This measure shares the precision limitations as the leader rating described above. Coaches who rate themselves across consecutive years give themselves the same score about 70% of the time, resulting in a cross-year correlation of 0.61, while correlations across multiple years show lower correlations. This indicates that cross-year changes may be due to coach development rather than imprecision.
As with the principal/AP rating, little evidence supports the validity of self-assessments, primarily due to bias in self-assessment and unknown precision. However, this item may be informative as a measure of a coach’s self-concept about their coaching.
Mentee Teacher Surveys
Construct Coverage
The range of survey items (Table 2) may raise doubts about how well the survey covers the construct of coach effectiveness. Some items seem to relate closely to core coaching tasks such as “I receive feedback and coaching” or the coach “ensures I use student data.” Other items relate more to teacher emotional support (e.g., “is a person I trust”) or to being a good member of the school community (e.g., “values and respects students” and “models district values”). As shown in Table 2, the survey focuses primarily on the quality of the relationship between a teacher and their coach, likely measuring teacher perceptions of a coach’s work in building and maintaining that relationship. This work is an important precursor to improving the instruction of mentee teachers (Finkelstein, 2019; Jacobs et al., 2018; Schulze, 2016) but is not sufficient in isolation. Thus, the survey provides incomplete construct coverage regarding coach effectiveness.
Bias
Teacher survey responses may be biased due to unconscious bias from teachers towards coaches of certain groups or due to a teacher’s beliefs about coaching more generally. However, relationship-building with teachers is often considered part of a coach’s work, so responses driven by teacher perceptions of interpersonal relationships or teacher buy-in to coaching are directly relevant to coach effectiveness. Additionally, we find no statistically significant demographic predictors of the teacher survey measure in Table 3, indicating that teachers may not have strong racialized or gendered conceptions of coach effectiveness.
Precision
The teacher survey has a Cronbach’s alpha of 0.97, which typically indicates that random measurement error is low. However, this does not guarantee that the aggregation of survey responses to the coach level is equally precise.
Overall, as summarized in Table 4, the mentee teacher survey of coach effectiveness seems to offer a reliable source of information about at least one aspect of coach effectiveness: emotional support.
Coach Value-Added to Mentee Teacher Observation Scores
Construct Coverage
Coach instructional VAMs aim to measure the aspect of a teacher’s instructional improvement that is attributable to coaches. As such, the main assumption needed for this measure to have valid construct coverage is that the teacher observations capture year-to-year change in instructional effectiveness. District observational rubrics are largely based on the CLASS and the Danielson framework. These well-studied observation rubrics are correlated with other measures of teacher effectiveness like student surveys and VAMs with correlations ranging from .06 to 0.30 (Chaplin et al., 2014; Grossman et al., 2014; Kane & Staiger, 2012). However, limitations include rater bias and measurement error that limit their ability to measure instructional growth (Briggs & Alzen, 2019) and potential lack of variation across the entire rating distribution (Kraft & Gilmour, 2017). While classroom observations are considered the gold standard for understanding instruction (Rowan et al., 2009), optimizing their use for evaluation and other purposes is an area of continued study (Cohen & Goldhaber, 2016), which has implications for the construct coverage of this measure.
Bias
There are also potentially concerning sources of bias which may limit the validity of this measure, though VAMs are designed to address such bias. First, we might be concerned about bias due to teacher observations being conducted by coaches. We address this bias by including a term that accounts for the “individual observer effect,” or any single observer’s tendency to systematically score teachers higher or lower. This term does not account for systematic differences in scores that coaches give to their mentee teachers compared with ratings from their non-mentee observations. In the current study, coaches rate their mentees approximately 0.20 standard deviation units higher than teachers who are not their mentees. The fact that coaches rate their mentees higher and that coaches are likely to perform end-of-year observations on their mentees bias this coach effectiveness measure upwards.
Additionally, coaches assigned to teachers with varied potential to improve could appear differentially effective, such that coaches with a caseload of eager-to-grow new teachers could appear more effective than coaches working with veteran teachers whose effectiveness is more established (Atteberry et al., 2015). For this model to produce unbiased estimates, one must assume that teachers are as-good-as-randomly assigned to coaches, conditional on covariates. In ICP, coach assignment relies on input from school leaders, coaches, and teachers. Coaches often work with teachers in their own specialization (teaching the same subject or grade), though not always. The complex micropolitics of schools might create bias in value-added models relying on the “as good as random” assumption for assignment of teachers to coaches, just as it could for assignment of students to teachers (Paufler & Amrein-Beardsley, 2014). Unlike teacher VAMs based on student test scores, the size of the bias in observational VAMs has not been examined previously. We attempt to minimize these potential confounders by controlling for teacher covariates including race/ethnicity, gender, years of experience, degree status, and primary subject. We also control for school-level correlates including school size, poverty level, teacher retention rate, and average MMTES score. Additionally, we see no statistically significant demographic predictors of VAMs in Table 3. However, we cannot rule out systematic bias from non-random teacher assignment due to unobserved characteristics of teachers and schools associated with growth.
Precision
The standard error of this measure, calculated by averaging the standard errors of individual Bayesian estimates, is 0.20. The total range of the measure (coaches receive scores ranging from −0.3 to 0.3, further detail is shown in the online appendix) encompasses three standard errors, indicating that the measure is likely to distinguish only the best and worst coaches from the majority towards the middle of the distribution. This imprecision has many possible causes, including the small number of teachers contributing to each coach’s estimate, more variation in teacher growth at the teacher level than the coach level, and the possibility that individual coaches vary widely in their effectiveness by mentee teacher.
This measure has strong construct coverage, and sources of bias are addressed by the model. However, its limited precision makes it difficult for this measure to estimate a coach’s effectiveness precisely, given the large amount of noise.
Coach Value-Added to Mentee Teachers’ Student Test Scores
This measure has the advantage of connecting coaches’ work with student outcomes, which is appealing since the goal of improving instruction is to help students. This measure has the most restrictive data requirements, including only about 15% of coaches. To contribute to coach test-score VAMs, students must have taken exams at the end of both the current and prior school year, and their teacher must have previously taught tested grades and subjects.
Construct Coverage
This measure has strong potential construct coverage because it focuses on what many people consider to be the ultimate goal of instructional coaching: improving learning among mentee teachers’ students. However, state standardized test scores represent a limited subset of the body of knowledge that we hope improved instruction will bolster among students.
Bias
While bias is a concern, it is likely minimized in our preferred models. To believe that the measure provides estimates of a coach’s impact on their mentee teachers’ students’ learning, we must assume that students are as-good-as-randomly assigned to coaches (through random assignment of students to teachers and teachers to coaches), after controlling for covariates. For concerns about student assignment to teachers, we direct readers to the substantial literature on teacher VAMs (Koedel et al., 2015), which typically finds that standard sets of controls such as those included in our preferred model are sufficient to account for student assignment to teachers. For teacher assignment to coaches, we use covariates (most importantly, teacher years of experience, previous VAM, and the interactions between them) to account for a teacher’s quality prior to the given year of coaching and their potential for growth. School level covariates can account for a school environment’s impact on student learning, and the teacher random effect will address the effect of each individual teacher, such that we can isolate the impact of each coach. Further details on models are provided in the online appendix. We do not find evidence of bias by coach gender, race, or age in Table 3.
Precision
The standard errors are 0.049 for ELA and 0.043 in math. While this is still a large error relative to the distribution of VAMs, it does compare to range of scores more favorably than did the observational VAMs. The range of test score VAMs (0.25 for both math and ELA) indicates that we could reliably distinguish about five levels of coach effectiveness. This suggests that there is some signal in this measure along with a concerning amount of noise.
As with the observation VAM, student test score VAM has appealing construct coverage and addresses sources of bias. However, low precision results in a measure of coach effectiveness where noise may bury the signal. We conduct further analyses with the caveat that this measure’s imprecision makes some of the null findings that follow difficult to interpret.
RQ 2: Associations Between Measures
Table 5 shows pairwise correlations among all measures. The highest correlation is between principal/AP professionalism rating and self-assessment of professionalism (0.75), indicating high levels of agreement between school leaders and coaches regarding coach effectiveness. Professionalism ratings are also statistically significantly, positively correlated with mean survey ratings from the coach’s mentee teachers at 0.19 (principal/AP) as well as with coach self-ratings (0.10).
Correlations Among Coach Effectiveness Measures.
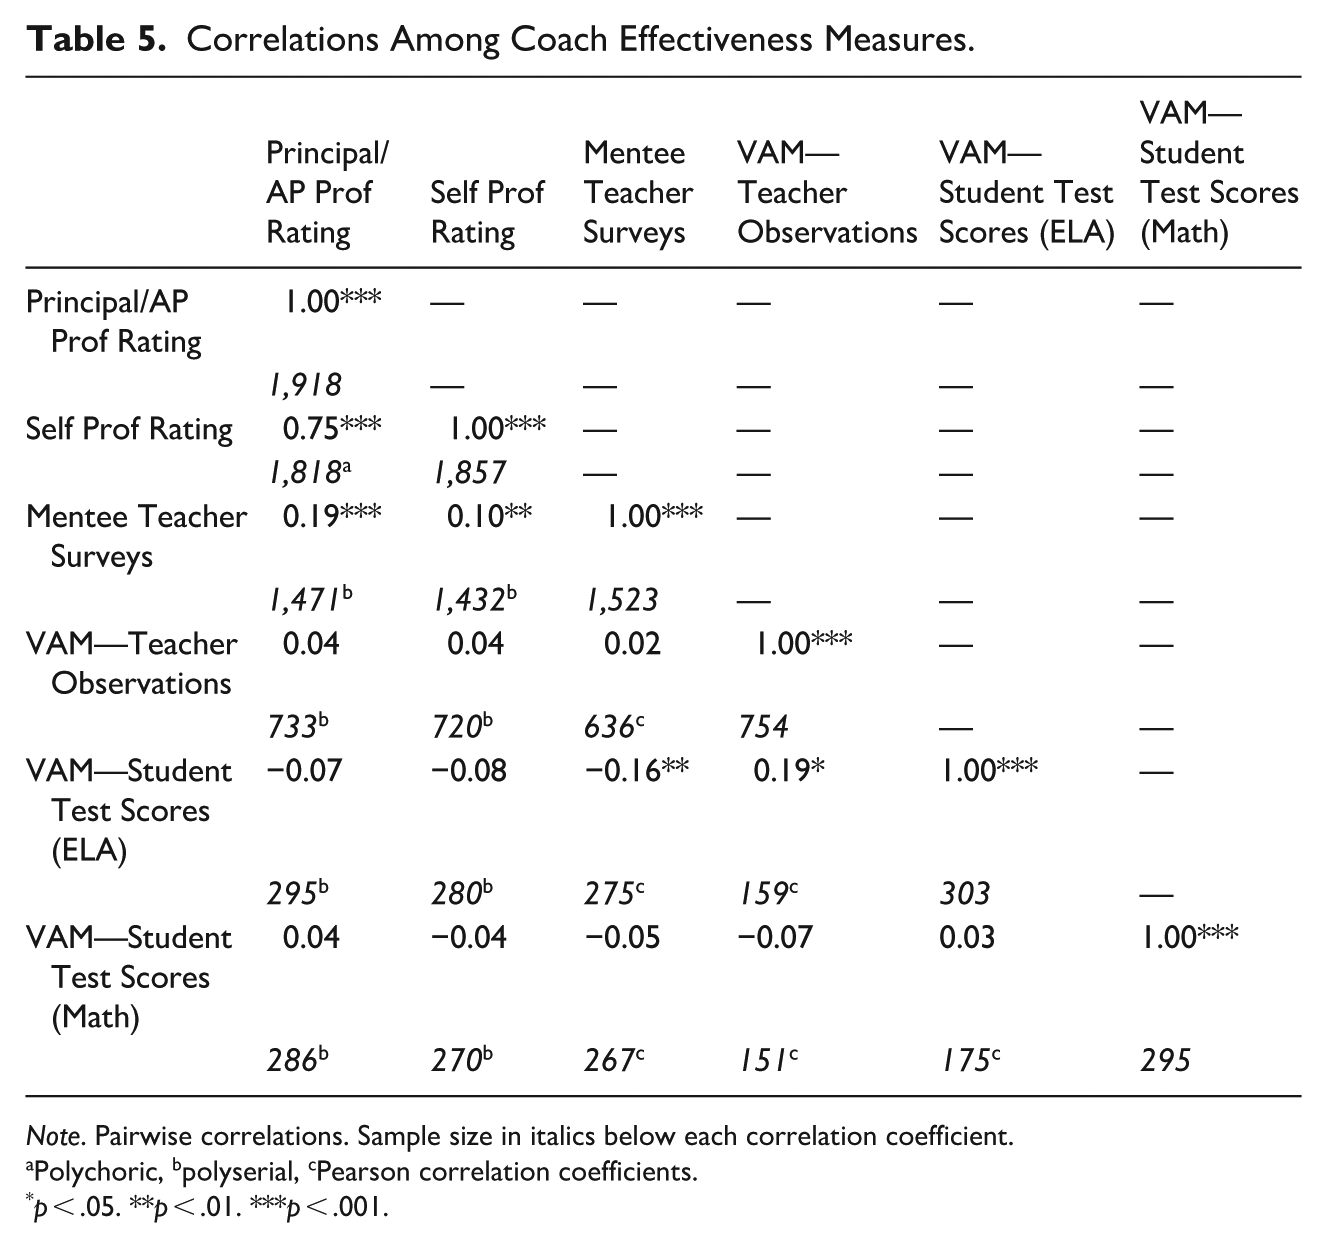
Note. Pairwise correlations. Sample size in italics below each correlation coefficient.
Polychoric, bpolyserial, cPearson correlation coefficients.
p < .05. **p < .01. ***p < .001.
We find a statistically significant and positive correlation between value-added to teacher observations and value-added to ELA student test scores of 0.19, indicating an association between our measure estimating coach effectiveness in improving instruction and student learning in ELA. We find no correlation between observational VAMs and math test score VAMs, though the low precision of the VAMs may attenuate these correlations
We find no statistically significant positive correlations between professionalism ratings and VAMs. There is a negative correlation between mentee teacher surveys and value-added to ELA student test scores. Thus, we find no positive correlations between the ratings coaches receive and the VAMs estimating instructional improvement.
RQ 3: Predicting Coach Effectiveness Measures with Coach Characteristics
Table 3 presents our preferred model predicting each coach effectiveness measure using coach predictors and school fixed effects. Additional specifications and sensitivity checks can be found in Appendix Tables A1 to A6. In the rare case where coefficients differ meaningfully across specifications, we note that here. As the table indicates and was mentioned in RQ 1 results, few demographic characteristics are significant predictors of the six measures of coach effectiveness. Male coaches and coaches of color receive lower ratings from school leaders, on average, though statistical significance is not consistent across models.
Coach characteristic coefficients indicate that more experienced coaches rate themselves more highly and are rated more highly by school leaders. Coaches with larger caseloads are also rated more highly by themselves and by their school leaders, perhaps a function of principals assigning more mentee teachers to the coaches they consider effective.
Turning to pre-coaching characteristics, the only significant predictor of some coaching effectiveness measures is teacher evaluation scores. More effective teachers, as measured by the districts MMTES, who become coaches are rated more highly by their principals, themselves, and somewhat more highly by their mentees (this result is statistically significant in all other models). No pre-coaching characteristics significantly predict coach VAMs.
Discussion
Context-Dependent Validity Threats
We examined five measures estimating coach effectiveness based on 1) leader rating, 2) self-assessment, 3) mentee teacher surveys, 4) value-added to mentee teacher observations, and 5) value-added to mentee teachers’ students’ test scores. The validity considerations and potential modifications to each measure are summarized in Table 4. All five measures have serious validity threats. Professional ratings from leaders and mentees suffer from bias and incomplete construct coverage, and the VAMs we estimate lack precision. Because coaching programs vary substantially in terms of structure, goals, and coach responsibilities, characteristics of these measures will also vary across contexts. However, many aspects of the district-wide ICP program result from taking coaching to scale, so concerns we raise here are likely relevant for other large-scale coaching programs. Our results can offer guidance to researchers and practitioners aiming to create more useful coach effectiveness measures.
In ICP, coaches were responsible for formative and summative evaluations of most of their mentee teachers. This responsibility limited the usefulness of leader ratings as a measure of coach effectiveness since leaders typically do not witness the coaches working directly with their mentee teachers. Additionally, the coaches are the primary observers of mentee teachers, resulting in potential bias in observational VAMs—it is not ideal to use observations performed by the coach themselves to estimate coach effectiveness. Observational VAMs in contexts where coaching observations are used only formatively might face fewer validity threats to leader ratings and/or observational VAMs. However, the use of coaches rather than administrators for summative evaluations was not an original feature of ICP but an adaptation that occurred as the program was taken to scale. It seems logical that for large-scale, costly coaching programs, many schools will choose to rely on coaches to perform required summative evaluations. While this issue is context-dependent, any coaching program that requires summative rather than purely formative feedback from coaches to mentees will limit the usefulness of observation VAMs or administrator ratings to measure coach effectiveness. Our modeling (see supplemental materials) attempted to control for individual observer effects, which accounts for substantial observation score variation (Bartanen & Kwok, 2021; Casabianca et al., 2015). However, the measure would still benefit from non-coach observers. We recommend that programs interested in using these VAMs to evaluate coaches employ observers other than a teacher’s coach, which could in some cases be accomplished with minimal additional cost if coaches conduct summative evaluations for teachers they do not coach.
In ICP, full-time teachers who become coaches split their time between teaching and coaching, a practice that has been recommended as a means to embed coaching in schools and ensure a steady supply of coaches for large-scale coaching programs (Kraft et al., 2018; Showers, 1985). The fact that these coaches teach part-time limits the number of teachers each coach can serve. As quantified in the supplemental online materials, coaches serving more teachers have more precise VAMs, so coach VAM precision could present a problem in any program where teachers are also coaches and caseloads are restricted accordingly. However, caseloads were also artificially lowered due to data limitations (including missingness of observations and coaches connected to no teachers). Careful attention to data completeness could conceivably address part of this imprecision. Additionally, programs with full-time coaches and large caseloads may find greater benefit from estimating VAMs.
Another source of imprecision in coach VAMs is that there is substantially more variation at the teacher level than the coach level. This can contribute to imprecision even when caseloads are larger (see online supplementary materials). This might be less of an issue in coaching programs with more homogeneous teaching populations, such as those targeting a specific subject or early career teachers. ICP, which served all teachers, required coaches to work with mentees with varied needs and potential for growth, limiting the precision of coach VAMs. Intentional matching of coaches and mentee teachers by experience and subject area may help to address this limitation.
One limitation of the coach effectiveness measures we use is specific to ICP: the item wording of both survey items and the professionalism indicator. As we found that the mentee survey provided limited construct coverage, mentee teacher surveys that are carefully designed and piloted to directly tap the construct of coach effectiveness have the potential to be more useful. Additionally, principal ratings that are tailored to what principals can observe may have improved validity. Because mentee teacher surveys and principal evaluations are easier for districts to implement than VAMs, we recommend that practitioners interested in measuring coach quality design those measures with care. This could improve feedback to coaches, helping them develop their practice.
We also found that school leaders tend to rate male coaches, Black coaches, and Hispanic coaches lower than female and White coaches—though the small number of coaches of color in our sample limits our ability to estimate systematic differences. This echoes concerning patterns in teacher evaluation, which tend to show gender and race gaps (Campbell & Ronfeldt, 2018; Grissom & Bartanen, 2022) and offers an important cautionary tale to districts interested in using leader ratings of coaches.
Because coaching programs can differ both in the data available to create measures and in the true underlying distribution of coach quality, it is important to rigorously examine coach quality in a variety of different contexts. Blazar et al. (2023) created a more precise and credibly unbiased coach observation VAM in a pre-service context, where all pre-service teachers started relatively unprepared, more teachers were assigned to each coach, and the potential for systematic sorting of teachers to coaches was smaller. In contrast, ICP served all teachers, used part-time coach-teachers with caseload limitations, and had more opportunity for sorting—and our coach observation VAM suffered from serious validity threats.
Potentially Separate Domains of Coach Effectiveness
The correlations between school leader professionalism ratings, self-assessment, and mentee teacher surveys suggest the possibility of an underlying domain of coach effectiveness connected to relationship-building, school-wide service, and administrative tasks. It is also possible that these measures share the same sources of bias. Only two of the VAMs that measure coach impact on instruction and learning (value added to mentee observation scores and value-added to student ELA scores) correlate with each other. There were no statistically significant positive correlations between professional ratings from a coach’s leaders and mentees and the value-added measures we created.
Multiple measures of teacher effectiveness tend to have higher correlations than most of those found here for coaches, typically ranging from 0.1 to 0.3 (Chaplin et al., 2014; Grossman et al., 2014; Jackson, 2018; Petek & Pope, 2023). The lower correlations we find for coach effectiveness measures are likely due to a combination of highly diverse tasks given to coaches and noisier coach effectiveness measures. The tasks assigned to teachers are multi-faceted and complex. The tasks assigned to coaches build on that complexity. Administrators may want coaches to improve teaching while also helping restructure the school community, negotiating policy implementation, and jumping in whenever an additional pair of hands is needed. This means that many of the challenges of measuring teacher effectiveness are magnified in efforts to measure coach effectiveness. Thus, it is reasonable to observe more noise and lower correlations among coach effectiveness measures. It is also possible that the expansive work of coaching contains more diverse domains with less correlated components than teacher effectiveness. Coaching is complex relational work that includes interfacing with school leaders, building trust with teachers, and improving aspects of teaching that are reflected in observations and/or student test scores. Practitioners designing coach effectiveness measures should consider which aspects of coaching are priorities in their contexts and design avenues of feedback for mentee teachers and principals that reflect those priorities.
Predictors of Coach Effectiveness
When we predict different measures of coach effectiveness, we find strong predictors of leader ratings and self-assessment, a single inconsistently-significant predictor of teacher survey ratings, and no significant predictors for any VAMs.
Years of experience as a coach predicts leader rating and self-assessment, but, perhaps surprisingly, no other measures. While years of teaching experience is strongly associated with teacher effectiveness (especially in the first few years), we do not replicate these findings for years coaching and coach effectiveness.
We find that coaches who were more effective as teachers tended to have higher leader ratings, self-assessments, and teacher survey ratings (while the relationship is not statistically significant in the model shown in Table 3, it is significant in all other models, as shown in the appendix). This aligns with prior work that found that principals and mentee teachers valued a coach’s teaching excellence highly in their conception of good coaching (Marsh et al., 2012). However, we do not find that more effective teachers who become coaches have higher value-added to teacher observations or student test scores. In fact, there is no consistent statistically significant predictor of any of the VAMs we created. This could be a reflection primarily of the lack of precision in these VAMs or it may be that good teaching does not necessarily translate to good coaching.
Implications for Policy and Practice
Many of the issues we raise around bias and precision are most directly relevant to other researchers studying coaching. However, there are also considerations for policymakers and practitioners implementing coaching models. First, we recommend considering coach effectiveness as an integral part of the coaching program design when developing such programs. Those implementing coaching programs should think about specific outcomes they want to prioritize and means for providing feedback for coaches to support their growth on those outcomes. Of the measures we considered, surveys of mentee teachers are likely the most feasible and valid, allowing coaches to know which aspects of their work are more or less effective for their mentee teachers.
The role of coaches in summative observations is complicated. Many worry that teachers will not be open to reflection and development when the stakes are perceived as high (Hazi, 2022; Popham, 1988), while others argue that formative and summative evaluations are interdependent and should therefore be performed by the same person (Ford & Hewitt, 2020; Goldstein, 2007; Hunter, 1988). In addition to the potential implications for teacher experiences, coaches performing summative evaluations of their mentee teachers surfaces measurement concerns. Having coaches perform summative evaluations on other coaches’ mentee teachers is a relatively cost-effective potential solution to this measurement problem.
Managing coach effectiveness is difficult within larger coaching programs, which, by design, will likely be less selective in choosing coaches and assigning mentees. Our findings indicate that coaches with stronger evidence of teaching effectiveness are also more effective coaches, at least in the eyes of their mentees and leaders. However, there are likely a limited number of highly effective teachers a school might want to remove from the classroom (even part time) before concerns about whether coaching is “worth it” arise. Additionally, it is difficult to identify coach effectiveness or support coaches when they face a variety of tasks in a single all-purpose coaching program meant to serve every teacher. We note that coaching can still be delivered at large-scale even if it is more specialized. For example, programs may focus on literacy and be relatively universal across elementary schools. Alternatively, a coaching program can narrow its focus to early-career teachers, thereby serving a targeted group of teachers in every school. These more focused programs could still benefit many teachers, while the reduced variation at the teacher level would benefit measures of coach effectiveness.
Limitations and Future Work
It is important that studies of coach effectiveness be replicated and extended across varied coaching programs and contexts, as both the specifics of the measures and the underlying distribution of coach quality may differ. Further validity work on coach effectiveness could advance to more difficult uses of coach measures, such as formative or summative coach feedback, which requires additional validity evidence. Generalizability theory could be used to better understand the measures. Additionally, researchers could explore different ways to combine multiple measures, similar to prior work on multiple measures of teacher effectiveness. There are also other potential measures that could be used to estimate coach effectiveness that we did not have the data to create but future studies may consider. It would be interesting to consider student outcomes beyond test scores (such as attendance, discipline, or course grades) that could reflect instructional changes caused by coaches. Additionally, information on how coaches spent their time or how teachers responded to coaching could be used to create a coaching observational measure. Future research in this area should aim to connect specific coach behaviors to measures of coach quality to provide guidance to coaches about how to most effectively help teachers.
Conclusion
This nation’s vast corps of teachers are the education system’s most important means for helping students. The rest of the system thus has a responsibility to support those teachers. Instructional coaching is a promising avenue for providing that support. However, it is not enough to simply give a teacher any coach, the same way it is not enough to simply give a student any teacher. The current study is a starting point to move the field toward a better understanding of coach effectiveness, building a foundation for improving instructional coaching at scale.
Supplemental Material
sj-docx-1-epx-10.1177_08959048251395199 – Supplemental material for The Challenge of Measuring Instructional Coach Effectiveness
Supplemental material, sj-docx-1-epx-10.1177_08959048251395199 for The Challenge of Measuring Instructional Coach Effectiveness by Michelle Doughty, Mimi Engel and Allison Atteberry in Educational Policy
Footnotes
Funding
The authors disclosed receipt of the following financial support for the research, authorship, and/or publication of this article: The research reported here was supported by the Institute of Education Science, U.S. Department of Education, through Grant R305H190060; the William T. Grant Foundation Institutional Challenge Grant #189696; and the CU Boulder Research & Innovation Seed Grant Program. The opinions expresed are those of the authors and do not represent views of the funders.
Declaration of Conflicting Interests
The authors declared no potential conflicts of interest with respect to the research, authorship, and/or publication of this article.
Supplemental Material
Supplemental material for this article is available online.
Notes
Author Biographies
References
Supplementary Material
Please find the following supplemental material available below.
For Open Access articles published under a Creative Commons License, all supplemental material carries the same license as the article it is associated with.
For non-Open Access articles published, all supplemental material carries a non-exclusive license, and permission requests for re-use of supplemental material or any part of supplemental material shall be sent directly to the copyright owner as specified in the copyright notice associated with the article.