
Abstract
U.S. public schools provide substantially different educational opportunities to students—even within school districts, where attendance zone boundaries (AZBs) shape most children’s access to schools. The (re)drawing of AZBs is therefore a highly consequential policy decision. In this paper, I study how AZB changes in the Washington, D.C. metropolitan area affect children of different races between 2000 and 2020, including how they alter children’s travel times to school and access to school-level educational opportunities. Findings are starkly unequal, with rezoning disproportionately negatively affecting Black and Hispanic children. Results highlight the need for educational leaders to explicitly consider how AZB changes will redistribute opportunity within their districts.
Keywords
Introduction
Public schools across the U.S. have substantially different resources and opportunities, raising questions about who has access to limited seats in schools perceived to be high quality. This is true even of schools within the same school district, where school attendance zone boundaries (AZBs) shape most students’ access to specific schools based on where they live within the district. Thus, the redrawing of AZBs, or rezoning, is a highly consequential policy decision, and one that deserves more empirical attention.
Historically, AZBs were used to maintain de jure racial segregation within U.S. school districts by assigning students of different races to different schools. While Brown v. Board of Education declared such practices unconstitutional, and subsequent court decisions clarified how districts can redraw AZBs to facilitate school desegregation, AZBs today continue to shape a reciprocal link between patterns of residential and school sorting (Denton, 1996; Monarrez, 2023). Families who can afford to do so will often consider AZBs when deciding where to purchase a home (Holme, 2002; Lareau & Goyette, 2014; Owens, 2017; Pearce, 1980), and many also advocate for AZB changes that will preserve or increase their access to educational opportunity (A. J. Castro et al., 2022; Lareau et al., 2018).
However, AZBs also remain one of the most powerful policy tools educational leaders have to disrupt patterns of racial segregation and inequality of opportunity within their school districts. The (re)drawing of AZBs represents a local policy decision—AZBs are determined by district leaders and school boards, meaning they are generally easier to alter than other policies set at higher levels of government. 1 AZB changes also represent an ongoing policy decision—districts must periodically (re)draw AZBs for a variety of reasons, including the need to rebalance school capacities amidst population changes.
Despite the prevalence and implications of AZB changes, little is known about their outcomes, mostly due to a lack of historical AZB data. More specifically, though racial inequities in access to educational opportunity are well documented—for example, racially minoritized students tend to attend schools with fewer experienced teachers and higher discipline rates (Cardichon et al., 2020; Losen & Martinez, 2020)—the role AZB changes play in perpetuating those inequities is largely understudied. However, that role is critically important to understand, especially as our country’s student body continues to diversify (National Center for Education Statistics, 2020), stark racial inequalities in education persist (Noguera, 2017), and decisionmakers enact policies that ignore the role of race (Bonilla-Silva, 2017).
In this paper, I study how AZB changes shape access to educational opportunity for children of different races. 2 Using a novel dataset of longitudinal AZB data, I study elementary school AZBs in the 24 school districts serving the Washington, D.C. metropolitan region between 2000, 2010, and 2020. The D.C. metro is one of the most racially diverse in the U.S., and the AZB data I have for this area offer a unique opportunity to study a large sample of neighboring school districts. I analyze the extent to which AZB changes disproportionately affect children along racial lines, including how they alter children’s home-to-zoned-school travel time and how they assign children to schools with varying proportions of certified, experienced, and non-absent teachers; student discipline rates; participation in Gifted and Talented (GT) programs; and academic achievement.
Findings demonstrate starkly unequal effects of rezoning on students of different races. 3 Rezoning disproportionately affects Black children compared to other racial groups, and when they are rezoned, children of color experience greater increases in their home-to-zoned-school travel times and are rezoned to schools with lower levels of educational opportunity. In laying out the clear racial impacts of rezoning, I argue educational leaders should explicitly consider how AZB changes will shape patterns of racial equity within their districts when making rezoning decisions.
Theoretical Framings
I draw on several theories in this study to conceptualize the relationship between AZB changes and racially unequal access to educational opportunity. First is the concept of opportunity hoarding, defined by Tilly (1999) as one of several processes that serve to perpetuate categorial inequalities in society. Applied to the education context, scholars have documented how opportunity hoarding by advantaged groups creates separate and unequal educational spaces (Diamond & Lewis, 2022; Fiel, 2015). For example, stakeholders with power can use rezoning processes to gain or maintain access to schools perceived as having high degrees of educational opportunity, while excluding others from those schools.
Scholars have also written about the racialized nature of opportunity hoarding, and the ways in which it is used by white families to uphold white supremacy in educational institutions (Diamond & Gomez, 2023; Diamond & Lewis, 2022). Despite racial diversification of school enrollments across the U.S., educational institutions remain “white spaces” in that they reinforce white supremacy and white cultural norms (Diamond & Lewis, 2022; Diem & Welton, 2020). In the context of rezoning, white families can use their power and privilege to maintain segregated schools and/or schools that prioritize their desires. For example, amid racial diversification, white families may resist unwanted AZB changes by threatening to leave the public schools (and take associated funding with them) and enroll in other choice schools or even move to more homogenous school districts (Frankenberg & Kotok, 2013; Siegel-Hawley, 2013). The isolation of white students is a form of segregation that often goes understudied (Wilson, 2021).
In recent years, processes of opportunity hoarding and the maintenance of white spaces in education have increasingly relied on race-evasive language, or language that avoids explicit mention of race or racialized impacts (Annamma et al., 2017; Bonilla-Silva, 2017). The well-documented rise of race-evasive policy in the U.S. is based on mistaken beliefs that we live in a post-racial era where law is no longer responsible for racial disparities (Bonilla-Silva & Dietrich, 2011) and that the Constitution prevents any consideration of race within law and policy (Anderson, 2007). However, race-evasiveness only allows racial disparities to grow and intensify (Carter et al., 2017; Liu, 2022; McDermott et al., 2015; Saito, 2023). Research on student assignment policies and AZB change processes reveal the segregative outcomes of processes that avoid explicit discussion of race (A. Castro et al., 2024; McDermott et al., 2015). Several such examples are discussed further in the next section.
Literature Review
The Politics of AZBs and AZB Change
Because AZBs serve to allocate educational resources and opportunities by assigning students to particular schools within a district, the process of (re)drawing AZBs can become quite contentious. Several scholars have conducted qualitative case studies to understand the politics of rezoning processes (e.g., Bartels & Donato, 2009; A. J. Castro et al., 2022; A. Castro et al., 2024; Eaton, 2012; Freidus, 2020; Keener, 2016; Lareau et al., 2018; Lung-Amam, 2023; Rosegrant, 1998; Schockaert, 2013; Siegel-Hawley, 2013; Siegel-Hawley et al., 2017; Smith, 2010). This body of research helps illuminate the goals, concerns, and outcomes of AZB change that are of particular interest to stakeholders. One of the main themes throughout this literature is that, while many of the stated goals of rezoning appear to be race-neutral, community discussions about potential AZB changes frequently invoke issues of racial equity.
Most rezoning processes begin in response to the need to rebalance school building capacities amid changes in population size (Brown & Knight, 2005; Freidus, 2020; Keener, 2016; Siegel-Hawley, 2013). Oftentimes, district leaders attempt to minimize the number of students they have to rezone, recognizing that community members perceive being rezoned as undesirable (Brown & Knight, 2005; Siegel-Hawley et al., 2021). Districts may also want to minimize their transportation costs, and parents want to minimize their students’ travel time to school (Lareau et al., 2018; McDonald, 2014; Smith, 2010). But when rezoning is unavoidable, these goals can produce inequitable outcomes in which stakeholders with the most power—often white and affluent families—can successfully avoid being rezoned and/or being rezoned to schools further away. Inequitable burdens of rezoning are especially salient given the historical context of court-ordered desegregation plans that disproportionately bused Black children to schools outside their neighborhoods (Pride & Woodard, 1995; Woodward, 2011). Predominantly Black schools have also been disproportionately closed—both historically and in the current day—requiring students be rezoned (Ewing, 2018; Tilsley, 2017).
Other common talking points during rezoning include desires for “neighborhood schools,” clear feeder patterns from elementary to middle and high schools, and for students to stay in school with their “peers” (Bartels & Donato, 2009; A. J. Castro et al., 2022; Lareau et al., 2018; McDermott et al., 2015; Schockaert, 2013; Siegel-Hawley, 2013; Siegel-Hawley et al., 2017). But such rhetoric has long been used to resist school desegregation (Powell, 2012), and it remains a tool to that effect during some contemporary rezoning efforts (A. J. Castro et al., 2022; McDermott et al., 2015; Siegel-Hawley et al., 2017). Case studies demonstrate how phrases like “neighborhood schools” imply that families want their children to be zoned to schools with other kids who look like them, especially in the context of highly segregated residential neighborhoods (Bartels & Donato, 2009; A. J. Castro et al., 2022; Keener, 2016).
Stakeholders are also often concerned with the effects of AZB changes on schools’ academic quality (A. J. Castro et al., 2022; Dixon, 2014; McDonald, 2014; Schockaert, 2013; Wiley et al., 2012; Wilson, 2016). Case studies describe white parents expressing worry that their children will be rezoned to a school of lesser quality or that racially minoritized or poor children rezoned to their school will lower the academic expectations (A. J. Castro et al., 2022; Frankenberg & Kotok, 2013; Wiley et al., 2012). For example, in one Georgia school district, white residents expressed concern over whether their school would be able to provide language services to emergent-bilingual, Latinx students slated to be rezoned to it. While the white parents spoke as if concerned that their schools would not be able to adequately serve these new students, many recognized that the white parents did not want their schools to have to devote any resources to bilingual education, as they perceived it would detract from their own children (Dixon, 2014). As these cases demonstrate, race-evasive language around school quality is often used to resist the non-race-neutral redistribution of educational resources that can happen as a result of rezoning.
Stakeholders who speak of AZB changes in explicitly racial terms are less common, but are also represented in this literature (see A. Castro et al., 2024; Keener, 2016; Lareau et al., 2018; Smith, 2010; Wiley et al., 2012). Most often, those who are willing to use explicit language are voicing desires for racial and ethnic diversity in their schools and expressing concern over who will bear any burdens of AZB change (Keener, 2016; Lareau et al., 2018; Smith, 2010). Within the D.C. metro, news media has highlighted several such examples, including calls by students of color in Montgomery County Public Schools, MD for more racially diverse schools (Peetz, 2019a) and successful efforts by Latinx parents in Loudoun County Public Schools, VA to resist proposed, segregative boundary changes (Dellinger, 2016). Some case studies have also highlighted school leaders committed to altering AZBs in ways that diversify schools, demonstrating how desegregative AZB changes are most likely to occur through intentional, explicit efforts (Diem, 2015; Eaton, 2012; Frankenberg & Diem, 2013). Together, these examples demonstrate the interest in and potential for desegregation and racial equity as outcomes of AZB change.
Overall, this body of literature highlights several outcomes of AZB change in which stakeholders are particularly interested. These include technical issues, such as how many students will be rezoned and how AZB changes will affect travel times, as well as concerns over how changes will shift the allocation of educational opportunities. Critically, this literature demonstrates how all of these outcomes are deeply related to patterns of racial equity.
Empirical Studies of the Outcomes of AZB Change
While case studies on the politics of rezoning highlight outcomes of interest related to AZB changes, other empirical research analyzes the actual effect of rezoning on some of those outcomes. Some of this literature examines the relationship between AZB changes, patterns of segregation, and residential housing markets. It finds that rezonings have led to increases in segregation in some places (Mawene & Bal, 2020; Siegel-Hawley, 2013; Siegel-Hawley et al., 2017), decreases in segregation in others (Clark, 1987; Eaton, 2012; Rosegrant, 1998), and are linked to significant changes in home values (Bogart & Cromwell, 2000; Collins & Kaplan, 2017; Ding et al., 2020; Ries & Somerville, 2010). But more relevant to the current study is research that speaks to the effect of AZB changes on students’ access to educational opportunity.
One of the most pertinent studies is a recent one from Domina et al. (2021) using student-level administrative data to analyze the effect of rezonings in the Wake County Public School System, North Carolina between 2000 and 2010. Using an event study design, the authors find that the AZB changes, which were meant to increase the socioeconomic diversity of schools, had racially disparate effects on students. The authors found rezoning led to a decrease in travel distance for white students, an increase for Hispanic students, and no change for Black students. And compared to their non-rezoned peers, rezoning led to white students being zoned to schools with significantly higher math achievement scores, while it led to Black students being zoned to schools with significantly lower math achievement. This study is the only one, to my knowledge, to investigate the relationship between rezoning and students’ access to educational opportunity, and it demonstrates clear, racially unequal effects.
Additional quantitative studies have tracked students’ individual outcomes following rezoning. These studies tend to find null or slightly positive effects of rezoning on students’ test scores (Domina et al., 2021; Hill et al., 2023; Katyal, 2020) and null effects on suspension rates (Domina et al., 2021) and absenteeism (Domina et al., 2021; Hill et al., 2023), suggesting rezoning is not a detrimental event for the average student.
Still other research has focused more generally on how moving to a different school effects students’ outcomes. Some moves, such as those linked to school openings or closures, are also typically accompanied by AZB change. Hashim et al. (2018) found students zoned to newly built schools in Los Angeles Unified School District, California experienced increased academic achievement. The authors posited the benefits they observed were driven by students’ access to new school facilities and redesigned school practices. Others have found those who must leave a closed school experience slight declines in academic achievement; declines are greater for students who were already academically struggling and for those rezoned to schools with low mean achievement levels (Bifulco & Schwegman, 2020; Brummet, 2014; Engberg et al., 2012). Overall, this research further establishes that the opportunities available at a student’s newly assigned school are consequential for their academic experience.
Finally, a related body of literature describes the effects of school desegregation efforts on student outcomes. Though desegregation plans do not always involve rezoning—many contemporary ones instead rely on school choice mechanisms—this research speaks to some of the potential outcomes of desegregative AZB changes. Qualitative research has documented the varied experiences of Black students moving to predominantly white schools; these studies highlight both the complex social structures Black students must navigate as well as some of the academic and social benefits they report (Eaton, 2001; Holland, 2012; Ispa-Landa, 2013; Lit, 2009; Wells & Crain, 1999). In fact, a wealth of research shows the social and academic benefits of equal-status, integrated school environments for all students, and particularly for students of color (e.g., Guryan, 2004; Johnson, 2019; Mickelson & Nkomo, 2012; Pettigrew & Tropp, 2008; Wells & Crain, 1994). On the other hand, (re)segregation worsens patterns of racial inequality. For example, an analysis of the end of court-ordered busing in Charlotte-Mecklenburg Schools, North Carolina found the return to neighborhood schools increased racial segregation, which in turn contributed to growing racial gaps in math scores and criminal activity (Billings et al., 2014). Taken together, this research suggests that when accompanied by policies aimed at fostering equal-status integration, desegregative AZB changes have great potential to improve equality of access to educational opportunities.
Additional Measures of Educational Experience and Opportunity
While much of the existing literature has focused on students’ individual abilities and experiences following a rezoning, this study focuses on how AZB changes more broadly shape children’s access to educational opportunities. Education scholars have written extensively about school-level inputs that exacerbate opportunity gaps (Carter & Welner, 2013; Ladson-Billings, 2006), meaning the school a student attends has significant consequence for their outcomes. In this paper, I study how AZB changes affect children’s travel time to school and their access to schools of variable opportunity, proxied via rates of experienced, certified, and non-absent teachers; student discipline; GT participation; and academic proficiency. Here, I briefly review literature highlighting the relevance of each of these measures to historical efforts for educational equity and to current-day rezoning processes.
Home-to-school travel time has long been recognized as an important aspect of students’ educational experience and one that can reflect inequities in our residence-based school system (Lenhoff et al., 2022). On a practical level, travel time is a top consideration for both school leaders and parents during rezoning processes (Gillani et al., 2023; Glazerman & Dotter, 2017; Hanover Research, 2015; McMillan, 2018). Research supports the notion that long travel times can negatively affect students by leading to higher absenteeism and lower participation in school activities (Blagg et al., 2018; Grossman et al., 2001). Historically, Black children bore the burden of school desegregation by enduring long bus rides to schools outside their neighborhoods (Pride & Woodard, 1995; Woodward, 2011), and more recent studies of large urban school districts show racially minoritized students continue to have longer average commutes than their white peers (Corcoran, 2018; Cowen et al., 2018; Denice & Gross, 2018).
Once at school, one of the most important inputs to a child’s education is their teacher. While quality teaching can be difficult to measure, research suggests teacher experience (Atteberry et al., 2015; Rivkin et al., 2005; Rockoff, 2004), certification (Boyd et al., 2006; Clotfelter et al., 2007), and absence rates (Clotfelter et al., 2009; Miller et al., 2008) are strong proxies for students’ opportunities to learn. However, studies consistently show that racially minoritized and/or poor students are less likely to have experienced or certified teachers than their white and/or non-poor peers (Cardichon et al., 2020; Clotfelter et al., 2005; Darling-Hammond, 2001; Gagnon & Mattingly, 2015; Kalogrides & Loeb, 2013).
Another indicator of opportunities to learn within a school is student discipline rates. Exclusionary discipline practices remove students from classrooms and are linked to negative academic and life outcomes (Fabelo et al., 2011; Rosenbaum, 2020; Rumberger & Losen, 2017), even for those who are not themselves disciplined (Licalsi et al., 2021). Unfortunately, a growing wealth of research documents the starkly disproportionate rates of discipline inflicted on racially minoritized students, especially Black students (Gopalan & Nelson, 2019; Losen et al., 2015; Losen & Martinez, 2020; Mendez & Knoff, 2003). And rather than objectively representing student behavior, high discipline rates and large racial gaps in discipline can represent the subjective decisions of school leaders (Beck & Muschkin, 2012; Okonofua & Eberhardt, 2015).
Similarly, GT participation rates can speak to a school’s provision of opportunity. Access to GT courses has been shown to improve students’ academic test scores (Bui et al., 2014; Card & Giuliano, 2014). In fact, the benefits of GT are particularly large for racially minoritized students, but Black students have long been disproportionately under-identified as GT (Ford, 1998; Grissom & Redding, 2016; Shores et al., 2020). Like discipline data, GT enrollments are not a simple reflection of students’ objective abilities. Research shows teachers are less likely to refer Black students for GT testing than white students (Elhoweris, 2008; Ford et al., 2008; McBee, 2006), and assessors give Black students lower intelligence scores (Fields, 2004).
Finally, school-level academic achievement data represent an additional measure of educational opportunity. Though test scores are flawed metrics that reflect the deep social inequalities students face outside the classroom (Schneider, 2017), they remain one of the most commonly used indicators of school quality. Parents frequently rely on test scores to inform school choices and even homebuying decisions (Haderlein, 2022; Holme, 2002; Lareau & Goyette, 2014). Average school test scores also come up during rezoning processes, as discussed above. 4 Moreover, there is evidence to support the notion that test scores, especially racial differences in test scores, can speak to a school’s ability to educate its students (Stewart, 2008; Stiefel et al., 2007).
Research Methods
This study addresses three research questions designed to assess how AZB changes affect children of different races and shape their educational experiences:
To what extent are children of different races affected by rezoning?
How does rezoning affect home-to-school travel time for children of different races?
How does rezoning affect access to school-level educational opportunity for children of different races?
To answer these questions, I study zoned elementary schools in the 24 school districts serving the Washington-Arlington-Alexandria metropolitan statistical area, as defined by the U.S. Census Bureau in 2010, the latest definition at the time the study began. This includes D.C. Public Schools, five school districts in Maryland, 17 school districts in Virginia, and Jefferson County Public Schools in West Virginia. The total sample consists of 720 zoned elementary schools in 2000, 753 in 2010, and 762 in 2020, excluding schools that do not have AZBs, such as some magnet schools, specialized schools, and charter schools.
While previous research on AZB change has mostly focused on one or two school districts at a time, a novel dataset—the Longitudinal School Attendance Boundary Survey (LSABS)—presents a unique opportunity to study the effects of AZB changes across several neighboring districts. I come to this study as an original member of the LSABS team who helped to collect AZB maps from school districts across the country between 2019 and 2021. I study the D.C. metro in this paper because it represents the first entire metropolitan region for which LSABS has complete 2000, 2010, and 2020 data. I believe racially diverse schools and equitable access to educational opportunity are crucial to a functioning multiracial democracy, and I see this work as helping us understand the role AZB changes play in fostering equal opportunity.
Study Context
The D.C. metro is one of the most racially diverse in the country. White residents left the D.C. city center in droves beginning in the 1950s, partly in response to school desegregation mandates as well as other housing policies encouraging suburban homeownership, and D.C. became a majority Black city (Kijakazi et al., 2016; Rothstein, 2017). However, since the 1970s, as the Fair Housing Act expanded suburban housing options to Black Americans and as many formerly Black neighborhoods in the city have been affected by gentrification, many middle-class Black residents have moved out of D.C. and into nearby suburban counties. For example, Prince George’s County, MD, which borders D.C. to the east, was known for several decades as the most affluent majority Black county in the U.S., though it recently lost that title to the county to its south, Charles County, MD (Wilkins, 2022). These and other suburbs in the D.C. metro, including Montgomery, Fairfax, and Prince William Counties, have long had relatively diverse populations (see Table 1). Meanwhile, other outer-ring D.C. suburbs such as Frederick County, MD and Loudoun County, VA have racially diversified only in recent decades. Further out still, this metro also includes some counties that remain quite rural, with smaller, predominantly white populations. The 24 school districts in this metro each have their own unique racial histories, and while it is a limitation of this quantitative study that I do not capture all of these nuances, I focus on the metropolitan sample as a whole.
Racial Demographics of Residential Populations Aged 0 to 17 Living in the School Districts Serving the Washington, D.C. Metropolitan Area, 2000 and 2020.
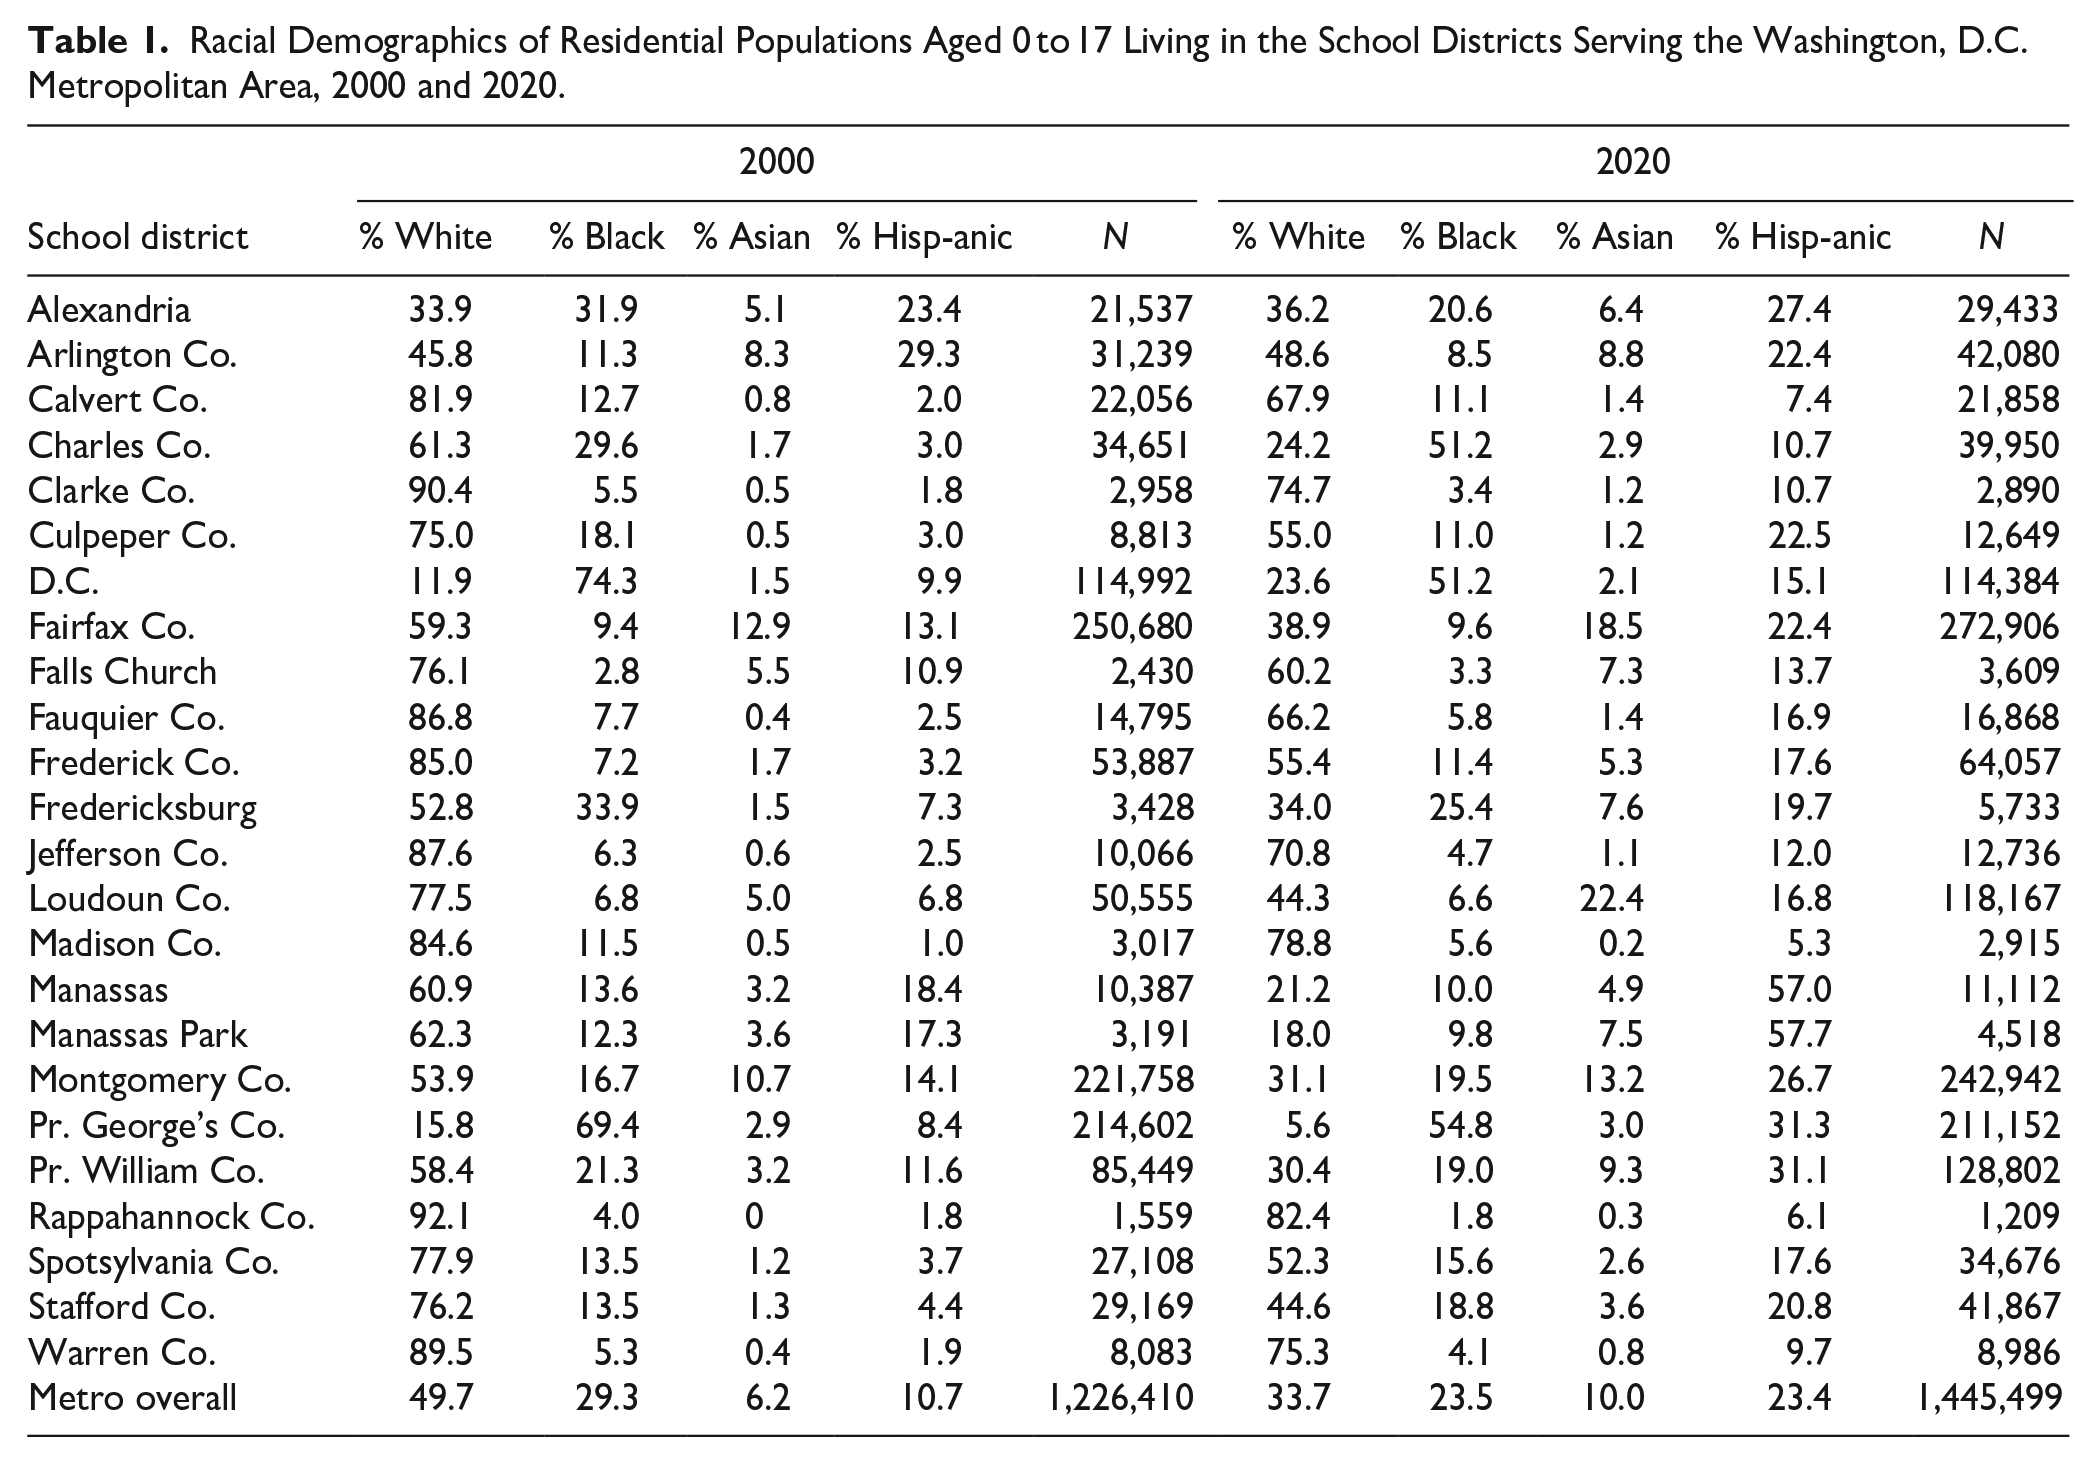
The metro’s total population aged 0 to 17 was 50% white in 2000, 29% Black, 11% Hispanic, and 6% Asian. Since then, the number and proportion of white and Black residents have decreased, with white declines much larger than those for Black residents. Meanwhile, the number and proportion of Hispanic and Asian residents grew substantially. By 2020, the population was 34% white, 24% Black, 23% Hispanic, and 10% Asian. These trends generally mirror those documented in other metros around the country (Mordechay & Terbeck, 2024; Parisi et al., 2019).
The D.C. metro also has a few unique features that make it useful for study. The majority of the school districts in this sample (18 of 24) are countywide school districts. These districts are geographically large and most of them have dozens of elementary schools, meaning there is great potential for variation in the school-level educational opportunities within each district. Thus, AZBs play an especially critical sorting role in this metro, as compared to metros with smaller, more fragmented districts.
All of the school districts in this sample use AZBs as their primary student assignment method, though they each have varying degrees of school choice as well. D.C Public Schools is the district with the largest proportion of students attending choice schools—as is common in many urban districts in the U.S.—but the suburban districts outside of D.C. have substantially fewer choice options. As of 2019–20, there were 53 elementary charter schools operating within Washington, D.C. and just 15 elementary charter schools operating across the rest of the metro. In the entire metro, there were about 300 private schools serving elementary grades. While these choice options disrupt the relationship between a child’s residence and the school they attend, this paper focuses on the opportunities available at a child’s zoned school.
Several districts in the D.C. area have undergone contentious rezoning efforts in recent years that have initiated public discussion of how AZBs shape access to education (Balingit, 2014; Goldstein, 2019; Peetz, 2019b; Reed, 2020). For example, Prince William County Public Schools, VA was briefly under investigation by the U.S. Department of Justice in 2014 for a proposed high school AZB change that would concentrate racially minoritized students at one school; the change was ultimately not implemented (Balingit, 2014). As another example, Montgomery County Public Schools, MD conducted a boundary study in 2020 which included consideration of how to reduce racial isolation within schools (WXY Architecture + Urban Design, 2021); intense public discussion ensued about whether racial desegregation should be an explicit goal of rezoning (Reed, 2020).
Data
I combine several data sources to answer my research questions. I begin with a set of elementary school AZB maps from the 1999–00, 2009–10, and 2019–20 school years, for each of the 24 school districts in my sample. These maps were collected from individual districts or from existing data sources and digitized as part of LSABS. 5 I focus on elementary school AZBs, 6 because they are smaller geographic units than middle or high school AZBs and thus have the most potential to separate students. They also likely align most closely with our conceptualization of neighborhoods (Taylor & Frankenberg, 2021).
To understand who lives within each AZB, I use decennial census population counts from the Census Bureau, accessed through the tidycensus package in R. I use population counts at the block level from 2000 and 2010 and at the tract level in 2020, disaggregated by race and ethnicity for those aged 0 to 17. 7 My analyses include the four largest racial/ethnic groups in the D.C. metro: non-Hispanic white, non-Hispanic Black, non-Hispanic Asian, and Hispanic individuals of any race.
Because census units do not nest perfectly within AZBs and because both census units and AZBs change over time, I interpolate census populations from each year into one consistent grid of 30 m2 raster cells. I employ dasymetric interpolation methods to evenly assign census population counts to raster cells classified as developed land in the 2001, 2011, and 2019 National Land Cover Database (Eicher & Brewer, 2001). I then aggregate raster cells and their population counts up to the AZB level for analysis.
By using census data, my analyses describe where residential child populations are zoned to attend school; they do not account for choice options that allow students to attend public schools to which they are not zoned, charter schools, private schools, or home school. In the absence of data on where every child lives and attends school, the current approach is informative given that 73% of children in the U.S. attend their zoned public school (National Center for Education Statistics, 2021). Furthermore, community members without children attending their zoned public school still care about AZBs and AZB changes, suggesting it is appropriate to consider the effects of AZB changes for all children, and not just for enrolled students. 8 Throughout the findings, I refer to “children” rather than “students” to reflect the fact that the analyses capture all residential populations aged 0 to 17.
Next, I merge AZB data and census data with school point location and enrollment data corresponding to the 1999–00, 2009–10, and 2019–20 school years, accessed via the Urban Institute’s Education Data Portal API (version 0.18.0). In particular, I use enrollment counts by grade level to identify schools that were open and serving third grade in each year of study.
School-level educational opportunity variables mainly come from the U.S. Department of Education’s Civil Rights Data Collection (CRDC). I link areas rezoned between 2000 and 2010 to data from the 2000 CRDC, and I link areas rezoned between 2010 and 2020 to the 2009–10 CRDC. Though the CRDC did not survey all public schools in 2000 or 2009–10, it has good coverage of schools in my sample for both years. 9 I use the following variables for my analyses: total count of full-time-equivalent teachers; count of first- and second-year teachers; count of certified teachers; count of teachers absent more than 10 days in a school year; total student enrollments by race; counts of students who received one or more suspensions (in-school and out-of-school) by race; counts of students who were expelled (with and without educational services) by race; and counts of students participating in GT programs by race.
I use these variables to calculate the following measures of school-level educational opportunity: proportion of teachers in a school who are experienced (i.e., not in their first or second year of teaching); proportion of teachers who are certified; proportion of teachers absent fewer than 10 days; proportion of students not involved in any disciplinary action (overall and by student race); and proportion of students participating in GT programs (overall and by student race). Each measure ranges from 0 to 1 and is constructed such that higher values correspond with more opportunity. When calculating measures of educational opportunity that consider one specific racial group, I only calculate values for schools that have at least 20 students for that group, so as to reduce the influence of small denominators.
I also include school-level third grade proficiency rates on math and ELA state standardized tests. I match areas rezoned between 2000 and 2010 to the earliest available test score data from each state: 1999–00 data from the Virginia Department of Education, 2003 data from the Maryland Department of Education, and 2006–07 data from D.C. Public Schools. 10 I match areas rezoned between 2010 and 2020 to 2009–10 EdFacts data. Because standardized tests and proficiency cutoffs vary by state, I do not draw conclusions based on comparisons of proficiency rates across states. Rather, I am focused on the variation that exists within school districts and on how AZBs sort children among schools within their district.
Methods
Research Question 1
I begin by identifying all rezoned raster cells, or cells that fall within a different AZB at the beginning and end of each decade. To answer my first research question, I aggregate the populations of those cells and calculate the proportion of children from each racial group who live in such areas. I also separately flag areas rezoned following school closure (i.e., areas whose formerly zoned school no longer existed by the end of the decade) and those rezoned to newly opened schools (i.e., areas whose newly zoned school did not exist at the beginning of the decade). After assessing how many children are affected by rezoning overall, I focus the remainder of the analyses on just those children living in rezoned areas, who constitute 12% to 20% of the total child population in the decades I study.
Research Question 2
To answer my second question, I estimate the travel time from the center of each raster cell to its zoned school using the OSRM API, a routing service based on OpenStreetMap data. 11 I assign the calculated travel time to every child living within the raster cell and then calculate changes in travel time for those living in areas affected by rezoning. The OSRM API accounts for road networks, making estimated travel times more meaningful than straight-line distance; however, it does not account for traffic patterns. The OSRM data is also based on current day road networks, meaning my calculated travel times for 2000 are based on the 2020 OpenStreetMap. While this is not historically accurate, it eliminates any differences in travel time over the decades that would be caused by changes in road networks. Instead, any differences in travel time from one decade to the next are due to a change in AZBs or school location. Lastly, estimated travel times assume all children drive from the center of their home raster cell to their zoned school; they do not account for district-provided busing, public transportation, walking, or other modes of transit. But they provide an informative estimate of a factor that meaningfully affects children’s educational experiences.
I estimate a linear regression model to understand the overall correlation between a rezoned child’s race and their corresponding change in travel time, while controlling for school district, decade, and type of rezoning (i.e., rezoned following school closure, rezoned to newly opened school, or rezoned among existing schools). Race is a categorical variable, with white as the omitted reference group:

I also descriptively analyze average changes in travel time disaggregated by child’s race, school district, decade, and type of rezoning in order to pinpoint particular areas of inequality.
Research Question 3
For the final research question, I link each rezoned child to the school-level opportunity variables at their newly zoned school. I estimate fractional logit regressions with a logistic link to understand the association between a rezoned child’s race and the opportunities available at their newly zoned school. I use a fractional regression model because it most appropriately captures the nonlinear nature of my outcome variables, which are each continuous variables bounded between 0 and 1 (Papke & Wooldridge, 2008; Xu et al., 2021). For each outcome variable Yi,s, or indicator of school-level opportunity at a child i’s newly zoned school s, I estimate two separate models. Both models control for school district, decade, and type of rezoning. The control for school district is particularly important given AZB changes cannot rezone children to schools outside their district. Rather, a child’s access to opportunity is constrained by the variation that exists within their district. The second model includes an additional control for the opportunity level at the child’s previously zoned school, s-1, calculated as a standardized continuous variable. For example, when examining how race predicts the proportion of experienced teachers at a child’s newly zoned school, I control for the proportion of experienced teachers at the child’s formerly zoned school. This model is estimated as follows:

To aid interpretation, I present the average marginal effect of each predictor, or the average difference in a school’s predicted opportunity level given a race variable turns from 0 to 1 or given a one standard deviation increase in the formerly zoned school’s opportunity level.
To the extent possible, this analysis compares children rezoned in each decade to school opportunity measures measured at the beginning of that decade. In other words, for children rezoned between 2000 and 2010, I assess the opportunity available at their formerly- and newly-zoned schools using data from 2000. For children rezoned between 2010 and 2020, I assess the opportunity at their formerly and newly-zoned schools using data from 2010. This best reflects the fact that during rezoning, public discussions of school quality rely on historical data. It also eliminates the possibility that rezoned children will themselves come to partially shape the opportunity measures (at least those that measure something about students) at their newly-zoned schools. The one exception is in the case of 2000s test score data which come from 2003 for Maryland schools and 2006 for D.C. schools. I repeat my analyses excluding those observations to ensure my results are robust to this timing issue. Finally, because I use school opportunity data from years prior to rezoning, analysis for the third research question excludes children rezoned to newly built schools. Newly built schools do not have opportunity data measured until they are open and serving the students that have been zoned to attend them.
Findings
Overall Rates of Rezoning
Rezoning is often perceived as an unpopular policy, and one that imposes some level of burden on affected families (McMillan, 2018). Thus, I begin by measuring who exactly is most affected by rezoning within my sample. I find that 18.3% of all residents aged 0 to 17 and living in the D.C. metro in 2000, or about 224,000 children, lived in areas affected by an elementary school rezoning between 2000 and 2010 (see Table 2). About 12% of all children in the 2010 census, or nearly 166,000 children, lived in areas that experienced a rezoning between 2010 and 2020. Again, these figures do not represent the number of actual elementary school students who were rezoned; rather, they provide a proxy of who is affected by AZB changes. They also do not speak to the frequency of rezoning, but instead capture aggregate changes made in each decade. 12
Proportion of Children Aged 0 to 17 Living in Areas Affected by Rezoning, by Race, Decade, and Type of Rezoning.
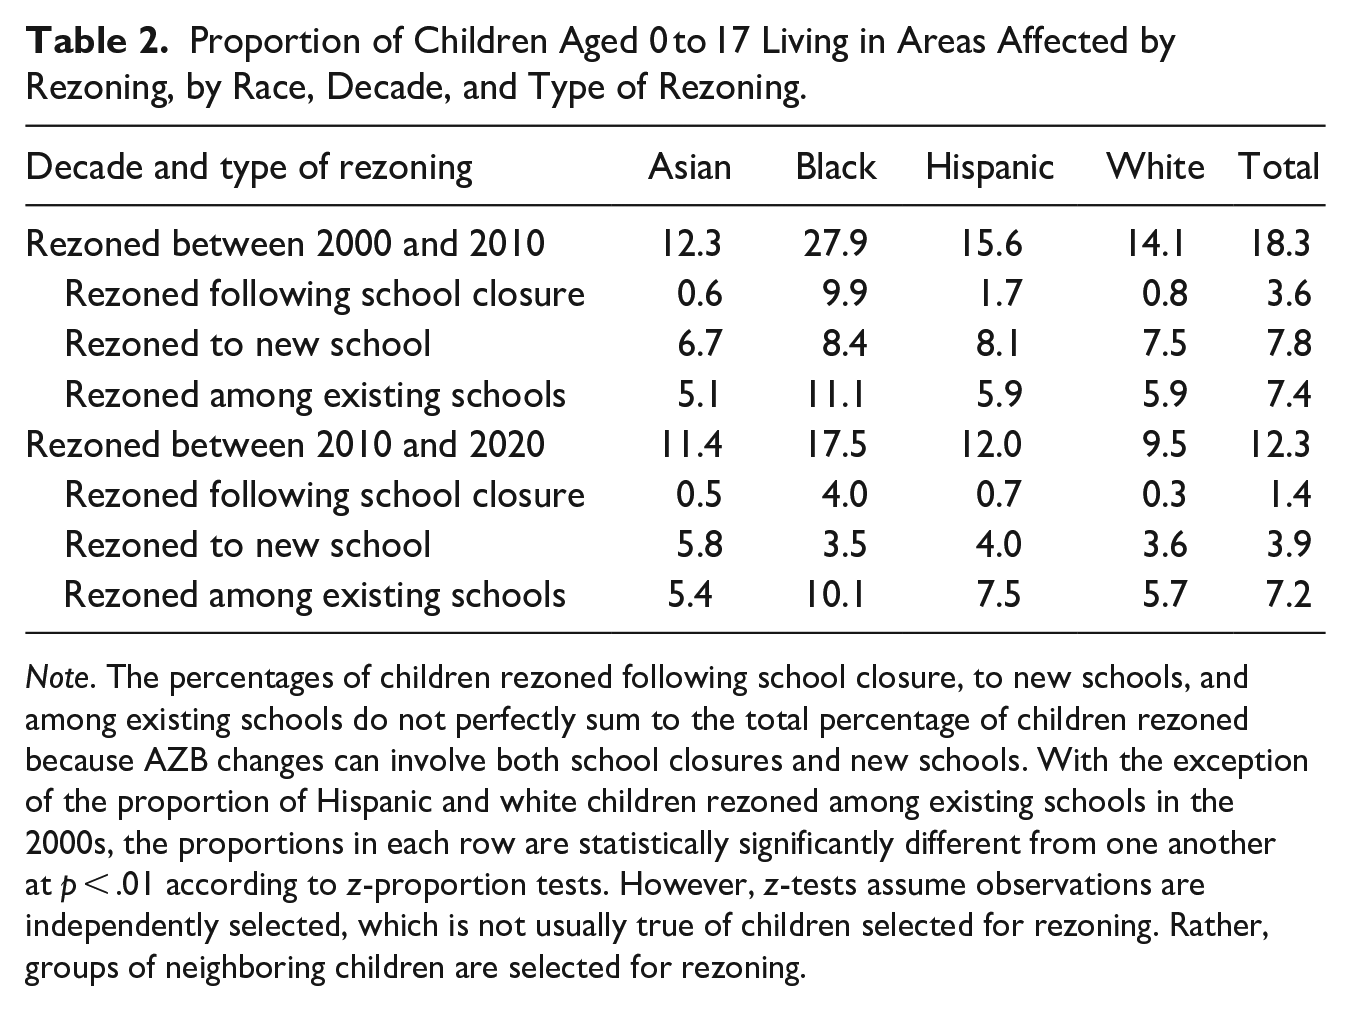
Note. The percentages of children rezoned following school closure, to new schools, and among existing schools do not perfectly sum to the total percentage of children rezoned because AZB changes can involve both school closures and new schools. With the exception of the proportion of Hispanic and white children rezoned among existing schools in the 2000s, the proportions in each row are statistically significantly different from one another at p < .01 according to z-proportion tests. However, z-tests assume observations are independently selected, which is not usually true of children selected for rezoning. Rather, groups of neighboring children are selected for rezoning.
Unsurprisingly, these overall numbers mask stark differences by racial group. In both decades, Black children are disproportionately over-affected by AZB changes. In the 2000s, 28% of Black children were affected by rezoning, compared to 14% of white children, 12% of Asian children, and 16% of Hispanic children. Though rezoning was less common overall in the 2010s, patterns of racial inequality are similar, with Asian children experiencing the lowest rates of rezoning and Black children experiencing the highest rates. While it is well documented that Black students were disproportionately rezoned during the decades of court-ordered desegregation (Orfield & Frankenberg, 2013; Woodward, 2011), the current findings demonstrate the persistence of that inequality amid political processes governing AZB changes.
I also disaggregate rezoning into three specific types of rezoning: rezoning following school closure, rezoning to a new school, and rezoning among existing schools. Results here also demonstrate stark differences across racial groups, especially with respect to school closures. In the 2000s, 10% of Black children were rezoned following a school closure, compared to less than 1% of Asian or white children, and less than 2% of Hispanic children. In the 2010s, 4% of Black children were rezoned following a school closure, compared to less 1% of white, Asian, or Hispanic children. This finding aligns with previous research documenting how predominantly Black schools are disproportionately closed (Ewing, 2018; Siegel-Hawley et al., 2017; Tilsley, 2017).
Black children also experience disproportionate rates of rezoning among existing schools. Like other types of rezoning, rezoning among existing schools is often driven by school capacity issues and is generally perceived to be undesirable by district leadership and families. This finding suggests that non-Black families more successfully avoid—and school leaders allow them to avoid—being rezoned. Instead, the burden of rezoning among existing schools is disproportionately borne by Black children.
Rates of rezoning are a bit more similar in terms of the proportions of children by race rezoned to newly opened schools. For example, in the 2010s, Asian children were most likely to be rezoned to new schools, with 5.8% affected, compared to 3.5% of Black children, 3.6% of white children, and 4% of Hispanic children. This finding is likely related to the fact that new schools tend to open in areas with growing populations, and many places in the D.C. metro with growing populations have increasing populations of Asian and Hispanic residents. It may also be that advantaged families who exert influence over rezoning decisions are less resistant to being rezoned to a newly built school, or may even view it as desirable, resulting in the more similar rates across racial groups.
I also disaggregate findings by school district to see where within the metro rates of rezoning are most racially unequal (see Supplemental Appendix Table A1 for all results). I find D.C. Public Schools, Alexandria Public Schools, and Arlington County Public Schools have some of the largest racial gaps in rezoning rates across both decades. In D.C., AZB changes are most widespread for Black children and are driven by school closures. In fact, in the 2000s, all rezonings in this urban district were linked to school closures, which affected nearly 30% of Black children, 16% of Hispanic children, 12% of Asian children, and less than 5% of white children. Similarly, in the 2010s, D.C. Public Schools rezoned 27% of Black children, compared to 20% of Hispanic children, 18% of Asian children, and 9% of white children. Again, Black children were disproportionately affected by school closures, and Black and Hispanic children were disproportionately affected by rezoning among existing schools. In Alexandria, changes most disproportionately affected Asian students in the 2000s and all children of color in the 2010s. In the 2010s, Alexandria rezoned more than 20% of Black, Hispanic, and Asian children, compared to just 10% of white children. Arlington County also has highly disproportionate rates of rezoning, especially in the 2000s and especially for Black children; 21% of Black children were rezoned between 2000 and 2010, compared to less than 7% of Asian and Hispanic children, and less than 4% of white children.
While the urban school districts at the center of the metro generally had the most racially disproportionate rates of rezoning, I also find that over the two decades of study, the prevalence of such disproportionately expanded to affect more suburban districts, including outer-ring suburban districts (see Figure 1). 13 In the 2010s, Asian, Black, and Hispanic children were all affected by higher rates of rezoning compared to white children in eight school districts, including Prince George’s County, Frederick County, Charles County, Fairfax County, Prince William County, and Stafford County, in addition to D.C. and Alexandria. These are all school districts experiencing some degree of racial diversification, and the disproportionate rates of rezoning are concerning.
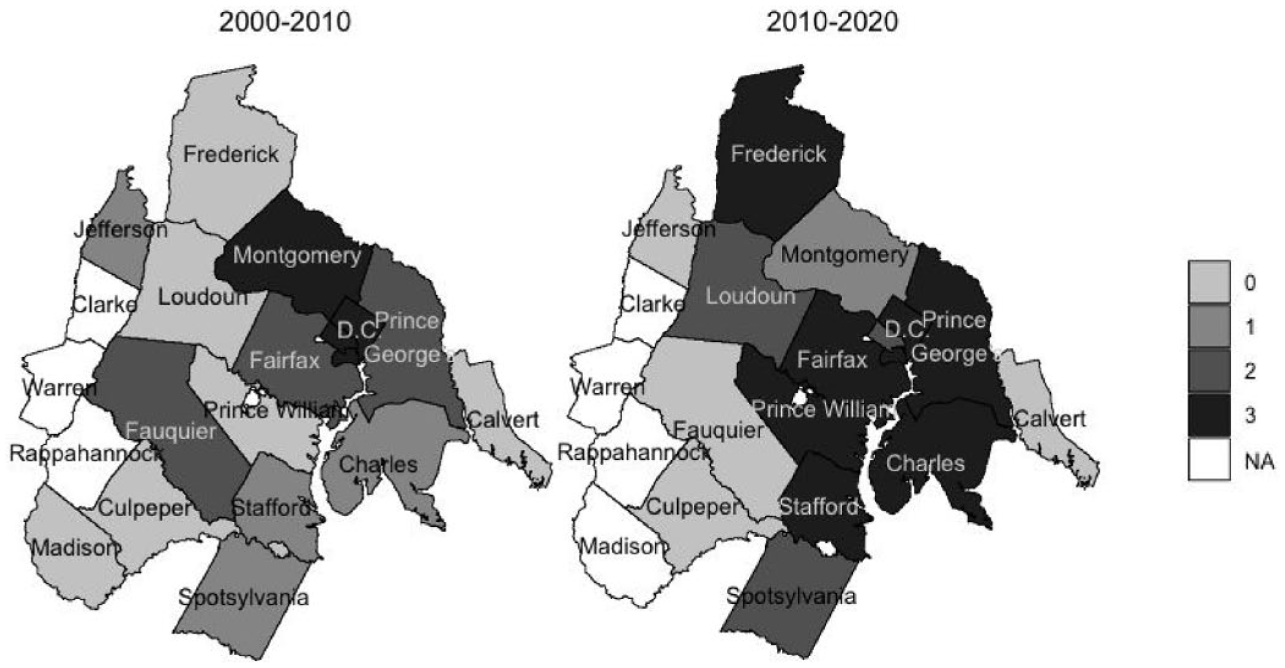
Number of racial groups who experience higher rates of rezoning compared to white children, by school district and decade.
Overall, analyses in response to the first research question clearly demonstrate racial inequality in terms of exposure to rezoning and geographic expansion of that inequality over time. While the remaining analyses focus only on children who live in rezoned areas, it is important to begin with the understanding that rezoning does not affect all children at equal rates.
Rezoning and Travel Time
Next, I turn to assess how AZB changes affect children’s home-to-zoned-school travel time. Across the study period, the average child in this sample has about a 6-min travel time to their zoned school. White children have the longest average travel times. In 2020, the average white child had a 7-min travel time, compared to 5.4 min for Asian children, 5.2 min for Black children, and 5 min for Hispanic children. These findings reflect the fact that white children are more likely than other groups to live in districts at the edge of the metro, where schools are spaced further apart. In fact, average home-to-zoned school travel times increase evenly as one moves away from the metro’s urban core.
When rezoned, the average child’s travel time changes by less than 1 min. But this masks heterogeneity by type of rezoning (following closure, to newly opened school, or among existing schools), by decade, by school district, and by the child’s race. To estimate the overall correlation between a rezoned child’s race and their change in travel time, I first estimate an OLS regression. Holding school district, decade, and type of rezoning constant, I find that rezoned children of color experience larger changes in travel time compared to their rezoned white peers. More specifically, the average rezoned Asian child experiences a change in travel time that is 0.14-min, or about 8 s, greater than that experienced by a rezoned white child. Rezoned Black children experience a 0.17-min larger change in travel time, and rezoned Hispanic children experience a 0.47-min larger change in travel time. All three coefficients are significant at p < .001, though this is largely driven by the large sample size.
Overall, travel time changes following rezoning are small in magnitude given these are elementary schools, which tend to be located close to children’s homes. The magnitude of change is likely to be greater, and perhaps more racially unequal, at the middle or high school levels. Furthermore, many districts may formally consider travel times when rezoning; for example, they may want to limit their transportation costs by maximizing the number of children who live within walk-zones (usually about 1–1.5 miles at the elementary level). This constraint, while likely driven by economic concerns, may also be limiting the magnitude of the inequalities we see in elementary travel times.
Further descriptive analyses help identify particular places of inequality (see Supplemental Appendix Table A2). I find that average travel time changes following rezoning were generally larger and more racially disparate in the 2010s than in the 2000s. Certain types of rezoning also lead to disproportionately larger changes in travel time for certain groups. For example, being rezoned to a newly opened school led to decreases in travel time for Asian, Black, and white children in the 2010s, but it led to an average increase of about 0.16-min in travel time for Hispanic children. While it makes sense that the construction of additional schools led to reduced travel times for most rezoned children, the findings with respect to Hispanic children suggest new schools are placed further away from neighborhoods with Hispanic residents. This aligns with findings from the study of rezoning in Wake County, NC, where researchers also found that Hispanic students were disproportionately rezoned to new schools built further away from their homes (Domina et al., 2021).
Average results are also driven by where in the metro children of different races are most likely to live, so I also consider the results disaggregated by school district. Similar to the results for research question one, results here also suggest that instances of racially unequal travel time changes expanded outwards during this time period to affect districts located further out in the metro. In the 2000s, the school districts with the most unequal travel time changes by race included D.C., Alexandria, Arlington County, Prince George’s County, and Montgomery County—all districts located toward the center of the metro. By the 2010s though, racially unequal travel time changes also took place in Frederick, Fairfax, Loudoun, Prince William, Stafford, and Fauquier Counties. In many of those districts, results are particularly unequal for rezonings following new school openings, and to some extent, rezonings among existing schools, both of which are related to the growing and diversifying populations within these suburbs.
Overall, in response to the second research question, I find that compared to white children, children of color experienced disproportionately larger changes in home-to-zoned-school travel times following a rezoning, though differences are relatively small in magnitude. Concerningly, racial inequalities expanded outwards geographically during the period of study, suggesting that as outer-ring suburban areas continue to diversify, AZB changes are producing greater inequality in the form of longer travel times.
Rezoning and Access to Opportunity
Turning to the final research question, I begin with a descriptive look at various school-level opportunity measures (Table 3). Mean values for all zoned elementary schools in the D.C. metro (the full sample) provide a sense of how schools are doing on each measure of educational opportunity and how they have changed over time. For example, average teacher certification rates rose between 2000 and 2010, as did rates of student participation in GT programs. The mean values also demonstrate stark racial disproportionalities within this metro, mirroring consistently documented national trends. For example, Black and Hispanic students have lower rates of GT enrollment compared to their white and Asian peers in both decades. Black students have the lowest rates of non-discipline; rates are even lower in 2010 compared to 2000.
Summary Statistics on School-Level Opportunity Measures, by Decade.
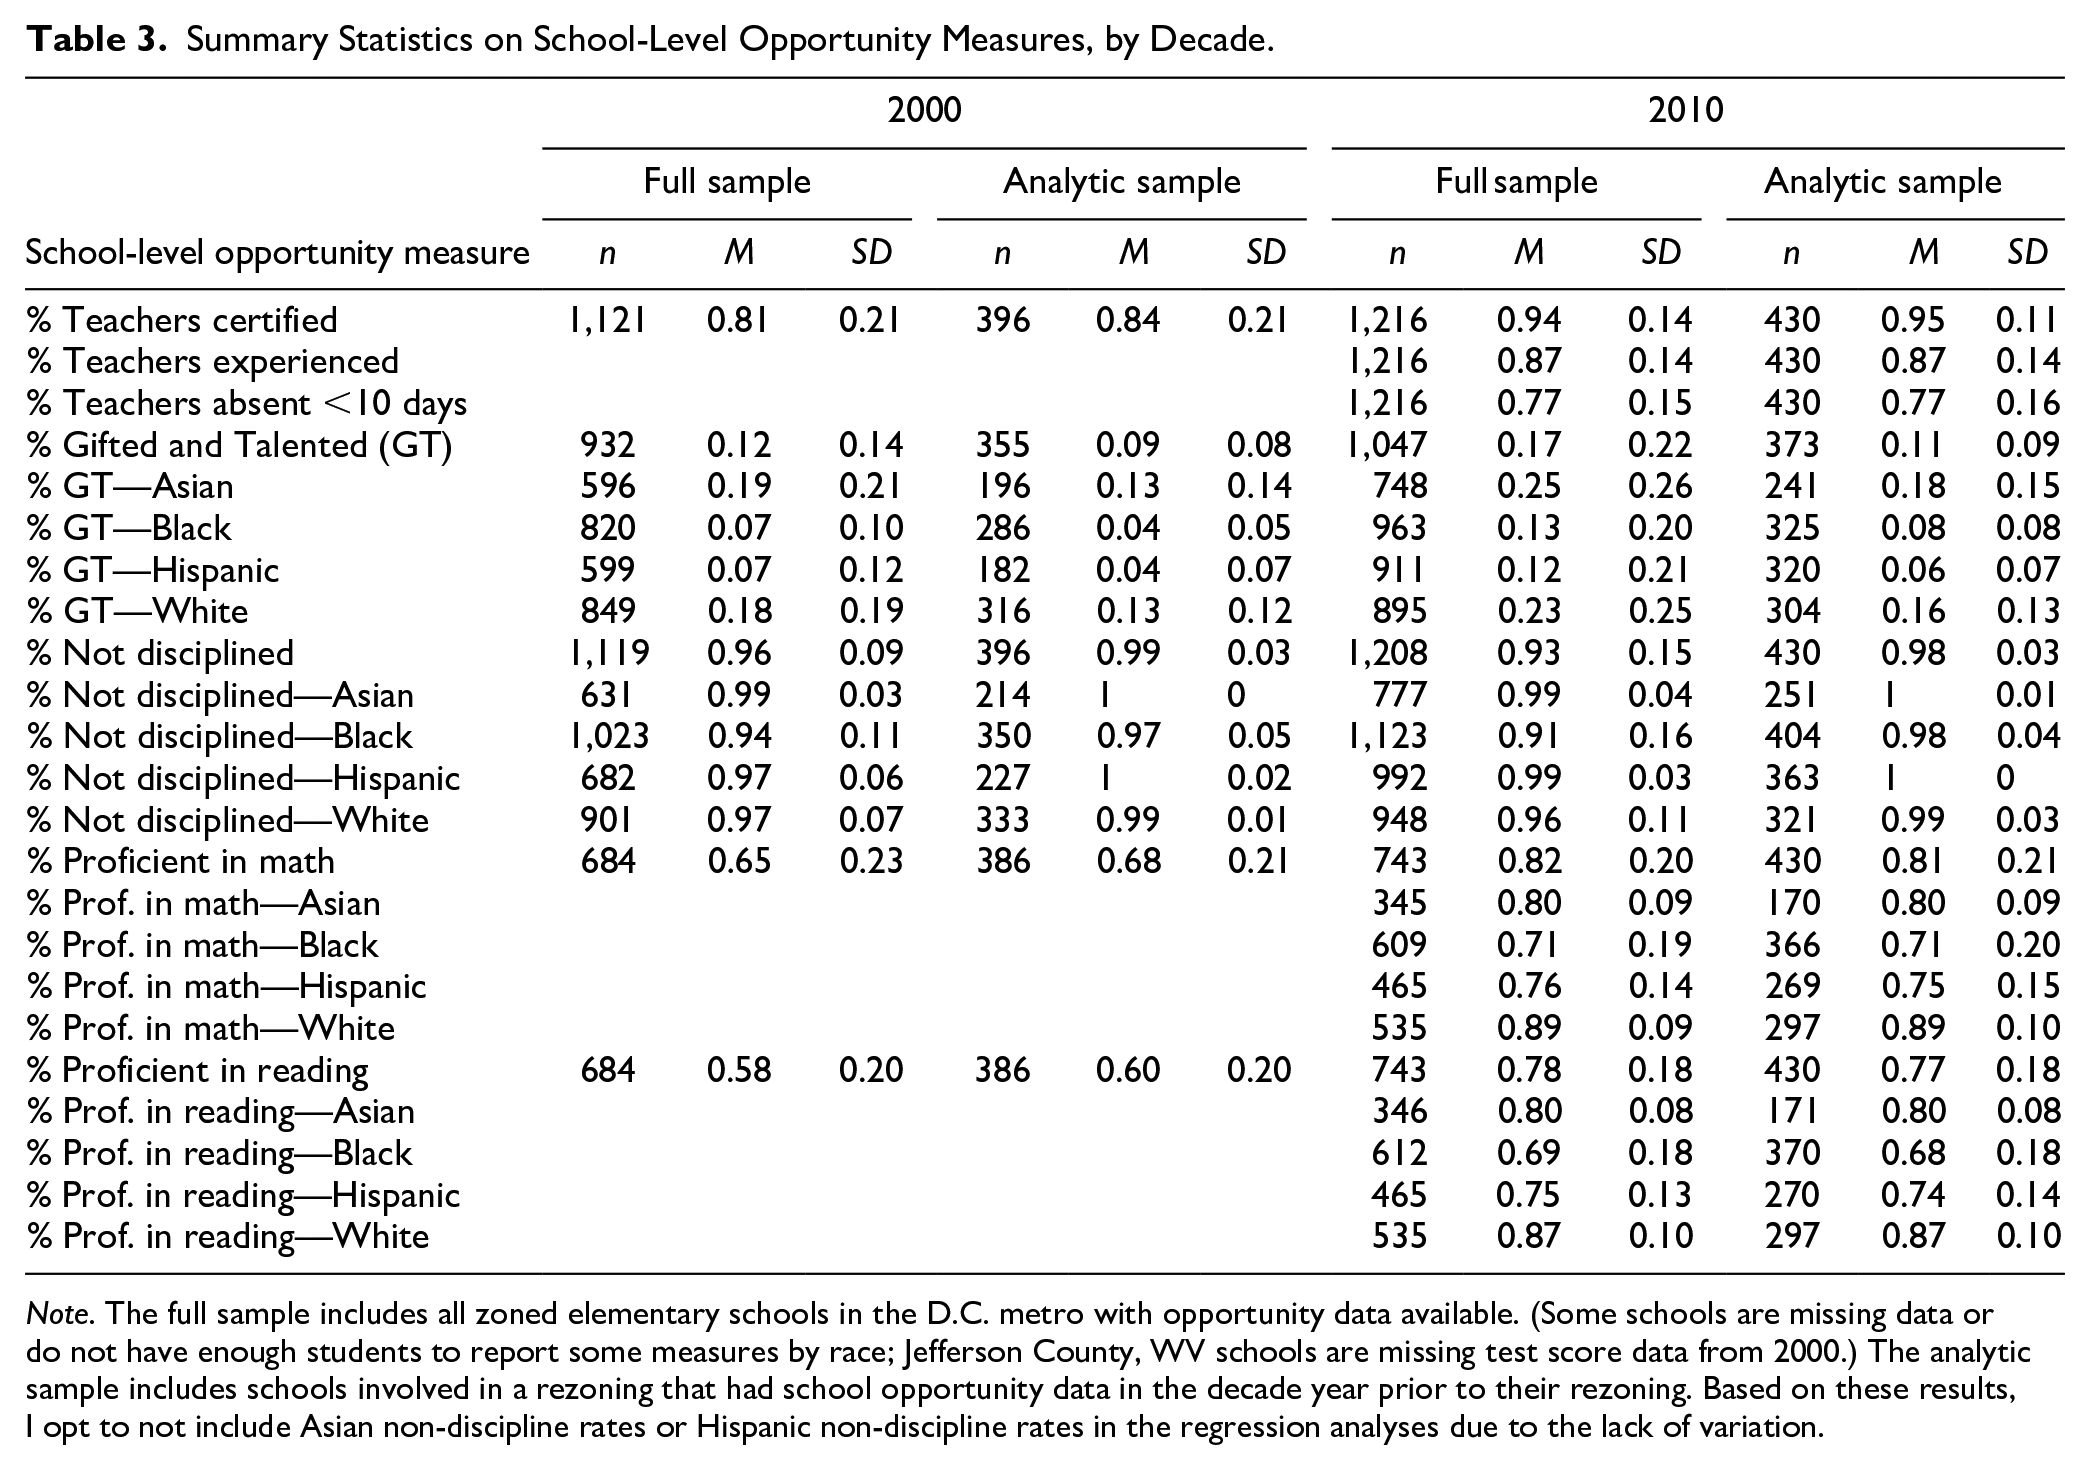
Note. The full sample includes all zoned elementary schools in the D.C. metro with opportunity data available. (Some schools are missing data or do not have enough students to report some measures by race; Jefferson County, WV schools are missing test score data from 2000.) The analytic sample includes schools involved in a rezoning that had school opportunity data in the decade year prior to their rezoning. Based on these results, I opt to not include Asian non-discipline rates or Hispanic non-discipline rates in the regression analyses due to the lack of variation.
Summary statistics for just those schools affected by AZB change (the analytic sample), generally mirror those for the full sample. In particular, the standard deviations of the analytic sample demonstrate nearly as much variation as those for the full sample, for most measures of opportunity. This indicates AZB changes affect schools across the opportunity spectrum. (Two measures of opportunity—non-discipline rates for Asian students and Hispanic students—have essentially no variation within the analytic sample; thus, I do not include them in the following analysis.) Of course, the standard deviations in Table 3 speak to variation across school districts as well as to variation within districts. The analyses that follow control for school district in order to account for the fact that rezoned children only have access to the realm of opportunity that exists within schools in their own district.
To answer my third research question, I estimate logistic regression models to predict the educational opportunity available at a child’s newly zoned school. A child’s race serves as the independent variable of interest, and I control for school district, decade, and type of rezoning (rezoned among existing schools or rezoned following school closure). For each opportunity outcome, I also estimate a second model with an additional control for the opportunity available at a rezoned child’s prior school.
Results consistently show that compared to rezoned white children, rezoned Black and Hispanic children are assigned to schools with lower levels of educational opportunity (Table 4). Results are more mixed for rezoned Asian children, but they also show instances in which Asian children are assigned to schools with less opportunity. It is not surprising that results are so consistent across opportunity outcomes; many of these variables are related to one another (Shores et al., 2020). But to see such consistent results across the board tells a powerful story about the role AZB changes play in perpetuating unequal access to educational opportunity. Of course, AZBs and their changes are not the only factor that perpetuate these longstanding inequalities. AZBs operate within larger educational and housing contexts, but these findings demonstrate how AZB changes are associated with the persistence of educational inequality.
Regression Estimates Predicting Opportunity Level at a Rezoned Child’s Newly Assigned School, by Child’s Race.
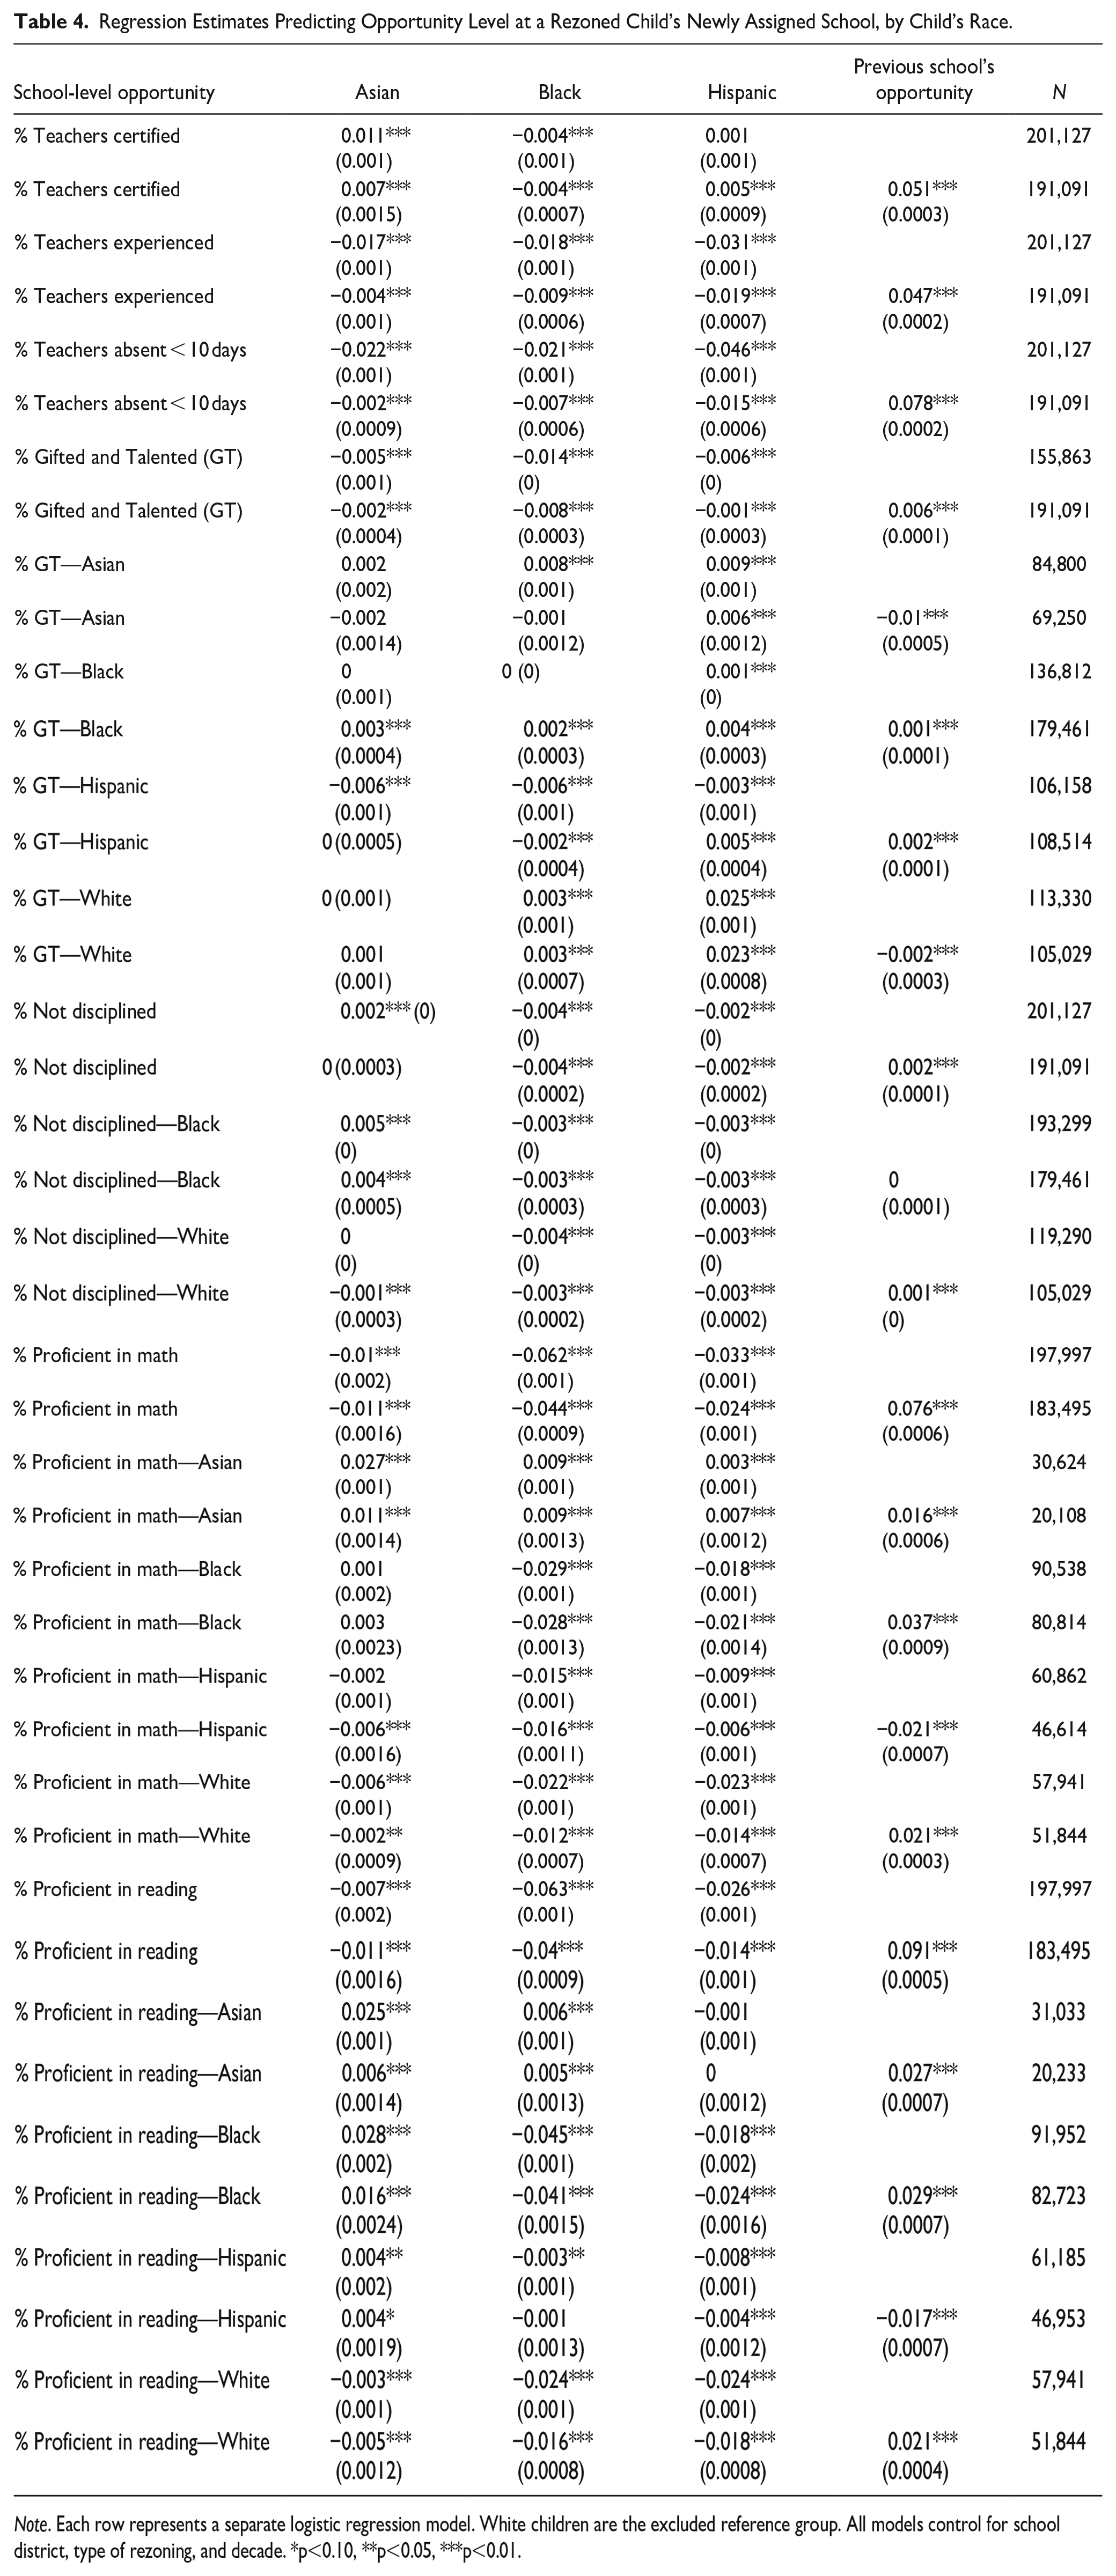
Note. Each row represents a separate logistic regression model. White children are the excluded reference group. All models control for school district, type of rezoning, and decade. *p<0.10, **p<0.05, ***p<0.01.
Across most every metric of opportunity, the opportunity at a child’s previously zoned school is a significant and positive predictor of the opportunity at their newly zoned school. This indicates that children who were previously zoned to schools with higher opportunity levels are then also rezoned to schools with higher opportunity levels. Exceptions include the models predicting math and reading proficiency rates for Hispanic students: in those cases, children formerly zoned to schools with higher Hispanic proficiency rates are rezoned to schools with slightly lower Hispanic proficiency rates. They also include the models predicting GT participation rates among Asian students and among white students.
Importantly though, despite the significance of the additional control in most models, a rezoned child’s race remains a significant predictor of the opportunity available at their newly assigned school. While the significance of the opportunity at a child’s previously assigned school indicates that AZB changes reinforce existing inequality of access to opportunity, the enduring significance of a child’s race as a predictor indicates that AZB changes also worsen inequality, a critical finding that demonstrates the clearly disparate impacts of rezoning.
More specifically, results show that compared to rezoned white children, rezoned Hispanic, Asian, and Black children are each rezoned to schools with statistically significantly lower opportunity in terms of teacher variables, though coefficients are generally small. The largest coefficients show rezoned Hispanic children are rezoned, on average, to schools with lower teacher experience rates (two percentage points in the model controlling for previous school’s opportunity) and lower teacher attendance rates (1.5 percentage points). Black children are rezoned to schools with slightly lower teacher certification rates.
Coefficients are also generally small for the models predicting GT participation and non-discipline rates at children’s newly assigned schools. This reflects the relatively low variation among those measures within this sample (see Table 3). However, results remain statistically significant, likely due in part to the high numbers of children affected by rezoning. Hispanic, Black, and Asian children are all rezoned to schools with lower GT participation rates overall, though Hispanic children are rezoned to schools with slightly higher Hispanic GT participation rates, and Black children are rezoned to schools with slightly higher Black GT participation rates. This may be related to patterns of racial segregation that are partially created and reinforced by AZBs. For example, predominantly Black schools may be more likely to have higher rates of Black students participating in GT programs, and they also may be more likely to receive newly rezoned Black students. In terms of non-discipline rates, Black and Hispanic children are both rezoned to schools with lower non-discipline rates compared to their rezoned white peers. Black children are also rezoned to schools with lower non-discipline rates for Black students specifically.
Of all the models I estimate, those predicting tests scores have the largest coefficients, reflecting the wide variation in school-level proficiency rates. Asian, Black, and Hispanic children are all rezoned to schools with lower average math proficiency rates compared to the schools to which white children are rezoned. The effect is particularly large for Black children: controlling for math scores at their previously zoned school, rezoned Black children are assigned to schools with math proficiency rates that are 4.4 percentage points lower than those at the schools to which white children are rezoned. Additional models predict math proficiency rates for specific groups of students and demonstrate particular inequalities affecting Black and Hispanic children. While Asian children are rezoned to schools with slightly higher Asian math proficiency rates than the schools to which white children are rezoned, Black and Hispanic children are rezoned to schools with lower math proficiency rates for their respective groups. Results are very similar in terms of reading proficiency rates. The coefficient sizes in models predicting test scores suggest the continued salience of these measures during rezoning.
Discussion and Conclusion
While a wealth of research to date has documented stark racial inequalities in terms of students’ travel times to school and access to schools with varying degrees of educational opportunity, the current study demonstrates the role AZB changes play in perpetuating these inequalities. In fact, analyses show that AZB changes not only reinforce existing patterns of inequality, they can also contribute to deepening inequalities.
Overall, Black children are disproportionately rezoned compared to other groups. Rezoned children of color—especially Hispanic children—experience larger changes in travel time compared to rezoned white children. Black and Hispanic children are also consistently rezoned to schools with fewer educational opportunities. These findings generally align with those of Domina et al. (2021), the most similar study to date. The authors of that study also found that rezoned Hispanic children in Wake County Public Schools, NC were zoned to schools further away and that Black children were rezoned to schools with lower math achievement.
My findings also demonstrate that Asian children in the D.C. metro experience some disproportionate outcomes related to rezoning, though results are a bit more mixed than those for Black or Hispanic children. Previous literature shows that in some school districts, Asian residents with social capital will advocate for AZB changes to protect their educational advantages in ways similar to white residents (Goldstein, 2019; Lung-Amam, 2023). The current findings do suggest Asian children are, on the whole, rezoned to schools with more educational opportunities than those to which Black and Hispanic children are rezoned. However, in some cases, Asian children in my sample also experience disproportionate rates of rezoning and increases in travel time. These findings are especially prevalent following rezonings to new schools and in school districts where the Asian population is growing, suggesting that Asian residents in such growing, diversifying school districts may be particularly likely to face unequal outcomes as a result of rezoning.
In fact, my findings suggest that instances of racially unequal rezoning and unequal outcomes of rezoning have expanded geographically outwards in the D.C. metro since 2000. In the most recent decade, I find growing inequality in further-out suburban districts, where populations are growing and racially diversifying. This aligns with previous research suggesting that school districts experiencing diversification, often suburban districts, are ripe for political efforts that undermine equal access to educational opportunity, specifically through the drawing of exclusionary AZBs or other student assignment policies (Diem et al., 2014; McDermott et al., 2015). Leaders in these places may be particularly wary of upsetting long-time white residents by rezoning them at all, rezoning them to farther away schools, or rezoning them to schools with fewer educational opportunities. In particular, educational leaders may fear white families will exit the district if subjected to unfavorable student assignment policies (Frankenberg & Kotok, 2013). While such trends have recently been studied in inner-ring suburban districts (e.g., Author, 2023), the current research suggests these trends may be affecting outer-ring suburbs as well. Of course, the D.C. metro is somewhat unique in that the majority of its school districts are countywide and have great potential for within-district sorting. However, the findings here emphasize the overall need to pay attention to the interaction between demographic shifts and student assignment policy decisions in outer-ring suburban school districts around the country. There is also opportunity for future research to focus on the politics and outcomes of rezoning in school districts experiencing gentrification. There, incoming white and affluent populations may exert power over rezoning decisions to benefit their own children, or they may utilize school choice options to avoid the zoned public schools.
These results are particularly important given the arguments that advantaged, oftentimes white, parents make in support of their desired AZB changes. Literature on the politics of AZB change emphasize how such parents use race-evasive language about travel times or school quality during public discussions of AZB change (e.g., A. J. Castro et al., 2022; Lareau et al., 2018; Wiley et al., 2012). While stakeholders rarely admit their concerns are racially motivated, scholars have demonstrated how such race-evasive, often racially coded, concerns can lead to segregative AZB changes. The current study further documents how AZB changes, at least in this sample, are also associated with racially disparate outcomes in terms of exposure to rezoning, travel time changes following rezoning, and access to educational opportunity.
Moreover, these results help counter arguments made by those who pointed to unequal impacts of formal desegregation plans (e.g., disproportionately long bus rides for Black students) as a rationale to abandon such efforts (Orfield & Eaton, 1996). In showing that the outcomes of contemporary rezoning remain highly unequal, these findings suggest we instead return to more explicit consideration of racial segregation and inequality within our school districts. As long as rezoning continues to reinforce unequal access to opportunity, it will deepen the long-standing educational debt we owe to racially marginalized children (Ladson-Billings, 2006).
Recommendations
In the current era of race-evasive education policy, it is critical to understand how rezoning processes reinforce and exacerbate racial inequality. While many rezoning processes focus on technical issues of school capacity or travel times to school, this study clearly demonstrates the effects of rezoning are racially disparate. School district leaders responsible for (re)drawing AZBs must keep this in mind when making rezoning decisions. Rezoning remains one of the most prevalent ways students are sorted and given access to schools of variable opportunity, but it will require intentionality to use rezoning to advance racial equity.
To that end, school district leaders should explicitly consider how proposed AZB changes will affect different groups of students. Scholars have written about how AZB change processes should be guided by explicit, measurable goals around the racial composition of schools (A. Castro et al., 2024; Siegel-Hawley et al., 2021). Studies have also shown that goals for racially diverse schools can be accomplished alongside other goals, such as minimizing travel times or numbers of rezoned children (Gillani et al., 2023; WXY Architecture + Urban Design, 2021). Relatedly, leaders should also establish specific goals around ensuring rezoning does not disproportionately affect certain groups, zone them to farther schools, or zone them to schools with fewer educational opportunities. Leaders should be especially cognizant of and resist arguments by powerful stakeholders that, if honored, may further exacerbate inequality. Rather than allow public discussion to rely on coded, race-evasive language, leaders should position rezoning as an opportunity to dismantle existing inequalities of opportunity. Of course, districts should also continue working to increase educational opportunities in all schools, but given inevitable constraints on resources, rezoning can help districts pursue racial equity.
Finally, district leaders should work to make their AZB data, both contemporary and historical, more readily available to the public. To date, the lack of systematic historical data on these locally determined boundaries has hampered research on the effects of their change (Author, 2022). Greater transparency around AZBs and AZB change will allow for better understanding among researchers, school leaders, and community members about how these invisible boundaries shape access to educational opportunity. For example, as the LSABS dataset continues to develop, analyses similar to those presented here will be possible in other regions of the U.S. Future work can also further disentangle how AZB changes have intersected with other recent trends, such as the shifting sociopolitics of specific places or the growth of school choice options. Documenting inequalities exacerbated by AZB change is the first step toward addressing them (National Academies of Sciences, Engineering, and Medicine, 2019).
Supplemental Material
sj-docx-1-epx-10.1177_08959048241271370 – Supplemental material for Rezoning Educational Opportunities: The Relationship Between School Attendance Zone Boundary Changes and Access to Schools of Varying Quality
Supplemental material, sj-docx-1-epx-10.1177_08959048241271370 for Rezoning Educational Opportunities: The Relationship Between School Attendance Zone Boundary Changes and Access to Schools of Varying Quality by Sarah Asson in Educational Policy
Footnotes
Acknowledgements
The author thanks both for their guidance throughout this project.
Author’s Note
This research was made possible by the generous sharing of data from the Longitudinal School Attendance Boundary Survey, led by Drs. Erica Frankenberg and Christopher S. Fowler at Pennsylvania State University.
Declaration of Conflicting Interests
The author declared no potential conflicts of interest with respect to the research, authorship, and/or publication of this article.
Funding
The author disclosed receipt of the following financial support for the research, authorship, and/or publication of this article: This research was supported by a grant from the American Educational Research Association which receives funds for its “AERA-NSF Grants Program” from the National Science Foundation under NSF award NSF-DRL #1749275. Opinions reflect those of the author and do not necessarily reflect those of AERA or NSF.
Supplemental Material
Supplemental material for this article is available online.
Notes
Author Biography
References
Supplementary Material
Please find the following supplemental material available below.
For Open Access articles published under a Creative Commons License, all supplemental material carries the same license as the article it is associated with.
For non-Open Access articles published, all supplemental material carries a non-exclusive license, and permission requests for re-use of supplemental material or any part of supplemental material shall be sent directly to the copyright owner as specified in the copyright notice associated with the article.