
Abstract
Accountability efforts under the Every Student Succeeds Act (ESSA) has brought greater attention to school-level processes and practices and their impact on student outcomes. This has pushed states to report more school-level inputs, including per-pupil expenditures. Grounded in an open systems theory (OST) framework, we identify the association between school-level per-pupil spending and academic growth on statewide assessments for seventh graders in Michigan. Overall, our findings suggest an overall positive association between school-level per-pupil expenditure and student growth.
Introduction
The demand for improved student academic performance in the United States has led to a wave of education reform efforts. The enactment of the Every Student Succeeds Act of 2015 (ESSA) continues the nation’s commitment to providing all public school children with fair and equitable educational opportunities. In general, accountability legislation aims to keep educational institutions accountable for student academic outcomes by employing performance-based measures and specific incentives and penalties (Deming & Figlio, 2016). Like its immediate predecessor, No Child Left Behind (NCLB), the ESSA legislation focuses on school accountability, test-based performance, and closing the achievement gap among student groups (Hess & Eden, 2017). However, unlike previous legislation, ESSA shifted its reform strategy to allow greater flexibility for states to design accountability systems that may include student growth measures and expanded public transparency reporting to include site-level per-pupil spending (Amerikaner, 2018). School accountability changes ignited through ESSA legislation provides optimism around flexibility in the design of state accountability systems and expectations of public transparency as drivers to support K-12 public-school reform.
Researchers are split on the value of including student growth measures or changes in knowledge over time in the design of state school accountability systems (Anderman et al., 2015). On one hand, it is suggested that student growth measures as indicators of all students’ academic progress are critically important within the school accountability context (National Research Council, 2011), while on the other hand there is concern about the ability to accurately calculate student growth through statewide assessments as a function of school/district inputs and practices (Watson, 2019). Although ESSA does not mandate the use of student academic growth as a measure of performance, growth scores are often used to acknowledge improvement compared to proficiency (Portz & Beauchamp, 2022). The uncertainty of the impact of publicly reporting school-level data has had on school reform efforts remains. Some researchers suggest that the consequences of accountability (e.g., sanctions and rewards) have a greater impact on student performance than public reporting (Hanushek & Raymond, 2005). This viewpoint is plausible, yet it is important to note that the public cares about transparency and what is happening in governmental organizations (Rauh, 2016). Although controversy has ensued over the past several decades on the approach to school accountability, the push for more robust school reform has remained of significant public interest (Deming & Figlio, 2016). One explanation is that while per-pupil spending has risen substantially over the years, the academic performance of K-12 public school students has not yielded the same result (Deming & Figlio, 2016).
While many studies have examined the association between school spending and student academic outcomes (e.g., Hanushek, 1986; Hedges et al., 2016; Jackson & Mackevicius, 2021; Plecki, 2000), research on the effects of financial resources on student academic growth as an achievement measure is greatly limited. Given the accountability landscape under ESSA, an examination of the relation between per-pupil spending and academic growth measures warrants greater attention. Therefore, grounded in an open systems theory (OST) framework (Lunenburg, 2010), the authors examine the association between per-pupil spending and student academic growth measures among middle school students on the statewide assessment program in Michigan. Specifically, using publicly accessible state-level data for 847 schools from 667 districts from the 2018 to 2019 school year, we sought to answer the following research question: To what extent is per-pupil spending associated with student academic growth in mathematics and ELA among seventh grade students?
To broaden our exploration, we extend our analysis in three ways. First, we examine academic growth measures based on three distinct indicators: (a) average student growth percentile, (b) percentage of students with average growth, and (c) percentage of students with below-average growth on the 2018–2019 Michigan statewide assessment program. Second, using school-level expenditure data, we explore whether per-pupil spending was associated with these academic growth indicators. Finally, we examine the extent to which per-pupil spending was associated with student academic growth levels when controlling for organizational elements; specifically, student sociodemographic and school-level structural characteristics.
An Open Systems Framework
We drew from Open Systems Theory related to organizations to guide our analysis and interpretation of results. Open Systems Theory posits that organizations, including school systems, are “open systems” that are responsive to external constituencies (e.g., state and federal government) to maintain legitimacy, avoid sanctions, and to garner resources (Scott & Davis, 2015). For example, to preserve specific streams of funding and avoid state intervention, local school systems are expected to efficiently utilize resources to meet state and federal accountability demands related to ESSA (Lunenburg, 2010; Scott & Davis, 2015). Improving student achievement and growth is the primary focus of ESSA, therefore there is increased focus on how local school systems utilize resources to improve their effectiveness.
At the same time, local education decisions occur within the immediate context of the internal organizational environment (e.g., school/district culture, norms, and politics), which influence how local education systems respond to policy demands and utilize resources to improve student achievement (Bidwell, 2001; Bryk & Schneider, 2002; Coburn, 2004; Meyer & Rowan, 1977). Therefore, we are guided by the understanding that all local school systems respond to policy demands and resources associated with ESSA, but that their responses vary dependent on the local context (e.g., social-organization of the school system, student demographics, and school structure [such as charter vs. traditional public school]). This highlights the importance of focusing on school-level spending and its potential relationship to student achievement growth and provides a lens for understanding possible variation in localized responses to accountability demands.
ESSA Policy Context: Flexibility of Accountability Measures
The enactment of ESSA in 2015 brought about a shift in school reform policy, granting state education agencies (SEA) broad flexibility related to school accountability measures. States remain required, as under the NCLB Act, to have a statewide accountability system for public elementary and secondary schools (Every Student Succeeds Act [ESSA], 2015). Under ESSA, however, SEAs have greater influence over the system’s design. For examples, states can self-determine school performance indicators as well as the school site-level expenditures to publicly report. A school accountability system’s design is important because it identifies the school performance measurement indicators (Figlio & Ladd, 2020) used to evaluate school quality (ESSA, 2015). The flexibility granted under ESSA suggests a more significant emphasis on local control and decision-making.
Michigan Policy Context: Use of ESSA Flexibility of Accountability Measures
The transition to student growth measures under ESSA reflects a progressive shift in educational accountability. Recent data suggests 48 states and the District of Columbia instituted student academic growth as a school accountability indictor during the 2018 to 2019 school year (Data Quality Campaign, 2019). The Michigan Department of Education (MDE) took advantage of ESSA’s flexibility provision and instituted student growth scores (Student Growth Percentile, SGPs) and growth targets (Adequate Growth Percentile, AGPs) as an accountability measure for its statewide assessment (Michigan Department of Education, 2021). SGPs and AGPs are obtained for each subject in which the student tests (e.g., ELA and mathematics) and where there is at least one previous test score for the student. The use of SGPs and AGPs are a widely accepted measure for assessing individual student learning over time and describing how much growth an individual student needs to maintain a trajectory toward reaching or maintaining proficiency (Betebenner, 2011). One key benefit of using both SGPs and AGPs is that it allows for more equitable student progress calculations (Betebenner, 2011). Michigan’s use of SGPs and AGPs in determining student growth suggests a nuanced perspective to school accountability that is focused on recognizing individual progress within a broader context, emphasizing a more holistic and tailored approach to measuring educational success.
Student Academic Growth as an Accountability Measure
Michigan’s decision to include a growth-based measure is plausible. According to the National Research Council (2011), student growth measures as indicators of all students’ academic progress are critically important within the school accountability context. Under ESSA, SEAs can self-select school accountability measures, which may include tracking student academic growth. Academic growth is defined as changes in knowledge over time (Anderman et al., 2015). That is, growth-based measures provide schools an opportunity to acknowledge student progress (Anderman et al., 2015). This feature is both theoretically and practically appealing (Betebenner, 2011) given the accountability landscape.
The ESSA provision represents a notable departure from the NCLB era of school accountability that emphasized test scores as the primary accountability metric (No Child Left Behind Act of 2001 [NCLB], 2002). Existing literature suggests that growth-based measures provide a fair and reasonable means for assessing individual school and student performance. According to Anderman et al. (2015), the benefits of student growth models include the ability to provide an unbiased view of student achievement levels due to variability in preexisting student knowledge. While existing literature suggests growth-based measures are plausible, a note of caution exists. Critical decisions about measurement must be considered. Utilizing psychometrically flawed data can have significant consequences when making individual student progress decisions (Anderman et al., 2015). Thus, the implementation of student growth measures suggests the need for SEAs to balance flexibility and caution while safeguarding decisions regarding individual student progress.
The Academic Performance of Middle School Students: A Cause for Concern
Safeguarding decisions regarding individual student progress is important, particularly at the middle school level. Students’ academic performance in middle school has garnered cause for concern for decades. Middle school grades in the United States generally comprise grades six through eight (Malone et al., 2020). Criticism related to declines in the academic performance of seventh-grade students in reading and mathematics, for example, has been highlighted in the research literature (Clark et al., 2013; Malone et al., 2020). Causal factors contributing to the decline in middle school academic performance include school social experience and grade-level configuration (Clark et al., 2013; Malaspina & Rimm-Kaufman, 2008; Schwerdt & West, 2013).
The middle school years mark a transition point for students. Studies have suggested that school accountability has improved student academic performance, but results have been more pronounced among specific subgroups, individual grades, subjects, and according to state-level accountability context (Hanushek & Raymond, 2005; Ladd, 2017). Children spend a significant amount of time in school (Fazel et al., 2014). As such, schools play a key role in child development. Given the longstanding concern related to the academic performance of middle school students, a view of how students’ learning progresses over time is attractive as a metric of academic progress.
Michigan’s Academic Growth Measure: A 7th Grade Perspective
In the 2018 to 2019 school year, an estimated $13 billion was spent on K-12 public education in Michigan (Summers, 2019), yet over 50% of seventh grade students failed to demonstrate average growth in mathematics and English Language Arts (ELA) on the statewide assessment (Michigan’s Center for Educational Performance & Information, 2021). Michigan’s summative student assessments are required under state law (Michigan Department of Education, 2021). As noted earlier, the MDE made use of ESSA’s flexibility provision and instituted grow-based measures as a school accountability indicator for student assessments beginning with the 2018 to 2019 school year. Michigan’s statewide summative assessment is administered to traditional public and charter school students in grades three through eight. During the 2018 to 2019 school year (the focus of this study), seventh-grade students were assessed in ELA and mathematics. From the growth-based data collected, state education officials could rank students in each comparable group based on their current assessment. Each student received a percentile ranking comparing their scores to other students who scored similarly academically (Michigan Department of Education, 2021). Michigan’s student growth model also includes students’ ability to obtain growth-based data for each subject in which the student tests (e.g., ELA and mathematics) and where there is at least one previous test score for the student (Michigan Department of Education, 2021). In essence, the focus on seventh-grade students in Michigan’s implementation of growth-based measures under ESSA sheds light on the state’s commitment to assessing academic progress during a pivotal stage of students’ educational experience.
Michigan’s Approach to School Finance
The discussion on school accountability is often paired with discourse on school funding. Implementation of ESSA policy heightens the conversation as accountability and site-level spending transparency are at the core of the federal legislation. As such, we spend the next section briefly discussing Michigan’s school finance system.
In 1994, Proposal A, or the Michigan School Finance and Tax Reform Amendment, significantly shifted the state’s school funding system. Prior to 1994 local property taxes were the primary source for funding public schools (Arsen et al., 2019) and disparities in funding existed across the state. Proposal A aimed to address property tax disparities among school districts and ensure more equitable funding for public education (Arsen et al., 2019). The key features of Proposal A included reducing local property taxes for school funding, establishing a statewide education property tax, and a per-pupil funding formula to allocate resources more fairly among school districts (Arsen et al., 2019; Papke, 2008). While this ambitious reform narrowed spending disparities by increasing per-pupil allocation in the state’s lowest spending districts, it failed to eliminate spending gaps completely (Arsen et al., 2019).
Today, Michigan continues its efforts to even the playing field by decreasing funding disparities among its public schools. For example, the minimum per-pupil allocation for schools in the 2018 to 2019 school year was just short of $8,000, whereas the 2023-24 school year saw a funding increase hovering just over $9,500. A more nuanced approach to school funding exists for high-income districts. That is, higher-income districts can also leverage local property tax to bolster operational revenue so that they can maintain their current levels of spending and not be impacted by funding equalization that would result in them receiving a decrease in per-pupil spending amounts.
The continued changes to Michigan’s school finance system suggest the state’s commitment to even the playing field by decreasing funding disparities among its public schools. This commitment aligns with ESSA’s focus on addressing disparities among schools and the expectation of transparency in reporting per-pupil spending. Given the significant change in Michigan’s school finance system under Proposal A and flexibilities under ESSA for states related to site-level spending transparency and school accountability measures, a unique opportunity exists to analyze site-level spending and student academic growth.
ESSA Flexibility and School Finance
Accompanying the intensity of school reform is the heightened interest in the relationship between resource allocation and student academic outcomes. ESSA strongly emphasizes transparency in school spending to ensure accountability and equitable distribution of resources. The new requirement that all states’ local public school districts (LEAs and PSAs) publish per-pupil expenditures at the school site level went into effect during the 2018 to 2019 school year (ESSA, 2015). Flexibility in the requirement, however, exists. Under ESSA, states have broad latitude in defining what expenditures to report at the school site level (ESSA, 2015).
ESSA flexibility is salient to this discussion for two key reasons: (1) greater autonomy in state-level decision-making and (2) expectation of public transparency. According to the MDE, Michigan identified categories that provide financial transparency without adding a significant new reporting burden for districts (Michigan Department of Education, 2019). Categories selected include reporting on instructional and non-instructional expenditures. Greater autonomy granted to states allow for decisions based on local context. For example, the ESSA site-level reporting requirement supports Michigan’s strategic plan goal of becoming a top 10 state in 10 years (Top 10 in 10). Precisely, it aligns to ensure that families are engaged and supported partners in their children’s educational experience by allowing families to participate in discussions around equity of funding for their children’s school building (Michigan Department of Education, 2019). ESSA’s strong emphasis placed on increasing local control and enhancing transparency in school spending suggests a commitment to empowering communities, fostering equitable resource distribution, and ensuring that stakeholders have the information needed to actively engage in the improvement and accountability of their local education systems.
A Focus on Student Subgroups
We examine the association between per-pupil spending and student academic growth. To help understand the extent to which a relationship exists (or not), we control for two key variables: student sociodemographics, referred to as “student subgroups” in ESSA, and school structural characteristics.
One important feature of this study is the focus on student subgroups. The ESSA legislation places emphasis on the academic performance of subgroups of students. According to Section 1111 (h) of ESSA, states are mandated to report academic data separately on subgroups of students, ensuring a comprehensive understanding of educational outcomes across diverse demographics. The emphasis on the academic performance of student subgroups is supported in the literature. Scholars suggest that, on average, historically marginalized populations perform at lower levels than their White peers on standardized assessments (Gigliotti & Sorensen, 2018; Hanushek & Rivkin, 2009). Examining spending patterns among student subgroups is pertinent to understanding opportunity gaps that exist among these groups (Sosina & Weathers, 2019). Jackson (2020a) cited on average, a $1,000 cut in per-pupil allocation can increase the achievement gap between Black and White students by nearly 6%. This effect is comparable to Gigliotti and Sorensen’s (2018) findings, who studied variation in per-pupil allocation in New York schools and found that increases in student achievement in reading and math were correlated with a $1,000 increase in school spending. Additional studies have found that less money is spent to educate students in schools that serve high concentrations of Black and Hispanic students (Baker et al., 2020; Sosina & Weathers, 2019). ESSA’s provision on reporting student subgroups underscores a commitment to equity and accountability, as it encourages a closer examination of academic performance within specific student populations. By disaggregating data based on factors such as race, ethnicity, and socioeconomic status, educators and policymakers gain valuable insights into disparities within the education system (Gigliotti & Sorensen, 2018; Hanushek & Rivkin, 2009). This information catalyzes targeted interventions and tailors educational strategies, likely fostering an inclusive approach to education that addresses different student subgroups’ unique needs and challenges. School financing plays a role in meeting these unique needs and challenges. In essence, Section 1111 (h) of ESSA emphasizes transparency in reporting and promotes a more nuanced understanding of academic performance, ultimately contributing to a more equitable and responsive education system.
School Structural Characteristics
A second important feature of this study is that we focus on school structural characteristics to further explore the association between school spending and student academic growth. We define school structural characteristics as school type (i.e., traditional public and charter schools) and grade-level configurations (i.e., K-8, 7–8). The inclusion of school structural characteristics is salient to the study. First, charter schools are considered a mechanism for school reform (Miron & Urschel, 2010). Specifically, it is the belief that school choice policies ignite competition, particularly in student enrollment, between traditional public schools and charter public school academies (Arsen & Ni, 2012a). Second, from a school spending perspective, findings from three pivotal studies revealed that charter schools spend less on instructional services (e.g., teacher salaries and after-school programs) and more on administrative costs (Izraeli & Murphy, 2012; Miron & Urschel, 2010; Nelson et al., 2003). Given the school accountability landscape today and the focus on “school type” as a mechanism for school reform and school spending variation based on school type, including these variables highlights and extends the opportunity for this research study.
Next, the decision to include grade-level configuration as a school structural characteristic was intentional. Concern about middle school grade-level configuration has sparked public discourse for decades. Clark et al. (2013) reported that traditionally configured middle schools were once described as “the great disaster of the education system” and the place where “student academic achievement goes to die” (p. 2). Despite the harsh criticism about education production in middle school, the effects of grade-level configuration on student academic outcomes remain an evolving area of research. Although limited, prior studies have aimed to determine the best grade-level configuration to boost the academic achievement of middle school students. These studies have suggested that school site grade-level configuration is linked to declines in student learning during middle school (Malaspina & Rimm-Kaufman, 2008; Rockoff & Lockwood, 2010; Schwerdt & West, 2013). The research of Clark et al. (2013) and Malone et al. (2020), who supported these findings, found that seventh-grade pass rates on the standardized test were significantly higher in elementary schools than in middle schools. Evidence suggests seventh grade students may perform better based on school grade-level configuration. Consistent with ESSA’s emphasis on transparency and clarity for families and other stakeholders, we highlight findings related to school structural characteristics.
Method
Data
To better understand the association between site-level per-pupil spending and seventh grade student academic growth in ELA and mathematics, we extracted publicly accessible statewide assessment, financial, and demographic data from traditional public and charter schools in Michigan for the 2018 to 2019 school year. Although an examination using trend data covering multiple years would have likely strengthened the study, the decision to use data from only the 2018 to 2019 academic year was intentional given there were changes and variations in the state assessment design and school accountability metrics prior to the 2018 to 2019 school year and school-level resource allocation data were not reported to the state education agency until the ESSA requirement came into effect during the 2018 to 2019 school year. Furthermore, due to the Covid pandemic student scores were not available for the 2019-20 school year and likely “skewed” in the 2020-21 testing data due to learning loss, great variation in the delivery of education across schools (e.g., in-person vs. online), and other organizational complications due to dealing with the pandemic. Given the continued effects of the pandemic, specifically for certain populations of students and schools, we wanted to focus on pre-pandemic data.
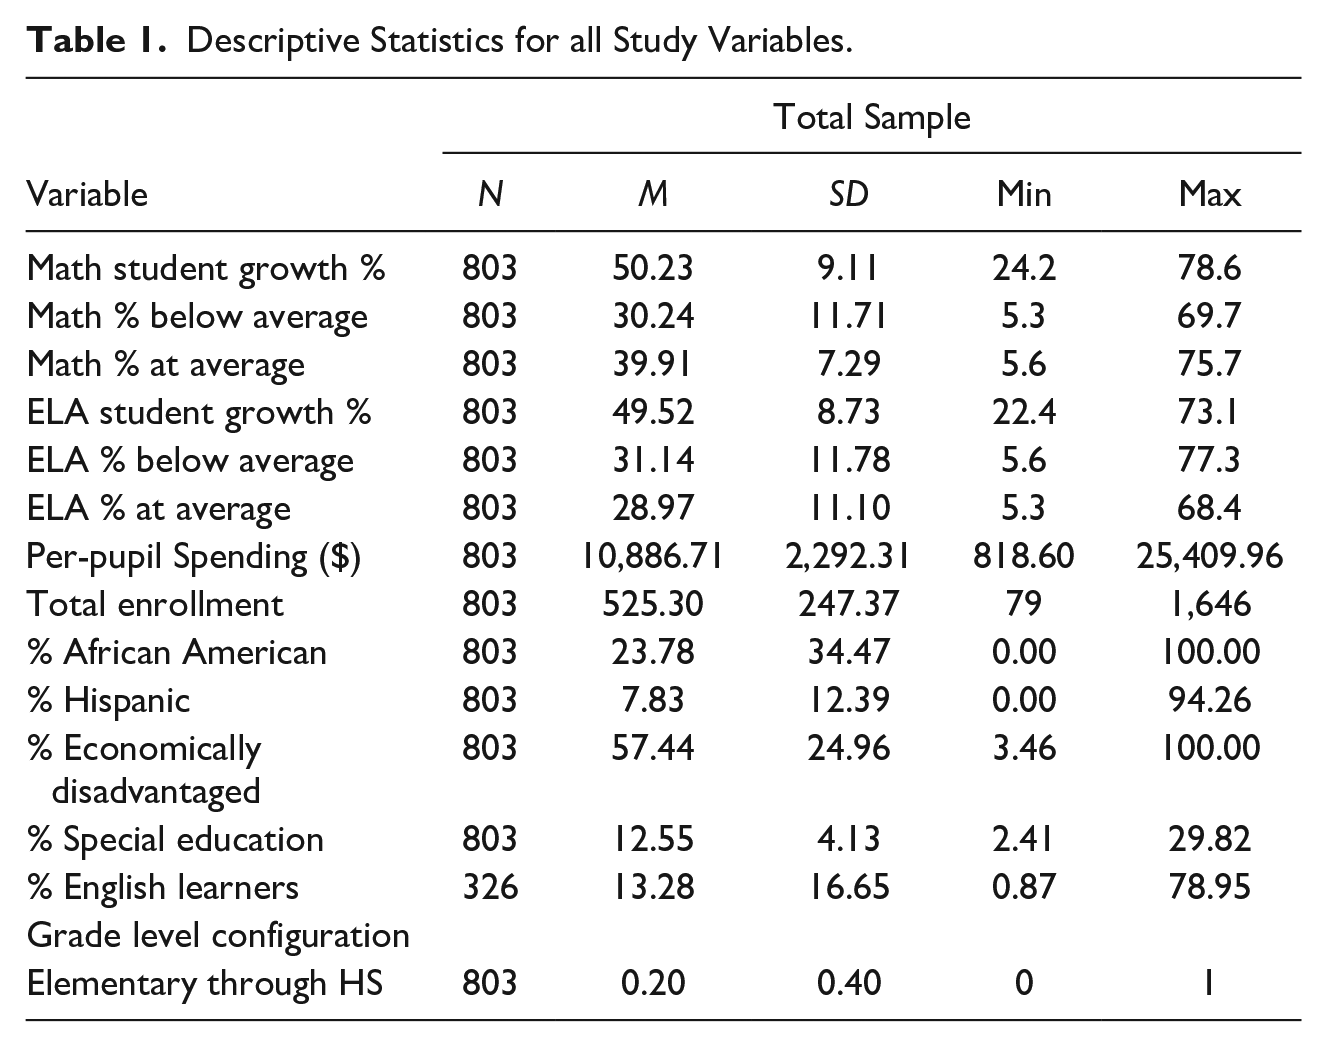
Descriptive statistics for the study variables are presented in Table 1. Student academic growth percentage was similar for both mathematics and ELA in the total sample. On average, 30% of the total sample had below average growth in mathematics and ELA. The percentage of students with average growth differed between mathematics and ELA, with 40% having average growth in mathematics and 29% having average growth in ELA. School-level spending ranged from $818 to $25,500 per-pupil in the total sample.
Descriptive Statistics for all Study Variables.
Sample
While the association between school spending and student outcomes has been broadly studied in the research literature, we did not locate any previous studies that specifically examined the effects of site-level per-pupil spending on student academic growth, particularly among seventh grade students. There is evidence that public school students’ experiences in middle school are related to decreased academic achievement (Clark et al., 2013; Malone et al., 2020). Furthermore, declines in reading and mathematics achievement among seventh grade adolescents have been observed during the transition from elementary school to middle school (Alspaugh, 1998). Recognizing this gap in the literature, we drew upon publicly available school-level data to examine the association between site-level per-pupil spending and student academic growth measures.
We looked at data from the 2018 to 2019 M-STEP that included 847 schools from 667 districts in Michigan. The school expenditure and student sociodemographic data originated from district-reported school-level information (Michigan Center for Educational Performance & Information, 2021). Schools with missing expenditure and student demographic data were excluded from the analytic sample. Thus, the final sample includes data for seventh grade students from 803 schools from 667 districts in Michigan for the 2018-2019 school year. Data was obtained from the Michigan Center for Educational Performance and Information (CEPI), the Michigan Department of Education’s (MDE) official public education data source, so the findings may be limited to the context of this state and this grade level. Despite the various grade-level configurations in Michigan traditional and charter public schools, seventh grade students were considered middle school students for the purposes of this study.
Measures
Student Growth Percentiles
We looked at student growth percentiles as the unit of measurement for mathematics and ELA for the purpose of this study. Subcategories include: (a) average student growth defined as the average of the individual student growth percentile scores of students assessed on a given subject, in each group, (b) percentage of students with average growth defined as the percentage of students in the school who exhibited average growth, and (c) percentage of students below average growth defined as the percentage of students in the school who exhibited below average growth. The choice to focus on student academic growth measures in mathematics and ELA was intentional. Growth measures allow for determining a student’s progress over time (Anderman et al., 2015) and allow for practitioners, policy makers, and families to determine if a student is above, near, or below average as compared to peers with comparable prior test scores. Growth-based measures provide the public an opportunity to acknowledge student progress (Anderman et al., 2015).
School-Level Per-Pupil Spending
School-level per-pupil spending was of value to this study and served as the primary independent variable as the ESSA (2015) school accountability legislation required the reporting of school-level per-pupil spending beginning in the 2018 to 2019 school year (ESSA, 2015). In this analysis, total site-level per-pupil expenditure was the sum of these federal, state, and local funds. Local funds included both district-designated expenditures to a specific school and expenditures allocated across all schools in the district on an equal, per-pupil basis (Michigan’s Center for Educational Performance and Information, 2020).
School and Student Characteristics
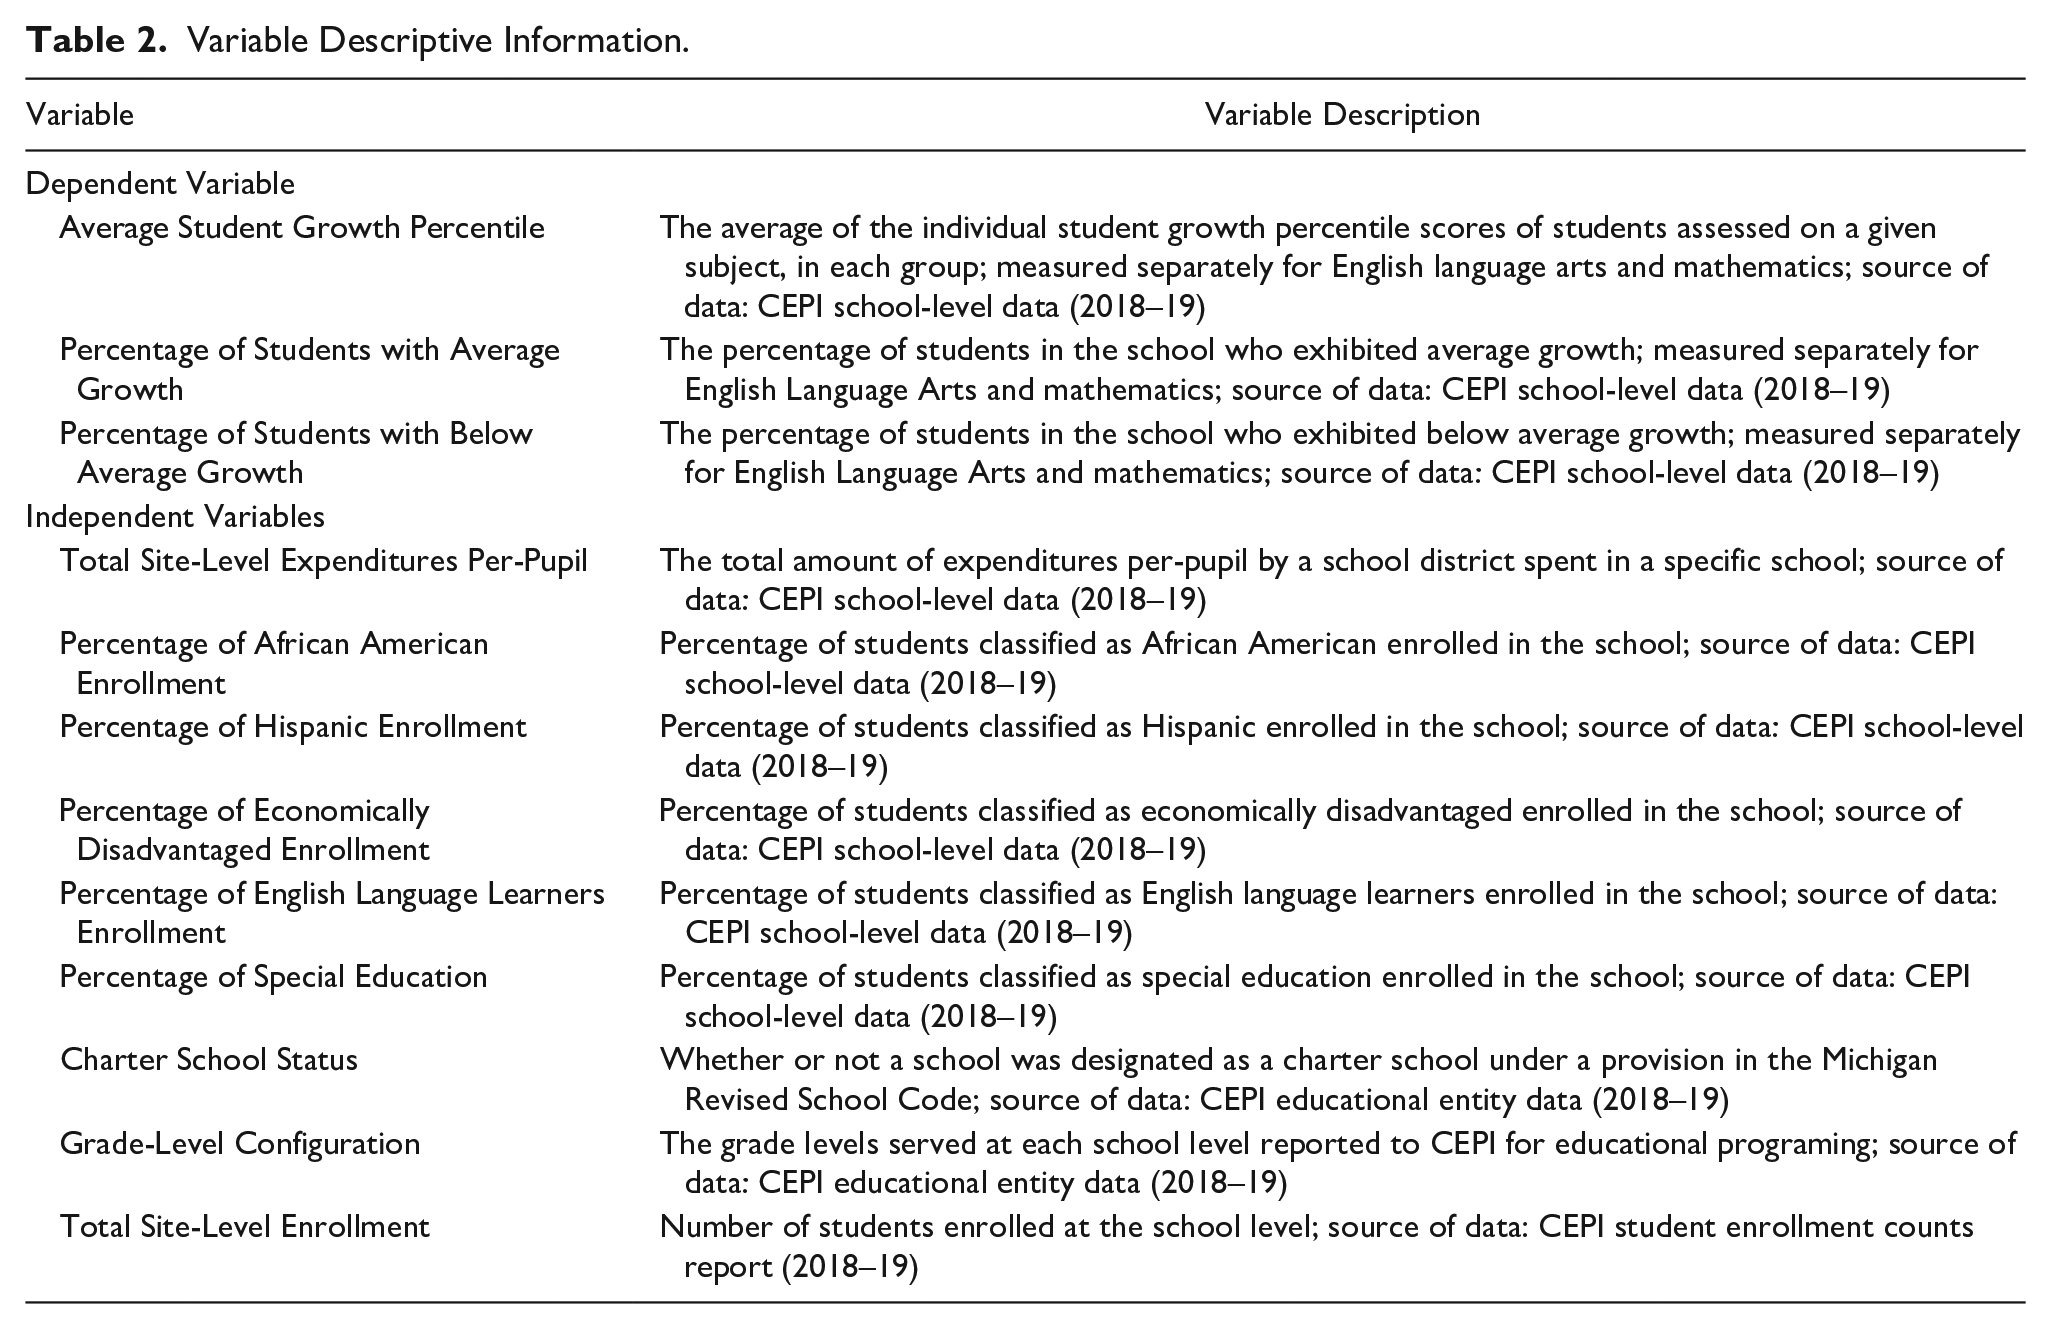
School and student characteristics were included as secondary independent variables in this study. These variables are defined in detail in Table 2.
Variable Descriptive Information.
Analytic Approach
Multilevel linear regression models were estimated to explore the association between school-level per-pupil spending and seventh grade student academic growth, controlling for school and student characteristics. Prior research studies have highlighted the strong influence student and school-level characteristics have on student academic performance (Malone et al., 2020). Multilevel models were necessary for analysis since schools function (i.e., are nested) within a district-level structure, and our theoretical approach suggests that district funding and programmatic focus are in large part shaped by district-level resources and priorities. These models allowed the appropriate handling of the nested error structure of the data while also enabling the examination of variation in aggregated school-level student performance within schools and between districts (Raudenbush & Bryk, 2002). Separate models were estimated for each of the six dependent variables related to the student growth measures. All analyses were conducted in SPSS v.26 (SPSS Inc., Chicago, IL). A p-value < .10 was used to determine statistical significance for all analyses.
Models
The following set of equations represents the general format of the estimated models and the methodological approach used for each outcome. First, an unconditional model was estimated to identify the variance of school-level student academic growth measures within and across districts and to establish baseline model fit statistics. Next, a conditional model was estimated to model student academic growth as a function of per-pupil spending alone. This model consisted of level 1 and level 2 models and had the following form:
Level 1 Model

Level 2 Model


Combined Model:

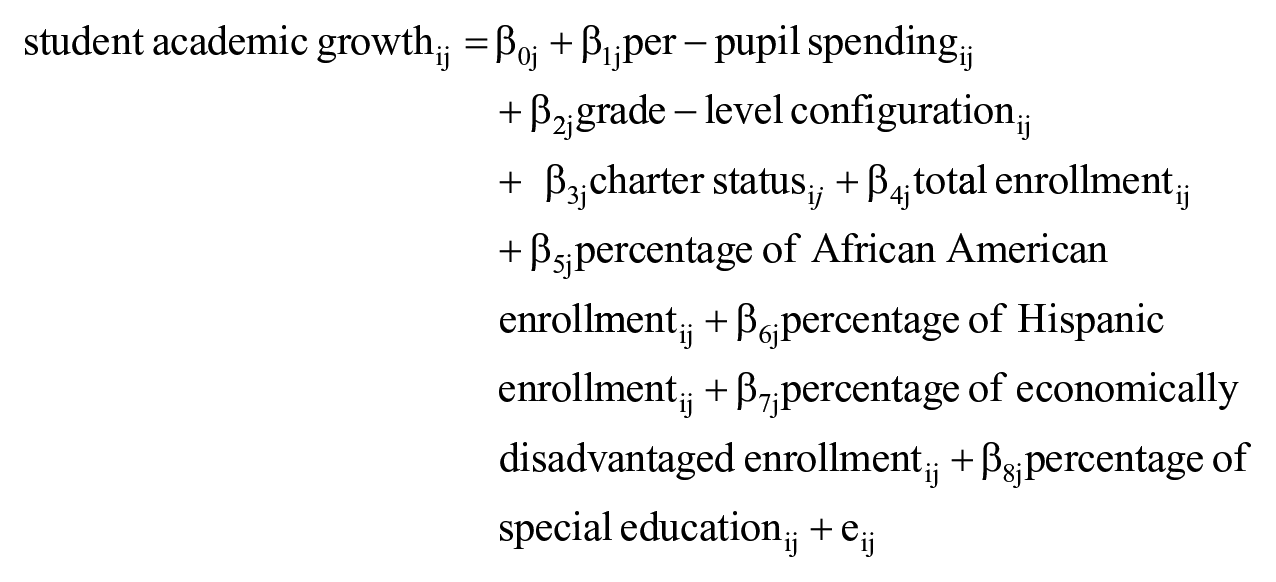
A third multilevel model was estimated to model student academic growth as a function of school-level spending and school and student characteristics. The level 1 and level 2 components of this model had the form:
Level 1 Model
Level 2 Model:
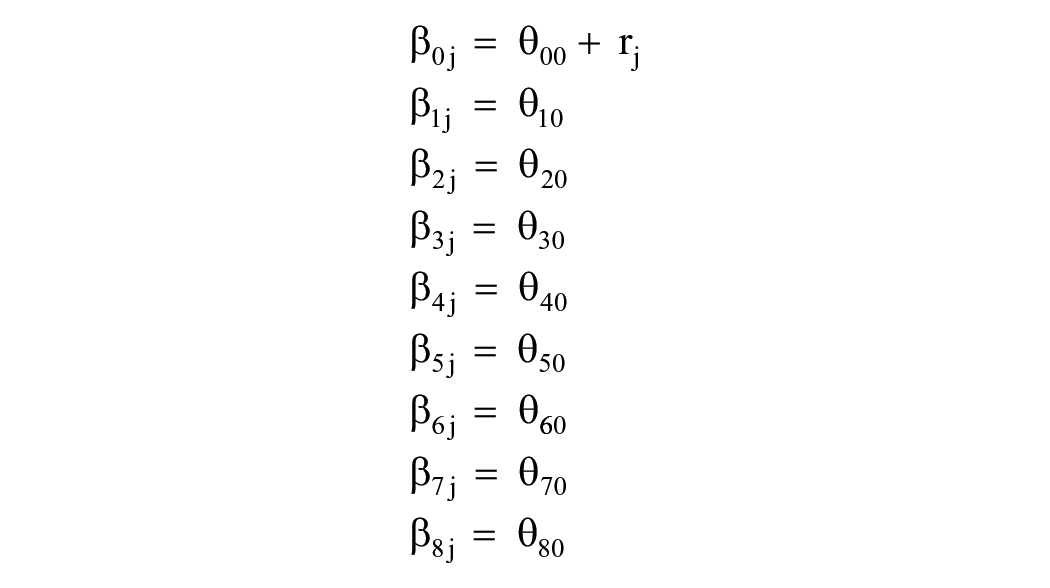
Combined Model:
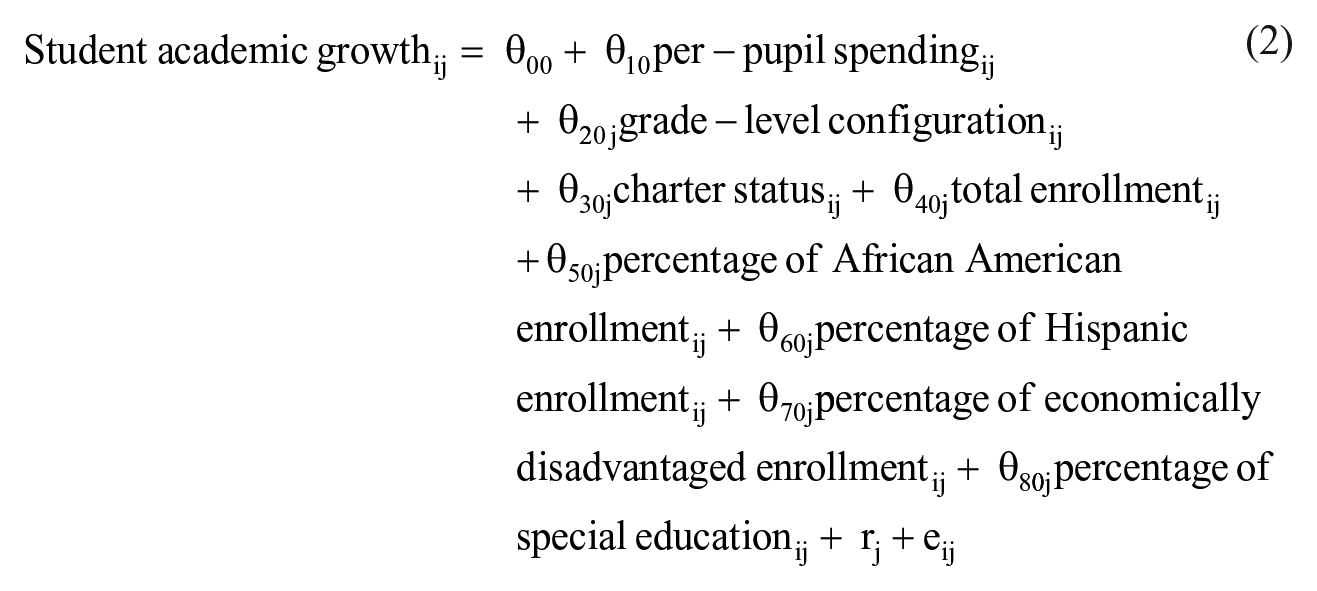
These conditional models estimated student academic growth for school i in district j as a function of school-level per-pupil spending and student and school characteristics. Because the models used an identity link function with a Gaussian distribution (Pan & Lin, 2005), the error terms are assumed to follow a normal distribution, with r representing the error term for district j and e representing the school error term nested within district j.
Findings
Outcome Measure 1 – Average Student Growth Percentile
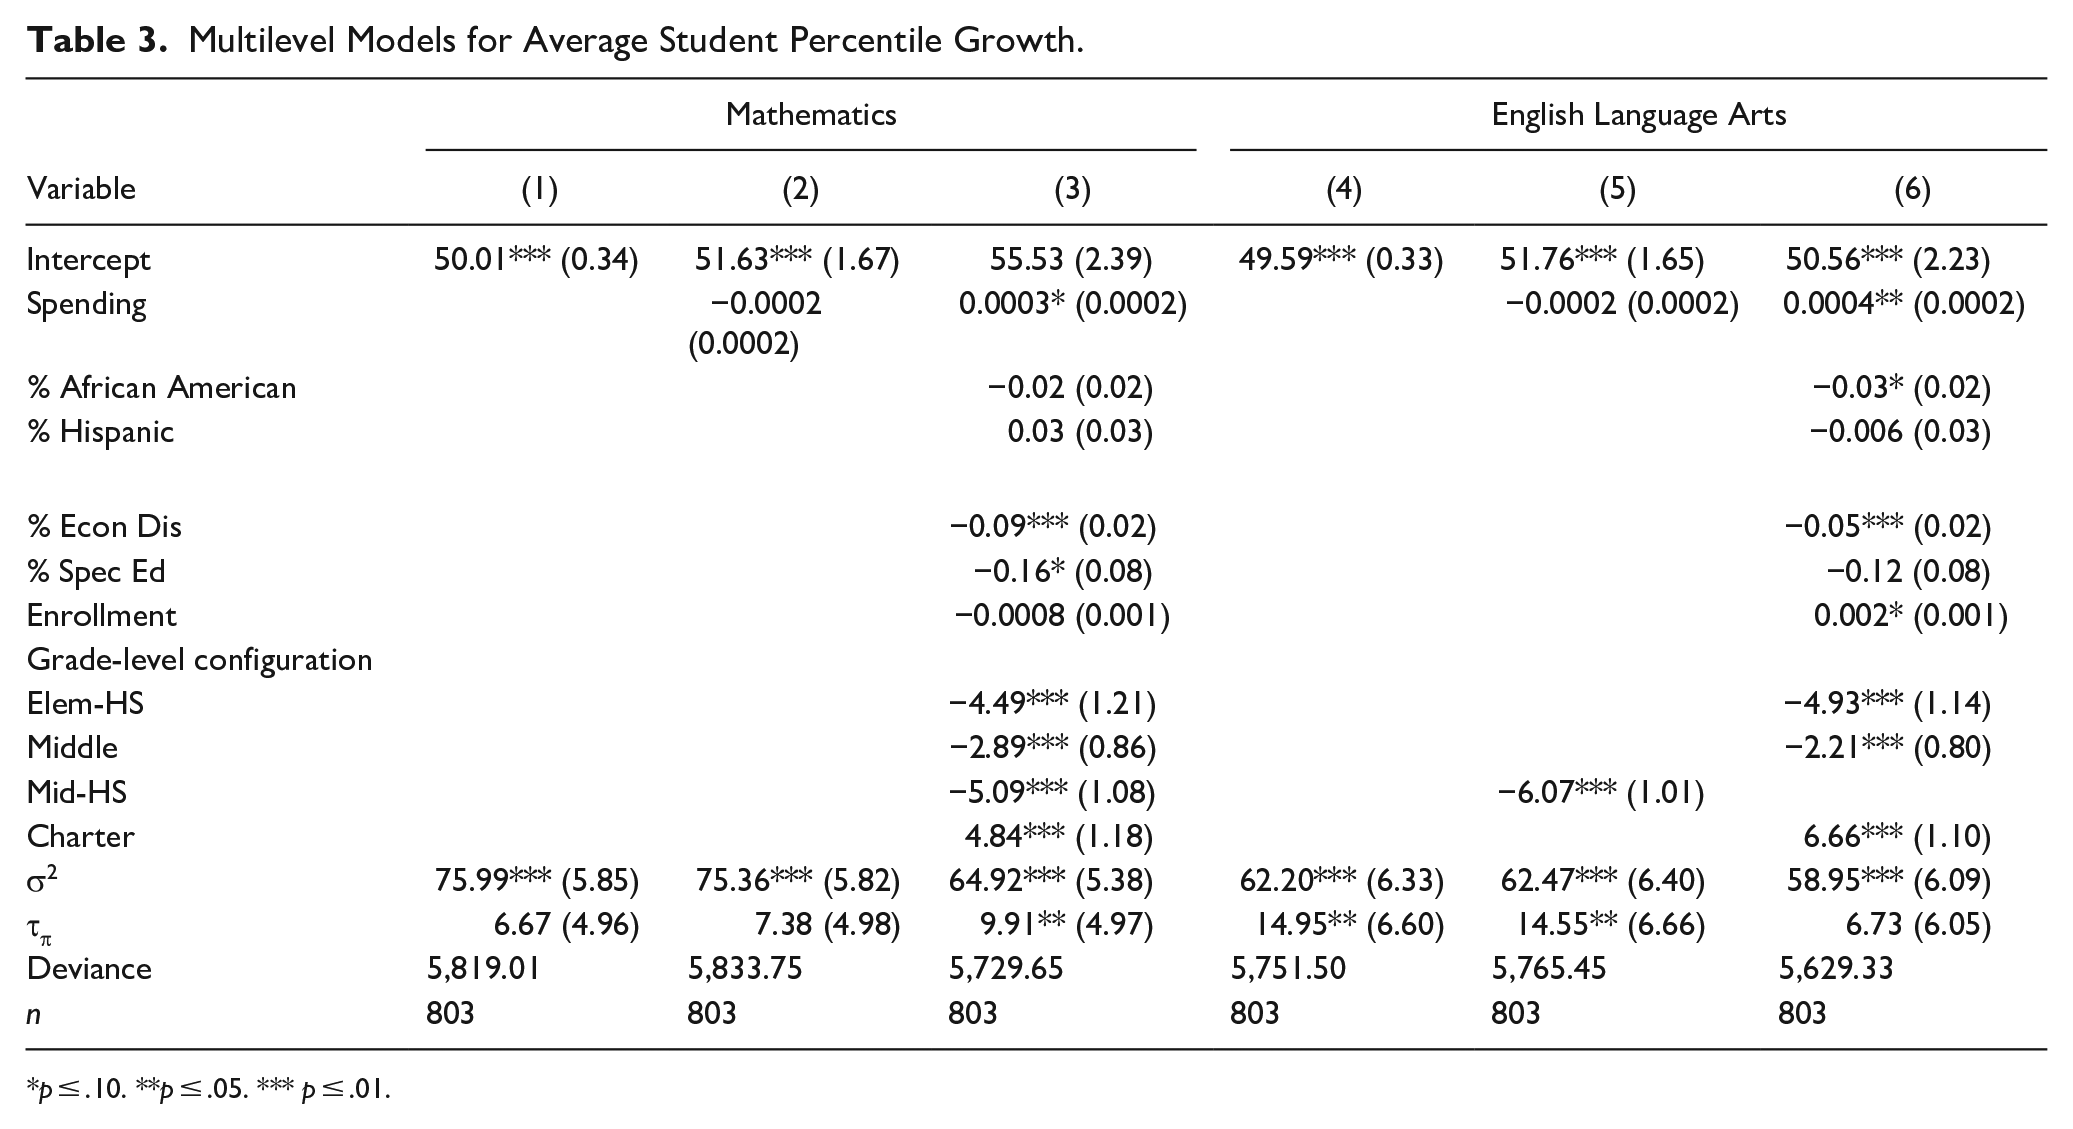
The analysis began by examining the link between school-level per-pupil spending and the average student growth percentile in mathematics and ELA on the 2018-2019 M-STEP. As shown in Table 3, the variance components for the unconditional models (models 1 and 4) indicate that the majority of variance was between schools (approximately 92% and 80% respectively) as opposed to between districts. Based on the Deviance score, the models that only included per-pupil expenditure as a predictor variable (models 2 and 5) did not improve model fit, and the coefficient for per-pupil expenditure was not statistically significant.
Multilevel Models for Average Student Percentile Growth.
p ≤ .10. **p ≤ .05. *** p ≤ .01.
After controlling for student and school characteristics, there a positive and statistically significant association between per-pupil spending and average student growth percentile for both math (p < .10) and ELA (p < .05). The percentage of economically disadvantaged students, total enrollment, grade level configuration, and charter school status also had a statistically significant association with the average student growth percentile in both mathematics and ELA. The percentage of African American students was significantly associated with the average student growth percentile in ELA but not mathematics. These full models though only explained approximately 15% and 6% respectively of the variation in outcome between schools.
Outcome Measure 2 – Percentage of Students With Average Growth
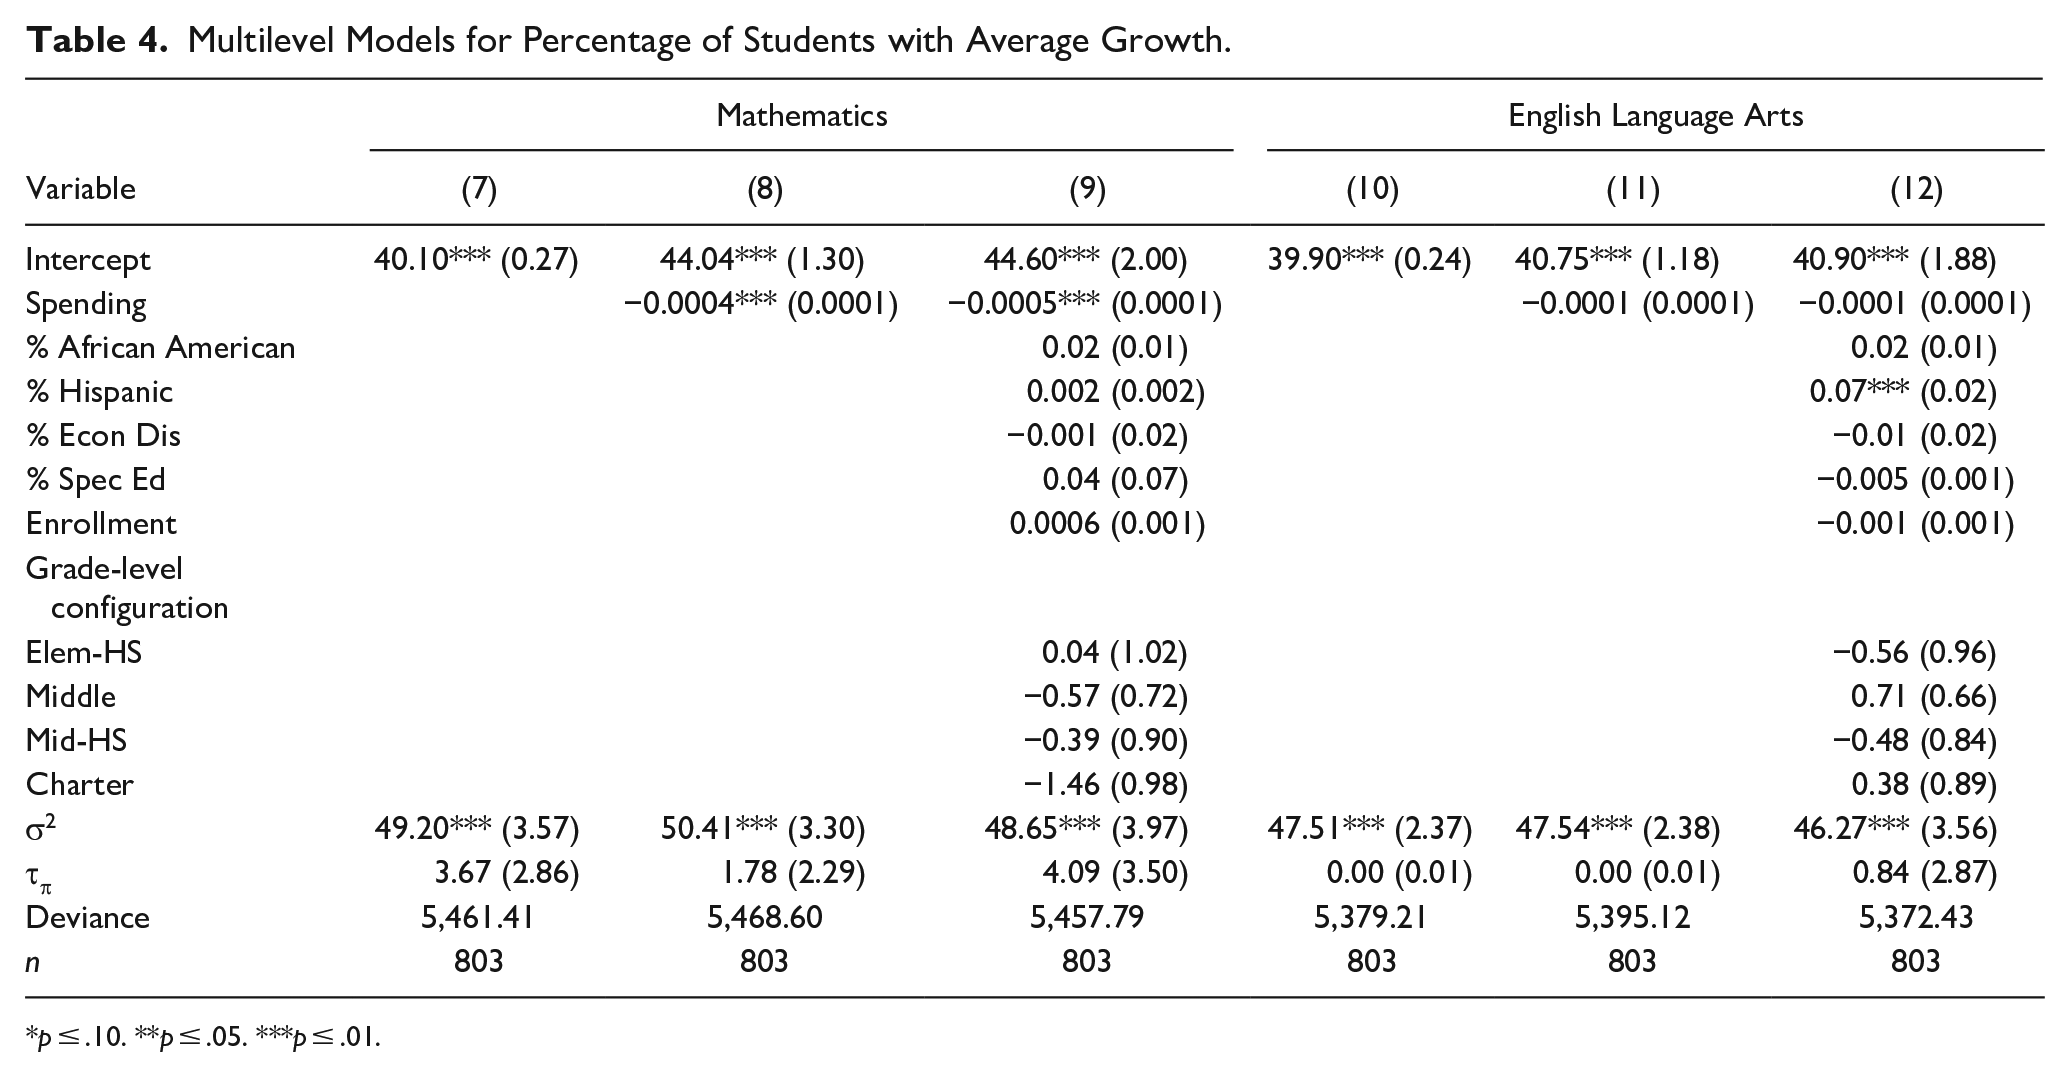
As a second outcome measure for the study, we were interested in the link between school-level per-pupil spending and the percentage of seventh-grade students with average growth on the 2018 to 2019 M-STEP (see Table 4). After controlling for student and school characteristics, per-pupil expenditure, on average, was associated with a lower percentage of students with average growth in mathematics (p ≤ .01). A $1,000 variation in funding across schools was associated with a 0.5 percentage point decrease in the percentage of students with average growth in mathematics. Conversely, the percentage of economically disadvantaged students, total enrollment, grade level configuration, and charter school status were not significantly associated with the percentage of students with average growth in both mathematics and ELA. The percentage of Hispanic students was significantly associated with the percentage of students with average growth in ELA but not mathematics. These full models explained approximately 1% and 3% respectively of the variation in outcome between schools.
Multilevel Models for Percentage of Students with Average Growth.
p ≤ .10. **p ≤ .05. ***p ≤ .01.
Outcome Measure 3 – Percentage of Students With Below Average Growth
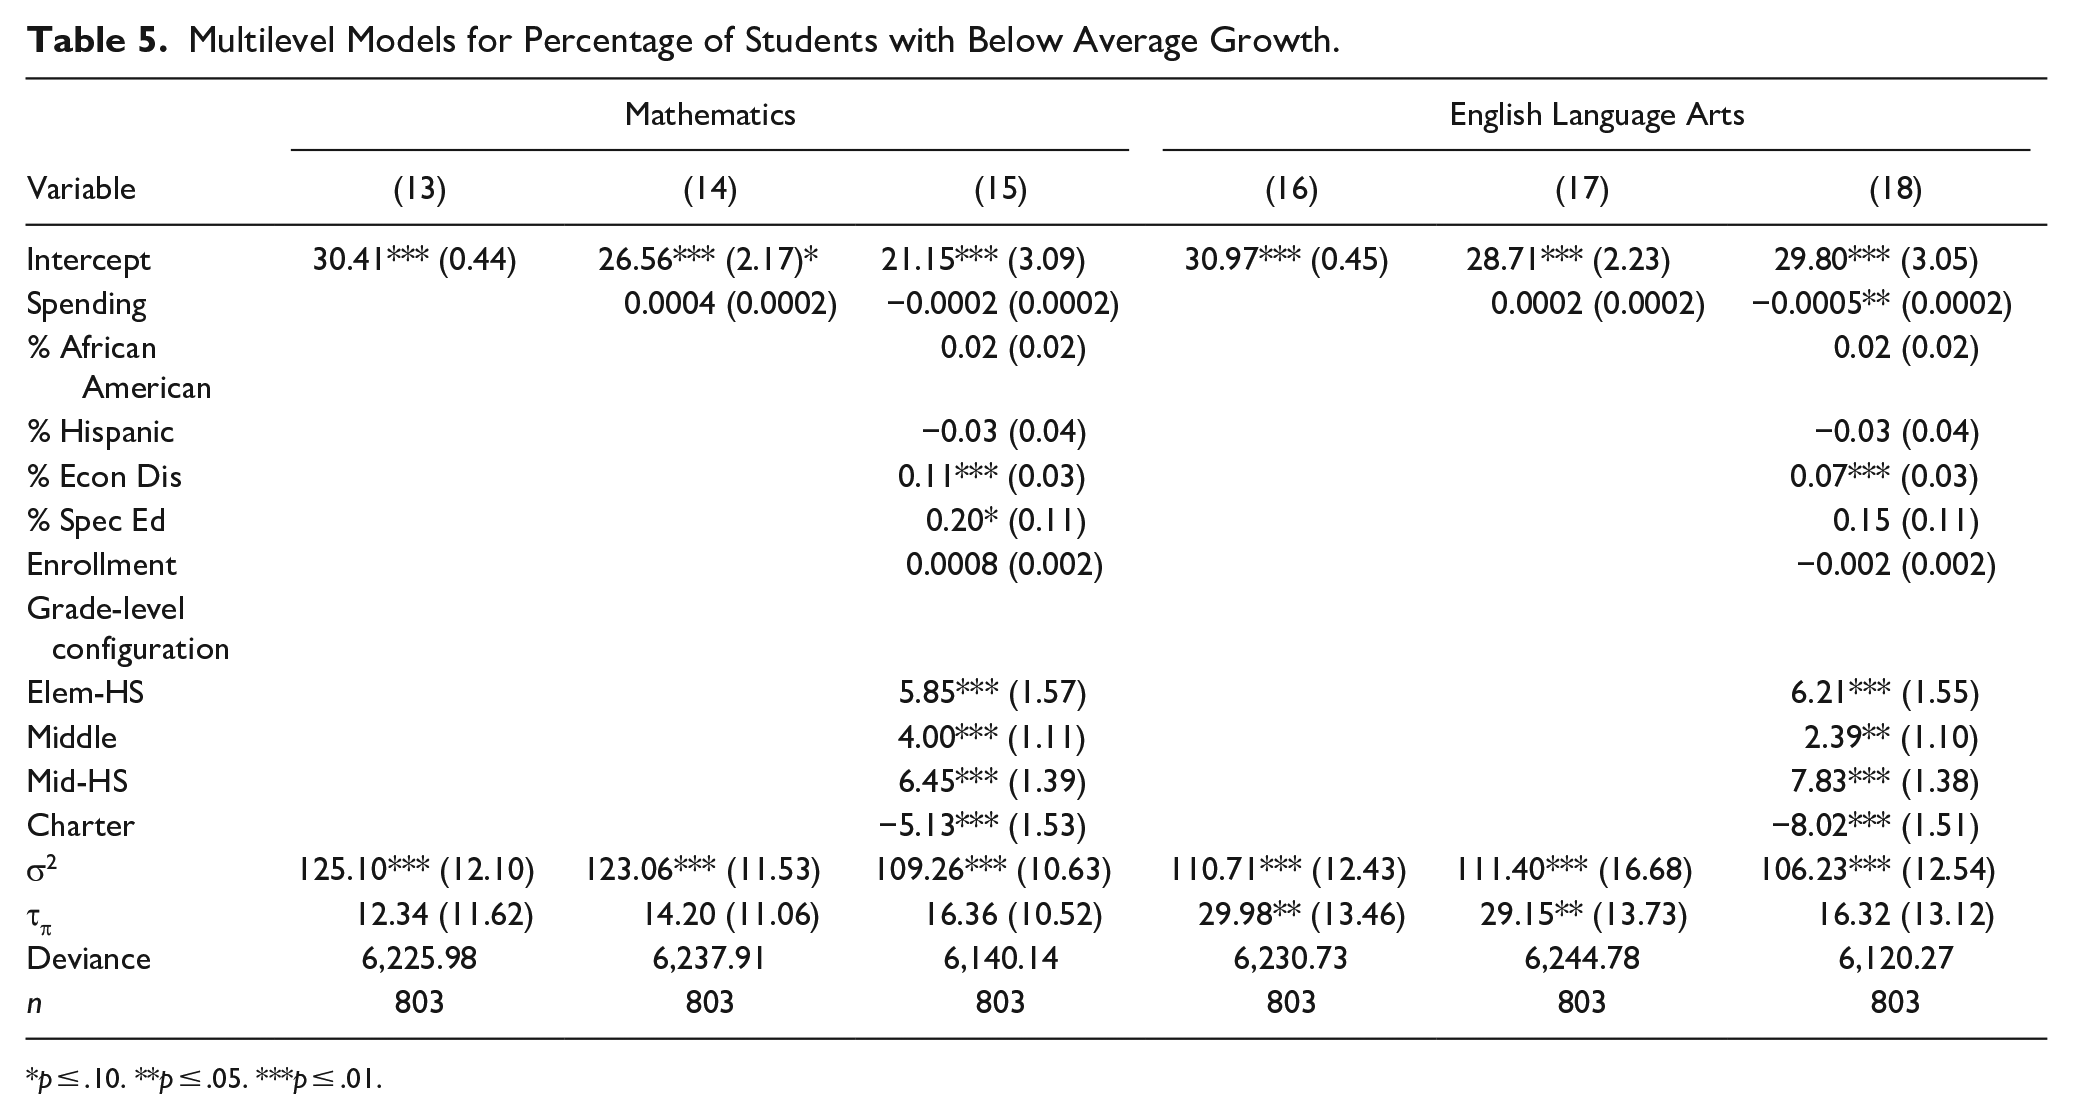
The final outcome measure was the percentage of students with below average growth on the 2018 to 2019 M-STEP (see Table 5). After controlling for student sociodemographic and school-level structural characteristics, per-pupil spending was not significantly associated with the percentage of students with below average growth in mathematics (p ≤ .01) while there was a negative association with percentage of students with below average growth in ELA (p ≤ .05). The percentage of economically disadvantaged students and school grade-level configuration were positively associated with the percentage of students with below average growth in mathematics and ELA, while charter school status was negatively associated with the percentage of students with below average growth in mathematics and ELA. These full models explained approximately 13% and 4% respectively of the variation in outcome between schools.
Multilevel Models for Percentage of Students with Below Average Growth.
p ≤ .10. **p ≤ .05. ***p ≤ .01.
Summary of Findings
Based on an open systems framework, we examined whether there was a relationship between school per-pupil spending and student academic growth outcomes among seventh grade school students on Michigan’s statewide assessment. It was expected that there would be an association between per-pupil spending and levels of student academic growth, while at the same time, we expected that student and school-level structural characteristics would play a role in this relationship. Our findings suggest that after controlling for student and school characteristics, site-level per-pupil spending was positively associated with the average student growth percentile in seventh grade mathematics and ELA. Although this study has limitations (discussed below), these findings have implications for policy and practice.
Discussion
While many studies have examined the association between school spending and student academic outcomes (Hanushek, 1986; Hedges et al., 2016; Jackson & Mackevicius, 2021; Plecki, 2000), research on the effects of financial resources on student academic growth, and among student groups, as a performance measure has roughly been unchartered territory. This study though builds upon previous research by specifically looking at school-level per-pupil spending, which are only recently publicly reported through requirements of ESSA. Additionally, student growth as an outcome has only recently been given more weight in state accountability policy. The results from this study and the existing research literature suggests financial resources may unlock greater potential for improving the academic performance of public-school students (Rebell, 2017).
Student Characteristics and Student Outcomes
In addition to investigating the effects of school expenditures, it was important to control for student sociodemographic characteristics given the school accountability landscape and the focus on student subgroups. Prior research studies have highlighted the strong influence student characteristics have on student academic performance and school aggregate scores (Malone et al., 2020). Our findings suggests, even after controlling for spending, student characteristics are associated with student academic growth in one or both subject areas among seventh grade students. In mathematics and ELA, for example, the percentage of economically disadvantaged students enrolled was significantly associated with a decrease in the average student growth percentile. These findings are in line with the previous literature suggesting student demographics impact academic performance (Akos et al., 2015). These findings are important given the current school accountability landscape and the focus on the achievement levels of student subgroups. Previous research findings revealed increases in student achievement in reading and math was correlated with a $1,000 in school spending (Gigliotti & Sorensen, 2018). Similarly, Jackson (2020a) found that, on average, a $1,000 cut in per-pupil allocation can increase the achievement gap between Black and White students by nearly 6%. Given that on average, historically marginalized populations have been found to perform at lower levels than their White peers on standardized assessments (Gigliotti & Sorensen, 2018; Hanushek & Rivkin, 2009) and that spending patterns among student subgroups is pertinent to understanding opportunity gaps that exist among these groups (Sosina & Weathers, 2019), per-pupil resource allocation and its relation to student academic growth could prove worthy in closing the achievement.
Student Outcomes and School-Level Structural Characteristics
The most significant influence on student learning occurs at the school level (Darling-Hammond, 2004; Leithwood & Riehl, 2003), thus understanding how school-level characteristics are related to student academic achievement was important for us to explore. For the purposes of this study, we identified school-level structural characteristics as: (a) school status (e.g., charter, non-charter), and (b) grade-level configuration. Key findings emerged from our analysis when controlling for school-level characteristics. Specifically, findings revealed the average student growth percentile among seventh grade students attending schools with a K-8 grade-level configuration was higher than those enrolled in schools with a traditional 7 to 8 grade-level configuration. Results related to the grade-level configuration are consistent with the existing research literature. Three key studies concluded moving students from elementary to traditional middle schools is associated with decreases in academic achievement (Malone et al., 2020; Rockoff & Lockwood, 2010; Schwerdt & West, 2013). Rockoff and Lockwood (2010) reported school grade-level configuration is associated with student academic outcomes, yet there was little evidence that financial resources affected student achievement after controlling for grade-level configuration. Methodological differences may explain conflicting results between Rockoff and Lockwood’s (2010) study and the present study.
Next, we found that per-pupil spending significantly predicted average student growth percentile in mathematics and ELA on the 2018-2019 statewide assessment when controlling for school type (i.e., charter vs. non-charter schools). Specifically, the average student growth percentile was higher in charter schools than in non-charter schools. These results are similar to Murphy and Izraeli’s (2019) findings that charter schools in Michigan performed as well as non-charter school students on the statewide assessment after controlling for student characteristics. It is important to note Murphy and Izraeli’s (2019) study and the present study examined state assessment results across different time periods.
Recommendations
More work is needed before obtaining a full understanding of the extent of school-level spending effects on student academic growth. As such, we present four recommendations for future research direction. First, with current school accountability placing a greater focus on student academic growth as the outcome measure, future research efforts should shift the focus from primarily examining student proficiency levels to investigating academic growth as an outcome measure. This would make research findings timely and relevant within the school accountability context. Next, research should explore the association between school-level expenditures, classroom level academic performance, and academic growth on state-level assessments. This would provide state, district, and school leaders with a more comprehensive understanding of the effects of education funding on the learning environment. Third, analyzing data across multiple years may be worthwhile to extend findings on the association between school-level spending and student academic growth on statewide assessments. Specifically, trend data may strengthen research findings. Finally, although findings from this study only reflected seventh grade mathematics and ELA, research studies geared toward investigating the effects of school spending on student academic growth for additional grade levels, subject areas, and locales throughout the United States may maximize the generalizability of the findings presented in this study.
Limitations
Although this study contributes to a broad body of research on the effects of school spending on student academic performance, caution should be exercised when interpreting these results. The data used in the analysis focused on the association between variables, thus causal claims could not be drawn. Additionally, we chose to collect data obtained for 1 year of performance from a single state, thus impacting the strength and generalizability of the findings in this study. Finally, the use of growth percentiles as a metric can inadvertently obscure other possible findings in education assessment. Complementing growth-based metric with other measures enables a more holistic understanding of student outcomes.
Implications for Future Practice
The general picture emerging from analyses of our study support claims in the existing literature that suggest school spending is positively associated with student academic outcomes after controlling for student and school-level characteristics. Student socioeconomic status, grade-level configuration, and school type were included as covariates and found to be a significant mediator in the link between student outcomes and site-level spending. These results have several implications for practice. First, parallel to the claim that school spending is positively linked to improved student academic performance (Jackson & Mackevicius, 2021) is the idea that fiscal resources must be managed effectively and efficiently (Hinojosa, 2018). The cost analysis of educating student subgroups is critical information as school accountability legislation requires a specific focus on student subgroups’ academic outcomes. Although an examination of school-level spending efficiency was excluded from this study, school and district-level leaders should be conscious of how money committed to schools through funding streams can support learning for all student groups.
Second, as ensuring that student subgroups receive quality instruction continues to remain a focal point in school reform efforts, school leaders and practitioners would benefit from aligning instructional support with students’ diverse needs. Research has suggested one way to promote alignment is to conduct a school-level budget model that concentrates funds on the investments of human and capital resources to support student learning (Odden & Picus, 2019). Lastly, evidence from this study supported existing claims that grade-level configuration should be explored as a viable option for improving the academic performance of middle school students. These findings are in line with existing research that suggests grade-level configuration is positively linked to the academic performance of students in the middle grades (Malone et al., 2020; Rockoff & Lockwood, 2010; Rubenstein et al., 2009). Given these findings, educational leaders would benefit from examining the organizational structure of schools to address the diverse needs of students while seeking to meet the demands of school accountability.
Footnotes
Author Note
Prior reporting of the fundamental data appeared in a dissertation presented by the Corresponding Author at Wayne State University in 2021.
Declaration of Conflicting Interests
The author(s) declared no potential conflicts of interest with respect to the research, authorship, and/or publication of this article.
Funding
The author(s) received no financial support for the research, authorship, and/or publication of this article.