
Abstract
This paper analyzes civilian occupations and employment data collected by the U.S. Census Bureau over seven decades (1960–2020) with respect to six kinds of work (Holland’s RIASEC classification). The focus is on (a) occupational titles used, (b) civilian employment, and (c) income. This study is a continuation and extension of eight articles published earlier by 11 different scholars, and it represents a 10th contribution to career development and vocational psychology literature with respect to the environmental aspects of Holland’s theory. In each census period, the Artistic area was the smallest area of employment at 1% or 2%. At the other extreme, the Realistic area was a large area of employment, ranging from 55% in 1960 to 26% in 2020. The principal findings of the current study are examined in terms of three research questions followed by a discussion of the implications for career counseling practice.
Holland’s (1997) RIASEC theory ranks among the most influential and important within the field of counseling and career development. Kennelly et al. (2018) sought to verify this by using bibliographic research tools. They identified 2318 publications based on this theory from 1953 to 2016 which spanned categories including practice, specific populations (e.g., K-12), diverse populations, instruments, and theory. These citations appeared in 355 publications (including books, journals, periodicals, reports, and chapters) produced in countries worldwide in varied professional fields and disciplines.
Many practitioners and researchers know more about the personality typology associated with Holland’s RIASEC theory than they do its corresponding environmental models (Reardon & Lenz, 2015). From the beginning, Holland himself felt that the environmental aspects of his theory needed further examination (Weinrach, 1980). The present study addresses this gap in scholarship on the environmental aspects of RIASEC theory by examining U.S. census data and updating previous studies of occupational employment using data obtained in 1960, 1970, 1980, 1990, 2000, 2010, and 2020. It replicates and extends eight articles published previously by 11 different scholars, and it represents an additional contribution to career development and vocational psychology literature with respect to the environmental aspects of Holland’s RIASEC theory.
Persons contemplating varied career decisions could benefit from understanding the nature and scope of the labor force through the lens of Holland’s RIASEC theory. Moreover, given conditions associated with the contemporary U.S. economy, it is important for both practitioners and job seekers to know if and how the distribution of jobs across RIASEC environments is changing over time. Previous studies (Gottfredson et al., 1975; Gottfredson & Daiger, 1977; Gottfredson & Holland, 1996; Gottfredson & Brown, 1978; Gottfredson & Brown, 1978; Gottfredson; 1980; McClain and Reardon, 2014; Reardon et al., 2004 and Reardon et al., 2007) indicated a blend of stability and change in jobs across RIASEC categories from 1960 to 2010. Therefore, an updated theoretical analysis of occupational employment data could benefit practitioners assisting those who are unemployed, displaced, or exploring the work force. For example, there is a strong relationship between the number of people currently working in an occupation and the number of annual job openings in that area; therefore, career counselors and their clients can better anticipate workforce replacement needs by knowing the number of people employed in various RIASEC environments.
Some researchers and practitioners have criticized the use of career concepts such as “occupation” given unprecedented socioeconomic change in the contemporary global economy. For example, Savickas (2009, 2012) noted that the digital revolution and changing social arrangements for work have led to unstable occupations and frequent job transitions for workers.
In contrast to this view, Elvery (2019) used census data and the SOC classification (U.S. Department of Labor, 2018) to examine the occupational mix from 1860 to 2015. Elvery found that the mix of occupations has become increasingly stable since 1970. Moreover, the degree of change in recent years is less than half since the decades of most change, for example, 1900s, 1940s. While the occupation names have not changed very much, the tasks performed within some occupations may have changed; for example, a cashier in 1960 would not have used a bar code scanner.
Sampson and Reardon (2011) observed that this perception of massive occupational change has been inflated by inaccurate media representations as well as widespread failure to use career theory to examine such changes. Some professional literature may use the terms career, job, position, and occupation interchangeably, but we define occupation as a group of similar job positions found in different industries or organizations. Accountant, for example, is an occupation that might exist in the pharmaceutical industry or a university (Reardon et al., 2022). The Bureau of Census has provided information on the complex procedures involved in creating occupational data (https://www.census.gov/topics/employment/industry-occupation/about/occupation.html).
The present article uses Holland’s (1997) RIASEC theory to examine occupational information gathered by the U.S. Census Bureau and Department of Labor. Holland’s theory builds on four foundational assumptions: (1) workers can be categorized into Realistic (R), Investigative (I), Artistic (A), Social (S), Enterprising (E), and Conventional (C) personality types; (2) work environments (i.e., occupations) can also be categorized into these same six types; (3) individuals tend to self-select environments that match their personality types; and (4) behavior stems from the interaction between an individual’s personality and their environment. Examining occupational titles used by the U.S. Census and Department of Labor to describe current work in the United States, including information about employment and income, can increase our understanding of the workforce from Holland’s theoretical perspective.
The theoretical connection between vocational personalities and work environments makes it possible to use the same RIASEC classification system for both persons and occupations (Holland, 1997). These six types are briefly defined as follows. Realistic (R) environments require manual or mechanical competencies and often involve concrete activities and use of tools and machines. Investigative (I) environments require scientific and analytic skills and often involve intellectual activity aimed at scholarship, problem-solving, or creating new knowledge. Artistic (A) environments require creativity, innovation, and/or emotional expression and often involve work in the arts, literature, or unstructured intellectual activities. Social (S) environments require interpersonal and helping skills and often involve working to teach, serve, or heal others. Enterprising (E) environments require skills in persuasion and leadership and often involve work in sales, politics, and business. Conventional (C) environments require clerical and organizational skills and involve working with data to meet standard organizational demands.
The six RIASEC types are optimally represented by a circular order, also commonly referred to as the hexagonal model. Holland’s (1997) structure of six types as a hexagon is one of the most replicated findings in the history of vocational psychology (Rounds, 1995). The six domains are arranged according to their relative similarity in a hexagonal formation of R-I-A-S-E-C. For example, the Social and Enterprising types, which appear adjacent on Holland’s hexagon, are more alike than are the Social and Realistic types, which appear opposite from one another on the hexagon.
Prior Studies
The present study continues a line of research that began in the 1970s, when researchers (Gottfredson, 1978; Gottfredson & Brown, 1978; Gottfredson & Daiger, 1977; Gottfredson et al., 1975) first used the RIASEC classification system to examine U.S labor market data from the 1960 and 1970 censuses. Two additional studies (Gottfredson & Holland, 1996; Gottfredson; 1980) built on this body of work using data from the 1980 census. These RIASEC-based analyses provided practitioners and scholars with theory-based information about U.S. employment and examined a variety of variables, including occupational prestige, salaries, educational and training levels, employment by gender, and cognitive complexity.
Reardon et al. (2004, 2007), and McClain and Reardon (2014) continued this line of research, using RIASEC theory to examine trends in employment data from the 1960 census through the 1990, 2000, and 2010 censuses, respectively. Several notable trends emerged from their analyses. First, all three studies reported relative stability in census data for occupational titles and six kinds of work since 1960, though occupational titles were unevenly distributed across the six types of work. For example, the Realistic area of work consistently contained more occupational titles than any other area from 1960 to 2010, while the Artistic area contained the least (McClain & Reardon, 2014). Second, although Realistic environments consistently employed more workers than any other area from 1960 to 2010, overall employment in Realistic occupations declined over this 50-year period: falling from 55% in 1960 to 37% in 1990 (Reardon et al., 2004), 30% in 2000 (Reardon et al., 2007), and 27% in 2010 (McClain & Reardon, 2014). Artistic environments, on the other hand, employed the smallest percentage of workers across this timespan, increasing only slightly from 1% in 1960 to 2% in 2010, while Investigative employment increased from 3% in 1960 to 10% in 2010 (McClain & Reardon, 2014). Third, these studies examined income by the six types of work, finding that Investigative occupations consistently netted the highest average salary and Conventional the lowest between 1990 and 2010. The average income profile for the six kinds of work vacillated only slightly across this 30-year period, from IESARC in 1990 (Reardon et al., 2007) to IEASRC in 2010 (McClain & Reardon, 2014).
The Present Study
The present study builds upon this prior research in order to examine if and how U.S. employment has continued to change over the past decade, a period marked by rapid technological advancement, increases in precarious work, and economic and employment changes driven by the COVID-19 pandemic. We continue to use the RIASEC model and add 2020 employment data as reported by the U.S. census and O*NET to address the following research questions: 1. What were the numbers of occupational titles reported in the census from 1960 to 2020 relative to the six areas of work? 2. What were the numbers and percentages of occupational employment in 1960, 1970, 1980, 1990, 2000, 2010, and 2020 in relation to six kinds of work? 3. What were the mean incomes for six different kinds of work in 1990, 2000, 2010, and 2020?
Methods
Procedures and Research Tools
Occupational data for the decennial U.S. census was gathered using varied procedures over the past seven decades, as outlined below.
1960, 1970, and 1980 Censuses
In 1960, the U.S. Census Bureau used the housing unit as the sampling unit. In the case of group housing, the individual person served as the sampling unit. The 1960 census provided information about 297 detailed occupations. Gottfredson and Brown (1978) derived RIASEC codes for this data using 1970 census data as a point of reference. In 1970, the U.S. Census Bureau again used the housing unit as the sampling unit and gathered data about 440 detailed occupational titles, 143 more than in 1960. As in 1960, this data included only employed persons and excluded members of the military. Gottfredson et al. (1975) analyzed data from the 1970 census involving 424 detailed occupations. 1980 census data included 503 detailed occupations and was analyzed in Gottfredson and Holland (1989) and Gottfredson (1984).
1990 and 2000 Censuses
The 1990 U.S. census count of 283,928,233 individuals identified 500 detailed occupations (Bureau of Census, 1992a; 1992b). These occupations were classified in a manner that was similar but not identical to the Standard Occupational Code system (SOC; U.S. Department of Commerce, 1980). The 2000 U.S. census count of 281,421,906 individuals identified 471 occupations that were classified according to the SOC (U.S. Bureau of Census, 2002; U.S. Department of Labor, 2000).
2010 Census
The 2010 U.S. census counted 308,745,538 people across all 50 states plus the District of Columbia. It identified 539 occupations, including those with “all other” titles representing broad occupational categories not fitting into one of the O*NET detailed occupations. As in previous research, the present study focused on detailed occupations in the 2010 census (N = 494), excluding military-based occupations.
The information collected in the 2010 census was based on the U.S. Census Bureau’s short-form questionnaire rather than the long-form version. This means that demographic information relative to occupations was no longer collected on the official census questionnaire. Instead, it was gathered separately by the newly established American Community Survey (ASC). The ACS was designed to provide reliable and timely demographic, housing, social, and economic data each year, in contrast to the long-form census questionnaire which had been administered only once every 10 years. The introduction of the ACS by the U.S. Bureau of Census represented the most sweeping change in census data collection in six decades (Lowe, 2010).
After locating the 2010 census data from the U.S. Census Bureau, additional information was added with Holland Codes, employment data, and mean annual wages. The Standard Occupation Code (SOC; U.S. Department of Labor, 2000) was used to collect employment and salary information from the O*NET system (http://online.onetcenter.org/).
In keeping with Reardon & Lenz, 2015
2020 Census
The 2020 census counted 331,449,281 people in the 50 states and the District of Columbia. On March 10, 2022, the Census Bureau released a statement that the census results showed statistical evidence that the quality of the 2020 Census total population count was consistent with that of recent censuses despite the unprecedented challenges of 2020 with the pandemic and political issues. However, the 2020 Census undercounted many of the same population groups historically undercounted, and it overcounted others
As in prior studies, the focus in the 2020 census excluded military-based occupations. Census occupations were classified using the standard occupational classification system (SOC) and included 867 detailed occupations aggregated into 459 broad occupations used in our study (U.S. Department of Labor, 2018). Starting in 2018, the American Community Survey (ACS) began coding occupational data using the 2018 Census Occupation Code List based on the 2018 SOC. From 2010 to 2018, there was a gain of 27 detailed occupations (https://www.census.gov/topics/employment/industry-occupation/guidance.html).
We focused on detailed occupations as in prior census studies rather than “all other,” “other,” or “related” titles because these titles represent occupations with a wide range of characteristics which do not fit into one of the detailed O*NET-SOC occupations. O*NET data are not available for this type of title. Of the 569 specific occupations included on the Census Occupation Code List, we excluded 61 such occupations, as well as the 4 military occupations, yielding a final count of 504 detailed occupations analyzed in this study. Although notable, these exclusions represent a relatively small number of workers compared to those included in our analysis. For example, although 139,951 individuals were employed as “Counselors, All Other” in 2020, 498,735 individuals were employed in detailed counseling occupations such as mental health counselors and rehabilitation counselors, and 20,937,253 were employed in detailed Social occupations as a whole.
After locating the 2020 census data from the U.S. Census Bureau with lists of occupations categorized with census and SOC codes, we organized this information into an Excel file using the following headings: Occupation, Holland Code, employment data, and median annual income, and these data were the basis for our analysis of the 2020 census. We used the first letter Holland Codes in O*NET, the Occupations Finder—Revised Edition (OF; Holland & Messer, 2017), and the Dictionary of Holland Occupational Codes (DHOC; Gottfredson & Holland, 1996) to obtain the first letter Holland code for detailed occupations as needed.
A Note About Data Analysis
The present study continued the approach of previous research on census data and Holland codes, which reported frequency and percentage distributions. We used nominal data, a type of data that is used to label variables without providing any quantitative value (Reynolds, 1984). Nominal data variables can be grouped together into categories, and for each category, the frequency or percentage can be calculated. It is the simplest form of a scale of measure and different from interval or ratio data. As noted by earlier researchers (Gottfredson & Daiger, 1977), the sample sizes in census studies are so large as to render the magnitude of observed differences more important than statistical differences. We rounded numbers to the nearest percent or thousand in this report to avoid communicating a misplaced sense of precision in the findings.
Results
Occupational Titles in the Census for Six Kinds of Work, 1960–2020
To address the first research question, we examined the number of occupational titles identified by each U.S. census from 1960 to 2020. We also categorized occupational titles according to Holland’s (1997) RIASEC typology, using the methods outlined above, and we compared the overall number of occupational titles associated with each RIASEC area.
Number and Percentage of Census Occupations by Six Kinds of Work, 1960–2020.
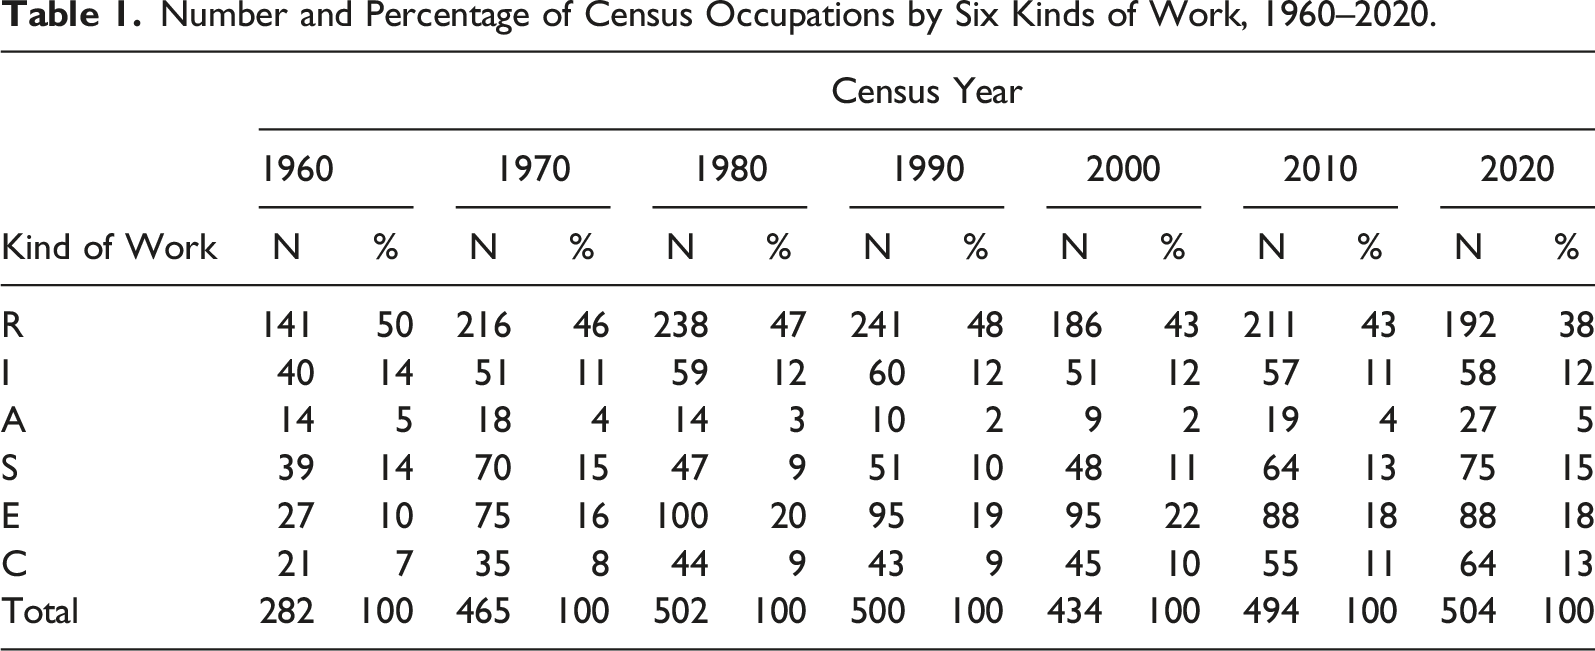
Also displayed in Table 1 are the relative distributions of occupational titles across the six RIASEC areas from 1960 to 2020. This distribution has remained fairly stable over time, with the Realistic category consistently encompassing more occupations than any other area and Artistic category consistently claiming the fewest occupational titles. The relative distribution of occupational titles among RIASEC types can be summarized using the mean percentages for 1960–2020 shown in Table 1: Realistic 45%, Investigative 12%, Artistic 4%, Social 12%, Enterprising 18%, and Conventional 10%. This distribution is similar to what was found in 2020: Realistic 38%, Investigative 12%, Artistic 5%, Social 15%, Enterprising 18%, and Conventional 13%.
Employment in Six Kinds of Work, 1960–2020
Number and Percentage of Persons Employed in Six Kinds of Work, 1960–2020.
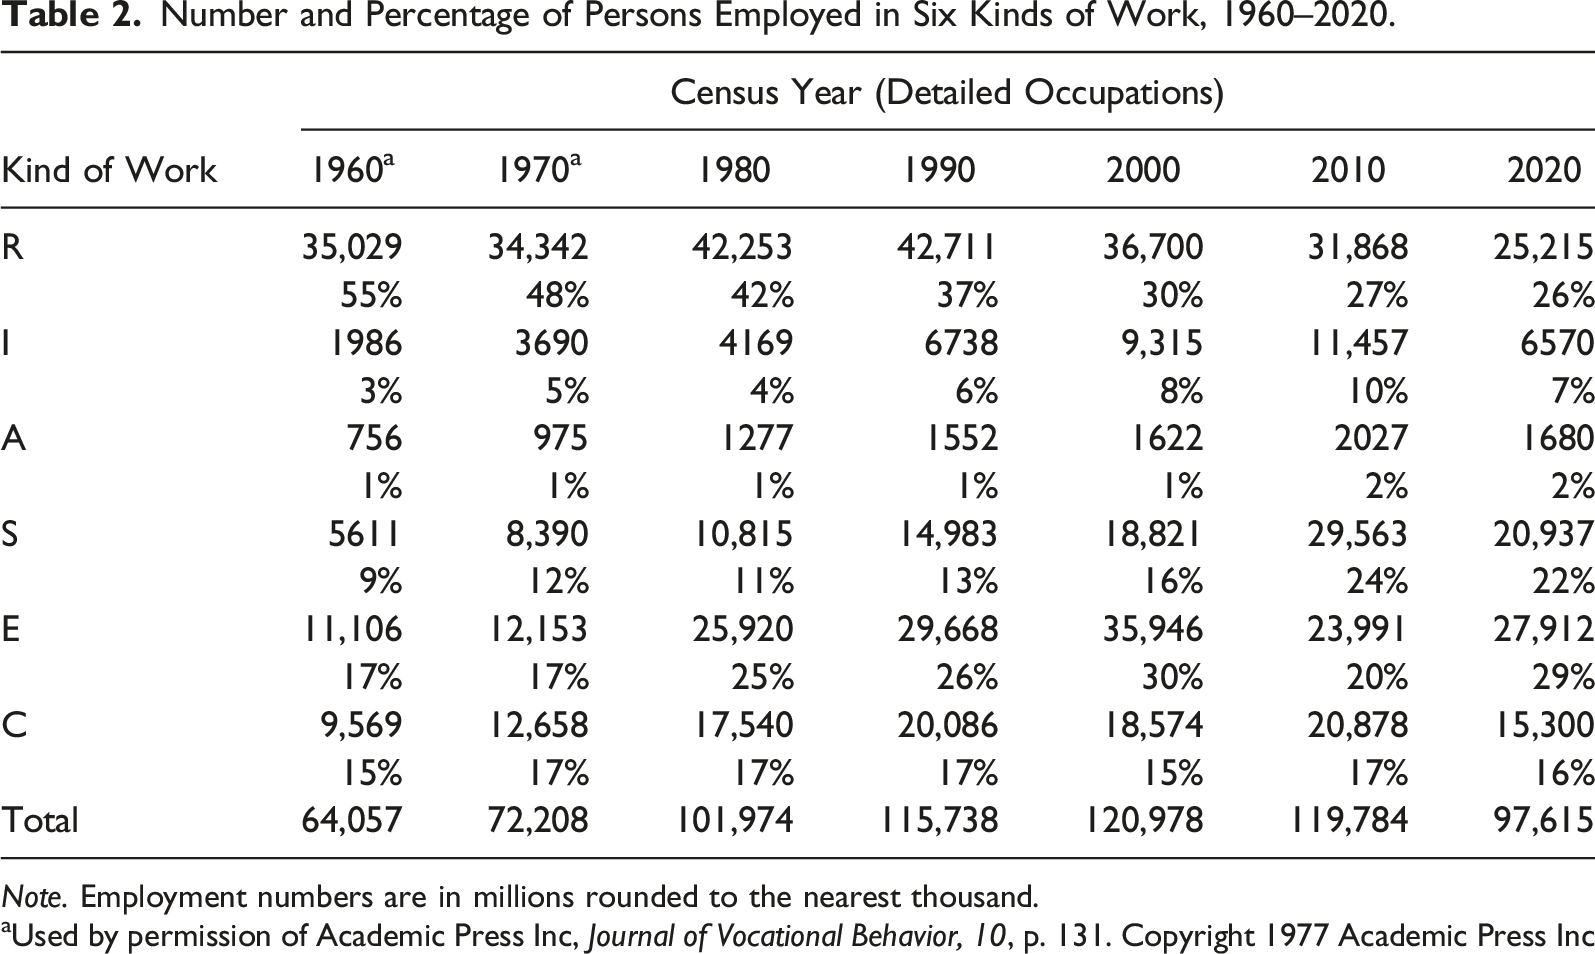
Note. Employment numbers are in millions rounded to the nearest thousand.
aUsed by permission of Academic Press Inc, Journal of Vocational Behavior, 10, p. 131. Copyright 1977 Academic Press Inc
Income and Kinds of Work in 1990–2020
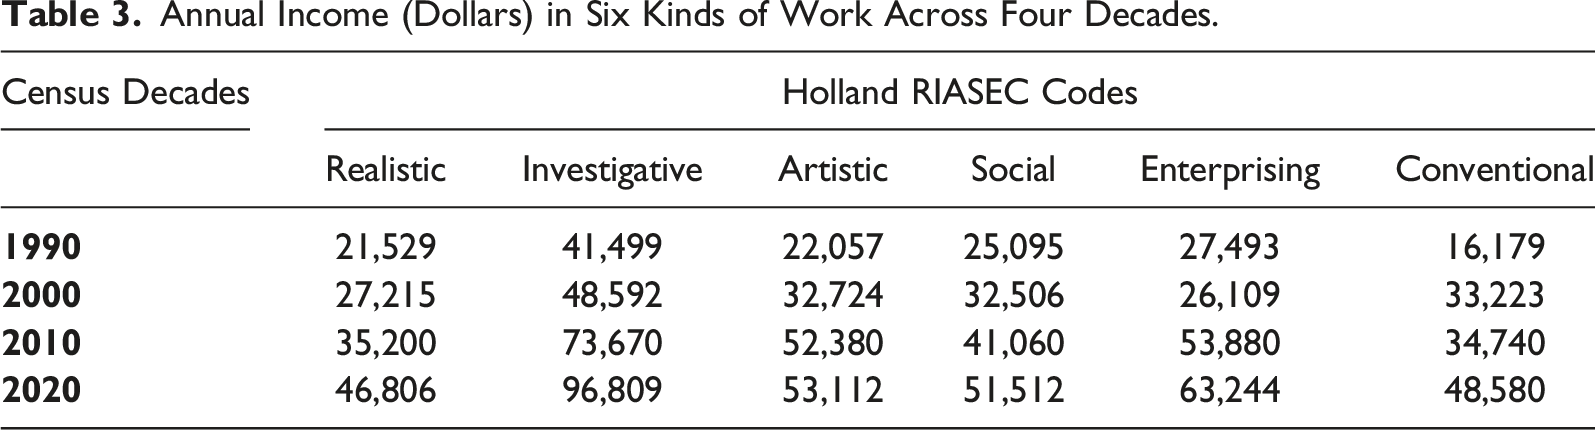
Annual Income (Dollars) in Six Kinds of Work Across Four Decades.
Discussion
This study, based on US census data using Holland’s RIASEC schema over 70 years, is one of nine published articles authored by 11 different scholars. As such, it represents a unique contribution to career development and vocational psychology literature with respect to the environmental aspects of Holland’s theory. The principal findings of the current study are examined in terms of the three questions that guided the research, followed by a discussion of the implications for practice and research.
Occupational Titles by RIASEC Code
Although the total number of occupations identified by the U.S. census has increased since 1960, most of this growth occurred between 1960 and 1970, when the U.S. census occupation list expanded from 282 to 465 titles. Notably, the total number of occupational titles identified by the U.S. census has remained relatively stable since that time, ranging from a low of 434 in 2000 to a high of 504 in 2020.
Similarly, the uneven distribution of occupational titles across the six RIASEC environments has remained relatively stable over time (see Table 1). For example, the Realistic environment has consistently encompassed more occupational titles than any other RIASEC area over the past seven decades. Notably, the relative distribution of occupational titles across RIASEC environments has remained almost identical since 1990, despite concurrent economic, technological, and social changes. Specifically, the areas with the highest to lowest number of occupational titles in both the 2010 and 2020 censuses can be represented as
This stability in the overall number and distribution of occupational titles across RIASEC environments contradicts concerns raised by some theorists (e.g., Savickas, 2009, 2012) that the concept of “occupation” is outmoded given current social, economic, and technological changes. In contrast, our findings align with those of Elvery (2019), who used census data and the SOC classification U.S. (Department of Labor, 2018) to examine the occupational mix from 1860 to 2015. Elvery (2019) found that the mix of occupations has become increasingly stable since 1970; moreover, the degree of change in recent years is less than half since the decades of most change (e.g., 1900s, 1940s), despite continuing technological advancement. This paradox can be explained by considering the difference between the occupational title and the tasks performed within that occupation. For example, a cashier in 1960 would not have used the bar code scanner wielded by cashiers today. Similarly, McClain and Reardon (2014) pointed out that information about jobs and positions changes more frequently than information about occupations (e.g., typical duties, requisite training, and working conditions) and cited the field of general semantics to illustrate this point: …the word ‘chair’ can communicate information about the arrangement of furniture in a room, but this word does not communicate everything known about ‘chairs,’ which in reality may take many different forms and be built of varied kinds of materials. The same is true for occupational terms. There are many different ‘carpenters’ working in varied job positions and for varied employers, but the term ‘carpenter’ still has meaning in communications because it is generally understood that not all carpenters are the same. (Johnson, 1946, p. 9)
Overall, these findings support the use of a theory-based, RIASEC view of work environments. This means that career practitioners can use Holland’s RIASEC typology to help clients learn about occupational options and to increase their understanding of the world of work.
The uneven distribution of occupational titles across the six RIASEC areas (see Table 1) may impact information about jobs and employment used in career counseling. Fifty-seven percent of the titles used in 2020 were in the Realistic and Enterprising areas, and these two categories have been consistent over the past seven decades. It is noteworthy that the percentage of titles in the 2010 and 2020 census from highest to lowest was
Gottfredson and Holland (1989) examined the number of times a RIASEC letter appeared somewhere in the three-letter Holland code for each occupation reported in the Dictionary of Occupational Titles (DOT). They found variations in the distribution of RIASEC codes for occupational titles, as follows: Realistic appeared 10,708 times; Investigative 2551 times; Artistic 570 times; Social 6606 times; Enterprising 10,405 times; and, finally, Conventional 5999 times. These numbers reveal that we can obtain a theory-based view of work environments when we examine the world of work from a RIASEC perspective. This means that career practitioners can use the RIASEC typology of work environments to help clients increase their understanding of employment trends in order to make informed career decisions.
Over the seven decades of this analysis, the total number of census occupations in the RIASEC areas has been relatively stable, ranging from 434 (2000) to 504 (2020). The exception was 282 in 1960. This indicates a relatively stable array of named occupations in the workforce as recognized by the U.S. census. This finding stands in contrast to Savickas and others (2009, 2012), who argued that the contemporary global economy has rendered the concept of occupation unstable and outmoded.
Employment in Six Areas of Work
Our findings suggest that the increase in total employment in the U.S. labor force from 1960 to 2020 paralleled a corresponding growth in employment across most RIASEC work environments. For example, the number of workers employed in Investigative environments increased from about 2 million in 1960 to 6.6 million in 2020, while employment in the Social and Enterprising areas grew from 5.6 million to 20.9 million and from 11.1 million to 27.9 million, respectively. The Artistic and Conventional areas experienced moderate growth in overall employment. However, employment in Realistic occupations decreased from 35 million in 1960 to 25.2 million in 2020.
Despite this decrease, Realistic environments remain a leading area of employment for U.S. workers, employing over a quarter of the U.S. workforce in 2020. Our analysis of employment across the six RIASEC environments (see Table 2) revealed that other leading areas of employment in 2020 were the Enterprising and Social areas. Conversely, Artistic and Investigative environments employed the fewest workers in 2020. The percentages of the U.S. workforce employed in the six RIASEC areas in 2020 can be summarized from highest to lowest by the profile
These findings run contrary to the current emphasis placed on recruitment and preparation for STEM fields (science, technology, engineering, and mathematics) by some policy makers, parents, and educators. STEM occupations, typically found in the Investigative and Artistic areas, employed an average of 5% of the U.S. workforce in 2020 compared to an average of 23% in the other four areas. Our findings corroborate recent research in business (Cappelli, 2015) and sociology (Liu & Grusky, 2013), which found that employer demand for STEM skills has proven more modest than predicted by many government and educational institutions. These findings also point to the oft-overlooked fact that many employment opportunities stem from the replacement of older workers: Elsby et al. (2021) suggested that replacement hires still account for, on average, 40 to 45% of all hires, especially in big growth occupations.
We suggest that this census data provides employment information that can inform career planning and decision-making. At the same time, the Bureau of Labor Statistics uses occupational projections to forecast additional labor market information. For example, BLS identified the 20 occupations expected to have the most job openings through 2030 (“big growth occupations”) (https://www.bls.gov/news.release/pdf/ecopro.pdf
Income Across Six Areas of Work
In addition to the uneven distribution of employment across the six RIASEC areas, our findings suggest that average income varies according to RIASEC environment. Based upon our analysis of four decades of income data (1990–2020), Investigative occupations consistently earned the highest average income, while Realistic and Conventional occupations earned the lowest. Our findings (see Table 3) align with Huang and Pearce (2013), who found that workers in occupations associated with more Investigative and Enterprising elements netted higher annual incomes in 2010. Our findings are also consistent with Reardon et al. (2022), who found that the average income profile for the six types of work in 2010, from highest to lowest, was
A notable implication of these findings is the income potential associated with higher levels of education. Since Investigative occupations often require more education and training than other RIASEC areas, our analysis of census data provides evidence that education pays. This aligns with Reardon et al. (2022), who found that persons with higher levels of education enjoy, on average, lower levels of unemployment and higher weekly earnings.
Implications for Research and Practice
Implications for Future Research
In designing this 2020 census study, we continued to use the methods of previous RIASEC census studies, but future studies may choose to change these procedures. For example, future studies may (a) examine specific occupations rather than “related or other” occupations; (b) use occupational titles developed by the Bureau of Census in relation to SOC Codes and O*NET descriptions; (c) use first letters of RIASEC codes available in O*NET, the Occupations Finder, and other standard references; (d) use a different method for calculating income levels reported across the decades (e.g., use median levels rather than mean levels of income); (e) use a different sampling procedure than the one used by the Bureau of Census over seven decades, (f) report occupations that may have shifted within or among industry groups which would might change the income reported; and (g) report how the validity of a census may be affected by external events, for example, a pandemic, climate change, AI, and political purposes.
In addition, future studies of US census data using a RIASEC schema could examine education and training levels associated with occupations; whether occupations are growing, stable, or declining in workers; and employment by gender, cognitive complexity, education level, or ethnic group. Some of these variables were examined in earlier research, but we note that the census has changed the way that gender and ethnicity are now categorized.
Implications for Practice
In this section, we summarize and elaborate the findings of this study regarding implications for the work of career counselors and practitioners. When work and economic life is characterized by increased technology, globalization, and change, we believe that Holland’s RIASEC theory and studies of occupations reported by the US Bureau of Census over 70 years provide a useful perspective for career services providers. Occupational information is fluid and dynamic, like water flowing past the dock—the water may look the same, but it is always different. Generally, occupations employing large numbers of people change the least as revealed in this study. Indeed, there are still millions of jobs in manufacturing even though that part of the U.S. economy has declined over the past 30 years. It is information about positions in industries and work organizations that is frequently changing, not information about occupations. Thus, it is best to be somewhat tentative about occupational information because it never represents all of what is really happening at any one time with a particular employer or industry (Reardon et al. (2022).
The results of this analysis of six kinds of work and employment over seven decades have implications for career practitioners. First, our research underscores the validity of Holland’s (1997) “Rule of Asymmetrical Distribution of Types and Subtypes,” one of several important ideas Holland introduced to help practitioners interpret the Self-Directed Search interest inventory. This rule points out that the distribution of personality types across the six RIASEC areas is quite unequal; similarly, the distribution of jobs across the six areas is very uneven. This is an important practical consideration because RIASEC areas with relatively low employment numbers may have fewer opportunities for paid work. For example, the Artistic area of employment has consistently netted the fewest jobs (1% or 2%), while the Realistic area of employment continues to represent a large portion of paid work, ranging from 55% in 1960 to 26% in 2020. Therefore, career counselors and other practitioners should pause before steering clients away from Realistic types of work, as ongoing replacement needs ensure a continuing demand for workers in this area of employment.
Similarly, there is an uneven distribution of named census occupations across the six kinds of work. For example, the list of occupational titles used in the 2020 U.S. census was dominated by the Realistic area (N = 192, 39%), with very few Artistic occupations (N = 21, 4%). Inspection of Table 1 suggests that the occupational schema used by the U.S. Census Bureau has remained relatively stable over seven decades, at least from a RIASEC perspective.
Certain findings may be interpreted in multiple ways. For example, the Realistic area employed the second most persons in 2020. However, its share of employment dropped 29% from 1960 to 2020. In fact, the Realistic area lost more jobs than any other, decreasing from 42.7 million in 1990 to 25.2 million in 2020. We were surprised to see that employment in the Investigative area changed little from 1960 to 2020, from 6% to 7%. These findings can be explained by considering the issue of “big growth” and “fast growth” jobs described by Reardon et al. (2022)—in other words, the difference between occupations with the highest number of new jobs versus those with the highest percent increase in new jobs. Few occupations make both lists. Career information resources often highlight rapid growth in information and technology jobs. However, recognition of this “fast growth” sector should be tempered by the fact that only 7% of U.S. employment was in the Investigative area in 2020.
The findings of this current study serve to update and enhance career practitioners’ understanding of the contemporary labor market. Examining U.S. census data compiled over seven decades (1960–2020) through the lens of Holland’s RIASEC theory can inform career counseling practice and research. Ultimately, our findings can help counselors empower their clients to make well-informed career decisions and better match their personal characteristics to their work environments.
Summary
This paper analyzed civilian occupations and employment data collected by the U.S. Census Bureau over seven decades (1960–2020) with respect to six kinds of work (Holland’s RIASEC classification), occupational titles used, civilian employment, and income. It reviewed nine publications authored by 11 different scholars and represents a unique contribution to career development and vocational psychology literature with respect to the environmental aspects of Holland’s theory. The principal findings of the current study were examined in terms of three questions that guided the research.
First, we found that the occupational schema used to describe work activities in the U.S. economy have remained relatively stable over seven decades. The average percentage of occupational titles in the census across seven decades, 1960–2020, is Realistic 45%, Investigative 12%, Artistic 3%, Social 12%, Enterprising 18%, and Conventional 10%.
Second, this study focused on the detailed occupations as in previous census studies. The total estimated employment increased over the seven decades from 64.1 million in 1960 to 97.6 million in 2020. Employment in the Enterprising area increased from 17% in 1960 to 29% in 2020, or from 11.1 million to 27.9 million, the second highest increase across the six areas. During the same period, employment in the Investigative area increased from 3% in 1960 to 7% in 2020, or 2.0 million to 6.6 million persons. Employment in the other four areas remained more stable. The RIASEC employment profile for highest to lowest areas was
Third, data from the 2020 census continues to show wide variations in income levels among the six RIASEC groups. For example, in 2020, the income in the Investigative area was double that of the Realistic area.
Footnotes
Declaration of Conflicting Interests
The author(s) declared no potential conflicts of interest with respect to the research, authorship, and/or publication of this article.
Funding
The author(s) received no financial support for the research, authorship, and/or publication of this article.
Author Biographies
![]() .
.