
Abstract
Digital search platforms enable real-time observation of relationship distress through behavioral traces. This study tests whether Google Trends predicts official divorce rates in the United States, Germany, the Netherlands, and the United Kingdom from 2009 to 2023. We introduce Digital Behavioral Decoupling, in which online distress signals diverge from legal outcomes as divorce shifts from an institutional procedure to an emotionally mediated digital phenomenon. Methods include unit root tests, cointegration analysis, Granger causality, spectral coherence, and rolling-origin nowcasting. Search queries are grouped into pre-divorce (cognitive distress), during-divorce (procedural action), and post-divorce (emotional recovery) phases. Results show 62.5% of terms lead divorce rates by 1–2 years, yet only 8.3% remain significant after False Discovery Rate correction. The Netherlands demonstrates 100% forecast improvements beyond autoregressive models (DM 2.87–3.43, p < 0.02) across all search terms, from early relationship therapy queries through procedural and post-divorce searches, indicating systematic capture of the entire divorce pathway. Germany shows intermediate results with 33% forecast success beyond autoregressive benchmarks (DM 2.40–2.81) limited to problem-recognition terms, suggesting episodic crisis-driven engagement. The United States and United Kingdom show no forecast gains beyond autoregressive models despite high search volumes, consistent with information saturation in normalized divorce cultures. Lead-lag relationships are frequency-specific, concentrated at 3–5 year periodicities. Findings link family sociology with affective computing and provide a replicable toolkit for tracking relationship dissolution in algorithmically curated information environments.
Keywords
Introduction
Divorce is a legally regulated mechanism that allows individuals to end an unsatisfactory marriage while safeguarding personal rights and freedoms (Pešić-Jenaćković, 2018). The process involves recognizing marital dysfunction, evaluating possible responses, and ultimately implementing the decision (Solichah & Istiqomah, 2018). Similarly, it can be viewed as a three-phase transition encompassing pre-divorce decision-making, restructuring during-divorce, and post-divorce adjustment (Salts, 1985).
The perception and stigma of divorce are shaped by legal norms, cultural acceptance, and personal experience, with increasing social tolerance, particularly among younger adults, and reduced stigma in cases of unhappiness or violence (Cooney, 2022). As marriage dissolution becomes more normalized and associated with individual freedom and self-fulfillment, global divorce rates have generally risen, although recent data show stabilization or decline in some regions. High divorce rates are especially evident in Western countries, where estimates indicate that in the United States approximately 39–50% of first marriages end in divorce, and the United Kingdom experienced a sharp rise during the 20th century followed by moderation in the 2010s (Ho, 2025). Societal factors such as economic development, rising social and economic status of women, democratization, and political instability are positively associated with divorce rates, particularly in post-Soviet and transitioning societies (Aghayeeabianeh & Stamatel, 2022). Scientific perspectives also suggest that conflicts rooted in differing reproductive strategies between men and women contribute to divorce across cultures (Mortelmans, 2021).
Current prediction approaches rely on retrospective statistics or late-stage surveys, missing early intervention opportunities for government policies and support services. Although Google Trends is widely used to monitor collective emotions and public health, its application to divorce remains limited despite divorce being a major life transition with significant individual, familial, and societal costs. Questionnaire-based machine-learning models achieve high accuracy but depend on narrow survey samples (Kumar et al., 2023; Castrillón, 2021). Time series forecasts predict regional divorce counts using administrative data but fail to capture real-time behavioral signals preceding divorce (Derwanto, 2022; Yudistira et al., 2025). Moreover, existing studies treat divorce-related searches as uniform and lack systematic cross-national analyses linking search behavior to official statistics. This study addresses this gap by integrating official divorce statistics with Google Trends data and organizing search terms into pre-divorce (cognitive distress), during-divorce (procedural action), and post-divorce (emotional recovery) phases. We examine four countries (United States, United Kingdom, Germany, and the Netherlands) reflecting contrasting welfare regimes and divergent divorce trajectories since 1970 (Esping-Andersen, 1999). In the end of 2021, crude divorce rates were 2.5 per 1,000 in the United States, 1.7 in Germany, 1.5 in the Netherlands, and 1.8 in the United Kingdom, with sharper declines from mid-1990s peaks observed in the European cases (OECD, 2025). These cross-national differences, together with reliable administrative data and sufficient multilingual search volume, provide strong conditions for comparative time series analysis. The study introduces the concept of Digital Behavioral Decoupling, defined as the divergence between online distress signals and real-world divorce outcomes as marital dissolution becomes increasingly digitally mediated, that is, emotionally processed through online searches and information-seeking. Accordingly, we ask: (1) to what extent can Google Trends data predict official divorce rates across national contexts, and (2) under what conditions does digital search behavior decouple from administrative divorce statistics. Hence, the study offers a scalable framework for detecting relational distress in the digital age.
The use of Google Trends as a data source for divorce prediction is supported by growing evidence that couples increasingly seek help online when facing relational difficulties. Research has shown that couples frequently seek external support when facing relational uncertainty, with more than one-third turning to resources such as marital counseling or relationship literature within the first 5 years of marriage, often in response to individual or interpersonal difficulties (Doss et al., 2009). The search for relationship-relevant or distressing information plays a key role in regulating uncertainty and emotional well-being, as explained by the Theory of Motivated Information Management (Afifi et al., 2004). This help-seeking behavior has shifted substantially toward digital platforms. Individuals who seek support digitally report qualitatively different concerns than those in traditional therapy, particularly involving trust deficits, reduced shared time, and parenting strain (Roddy et al., 2019). Digital help-seeking now exceeds conventional services, especially among women experiencing acute relational distress, with nearly two in five turning to online resources (Trillingsgaard et al., 2019). Large-scale analyses further indicate that younger populations use online platforms as spaces for emotional disclosure and problem-solving related to intimacy, communication, and attachment (Entwistle et al., 2021). This trend suggests that relationship distress is increasingly expressed through digital channels, making search engine data a promising source for real-time monitoring of marital strain.
Literature Review
Studies have established that search engines like Google serve as indicators of emotional distress. Google Trends query indices summarizing search term frequency over time and across regions correlate with diverse real-world phenomena, including housing foreclosures, labor market conditions, epidemiological trends and political events. Emerging Google Trends topics can trigger collection and analysis of geolocalized tweets, enabling decision makers to monitor near real-time sentiments and emotions these trends evoke in online populations (D’Avanzo et al., 2017). A study shows that Google Trends reflects population-level emotional states; for instance, searches for “anxiety” significantly correlate with both the UN World Happiness Index and the OECD Life Satisfaction Index. These findings support that Google Trends can serve as a useful indicator for estimating population-level well-being when applied to high-volume search terms, though reliability concerns remain for low-frequency queries (Banerjee, 2018). Emotional search data track established well-being indicators and predict health outcomes such as cardiovascular conditions and depression beyond income and traditional measures. Aggregate Google searches for affect-related terms (e.g., stress, depression, fatigue, and scared) correlate with survey-based well-being, personality, and Twitter (X) language, while uniquely predicting depression rates and circulatory disease mortality at state and metro levels after controlling for demographic and socioeconomic factors (Ford et al., 2018).
Validation during crisis periods, including the COVID-19 pandemic, confirms that search trends can act as sensitive indicators of widespread emotional strain and anxiety, supported by consistent findings across multiple data sources (Boy, 2023). The COVID-19 pandemic provided a natural experiment for observing how external stressors influence divorce-related search behavior. Divorce-related searches initially declined during early lockdown phases, consistent with restrictions on mobility and institutional closures (Brodeur et al., 2021). As stay-at-home conditions persisted, however, a rebound emerged, especially in higher-income nations, suggesting that prolonged confinement intensified relational pressures (Cheng et al., 2025). Parallel analyses confirm this pattern, revealing a temporary 11% decrease in Europe followed by a 13% post-lockdown surge in the United States (Berger et al., 2021). These findings demonstrate that Google Trends data can capture temporal shifts in relationship distress at population scale.
A range of recent studies demonstrates that divorce rate prediction increasingly relies on structured questionnaires or official statistical series, achieving very high accuracy under controlled or narrow data conditions. Several machine-learning studies using the UCI Divorce Predictors dataset show that decision-tree-based models can reach 100% accuracy when coupled with feature selection (Kumar et al., 2023). J48-based decision trees similarly identify a small set of influential variables with perfect classification when more than 90% of the sample is used for training (Castrillón, 2021). Another ensemble-learning study employing Support Vector Machines (SVMs), passive-aggressive classification, and multilayer perceptron reports near-perfect classification performance based on expert-designed questionnaires (Sadiq Fareed et al., 2022). In contrast, time series forecasting studies focus on predicting regional divorce counts using statistical smoothing methods, such as exponential or triple-exponential smoothing, but rely solely on administrative data and do not capture behavioral or attitudinal signals preceding divorce (Derwanto, 2022; Yudistira et al., 2025). Demographic analyses suggest broader social trends, such as declining divorce rates among younger cohorts in the United States, based on large census datasets, but provide limited insight into real-time behavioral indicators or early warning signals (Cohen, 2019).
Despite this growing body of research, no study has systematically compared divorce-related search behavior across multiple countries or examined whether search patterns correspond to distinct phases of the divorce process. Furthermore, existing time series approaches have not tested for bidirectional relationships between search behavior and official statistics, leaving open the question of whether online signals precede, follow, or decouple from administrative divorce outcomes.
Data and Method
Data
This study combines Google Trends data with official divorce statistics to enable cross-national comparison of online search behavior and institutional divorce rates. Google Trends was used to collect search terms related to marriage, divorce, and counseling with semantically equivalent translations, normalized to relative search interest over time (Google Trends, 2025). Official divorce rates were expressed as divorces per 1,000 population for comparability. U.S. data were obtained from the CDC report National Marriage and Divorce Rate Trends for 2000–2023 (Centers for Disease Control and Prevention, 2025). German data came from the Marriages, Divorces (Time Series) dataset (German Federal Statistical Office, 2024). Dutch statistics were sourced from Marriage Dissolutions; Due to Divorce and Death (Statistics, 2025). U.K. data were retrieved from Divorces and Dissolutions in England and Wales: 2023 (Office for National Statistics, 2025), and, because separate rates are provided for men and women, the analysis used their average, as the gender difference was minimal (0.2 at most). For Google Trends, A common 15-year period (2009–2023) was selected to ensure temporal alignment and address years with near-zero or inconsistent (sudden changes—0 to high levels). Data is downloaded directly from the website by the authors on October 19, 2025.
Search terms were categorized into three divorce process phases based on semantic content. Two authors independently conducted this categorization, achieving high inter-rater reliability (93.8% agreement; 15 of 16 terms), with disagreements resolved through discussion. Pre-divorce phase queries capture cognitive distress and help-seeking (“marriage problems” and “marriage counseling”), during-divorce terms represent procedural action (“divorce” and “divorce lawyer”), and post-divorce searches address emotional recovery (“after divorce”). Search term identification combined theoretical foundations (Salts, 1985). Large language model consultation (ChatGPT; Claude and Grok) provided culturally appropriate translations; candidate terms were retained only if they returned non-zero search volume in Google Trends. Additional terms tested (Supplementary Material 1) were excluded due to near-zero or inconsistent search volumes with sudden unreasonable changes and recent emergence (i.e., after 2015).
Metrics
This study employs a time series econometric framework to examine the relationship between Google Trends search intensity and official divorce rates over 2009–2023. Our approach integrates unit root diagnostics, cointegration analysis, frequency-domain methods, lag structure identification, and forecast evaluation to address lead-lag dynamics and ensure robustness against spurious correlations in non-stationary time series data (Granger & Newbold, 1974). Given the limited 15-year observation window, we prioritize methods that balance statistical power with finite-sample reliability.
We establish the order of integration for each series using a consensus voting approach across three complementary unit root tests. The Augmented Dickey-Fuller (ADF) test (Dickey & Fuller, 1979) given in equation (1) estimates:

The Phillips-Perron (PP) test (Phillips & Perron, 1988) provides a non-parametric alternative to serial correlation and heteroskedasticity given by equation (2):

The Kwiatkowski-Phillips-Schmidt-Shin (KPSS) test (Kwiatkowski et al., 1992) reverses the null hypothesis, testing stationarity against the alternative of a unit root, as given by equation (3):

For series determined to be I (1), we test for cointegration—the existence of a stable long-run equilibrium relationship (Engle et al., 1987). The Engle-Granger two-step procedure first estimates the cointegrating regression, given in equation (4).

We supplement this with the Johansen trace test (Johansen, 1988), which estimates a Vector Error Correction Model (VECM) as given by equation (5):

When cointegration is detected, we estimate the Error Correction Model (ECM) given in equation (6), to quantify adjustment dynamics:

The cross-correlation function (CCF) identifies optimal lead-lag relationships in the time domain, given by equation (7):
We decompose relationships across frequency bands using spectral coherence using equation (8) (Granger and Newbold, 1974):
Phase-based lag is derived from the cross-spectrum phase angle, and it is given in equation (9):
To assess temporal stability of lead-lag relationships, we employ rolling window CCF analysis given by equation (10):

We implement a rolling-origin nowcasting procedure comparing baseline AR (
Baseline model is given by equation (11):


We evaluate forecast accuracy using Mean Absolute Error (MAE) and Root Mean Squared Error (RMSE) using equation (13):

Methodology and Experimental Setup
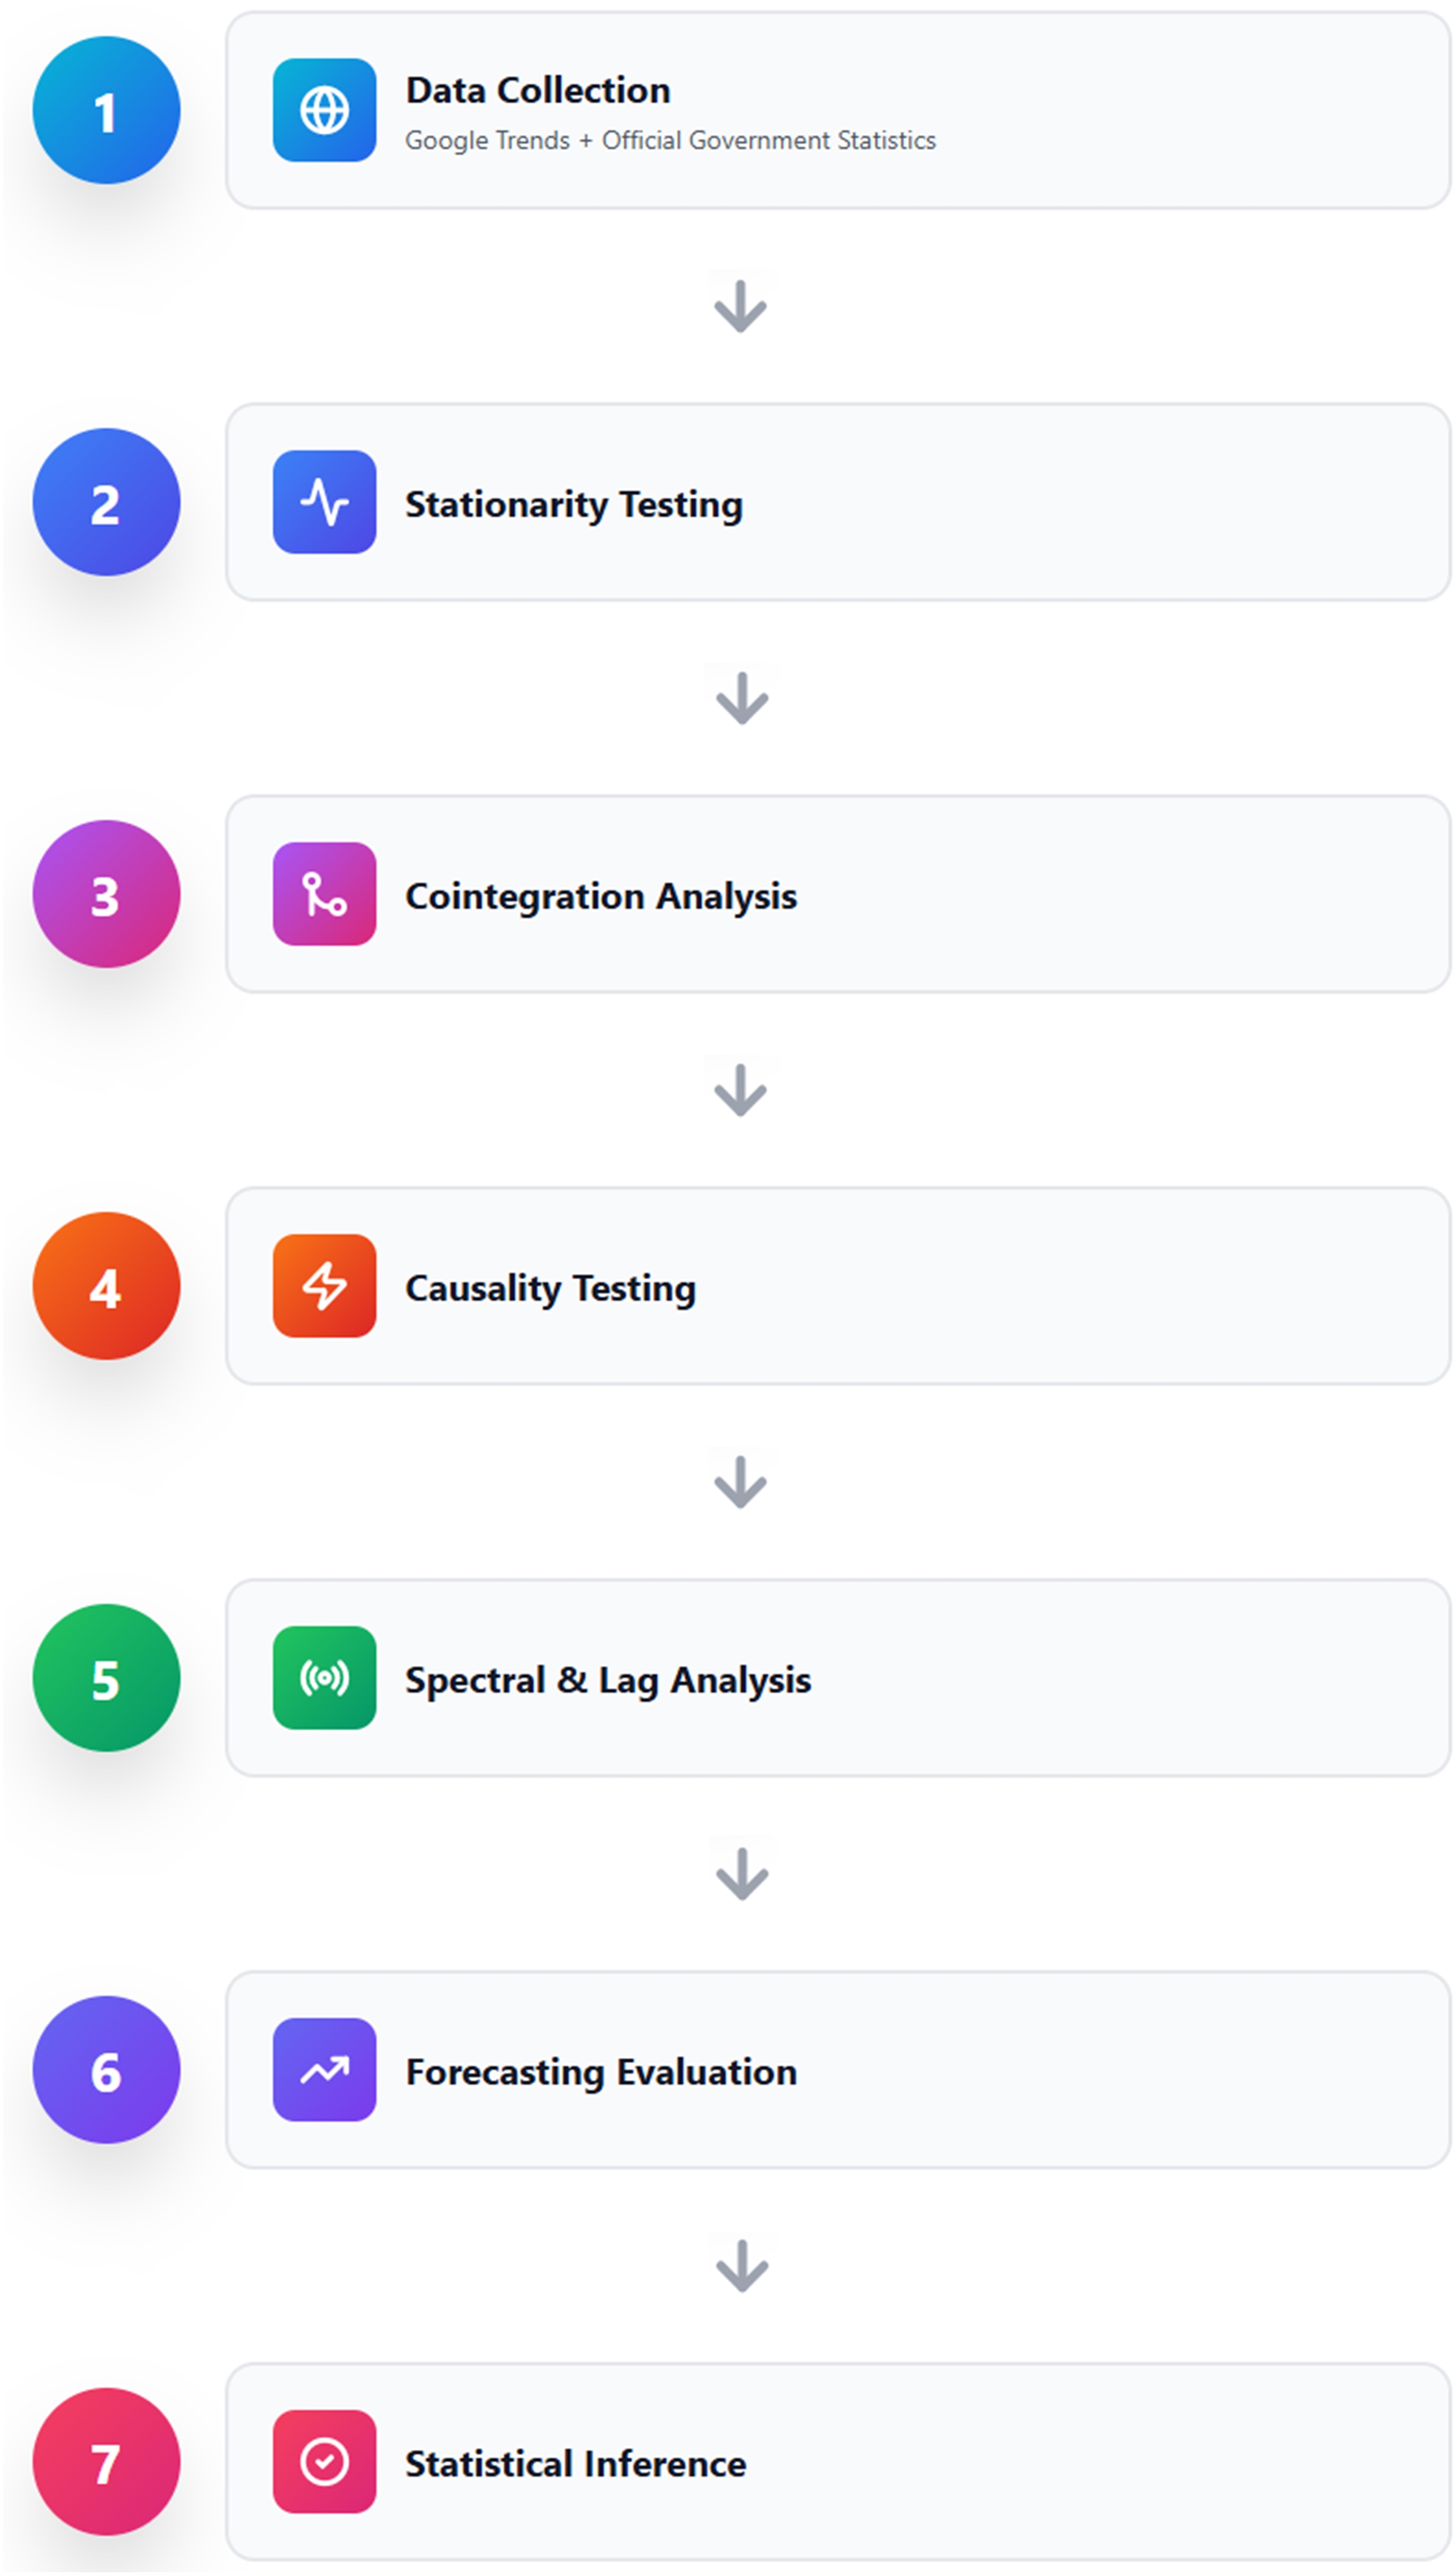
This study employs a comprehensive time series econometric framework to examine the relationship between online search behavior and official divorce rates over the period 2009–2023. The analytical pipeline consists of seven stages. The overview of the proposed methodology is given in Figure 1 and explained in detail below. (1) Data Collection: Google Trends data on marriage-related searches and official divorce statistics from national agencies (CDC, German Federal Statistical Office, Statistics Netherlands, and UK ONS) were compiled and standardized across countries. (2) Stationarity Testing: Series integration orders were identified through combined ADF, PP, and KPSS tests. (3) Cointegration Analysis: Long-run relationships between search intensity and divorce rates were examined using Engle-Granger, Johansen, and Gregory-Hansen tests. (4) Causality Testing: Directional effects were evaluated via Δ-Granger and VAR-level Granger tests with AIC-based lag selection and integration order adjustment. (5) Frequency and Lag Analysis: Cross-spectral coherence, phase spectra, and cross-correlation functions (including rolling windows) captured frequency-specific and temporal lead-lag structures. (6) Forecasting Evaluation: Rolling-origin nowcasting compared baseline autoregressive models with search-augmented versions using MAE, RMSE, and Diebold-Mariano tests for forecast improvement. (7) Statistical Inference: Benjamini-Hochberg False Discovery Rate correction (α = 0.05) was applied to control for multiple testing. Method overview
All statistical analyses were performed using Python 3.12.12. Data manipulation and preparation utilized Pandas, a high-performance library for structured data operations (McKinney, 2010). Numerical computations employed NumPy (Harris et al., 2020). Statistical testing, including unit root tests, cointegration analysis, and probability distributions, leveraged SciPy (Virtanen et al., 2020). Data visualization relied on matplotlib (Hunter, 2007). For publication-quality figures, Seaborn was employed (Waskom, 2021).
This econometric framework characterizes the dynamic link between online search behavior and divorce trends by controlling for spurious correlations through integration, cointegration, and multiple testing corrections. Combining time-, frequency-, and forecast-domain analyses enables evaluation of both contemporaneous and predictive relationships. All results are reported with FDR-adjusted significance levels.
Results and Discussion
Descriptive Results
Google Trends: Descriptive Statistics (2009–2023). Search Terms Related to Relationship Problems and Divorce Showed Substantial Cross-Country Variation, With Some Terms Exhibiting Up to 4-Fold Differences Between Minimum and Maximum Values
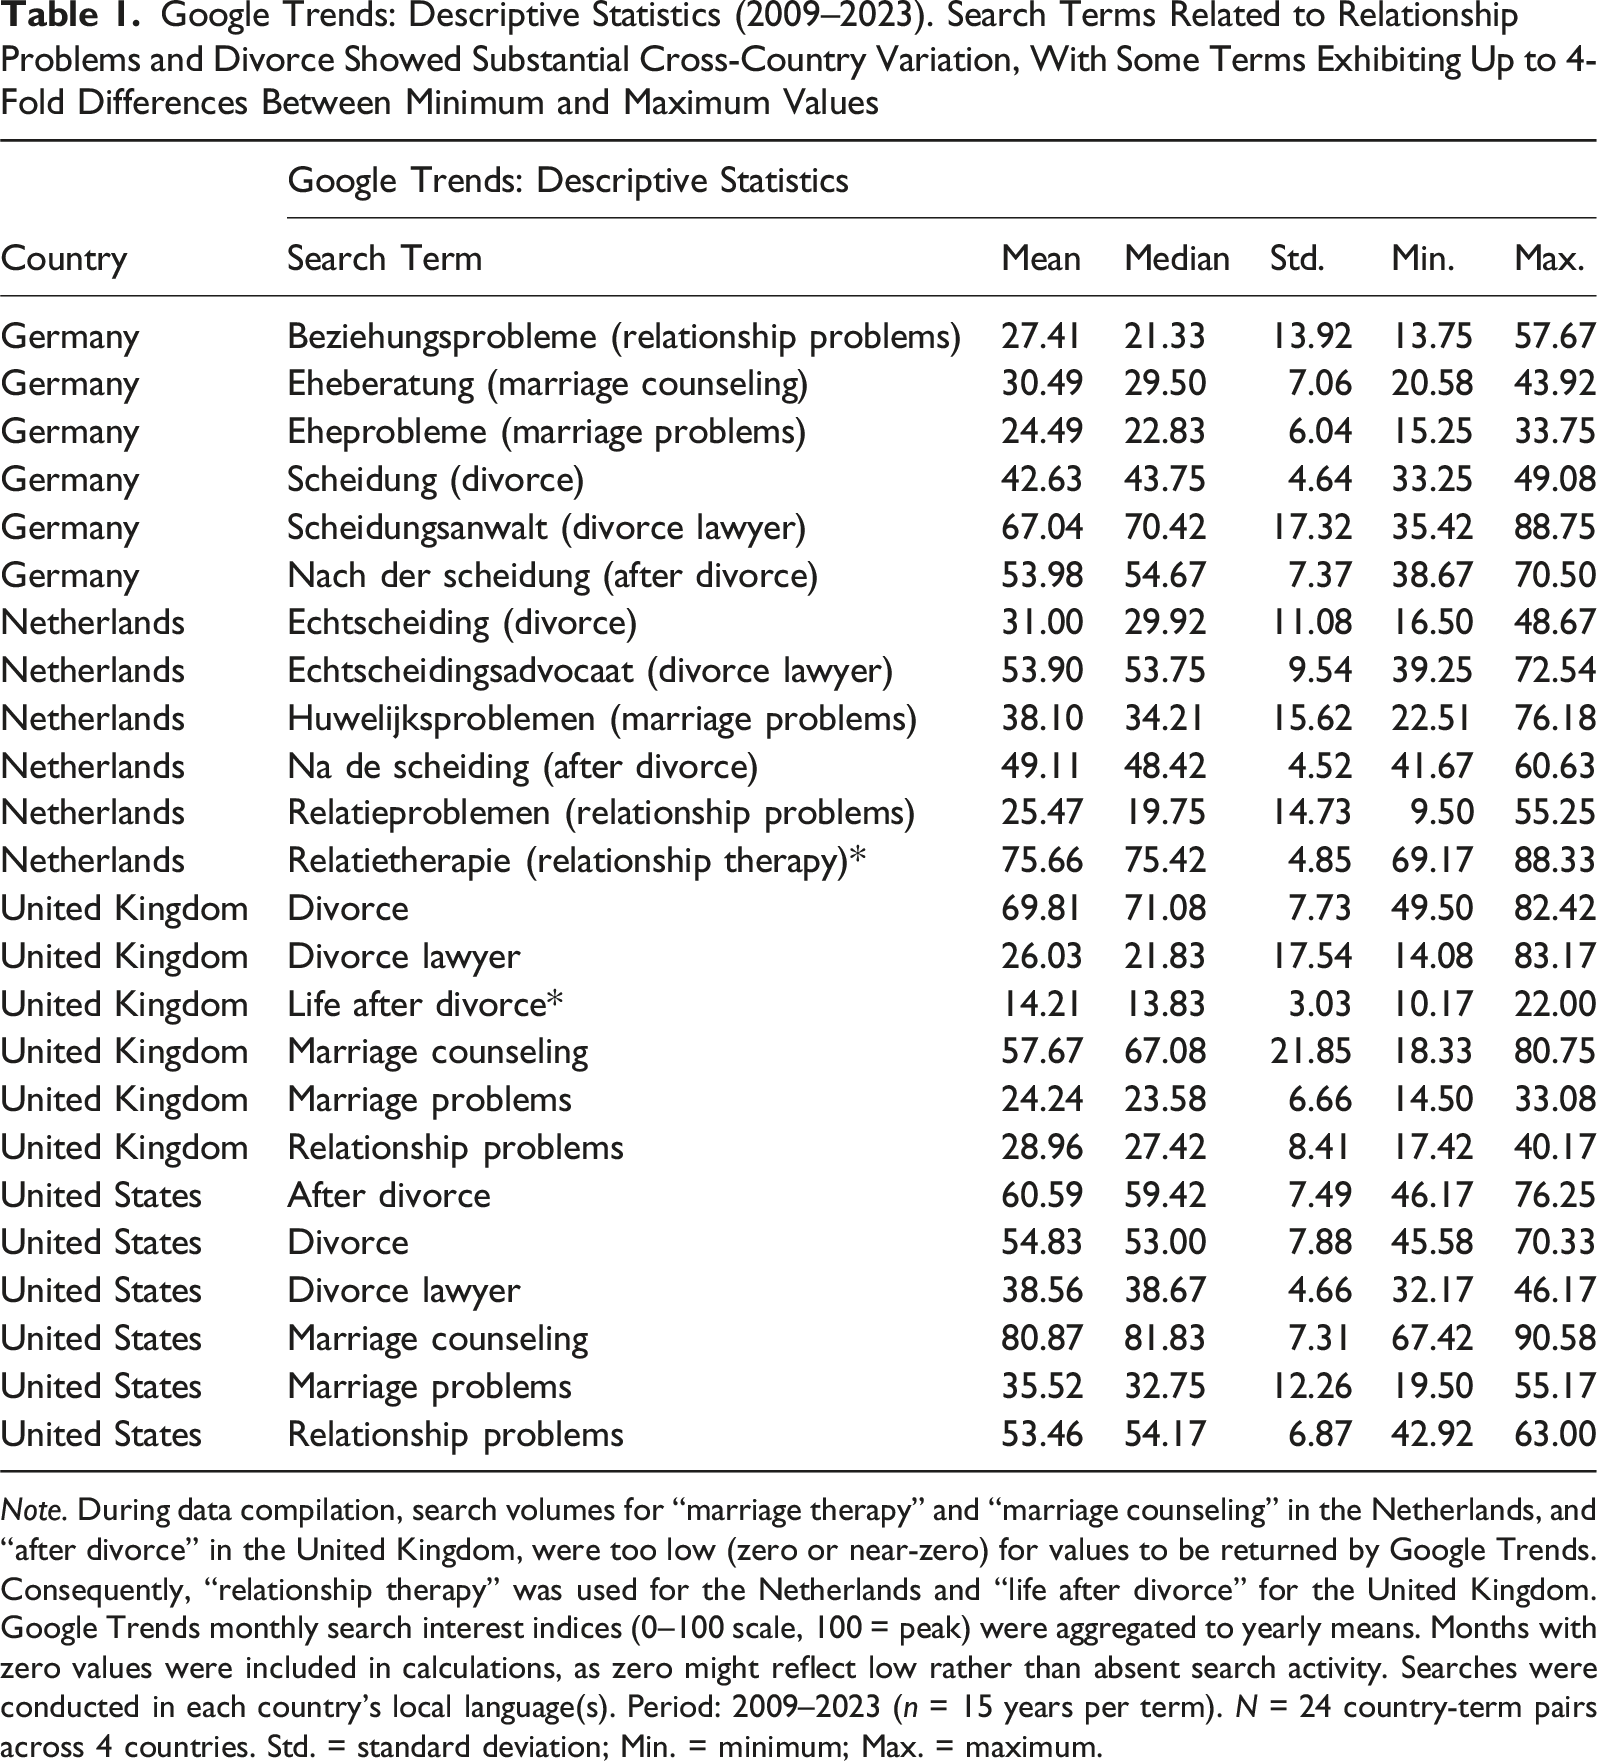
Note. During data compilation, search volumes for “marriage therapy” and “marriage counseling” in the Netherlands, and “after divorce” in the United Kingdom, were too low (zero or near-zero) for values to be returned by Google Trends. Consequently, “relationship therapy” was used for the Netherlands and “life after divorce” for the United Kingdom. Google Trends monthly search interest indices (0–100 scale, 100 = peak) were aggregated to yearly means. Months with zero values were included in calculations, as zero might reflect low rather than absent search activity. Searches were conducted in each country’s local language(s). Period: 2009–2023 (n = 15 years per term). N = 24 country-term pairs across 4 countries. Std. = standard deviation; Min. = minimum; Max. = maximum.
Official Divorce Rates: Descriptive Statistics (2009–2023). Crude Divorce Rates Per 1,000 Population; Higher Values Indicate More Divorces Relative To Population Size. UK Divorce Rates are Calculated Per 1,000 Married Population (ONS Methodology), While Other Countries Report Per 1,000 Total Population. Cross-National Rate Comparisons Should be Interpreted With This Difference in Mind. Period: 2009–2023. Std. = Standard Deviation; Min. = Minimum; Max. = Maximum
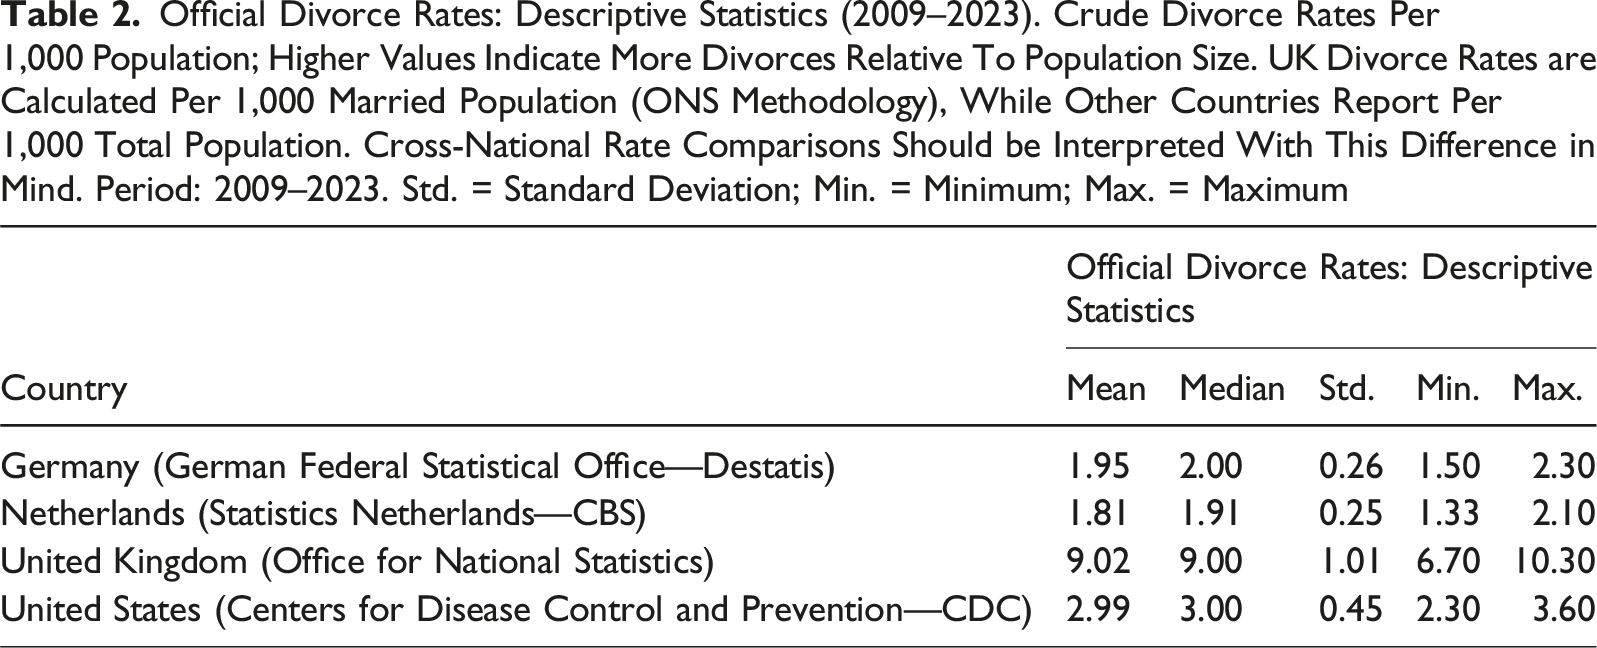
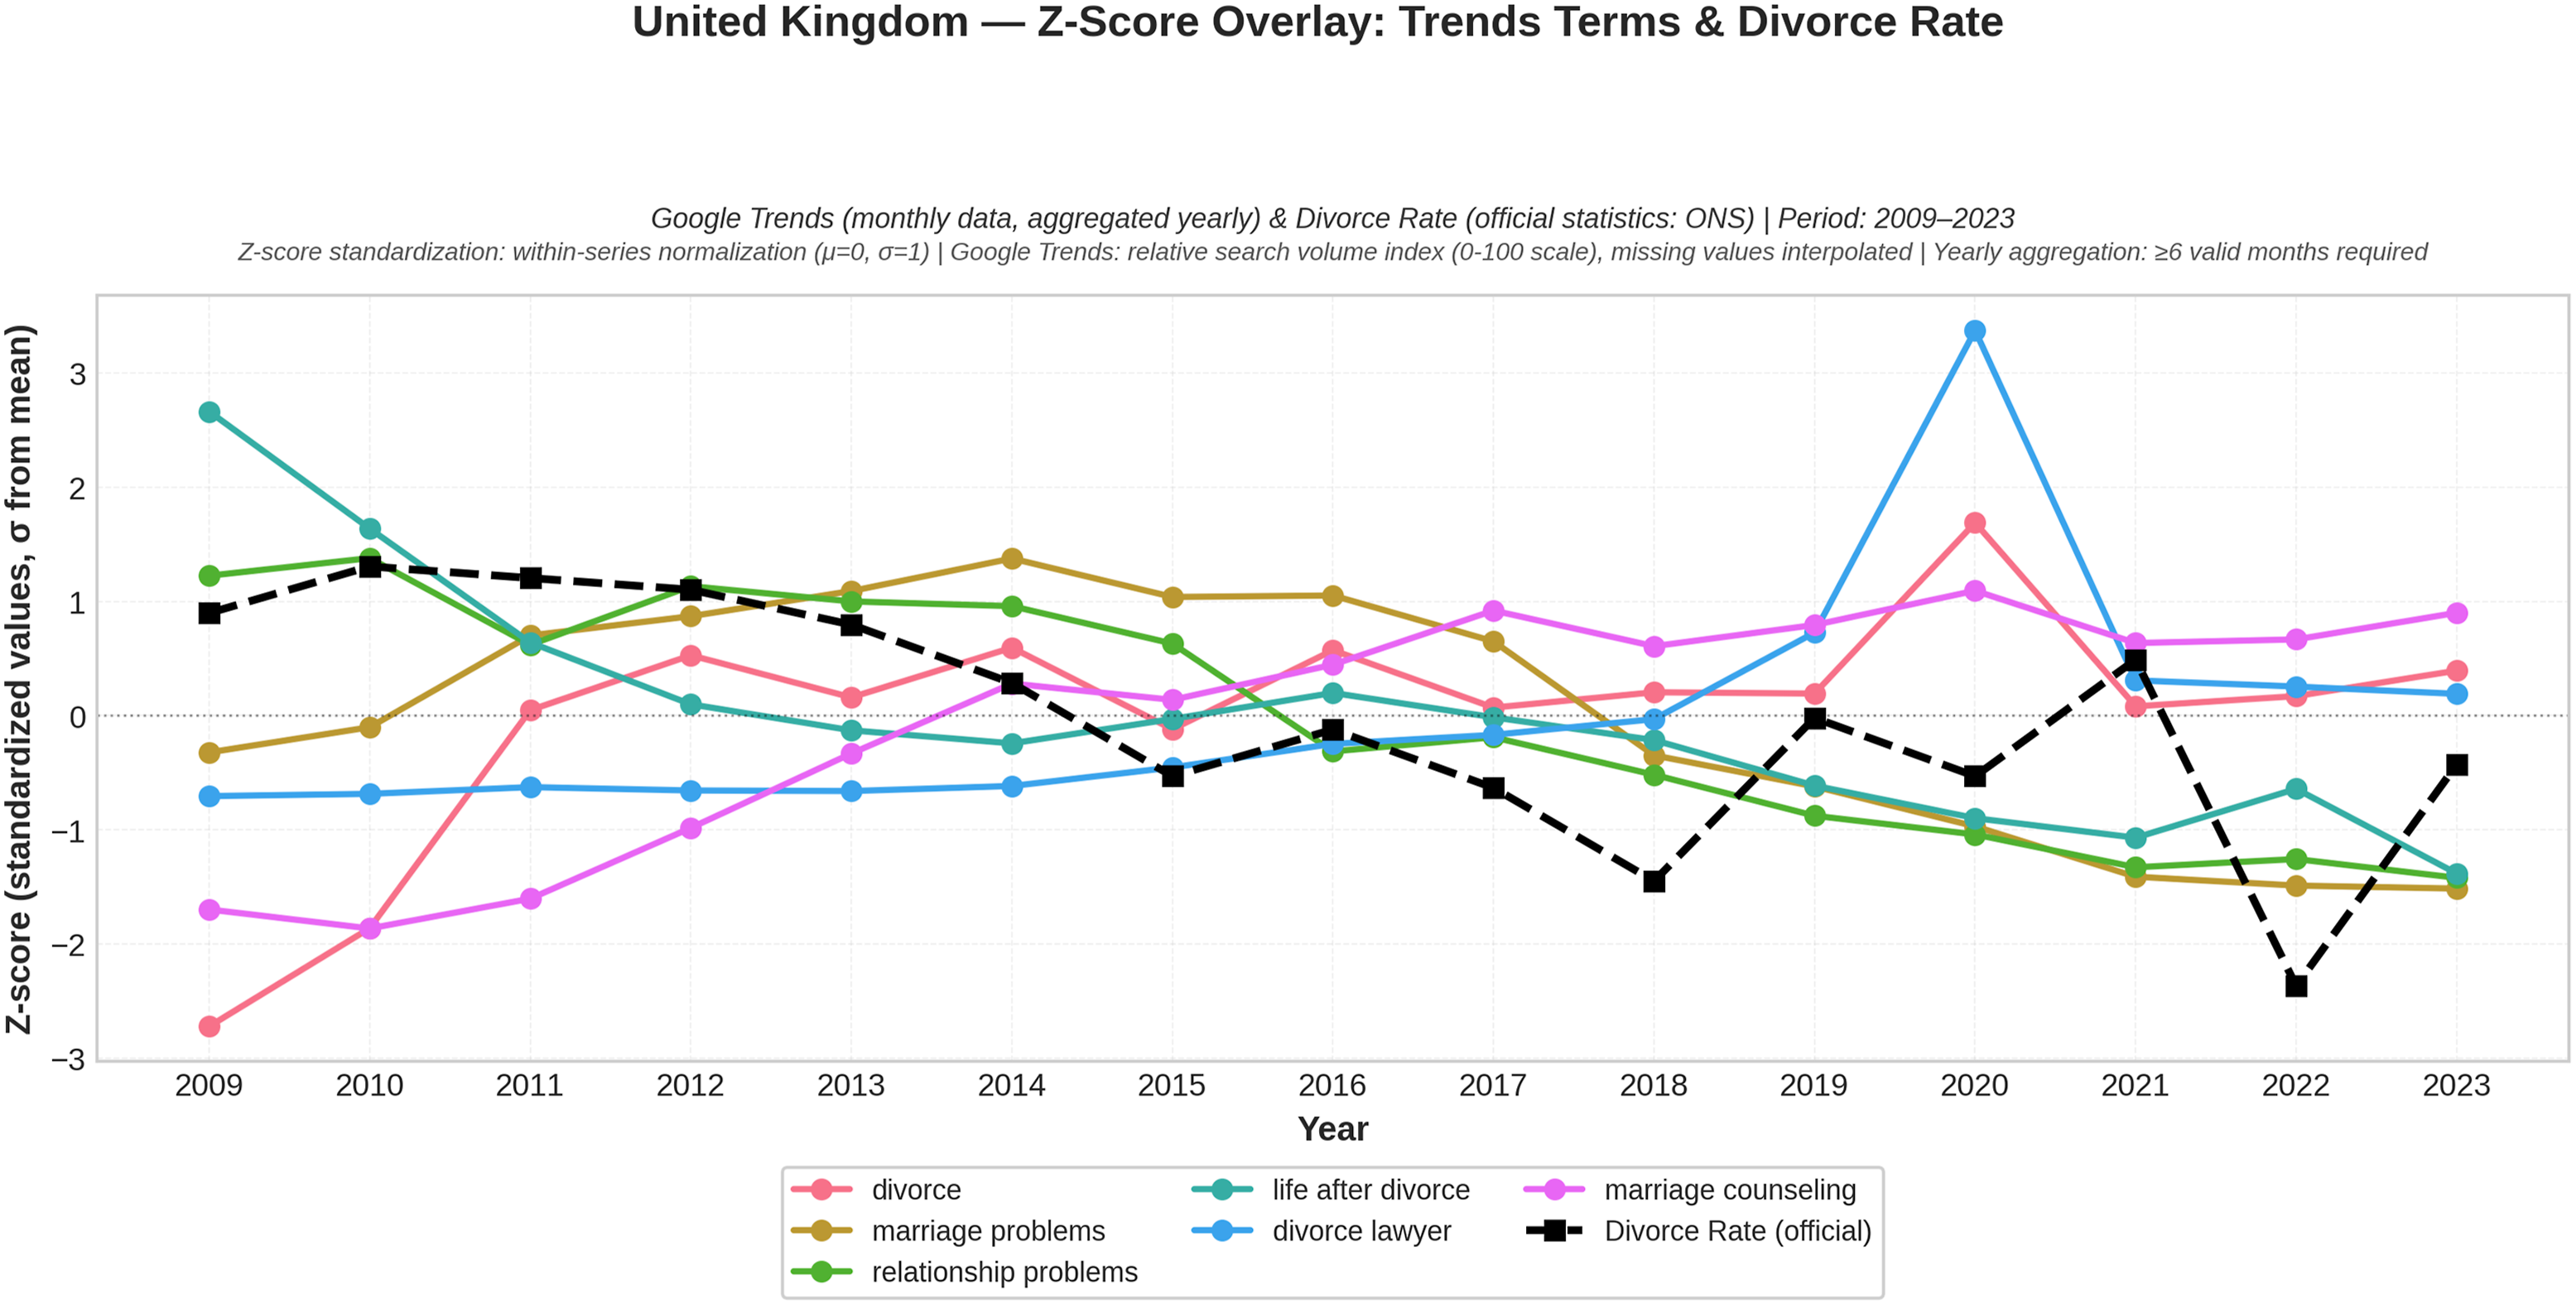
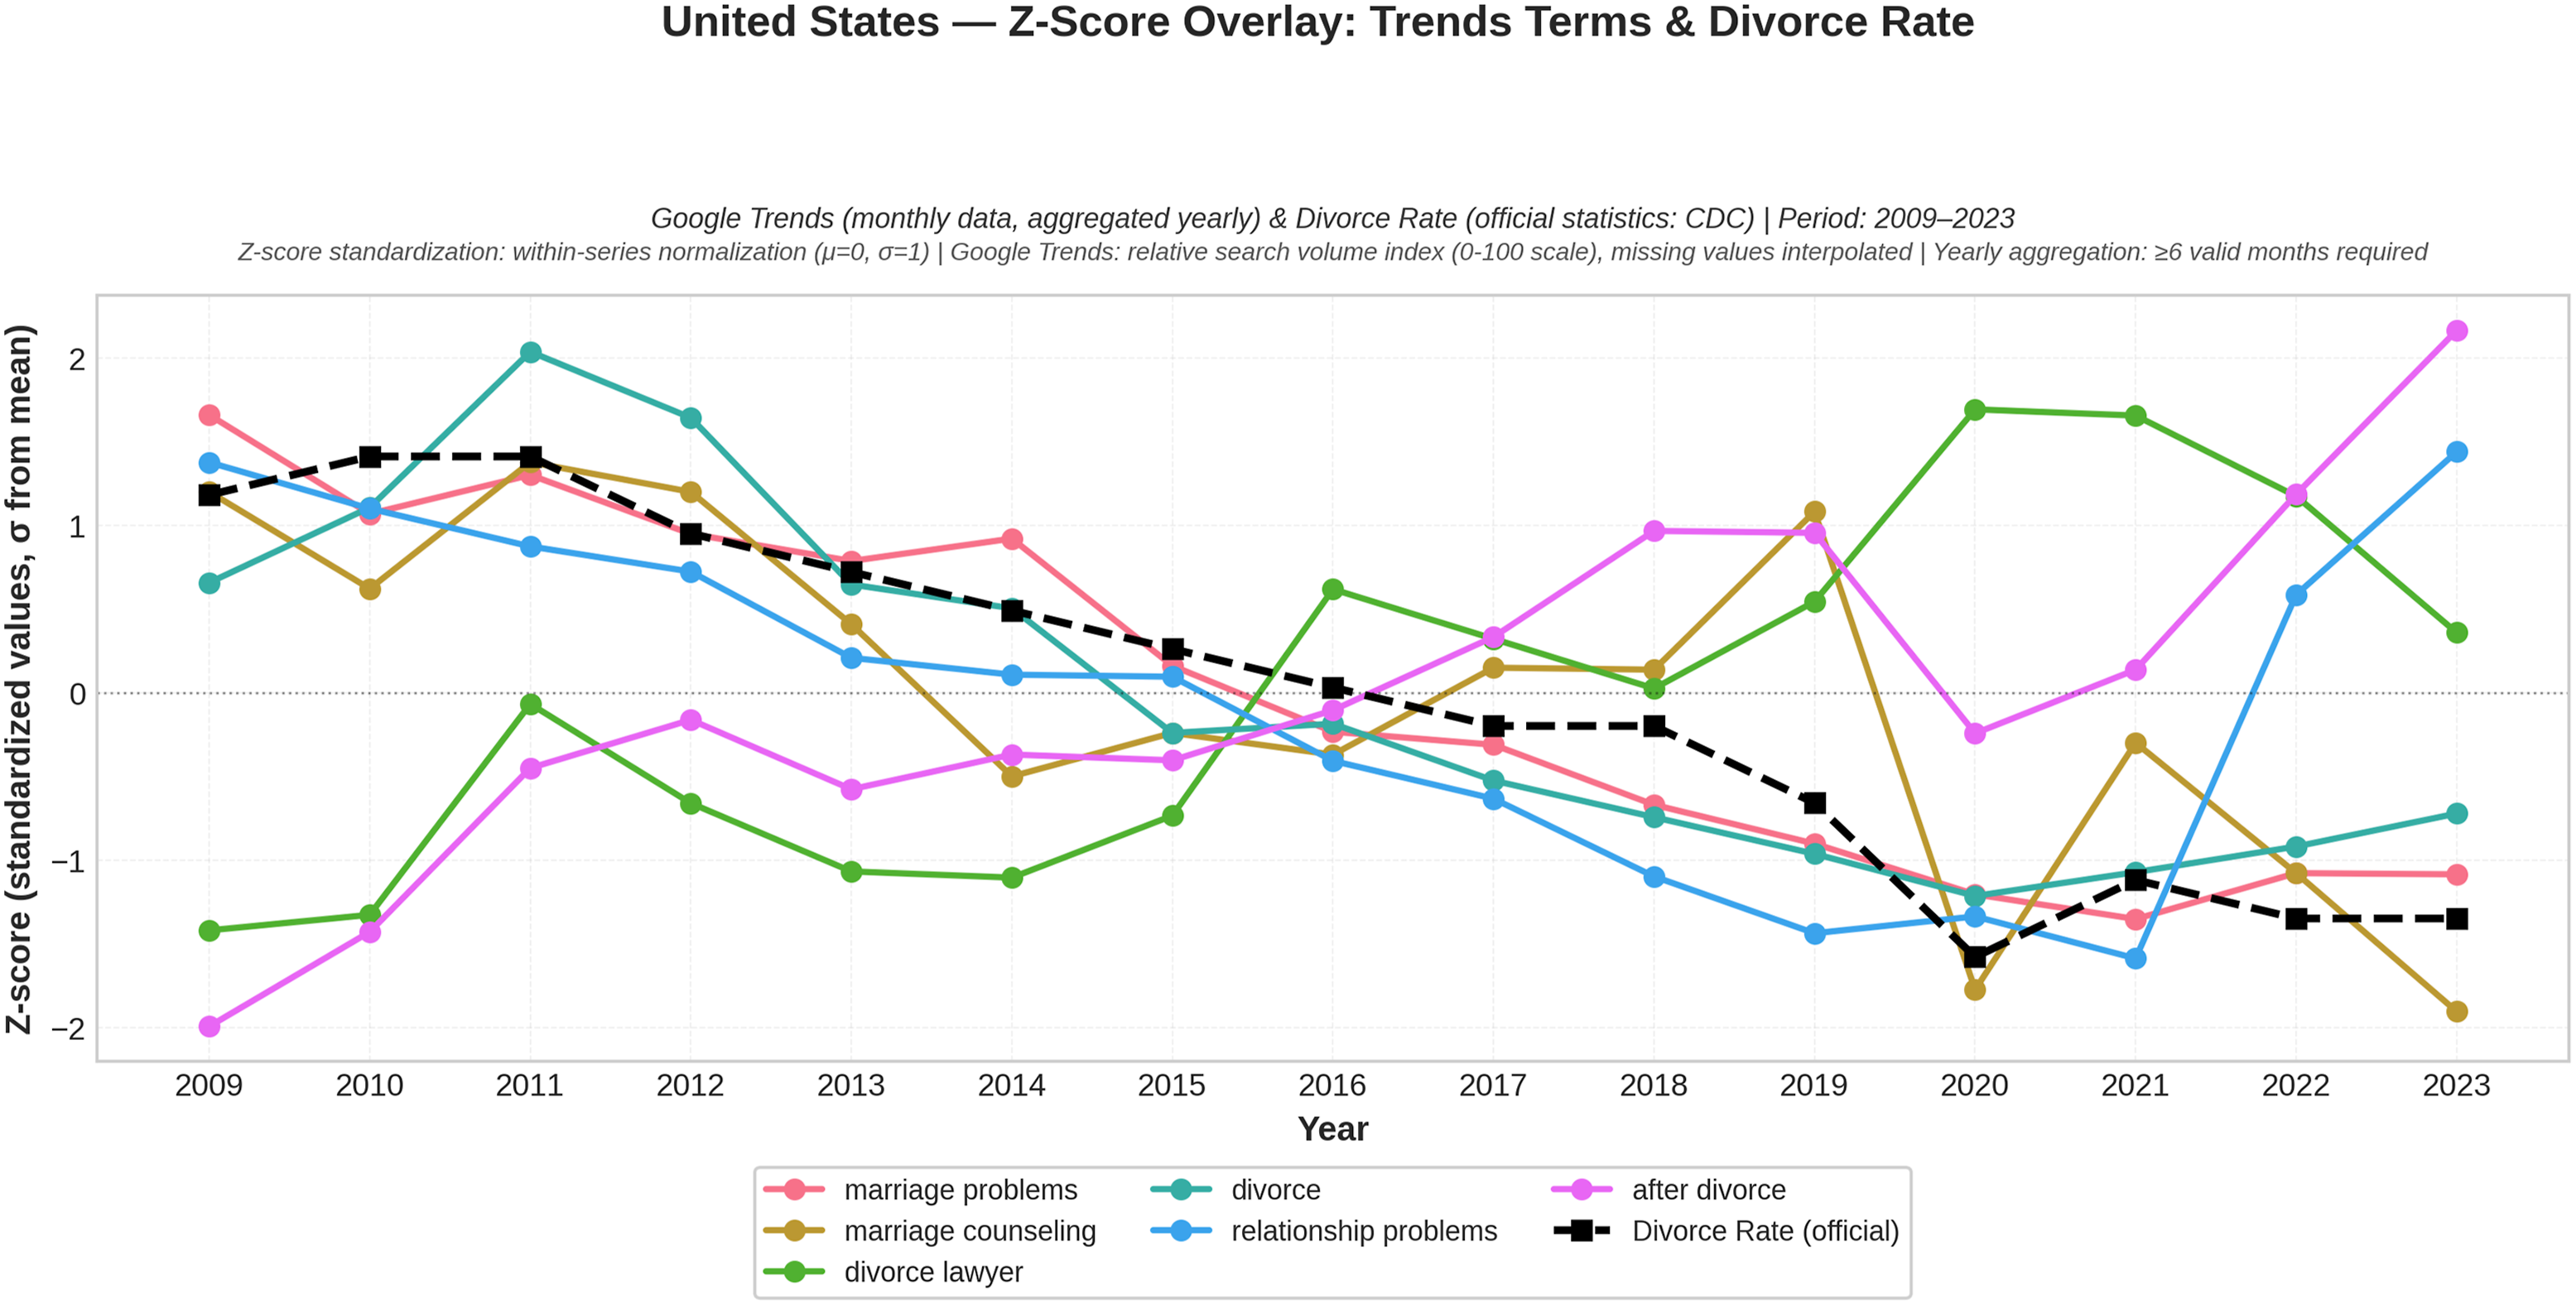
Search volatility reflects cultural differences in responses to relationship distress. Germany shows high variability for “Beziehungsprobleme” (relationship problems) (SD = 13.92) and “Scheidungsanwalt” (divorce lawyer) (SD = 17.32), indicating episodic, crisis-driven attention consistent with its low and stable divorce rate, where divorce remains a reactive outcome rather than a continuous public concern. In contrast, the Netherlands demonstrates highly stable and intense searches for “relatietherapie” (relationship therapy) (M = 75.66, SD = 4.85), reflecting a routinized, institutionalized approach to early help-seeking, alongside similarly stable post-divorce adjustment searches for “na de scheiding” (after divorce) (SD = 4.52). This pattern suggests that marital dissolution is often mitigated through preemptive intervention rather than crisis response. The UK presents a paradox: despite the highest divorce rate (M = 9.02), search intensity for “divorce lawyer” remains low (M = 26.03). High averages for “divorce” (M = 69.81) and “marriage counseling” (M = 57.67) confirm continued public salience, but the high variability of “marriage counseling” (SD = 21.85 vs. “divorce” SD = 7.73) indicates fluctuating, non-institutionalized help-seeking. The U.S. shows consistently strong engagement with “marriage counseling” (M = 80.87, SD = 7.31) and “after divorce” (M = 60.59, SD = 7.49), reflecting an institutionalized therapeutic culture embedded in its professionalized mental health framework.
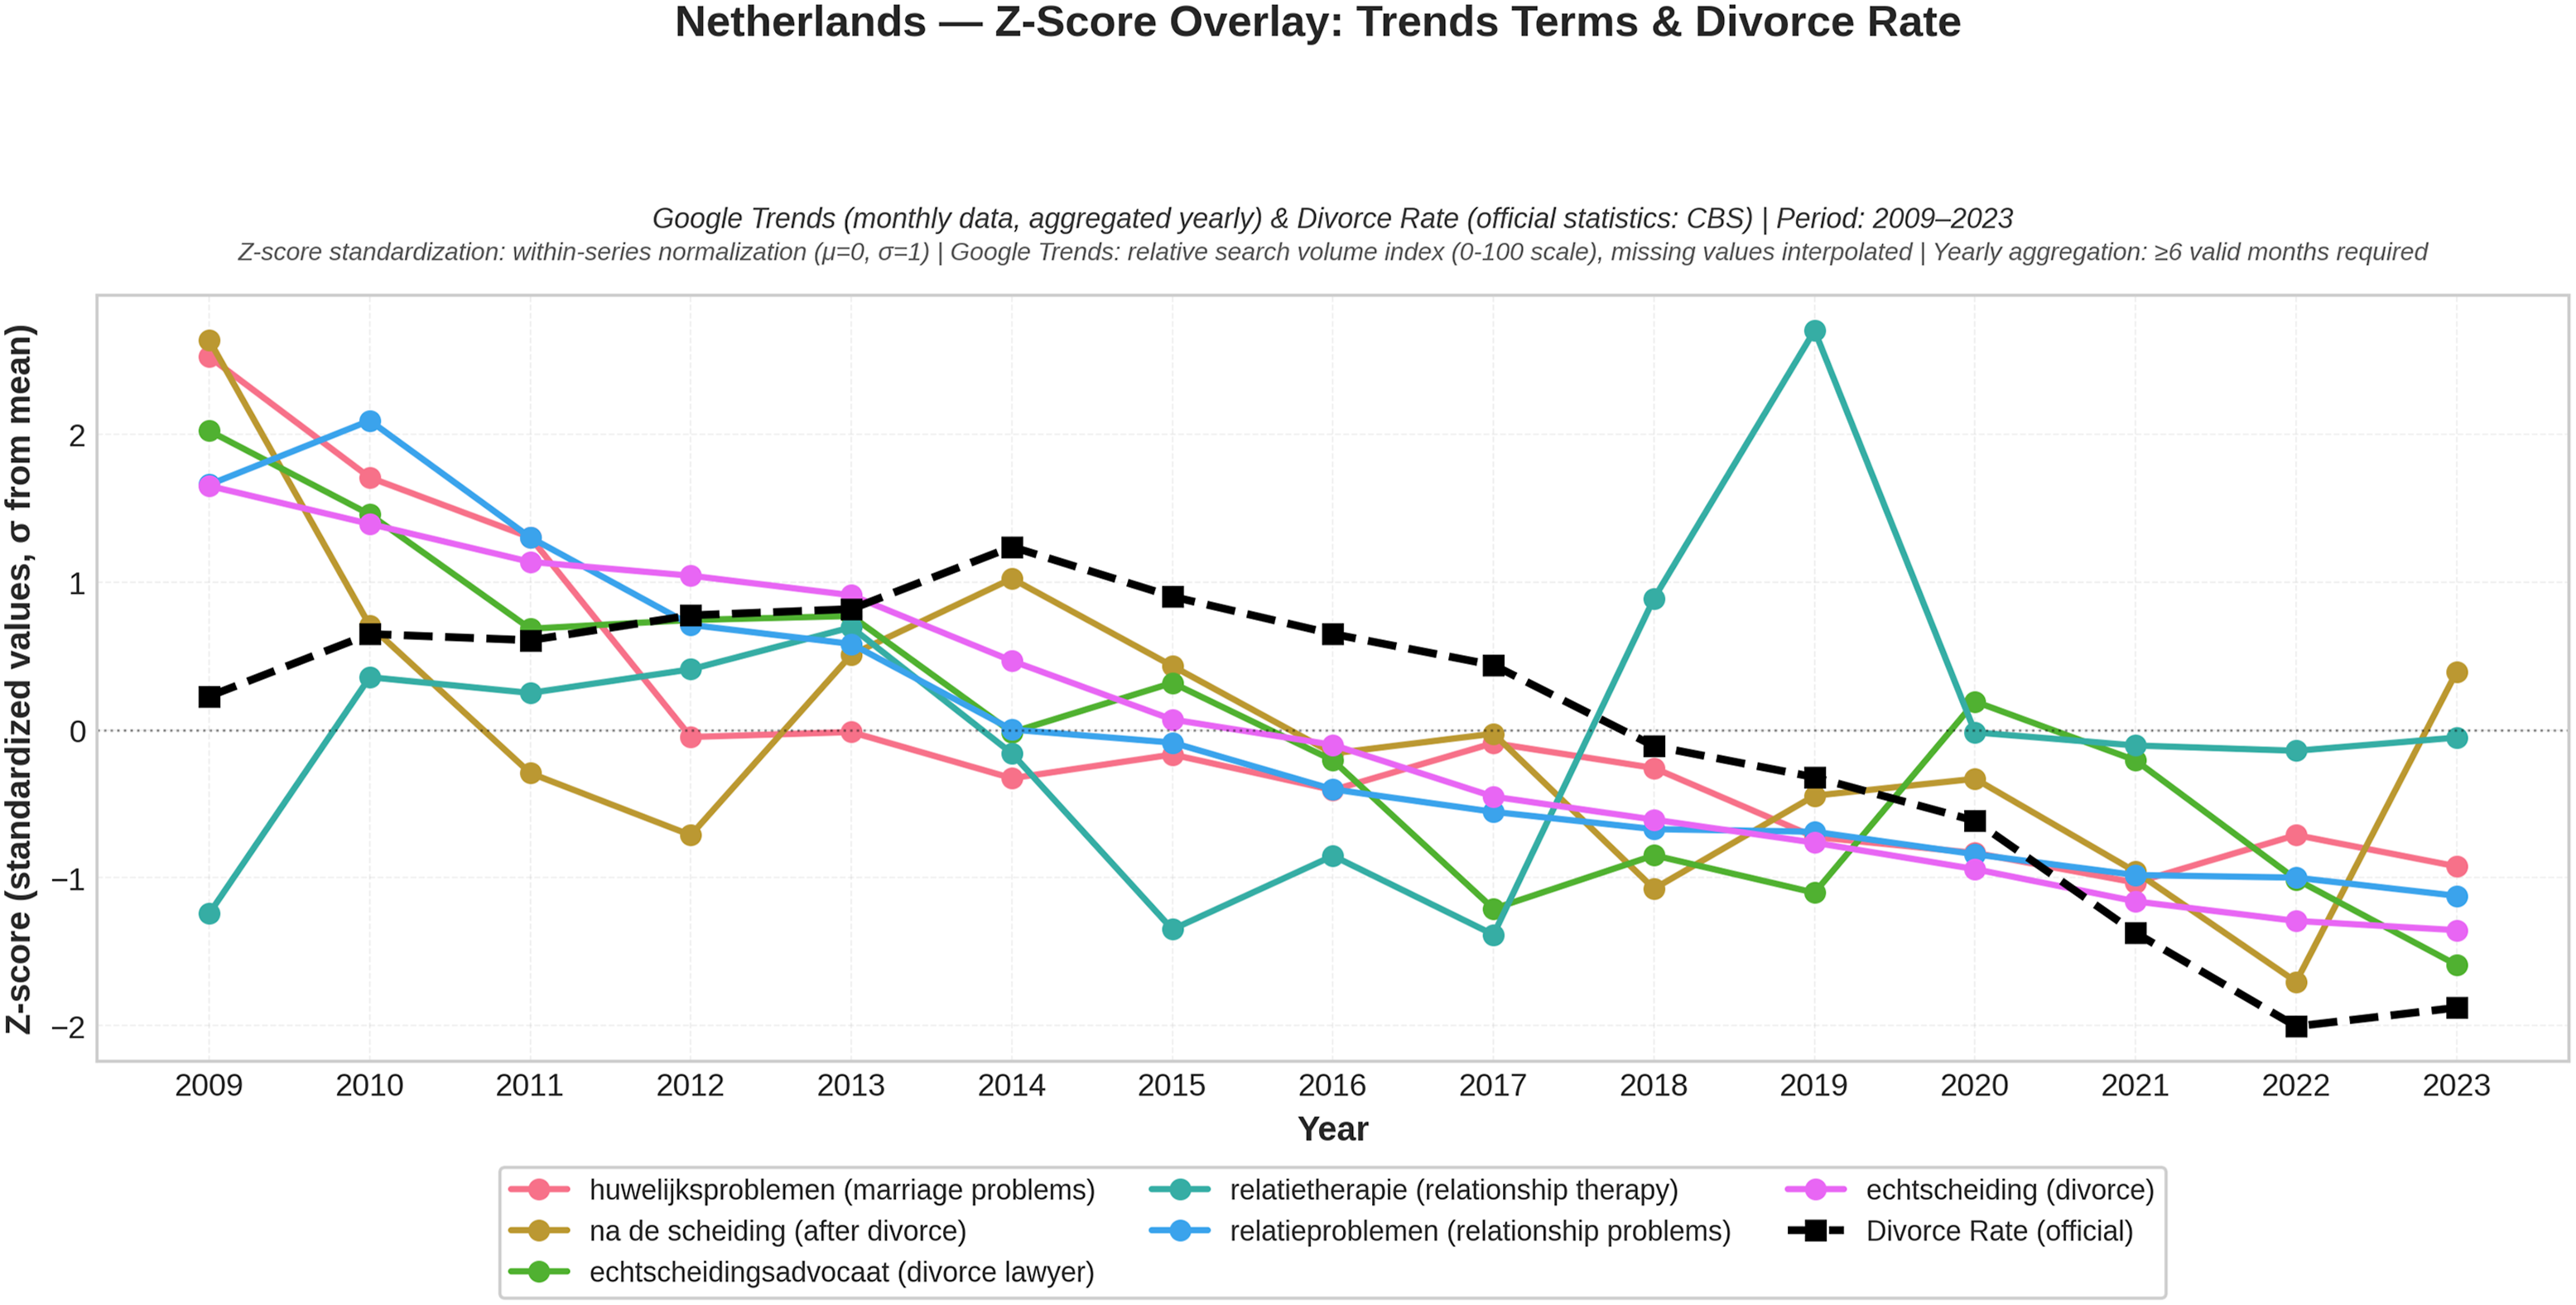
Across the four countries, the overlay figures (Figures 2–5) illustrate clear cross-national differences in how online search behavior corresponds with official divorce dynamics. As shown in Figure 2, Germany’s search patterns move largely in line with divorce rates but reflect a reactive, legally oriented approach. Figure 3 shows that the Netherlands demonstrates stable and preventive engagement, with consistent interest in therapy and mediation closely matching gradual declines in divorce rates. Figures 2, 4, and 5 reveal partial decoupling in Germany, the United Kingdom, and the United States, where divorce-related searches remain prominent or increasing despite declining official rates. Germany Netherlands—Z-score overlay: Trends terms and divorce United Kingdom—Z-score overlay: Trends terms and divorce United States—Z-score overlay: Trends terms and divorce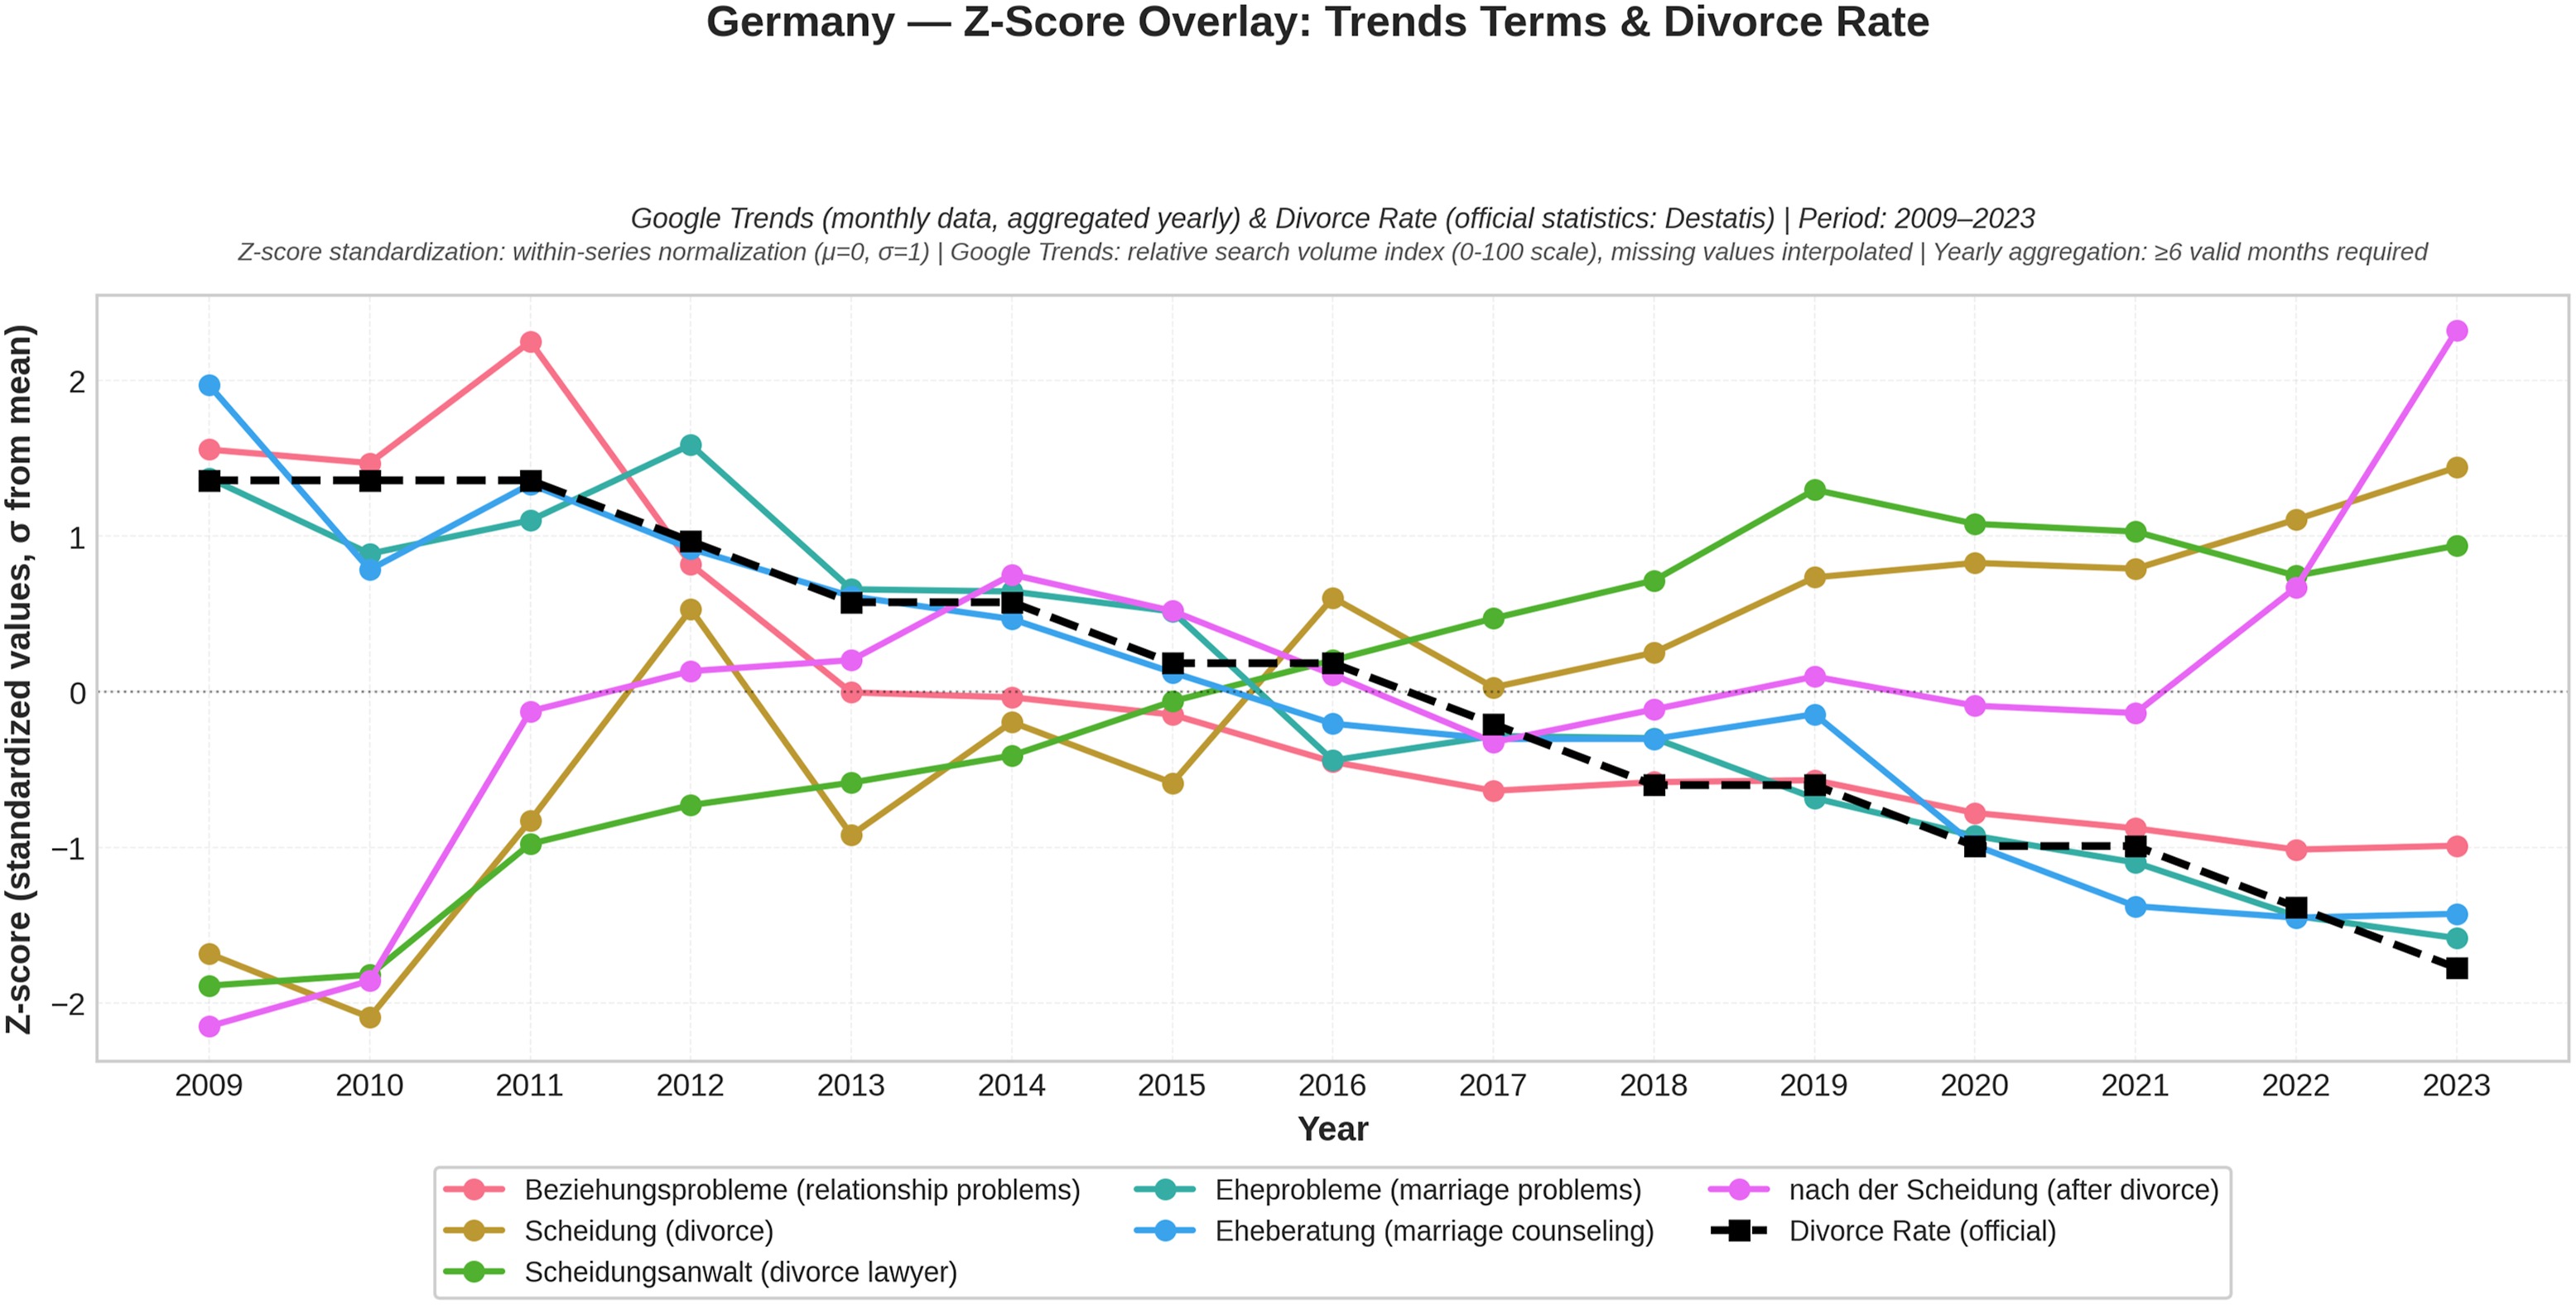
Stationary and Cointegration Analysis
Unit root tests revealed that 75% (18/24) of Google Trends series were integrated of order one [I (1)], indicating non-stationary behavior typical of online search intensity data, while the remaining 25% exhibited stationarity [I (0)]. Conversely, official divorce rates displayed the opposite pattern, with 75% (18/24) classified as I (0) and 25% as I (1), reflecting the relatively stable institutional nature of divorce statistics. This asymmetry suggests that search behavior exhibits greater volatility and trending characteristics compared to formal demographic outcomes.
Stationarity and Cointegration Analysis Results. Unit Root and Cointegration Test Results by Country and Search Term (2009–2023). Integration order I (0) Indicates Stationary Series; I (1) Indicates Non-Stationary Series Requiring Differencing. Cointegration tests (EG and Johansen) Applicable Only When Both Series are I (1), Indicating Potential Long-Run Equilibrium Relationships. Significant p-Values (<0.05) Suggest Cointegration, Though None Survived FDR Correction. Gregory-Hansen Test Identifies Structural Break Years, Concentrated Between 2012 and 2020
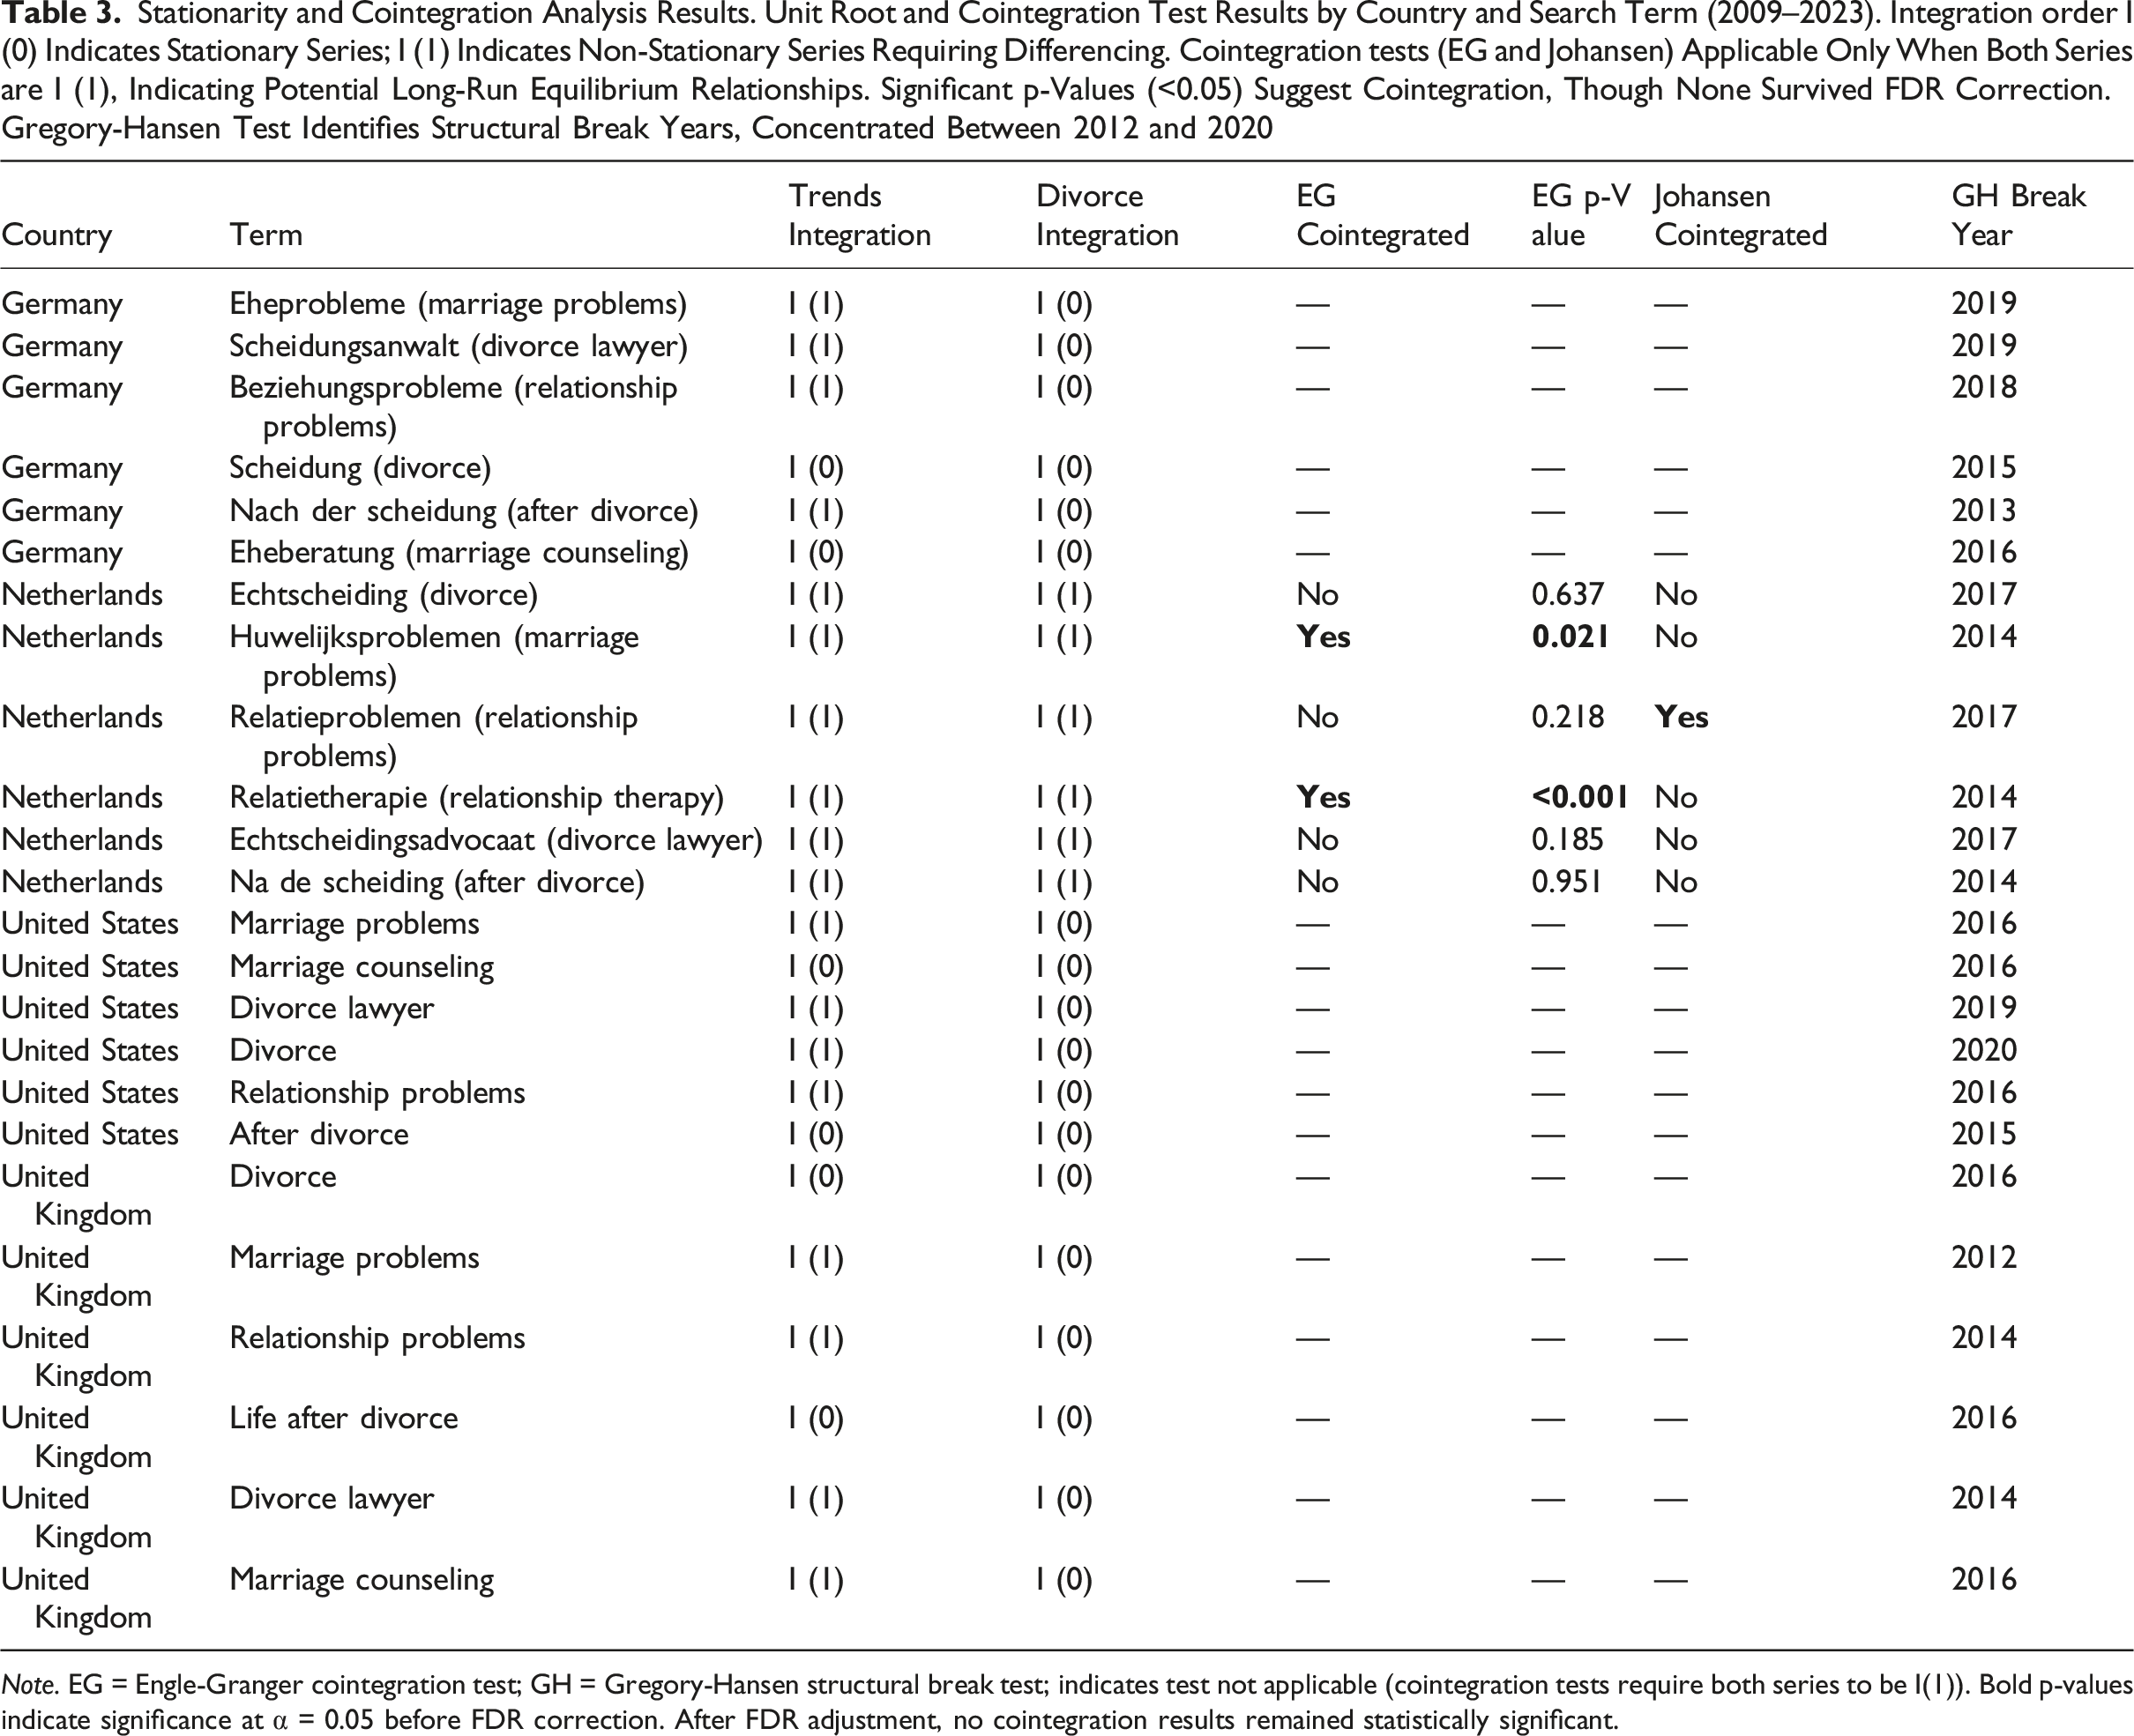
Note. EG = Engle-Granger cointegration test; GH = Gregory-Hansen structural break test; indicates test not applicable (cointegration tests require both series to be I(1)). Bold p-values indicate significance at α = 0.05 before FDR correction. After FDR adjustment, no cointegration results remained statistically significant.
Gregory-Hansen structural break tests detected potential level shifts across all 24 pairs, with break years concentrated between 2012 and 2020 (Table 3), suggesting that the relationship between search intensity and divorce rates may be subject to regime changes or exogenous shocks. The clustering around 2014–2016 coincides with increased smartphone penetration and changes in Google search algorithms, while later (2019–2020) may reflect pandemic-related behavioral shifts. The Netherlands showed earlier rises (2014+) in “huwelijksproblemen” (marriage problems) and “relatietherapie” (relationship therapy) searches, indicating an early move toward proactive relationship management.
Causality and Dynamic Relationships
Granger causality tests in first-difference form (Δ-Granger) revealed statistically significant predictive relationships in only 8.3% (2/24) of country-term pairs after FDR correction, specifically for United States’ “marriage counseling” (FDR-adjusted p = 0.001) and United Kingdom’s “divorce lawyer” (FDR-adjusted p < 0.001). VAR-level Granger tests yielded no statistically significant results after multiple testing correction, indicating limited evidence for systematic directional causality from search intensity to divorce rates. The low incidence of significant Granger causality suggests that while search behavior and divorce rates may co-move, the predictive power of online searches remains weak in most contexts when subjected to rigorous statistical testing.
Causality Testing and Lead-Lag Structure. Cross-Correlation, Granger Causality, and Spectral Coherence Results (2009–2023). Optimal Lag Indicates Temporal Relationship: Negative Values Suggest Search Behavior Precedes Divorce (Anticipatory), Positive Values Suggest Divorce Precedes Search (Reactive). Higher |CCF| Values Indicate Stronger Correlation; Coherence >0.4 Indicates Frequency-Domain Co-Movement. Granger Tests Assess Predictive Causality After FDR Correction. Majority of Pairs (62.5%) Showed Negative Optimal Lags, Suggesting Anticipatory Search Patterns
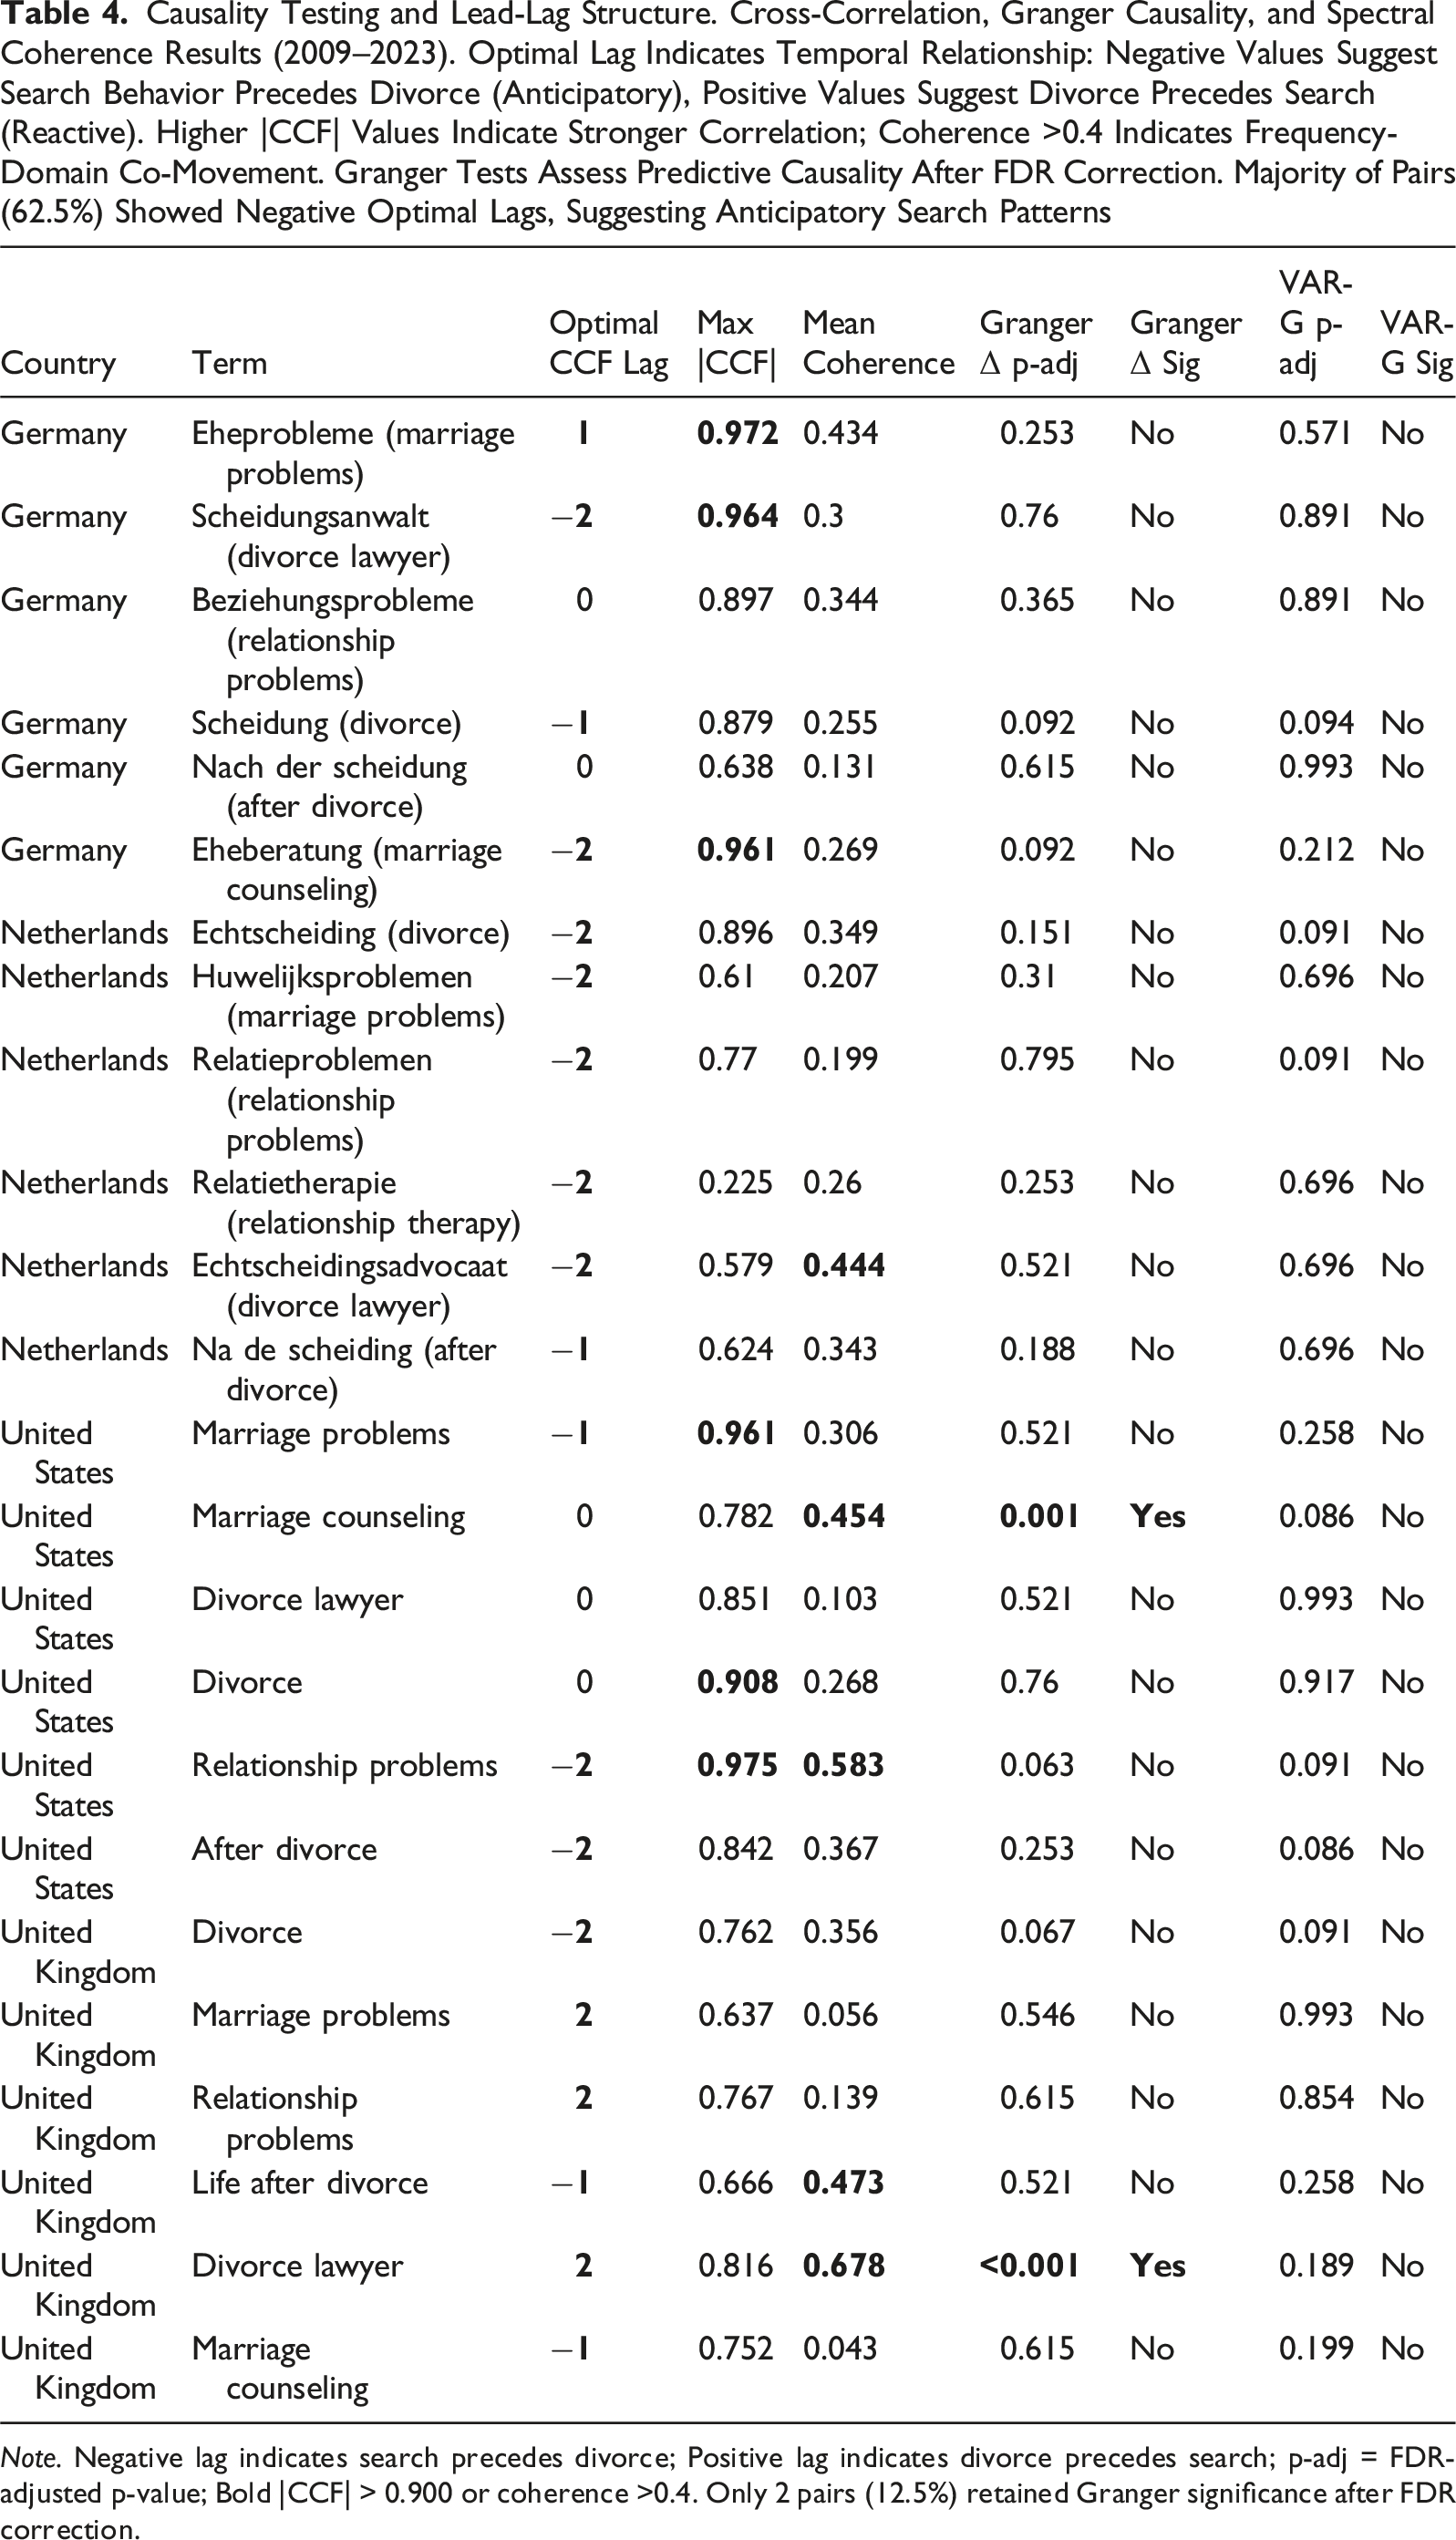
Note. Negative lag indicates search precedes divorce; Positive lag indicates divorce precedes search; p-adj = FDR-adjusted p-value; Bold |CCF| > 0.900 or coherence >0.4. Only 2 pairs (12.5%) retained Granger significance after FDR correction.
Online information-seeking can precede formal divorce outcomes, though the strength and direction vary across countries and search terms, reflecting differences in institutional responsiveness, help-seeking norms, and divorce social visibility. Germany’s “Eheprobleme (Marriage Problems)” shows a positive lag (+1), indicating retrospective searching after divorce. In contrast, the Netherlands exhibits consistent negative lags, with five of six showing −2 year leads, signaling systematic early planning behavior.
The gap between high CCF values and weak Granger significance reflects methodological differences: CCF identifies correlated lead-lag structure, while Granger applies stricter tests accounting for autoregressive dynamics and multiple testing. After FDR correction, most relationships fail to demonstrate robust predictive causality despite clear temporal patterning.
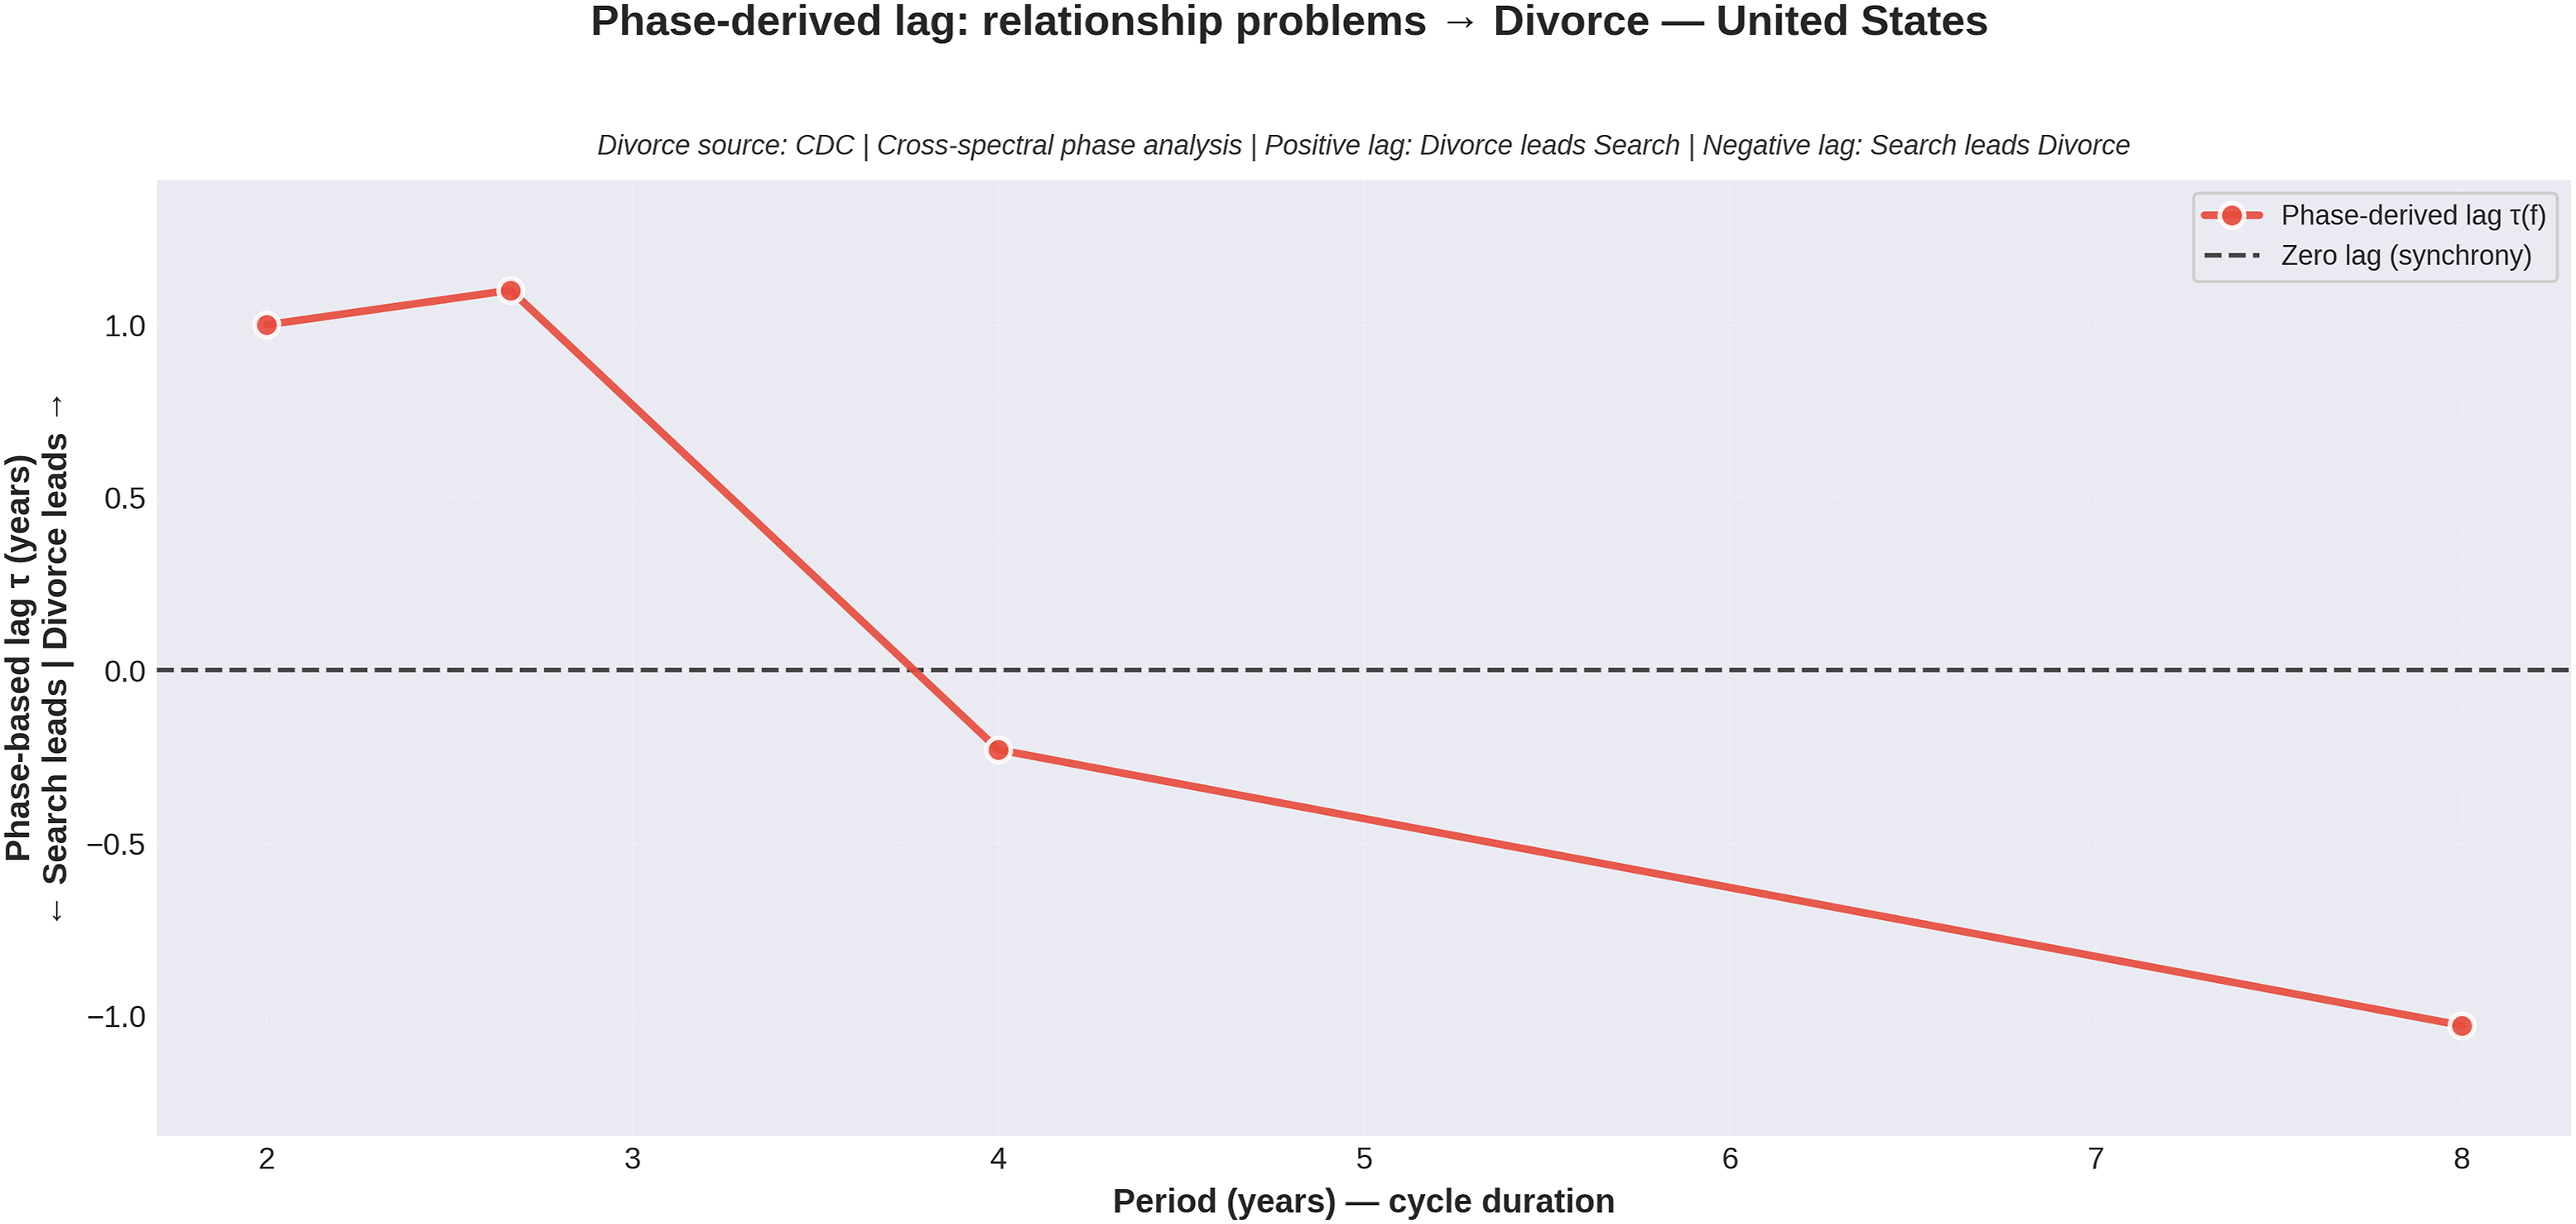
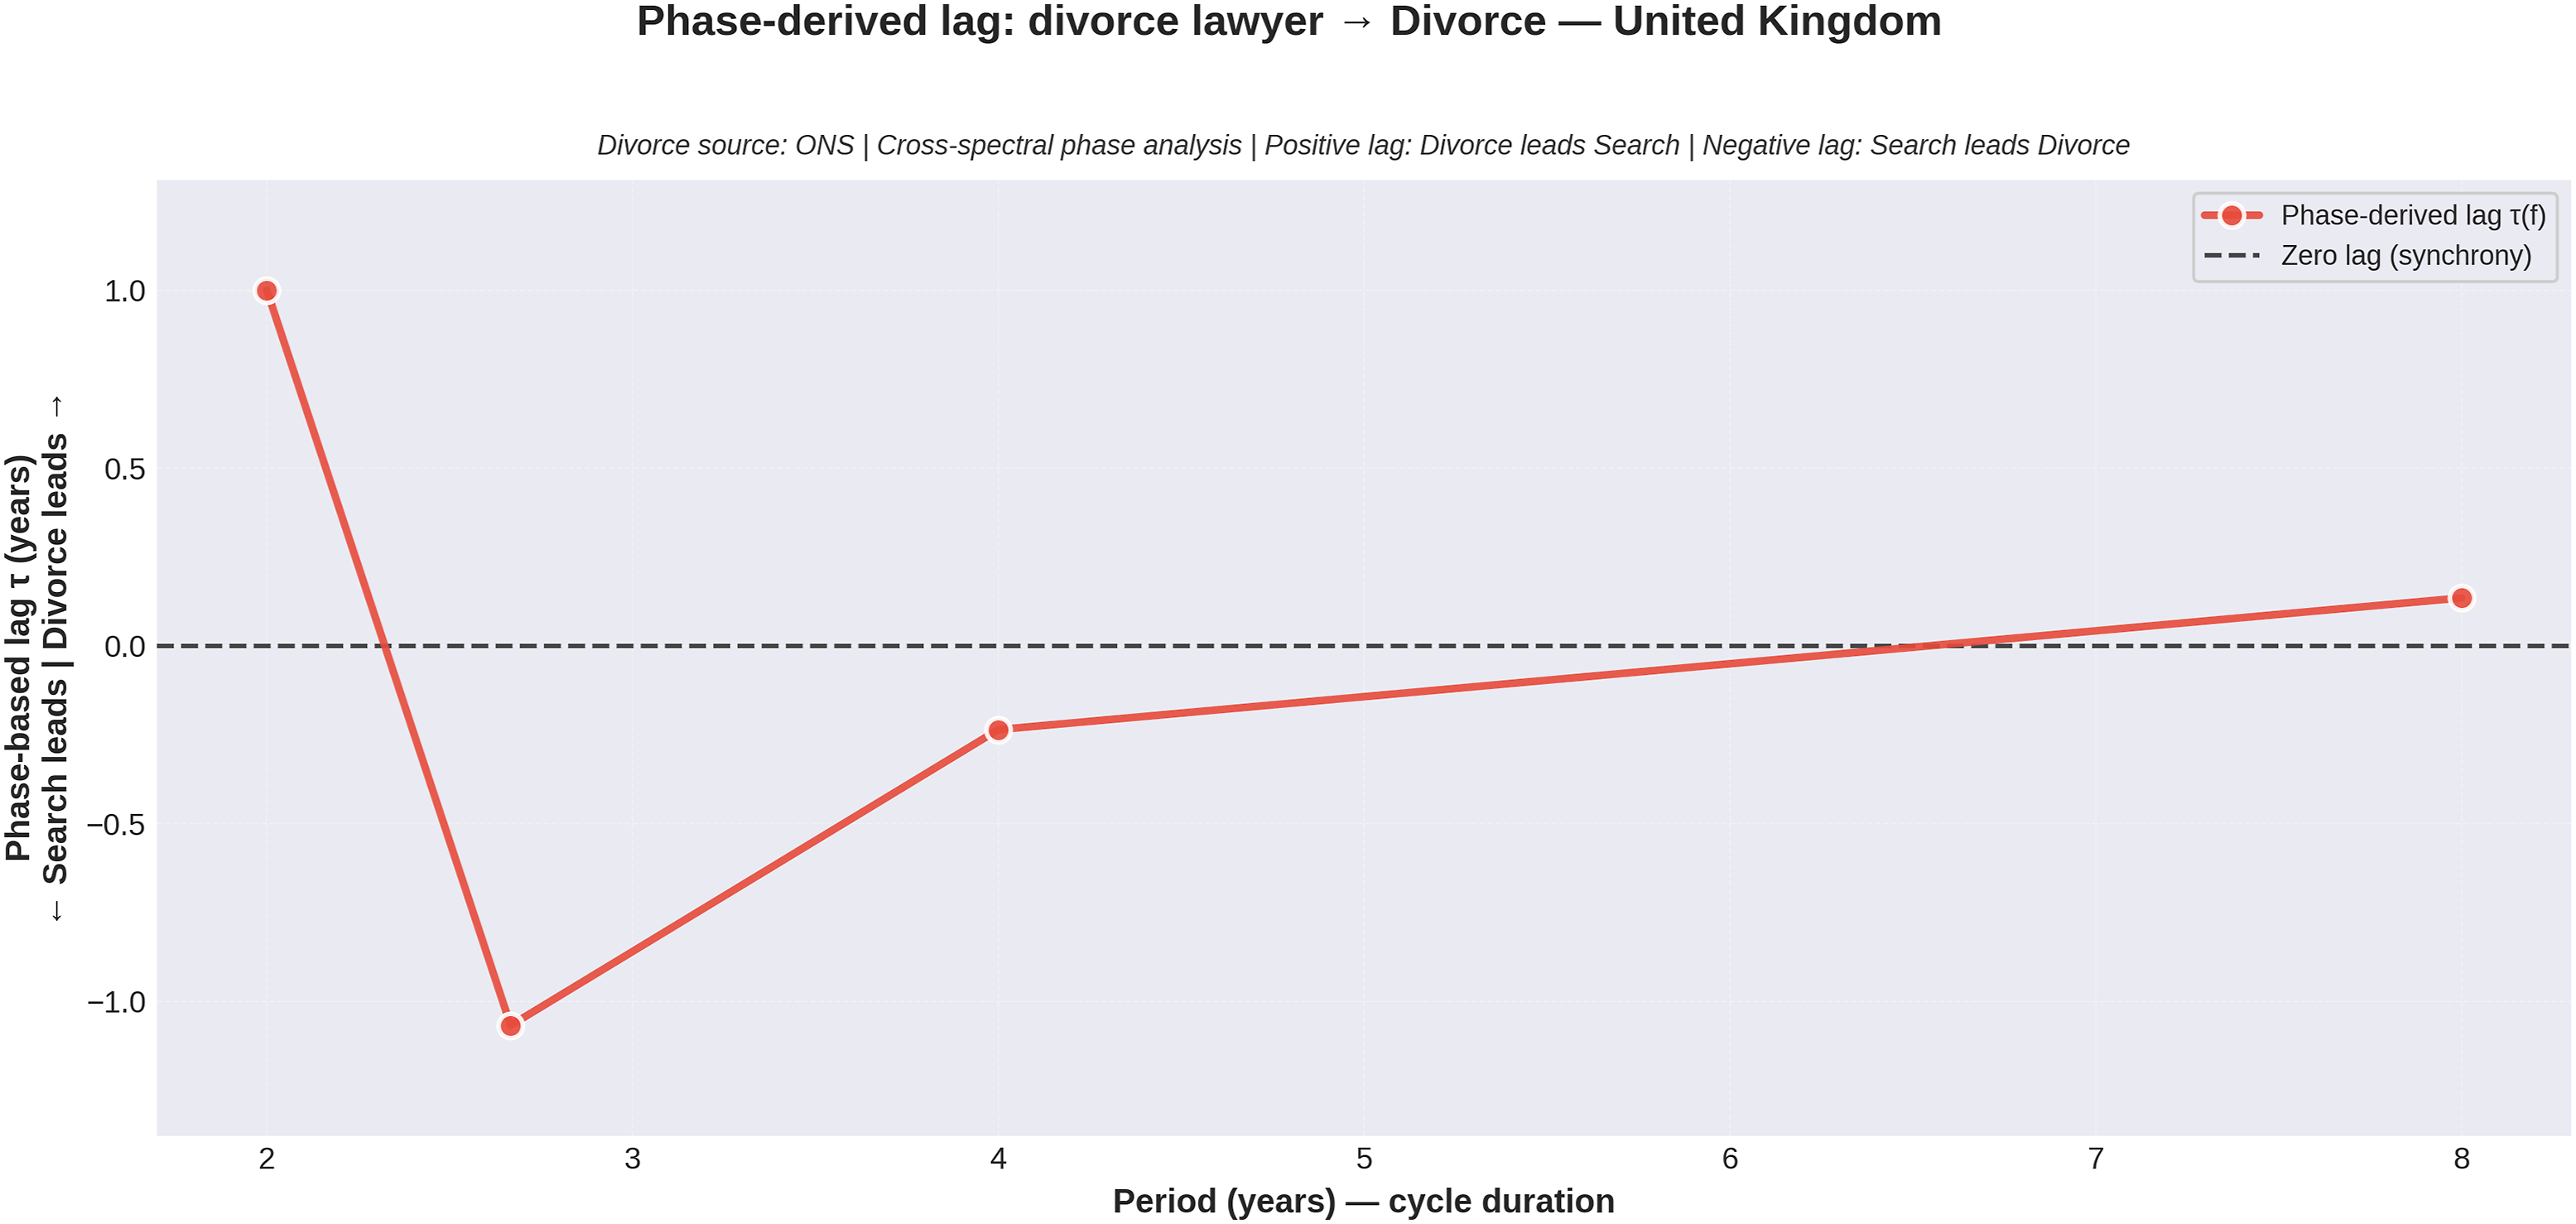
Figures 6–8 illustrate key cases. Figure 6 shows U.S. “marriage counseling” with consistently positive phase lags across 2 to 6 year cycles, indicating divorce rates precede counseling searches despite high search intensity (M = 80.87). Figure 7 shows U.S. “relationship problems” reversing from positive lag at short cycles (+1.0 year) to negative lag at longer cycles (−0.7 years), demonstrating that predictive direction depends on time scale, reconciling its high CCF (0.975) with positive median phase lag (+0.846). Phase-derived lag: “marriage counseling”—United States. Positive lag indicates divorce leads search; negative lag indicates search leads divorce. Dashed line represents synchrony (zero lag). X-axis: cycle periodicity in years; Y-axis: temporal lag (τ) in years. Source: CDC Phase-derived lag: “relationship problems”—United States. Positive lag indicates divorce leads search; negative lag indicates search leads divorce. Dashed line represents synchrony (zero lag). X-axis: cycle periodicity in years; Y-axis: temporal lag (τ) in years. Source: CDC Phase-derived lag: “divorce lawyer”—United Kingdom. Positive lag indicates divorce leads search; negative lag indicates search leads divorce. Dashed line represents synchrony (zero lag). X-axis: cycle periodicity in years; Y-axis: temporal lag (τ) in years. Source: ONS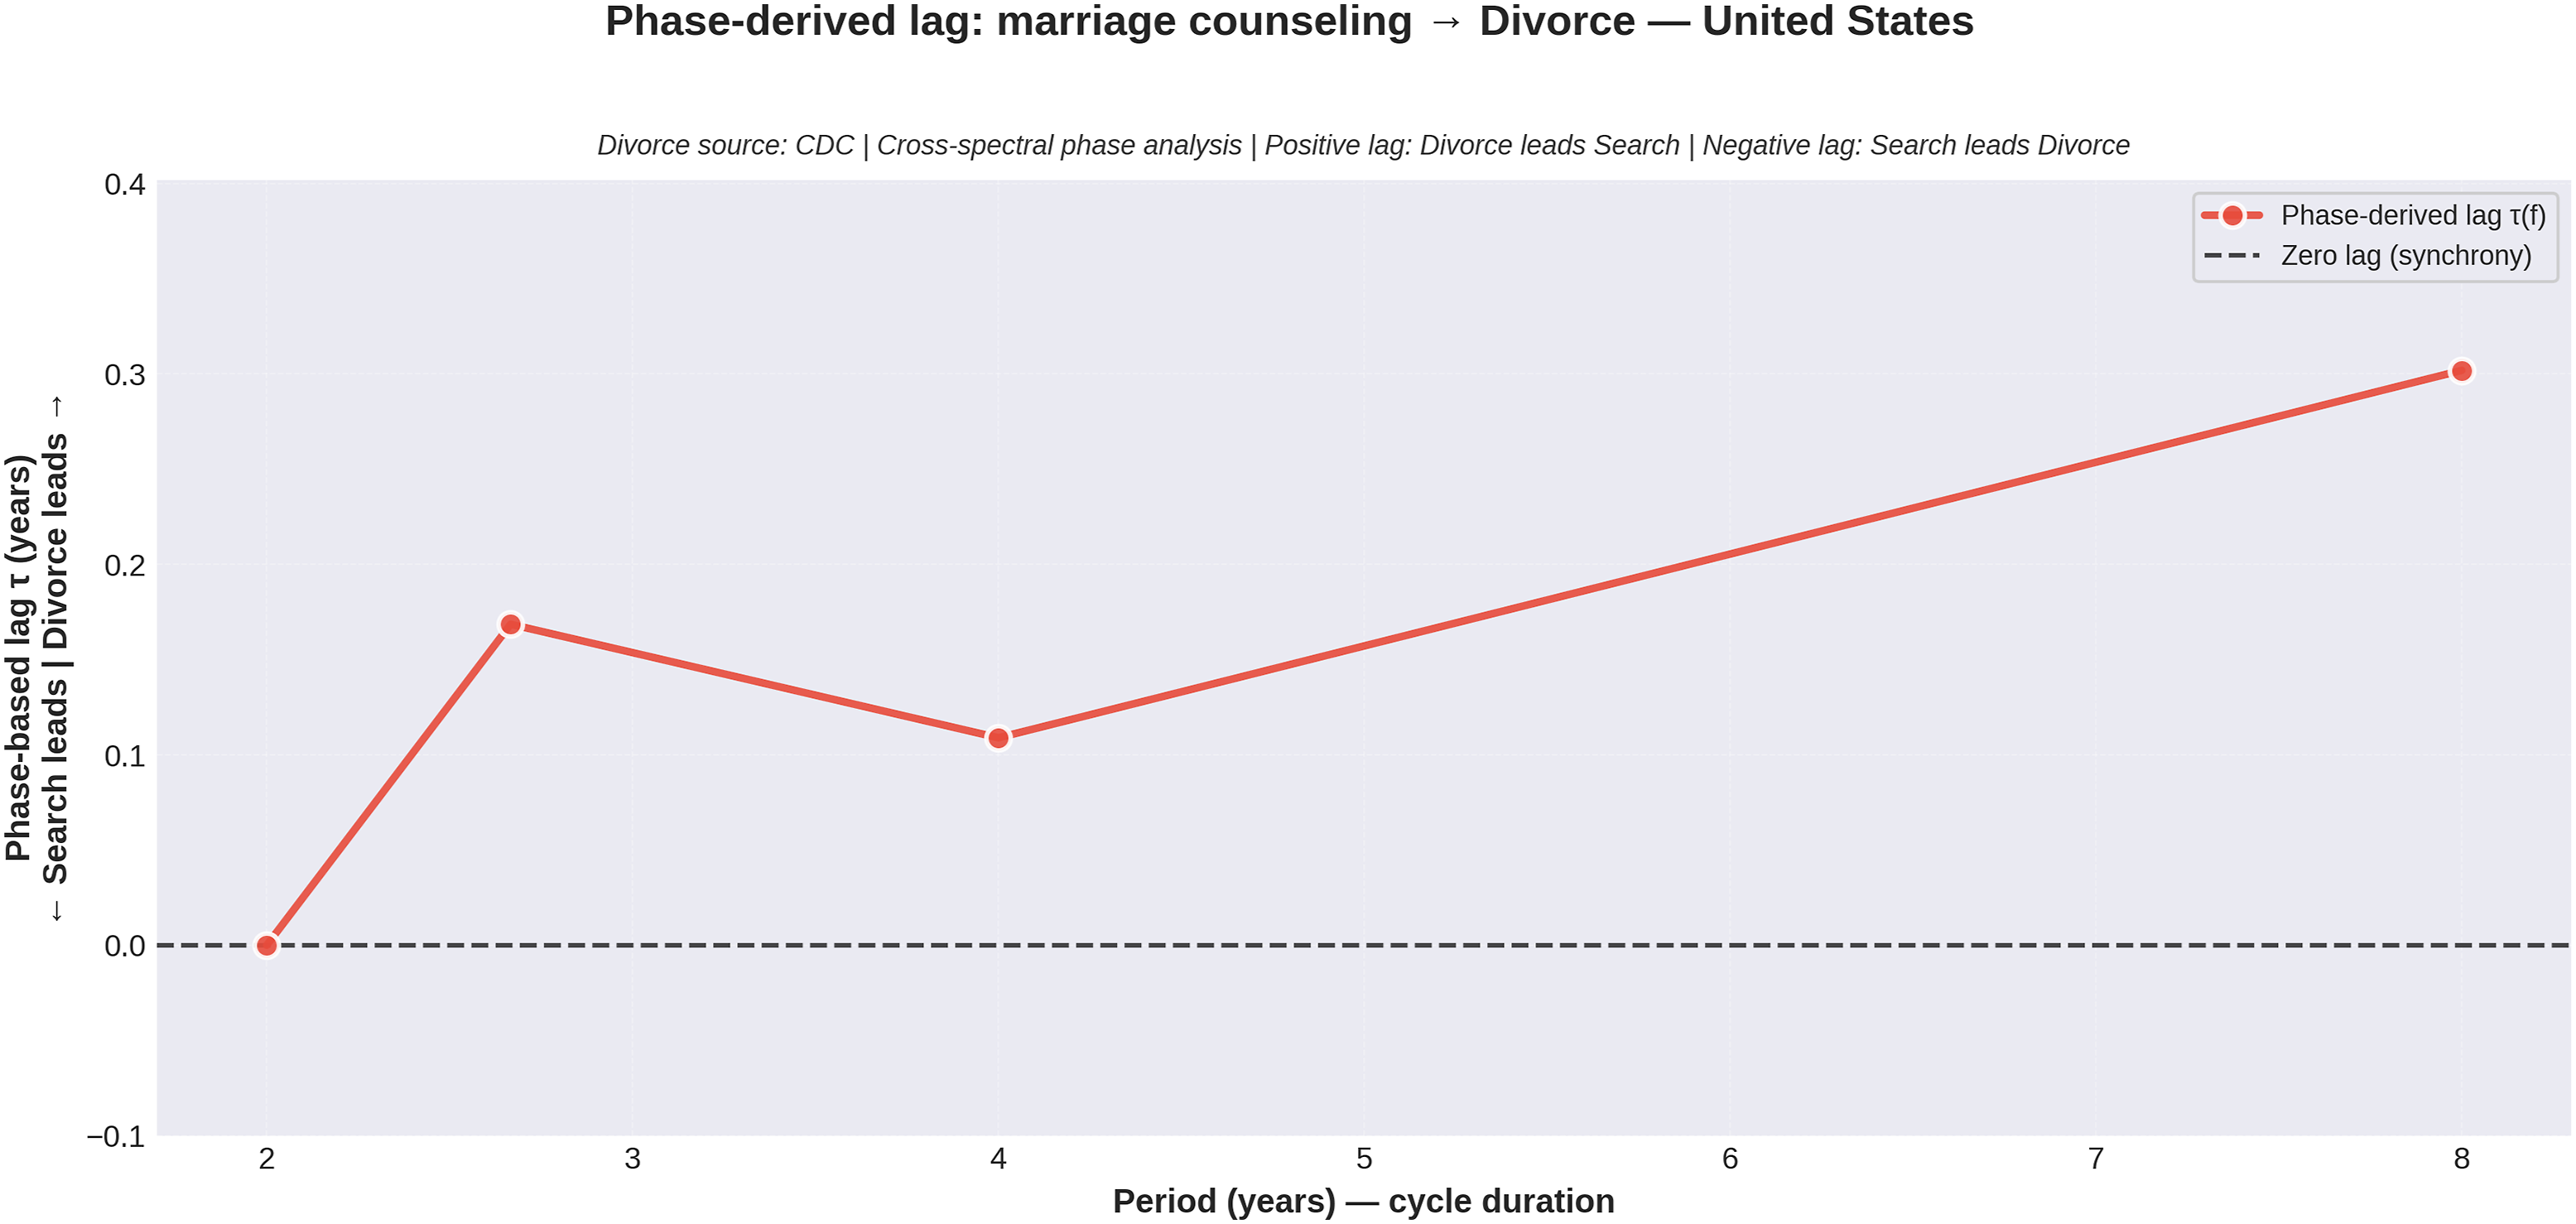
Spectral Coherence and Phase Spectrum Analysis. Mean Coherence Measures Strength Of Relationship Across Frequency Bands (0–1 Scale). Only 25% of Pairs Exceeded High-Coherence Threshold (>0.4). Phase Lag Indicates Temporal Precedence: Positive Values Mean Divorce Rate Leads Search Behavior (Reactive). Negative Values Mean Search Leads Divorce (Anticipatory). Synchronous Relationships (|lag| < 0.1 years) Suggest Contemporaneous Dynamics. Results Reveal Heterogeneous Lead-Lag Structures Across Countries and Search Terms
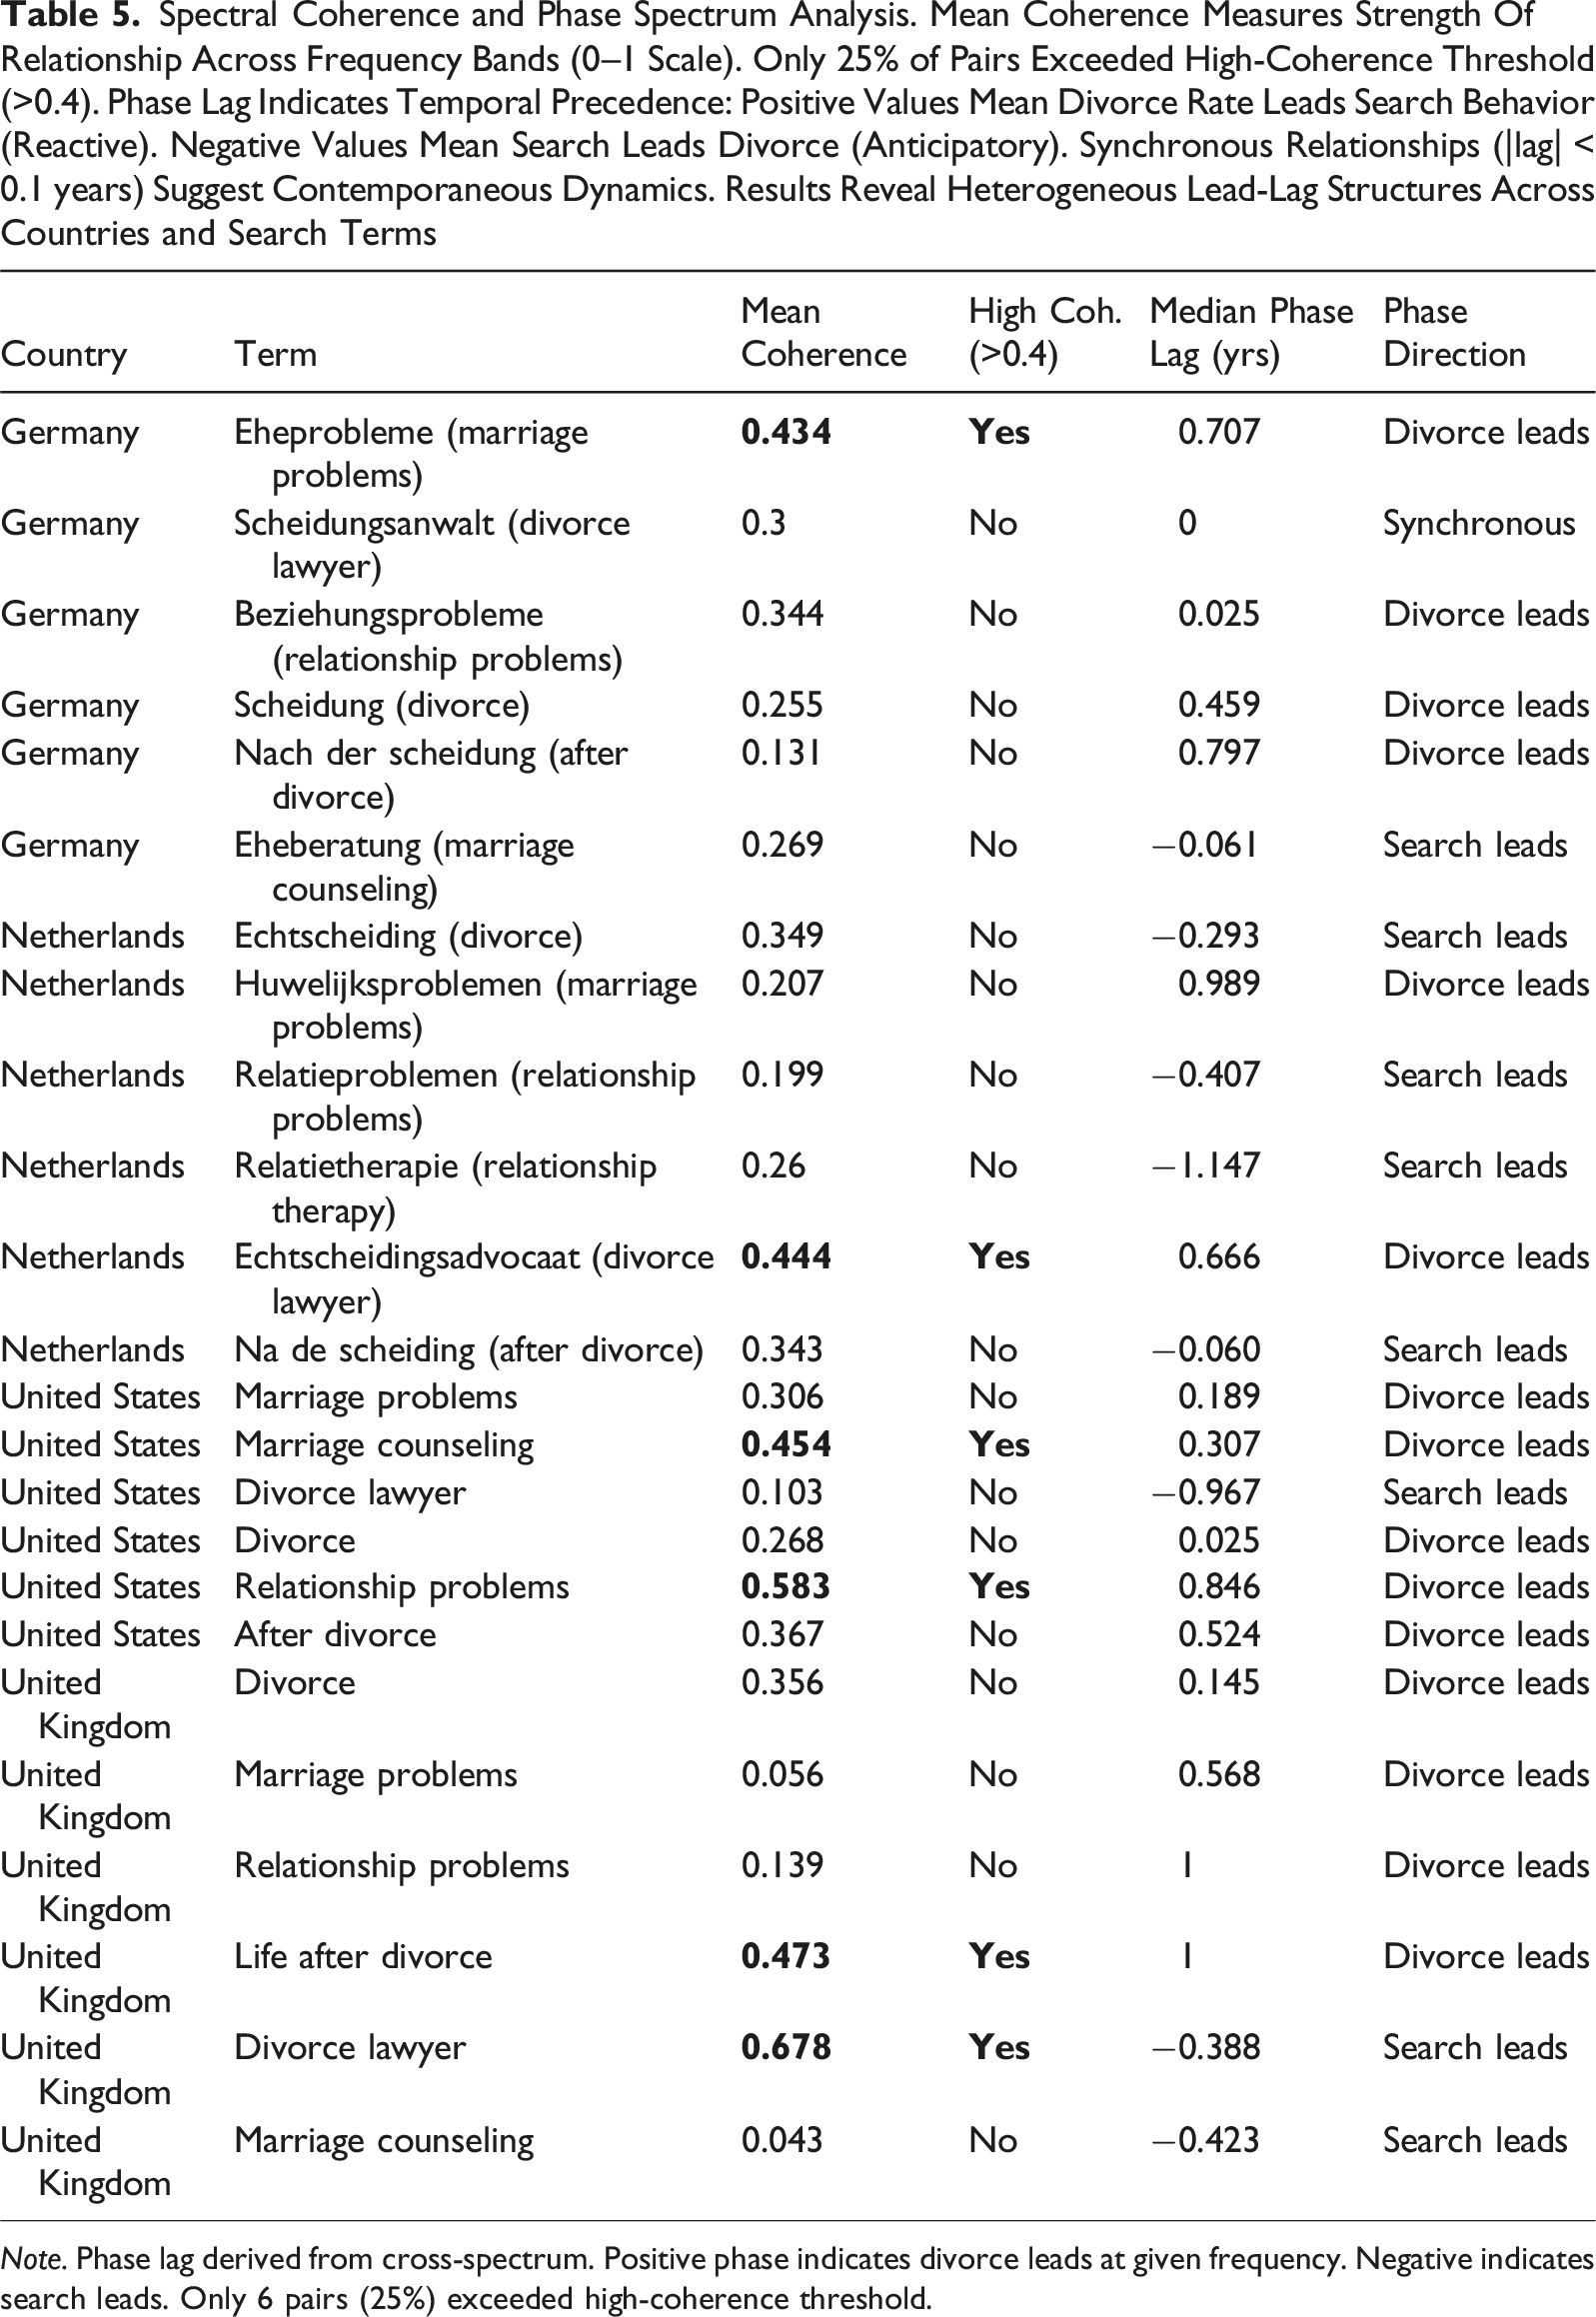
Note. Phase lag derived from cross-spectrum. Positive phase indicates divorce leads at given frequency. Negative indicates search leads. Only 6 pairs (25%) exceeded high-coherence threshold.
Forecasting Performance: Diebold-Mariano Test Results. Positive DM Statistic Indicates Augmented Model (Incorporating Google Trends Changes) Outperforms Baseline AR Model. Higher DM Values Suggest Greater Forecast Improvement. After FDR Correction, 8 of 24 Pairs (33.3%) Showed Statistically Significant Improvements, Indicating Google Trends Data Provides Incremental Predictive Value for Divorce Rates in Select Country-Term Combinations, Particularly for Relationship Problem Searches
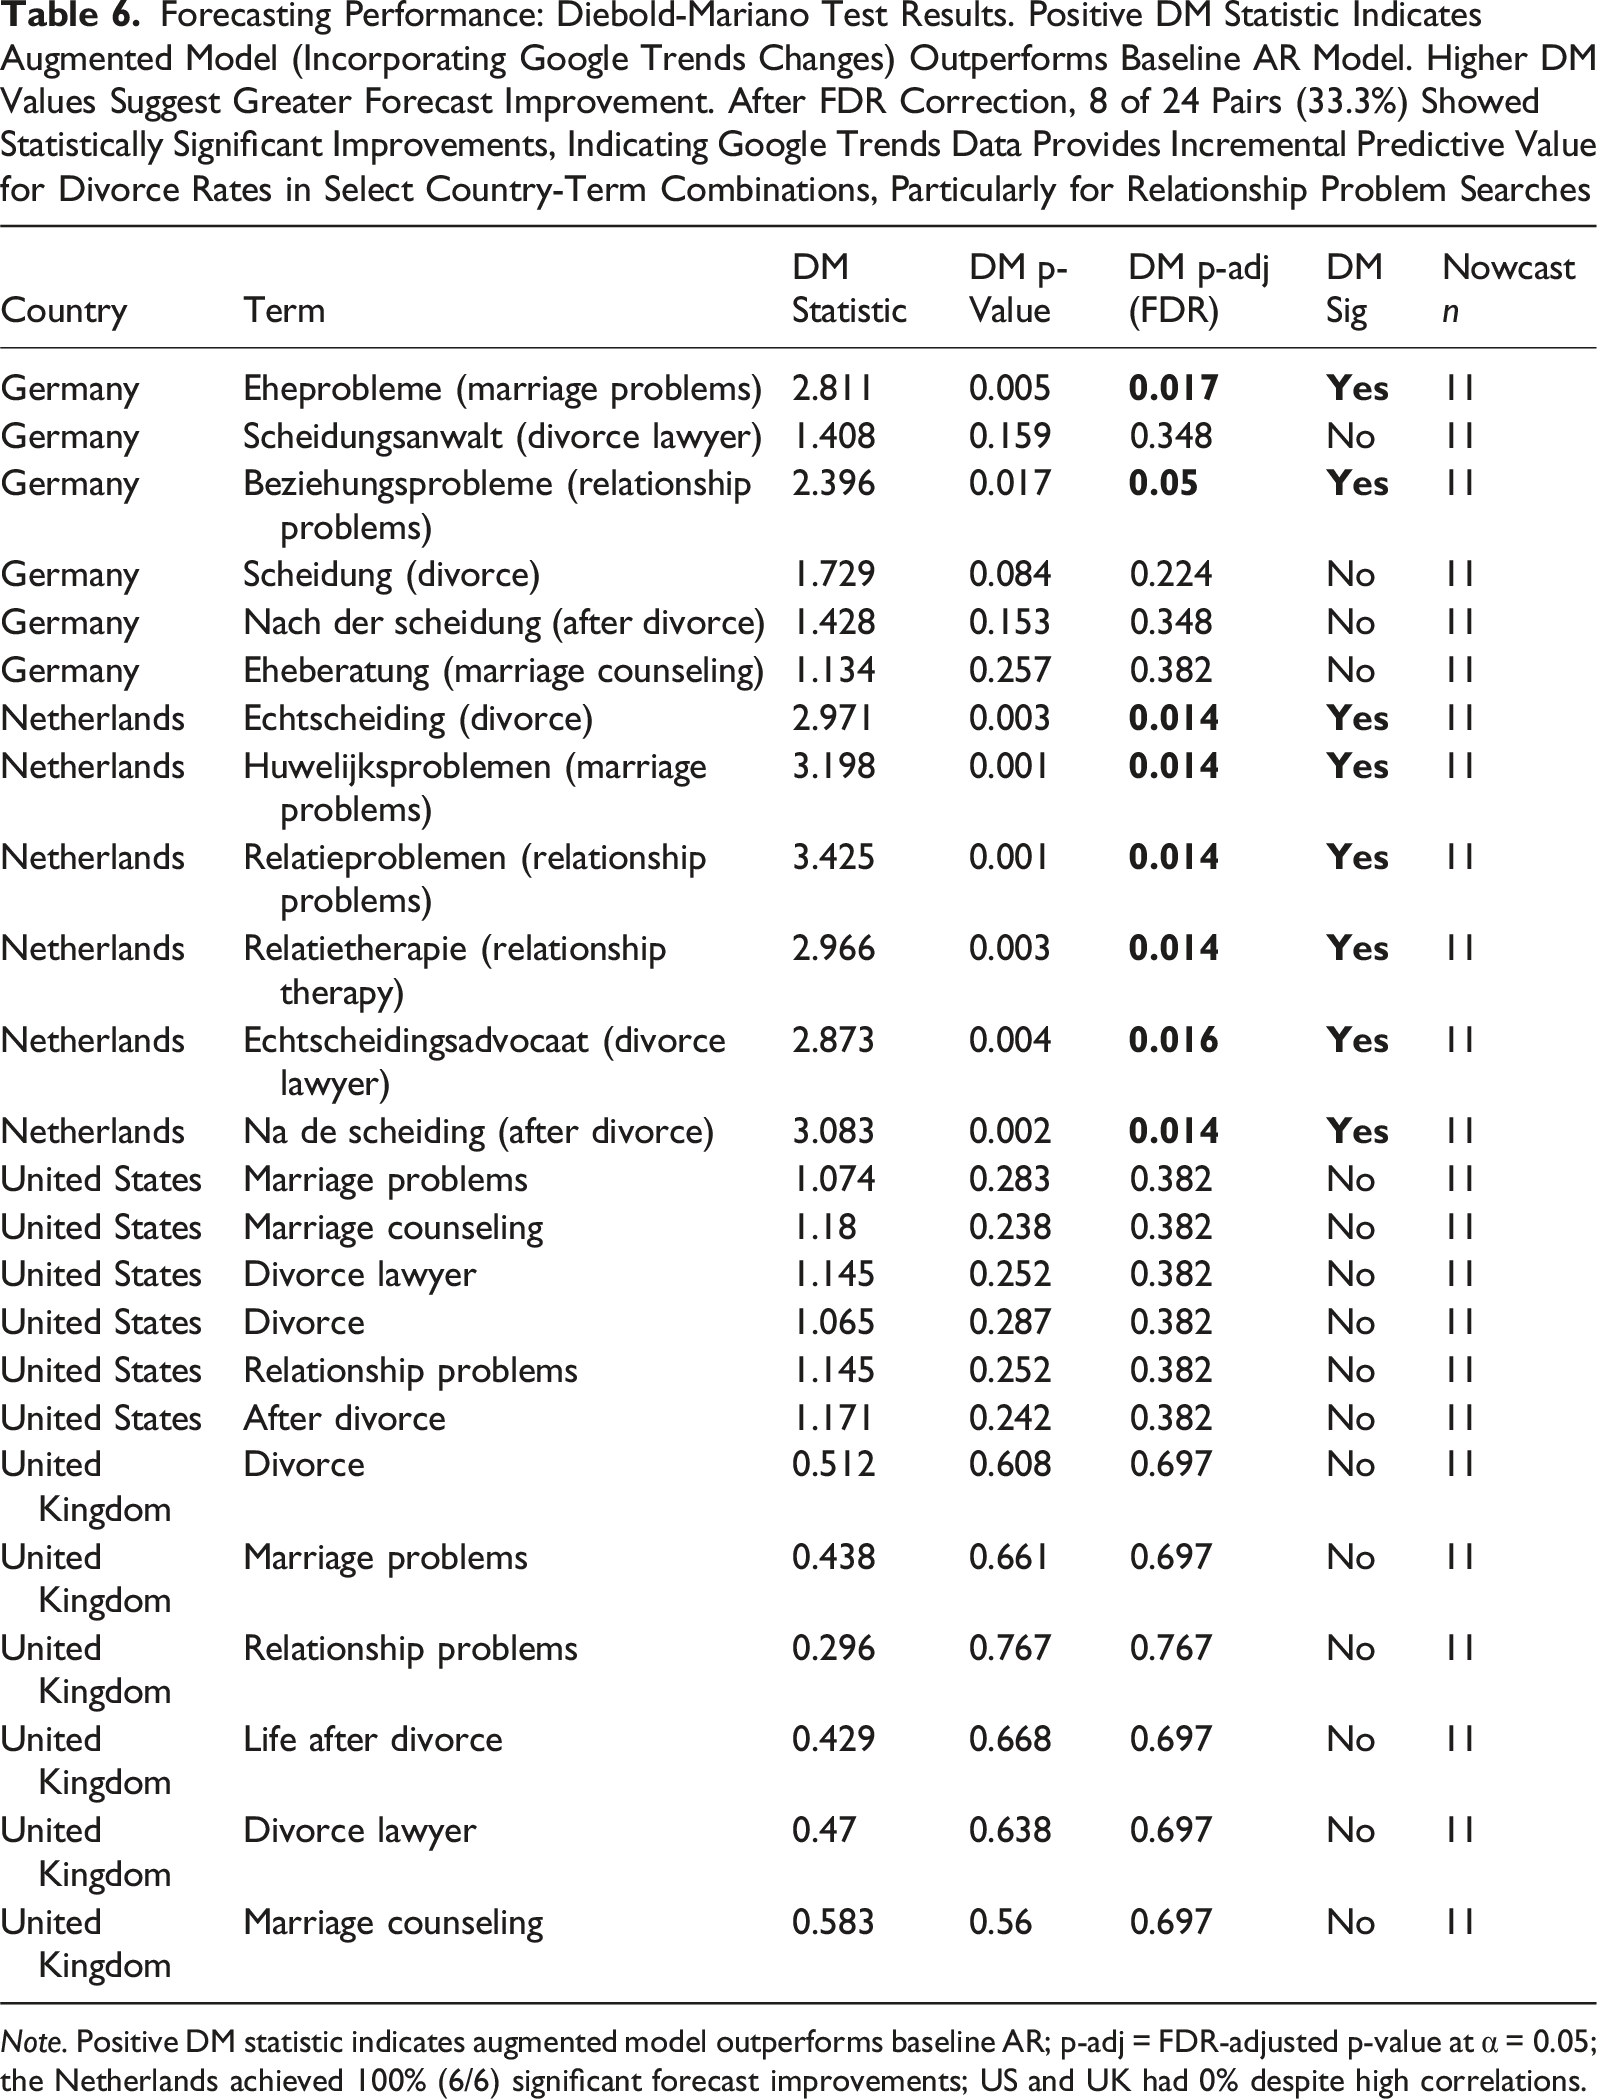
Note. Positive DM statistic indicates augmented model outperforms baseline AR; p-adj = FDR-adjusted p-value at α = 0.05; the Netherlands achieved 100% (6/6) significant forecast improvements; US and UK had 0% despite high correlations.
Frequency and Spectral Insights
Spectral coherence analysis revealed moderate average coherence of 0.307, with only 25% (6/24) of pairs exceeding the high-coherence threshold of 0.4 (Table 5). This indicates that strong frequency-specific co-movement between search intensity and divorce rates is the exception, suggesting that the two processes operate on partially independent cyclical patterns. High coherence concentrated in proactive terms like “marriage counseling” and “relationship therapy,” implying preventive information-seeking shows stronger synchronization with divorce outcomes than reactive searches.
Phase spectrum analysis produced an average median phase lag of 0.188 years. Positive phase lags, where search activity leads divorce rates, appeared in 62.5% of pairs (15/24), supporting CCF evidence of temporal precedence. However, Table 5 shows nuanced patterns: although CCF optimal lags indicate time-domain precedence, phase results often reveal divorce leading search within high-coherence pairs at dominant frequencies, reflecting methodological differences between overall temporal alignment (CCF) and frequency-specific lead-lag identification.
Negative phase lags were observed where divorce is highly normalized, notably UK “divorce lawyer” with strong coherence (0.678) but negative phase (−0.388), suggesting reactive or post-divorce searching rather than anticipatory planning at certain frequencies. Conversely, UK “life after divorce” showed high coherence (0.473) and strong positive phase (+1.0 year), indicating divorce cycles precede post-divorce searches.
Rolling window CCF analysis revealed temporal instability, with optimal lags shifting across 4-year windows, underscoring the non-stationary and context-dependent nature of search and divorce dynamics shaped by changing digital use, economic conditions, and policy environments.
Forecasting and Predictive Performance
Rolling-origin nowcasting compared baseline autoregressive (AR) models with augmented specifications incorporating first-differenced Google Trends data. Diebold-Mariano tests with FDR correction identified significant forecast improvements in 33.3% (8/24) of country-term pairs (Table 6), concentrated in Germany and especially the Netherlands, with no gains observed for the United Kingdom or United States.
Geographic heterogeneity in predictive performance indicates that the value of Google Trends for nowcasting divorce rates depends on institutional and cultural contexts. The Netherlands shows consistent forecasting gains with 100% success rate across all terms (DM = 2.87–3.43, all p-adj <0.02), indicating online searches capture the full divorce decision process.
Germany’s partial success indicates problem-recognition searches hold predictive value, while legal and counseling terms do not add information beyond autoregressive dynamics, aligning with episodic, crisis-driven search behavior observed in Germany.
In the highly digitized, high-divorce contexts of the United States and United Kingdom, widespread access to divorce information and normalization of marital dissolution weaken the marginal predictive value of searches. Despite strong correlations (U.S. average |CCF| = 0.887) and high coherence for specific terms (UK “divorce lawyer” coherence = 0.678), search data did not improve forecasts beyond autoregressive models, suggesting information saturation where baseline models already capture underlying dynamics. Overall, DM tests confirm Google Trends adds meaningful predictive value primarily in information-sensitive settings.
Robustness, Limitations, and Theoretical Implications
Summary of Statistical Significance After FDR Correction (q = 0.05). Success rate Indicates Proportion of Tests Remaining Significant After FDR Adjustment. Diebold-Mariano Tests Showed Highest Robustness (33.3%), While Cointegration and VAR-Granger Tests Showed Complete Attenuation (0%)
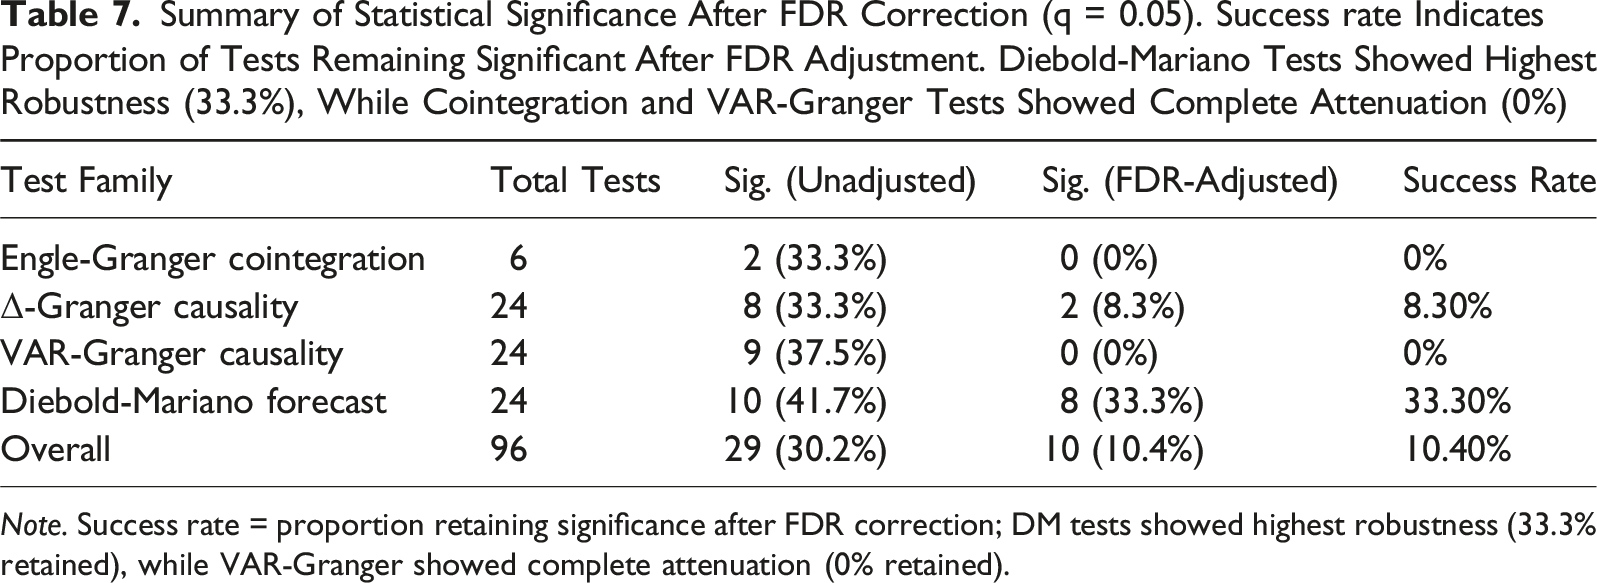
Note. Success rate = proportion retaining significance after FDR correction; DM tests showed highest robustness (33.3% retained), while VAR-Granger showed complete attenuation (0% retained).
Several limitations apply. First, the 5-year window limits statistical power of cointegration tests, likely contributing to significance loss after FDR correction (Table 7, row 1). Second, annual data constrains temporal resolution and may obscure higher-frequency dynamics, as median phase lags below 1 year (Table 5) indicate sub-annual effects. Third, Google Trends provides relative rather than absolute search volumes, preventing direct cross-country magnitude comparisons; differences such as Netherlands “relatietherapie” (M = 75.66) versus UK “life after divorce” (M = 14.21) reflect within-country normalization. Fourth, the analysis does not control for confounders such as economic recessions, legislative changes, or COVID-19. Gregory-Hansen breaks clustered in 2014 to 2016 and 2019 to 2020 (Table 3) suggest such exogenous factors may influence both search behavior and divorce rates.
Despite these constraints, the findings support digital behavioral indicators as useful proxies for institutional processes. Evidence of search activity leading divorce rates in 62.5% of cases (Table 4) and strong forecasting gains in selective contexts, notably the Netherlands with 100% DM success rate (Table 6), indicate that online searches capture latent decision dynamics before formal legal action. However, weak overall Granger causality (8.3% retaining significance) and substantial cross-country heterogeneity confirm that digital trace data complement rather than replace traditional demographic indicators, with predictive value shaped by cultural norms and institutional responsiveness.
Lead-lag patterns can be interpreted through theories of intention formation and help-seeking. The Theory of Planned Behavior argues that actions follow intentions shaped by attitudes, norms, and perceived control (Ajzen, 1991). Online searches represent a low-cost step that externalizes intention before formal action, explaining why search intensity often precedes divorce outcomes, consistent with the predominance of negative lags (Table 4). Google Trends therefore functions as a nowcasting indicator that can enhance short-term forecasts when paired with autoregressive baselines (Choi & Varian, 2012). However, digital indicators require calibration because algorithmic and behavioral shifts can destabilize measurement, and models integrating search data with official series and regular recalibration perform more reliably (Lazer et al., 2014). Digital traces increasingly surface ahead of official releases, anticipating real-world indicators by capturing shifts in information-seeking behavior linked to life events (Clements & Horwood, 2024; Golder & Macy, 2014; Mangono et al., 2021).
Query content matters. Solution-oriented searches such as “marriage counseling” expose users to therapeutic information that may enhance hope and self-efficacy, potentially reversing early divorce intentions. This aligns with the weak predictive relationship observed for U.S. “Marriage counseling” despite very high search intensity (CCF = 0.782, zero lag, Table 4; M = 80.87, Table 1), and with its positive phase lag indicating effects that operate mainly at the individual rather than aggregate level.
In contrast, problem-focused queries such as “marriage problems” and “relationship problems” may trigger diagnostic spirals driven by confirmation bias (Nickerson, 1998). Filter-bubble effects further reinforce this pattern (Allen, 2012). Engagement-optimizing personalization amplifies users’ initial frames (Golbeck, 2020; Zanathy, 2021). Evidence of algorithmic echo chambers confirms that this escalation from tentative concern to conviction is common. Several studies confirm algorithmic eco chambers that transform tentative concern into conviction. (Gombar & Boban, 2025; Jiang et al., 2019; Schoenebeck et al., 2025). These mechanisms likely explain why U.S. “Relationship problems” shows the strongest predictive relationship in the dataset (CCF = 0.975, Granger significant, Table 4), suggesting that searching itself forms part of the causal pathway toward divorce consideration.
Additional limitations warrant acknowledgment. Although term selection was theory driven, alternative terminology and evolving cultural usage may not be captured. Data reliability is also a concern, as Google Trends downloads may vary across days, particularly for low-volume terms (Behnen et al., 2020; Eichenauer et al., 2022; Franzén, 2023; Gummer & Oehrlein, 2023, 2025; Hölzl et al., 2025; Mavragani & Ochoa, 2019; Nuti et al., 2014). While we did not use multi-download averaging, reliance on annual aggregates and high-volume terms reduces this risk compared to monthly analyses of low-frequency queries. The consistency of results across four countries and multiple methods suggests substantive patterns rather than download artifacts. Nevertheless, future studies should apply multi-day sampling, especially for monthly data or rare queries. Future research should also integrate additional covariates (unemployment rates, legal reforms, and social policy changes) to isolate the independent informational contribution of online search behavior.
The observed non-stationarity in the search-divorce relationship reflects not only changing social behavior but also known measurement instabilities in Google Trends. Search indices can be distorted by sampling noise and frequency inconsistency, so variation in model performance may partly reflect data artifacts rather than true behavioral change (Eichenauer et al., 2022). Algorithmic adjustments can also alter search visibility and have previously caused misinterpretation of search-based predictors (Lazer et al., 2014). Looking ahead, increasing use of large language models may reduce the informational value of search data as users seek private guidance without generating explicit queries (del Rio-Chanona et al., 2024; Zhou & Li, 2024). As a result, LLM adoption becomes a new contextual factor that may gradually weaken the predictive capacity of search-derived measures.
Conclusion
This study examined whether Google Trends search intensity predicts official divorce rates across four Western nations. Using a comprehensive econometric framework, it found that digital distress signals are context-dependent rather than universally predictive. Although 62.5% of search terms preceded divorce rates by one to 2 years, only 8.3% remained Granger significant after false discovery correction. Forecasting gains were highly country-specific: the Netherlands showed consistent improvements (DM = 2.87–3.43, p < 0.02) across all search terms, indicating systematic capture of the entire divorce pathway. Germany demonstrated intermediate results with 33% forecast success (DM = 2.40–2.81) limited to problem-recognition terms, suggesting episodic crisis-driven engagement. The United States and United Kingdom showed no gains despite high search volumes, consistent with information saturation in normalized divorce cultures. Digital Behavioral Decoupling captures this divergence between online distress expression and institutional outcomes. Spectral analysis showed predictive value concentrated at three to 5 year periodicities, and algorithmic feedback loops indicated that problem-focused searches may amplify negativity while solution-oriented queries promote corrective engagement. Overall, Google Trends can serve as an early warning indicator only in contexts characterized by preventive, institutionally supported help-seeking. Future research should extend temporal coverage, integrate policy and macroeconomic moderators, and combine computational analysis with qualitative inquiry to map cultural mechanisms underlying digital distress signals.
Supplemental Material
Supplemental Material - From Search to Separation: Digital Behavioral Decoupling and the Predictive Power of Google Trends for Divorce Outcomes Across Four Western Nations
Supplemental Material for From Search to Separation: Digital Behavioral Decoupling and the Predictive Power of Google Trends for Divorce Outcomes Across Four Western Nations by Emre Can Kuran and Umut Kuran in Social Science Computer Review.
Footnotes
Acknowledgments
The authors thank the national statistical agencies - the U.S. Centers for Disease Control and Prevention, German Federal Statistical Office (Destatis), Statistics Netherlands (CBS), and the UK Office for National Statistics—for providing open access to divorce statistics. We also acknowledge Google for maintaining the publicly accessible Google Trends platform. No writing or editing assistance was received from third parties in the preparation of this article.
Ethical Considerations
Ethical approval was not required for this study. The research involves secondary analysis of publicly available aggregated data from Google Trends and official divorce statistics published by national statistical agencies (CDC, German Federal Statistical Office, Statistics Netherlands, and UK Office for National Statistics). No human participants were directly involved, no individual-level data were collected or analyzed, and all data sources are publicly accessible and anonymized at the population level. The study complies with institutional research ethics guidelines for the use of publicly available secondary data.
Consent to Participate
Not applicable. This study did not involve human participants.
Consent for Publication
Not applicable. This study did not involve individual participant data, images, or personally identifiable information.
Funding
The authors received no financial support for the research, authorship, and/or publication of this article.
Declaration of conflicting interests
The authors declared no potential conflicts of interest with respect to the research, authorship, and/or publication of this article.
Data Availability Statement
The data that support the findings of this study are openly available from the following sources: Google Trends data at ![]() ; United States divorce statistics from the Centers for Disease Control and Prevention (CDC); German data from the Federal Statistical Office (Destatis); Dutch data from Statistics Netherlands (CBS); and United Kingdom data from the Office for National Statistics (ONS). The analytical dataset compiled for this study and replication code are available from the corresponding author upon reasonable request.
; United States divorce statistics from the Centers for Disease Control and Prevention (CDC); German data from the Federal Statistical Office (Destatis); Dutch data from Statistics Netherlands (CBS); and United Kingdom data from the Office for National Statistics (ONS). The analytical dataset compiled for this study and replication code are available from the corresponding author upon reasonable request.
Supplemental Material
Supplemental Material for this article is available online.
Author Biographies
References
Supplementary Material
Please find the following supplemental material available below.
For Open Access articles published under a Creative Commons License, all supplemental material carries the same license as the article it is associated with.
For non-Open Access articles published, all supplemental material carries a non-exclusive license, and permission requests for re-use of supplemental material or any part of supplemental material shall be sent directly to the copyright owner as specified in the copyright notice associated with the article.