
Abstract
Google Trends (GT) data are increasingly used in the social sciences and adjacent fields. However, previous research on the quality of GT data has raised concerns regarding their reliability. In the present study, we investigated whether reliability differs between low- and high-frequency search terms. In other words, we explored the existence of a reliability-frequency continuum in GT data. Our study adds to previous research by investigating a more comprehensive set of search terms and different aspects of reliability (e.g., differences in relative search volume distributions, correctly identified maxima). For this purpose, we collected samples of GT data for ten high- and two low-frequency search terms. We obtained one real-time sample and 62 non–realtime samples per search term (30 non–realtime samples for low-frequency search terms). Data collection was restricted to search data for Germany. Our data support the existence of a reliability-frequency continuum—low-frequency search terms are subject to greater reliability issues compared to high-frequency search terms. Based on our findings, we have derived practical recommendations for the use of GT data and have outlined future research opportunities.
Introduction
Google Trends (GT) data are increasingly being utilized in the social sciences and adjacent fields (Mehltretter et al., 2023). Examples include studies that have focused on investigating political mobilization (DiGrazia, 2017), racism (Stephens-Davidowitz, 2014), electoral outcomes (Swearingen & Ripberger, 2014), AI-use in higher education (Cotton et al., 2024), financial investment decisions (Starks, 2023), and forecasting near-term economic indicators (Choi & Varian, 2012). For a comprehensive overview of social science research that utilizes GT data, we refer readers to the systematic review conducted by Mehltretter et al. (2023). Systematic reviews are further available for the use of GT data in medicine and public health research (Mavragani et al., 2018; Nuti et al., 2014). For a general review across disciplines, see Jun et al. (2018).
GT relies on samples of Google searches and, thus, offers insights into the search volumes of specific terms (e.g., “Obama”) queried in Google Search (i.e., the search engine), focusing on a particular location (e.g., “United States”) within a specific time frame (e.g., “June 01, 2023–June 07, 2023”). Depending on the specific time frame and the date when a query is issued to GT, one of two samples of Google search data is used (Trends Help, 2024): (i) the real-time sample that includes Google searches covering the last seven days or (ii) the non–realtime sample that covers searches since 2024 and up to 72 hours before a query. Non–realtime data are obtained when the GT query is issued more than seven days after the period of interest. Based on the settings, each query returns monthly, weekly, daily, or hourly relative search volumes (RSVs) that cover the entire specified time frame and range from 0 to 100 (Trends Help, 2024). The time point with the most search queries in the specified time frame receives the value of 100, whereas search volumes for all other time points are provided relative to this maximum (e.g., 50 means that at that point of time the search term was used 50% of the maximum of the observed time frame).
In contrast to the increasing body of substantive research that uses GT data (e.g., Jun et al., 2018; Mavragani et al., 2018; Mehltretter et al., 2023), methodological studies exploring data quality and issues with data collection are comparatively rare. While the studies by Zhu et al. (2016) and Mellon (2013, 2014) addressed the validity of GT data, most existing work has focused on the reliability of the data (Behnen et al., 2020; e.g., Cebrián & Domenech, 2023; Eichenauer et al., 2022; Franzén, 2023; Raubenheimer, 2024; Rovetta, 2021; Zhu et al., 2016) and/or has provided methodological insights regarding the application of GT data (Fang et al., 2021; Gummer & Oehrlein, 2023). These studies mainly have raised concerns about reliability issues when data are obtained as non–realtime data (Gummer & Oehrlein, 2023; Rovetta, 2021; Timoneda & Wibbels, 2022). Behnen et al. (2020) and Eichenauer et al. (2022) found that reliability differed among GT data granularity (i.e., daily, weekly, monthly), which suggests that even real-time data may be affected by reliability issues. Timoneda and Wibbels (2022) and Behnen et al. (2020) indicated that GT data are sensitive to how frequently search terms are used. Rovetta (2021) highlighted reliability issues with non–realtime GT data when geographical boundaries were specified in the search query, which lowered the global search term frequency. With this in mind, Gummer and Oehrlein (2023) replicated reliability issues for low-frequency search terms in a survey research case study. Based on the large-scale survey FReDA—The German Family Demography Panel Study (Schneider et al., 2021), these authors demonstrated that non–realtime data varied, depending on the day on which the data were obtained, which indicated reliability issues for their use case (i.e., using GT data to inform survey operations). In their study, Gummer and Oehrlein (2023) also investigated non–realtime GT data use with a resampling strategy that involved combining samples from different days, which was proposed by previous research (Eichenauer et al., 2022; Raubenheimer, 2024; Rovetta, 2021; Stephens-Davidowitz & Varian, 2015). They found that while this strategy marginally reduced reliability issues, it did not completely mitigate them. Consequently, the authors recommended caution when using non–realtime GT data and, when using these data cannot be avoided, to at least aggregate multiple samples.
Given the previous findings on the reliability issues of non–realtime GT data, the usability of these data for social science research is questionable. This is troublesome news, especially since these data are widely used due to the low cost at which they can be obtained (Jun et al., 2018; Mehltretter et al., 2023) and the high granularity and longtime trends that GT data can offer. However, previous research that systematically investigated reliability issues often were based on rare search terms that are not used frequently. A notable exception is the study by Behnen et al. (2020) that compared one low-, one mid-, and one high-frequency search term with respect to reliability. Nevertheless, since these authors relied only on three search terms and used proxy information to assess search term frequency, more research on the importance of search term frequency is required. It remains unclear whether GT data are more reliable when obtained for more frequently used search terms. If reliability would systematically vary conditional to the frequency of search terms, a reliability-frequency continuum would exist.
In the present study, we shift the focus from investigating the reliability of GT data from rare search terms to more frequently used ones. Our research question is: Does a reliability-frequency continuum of search terms exist for GT data? In other words, we explore whether GT data can be effectively used to analyze search behavior concerning famous individuals, major societal events, and popular brands frequently searched.
To address our research question, we gathered samples of real-time GT data for high-frequency search terms. These search terms included brands, famous individuals, and societal events that we obtained from Google’s list of “Daily search trends” in Germany. For each search term, we obtained a real-time sample and then collected non–realtime samples for every day over a period of 62 days. Each of the 62 search queries to obtain non–realtime samples covered the same region and the same time frame as the search query for the initial real-time sample. We then compared the non–realtime samples with the real-time data to assess their reliability. In addition, we compared the different non–realtime samples with each other to gauge a different aspect of the reliability of the GT data. Furthermore, we acquired replication data used by Gummer and Oehrlein (2023) from their investigation of low-frequency search terms. We combined both data sets and conducted a comparative analysis of the reliability of GT data for selected low- and high-frequency search terms.
The structure of our study is as follows. We provide a detailed account of our data collection methods in the subsequent section. After presenting our results, we conclude with practical remarks on using and obtaining GT data and discuss avenues for future research.
Data and Methods
Data
List of High-Frequency Search Terms.
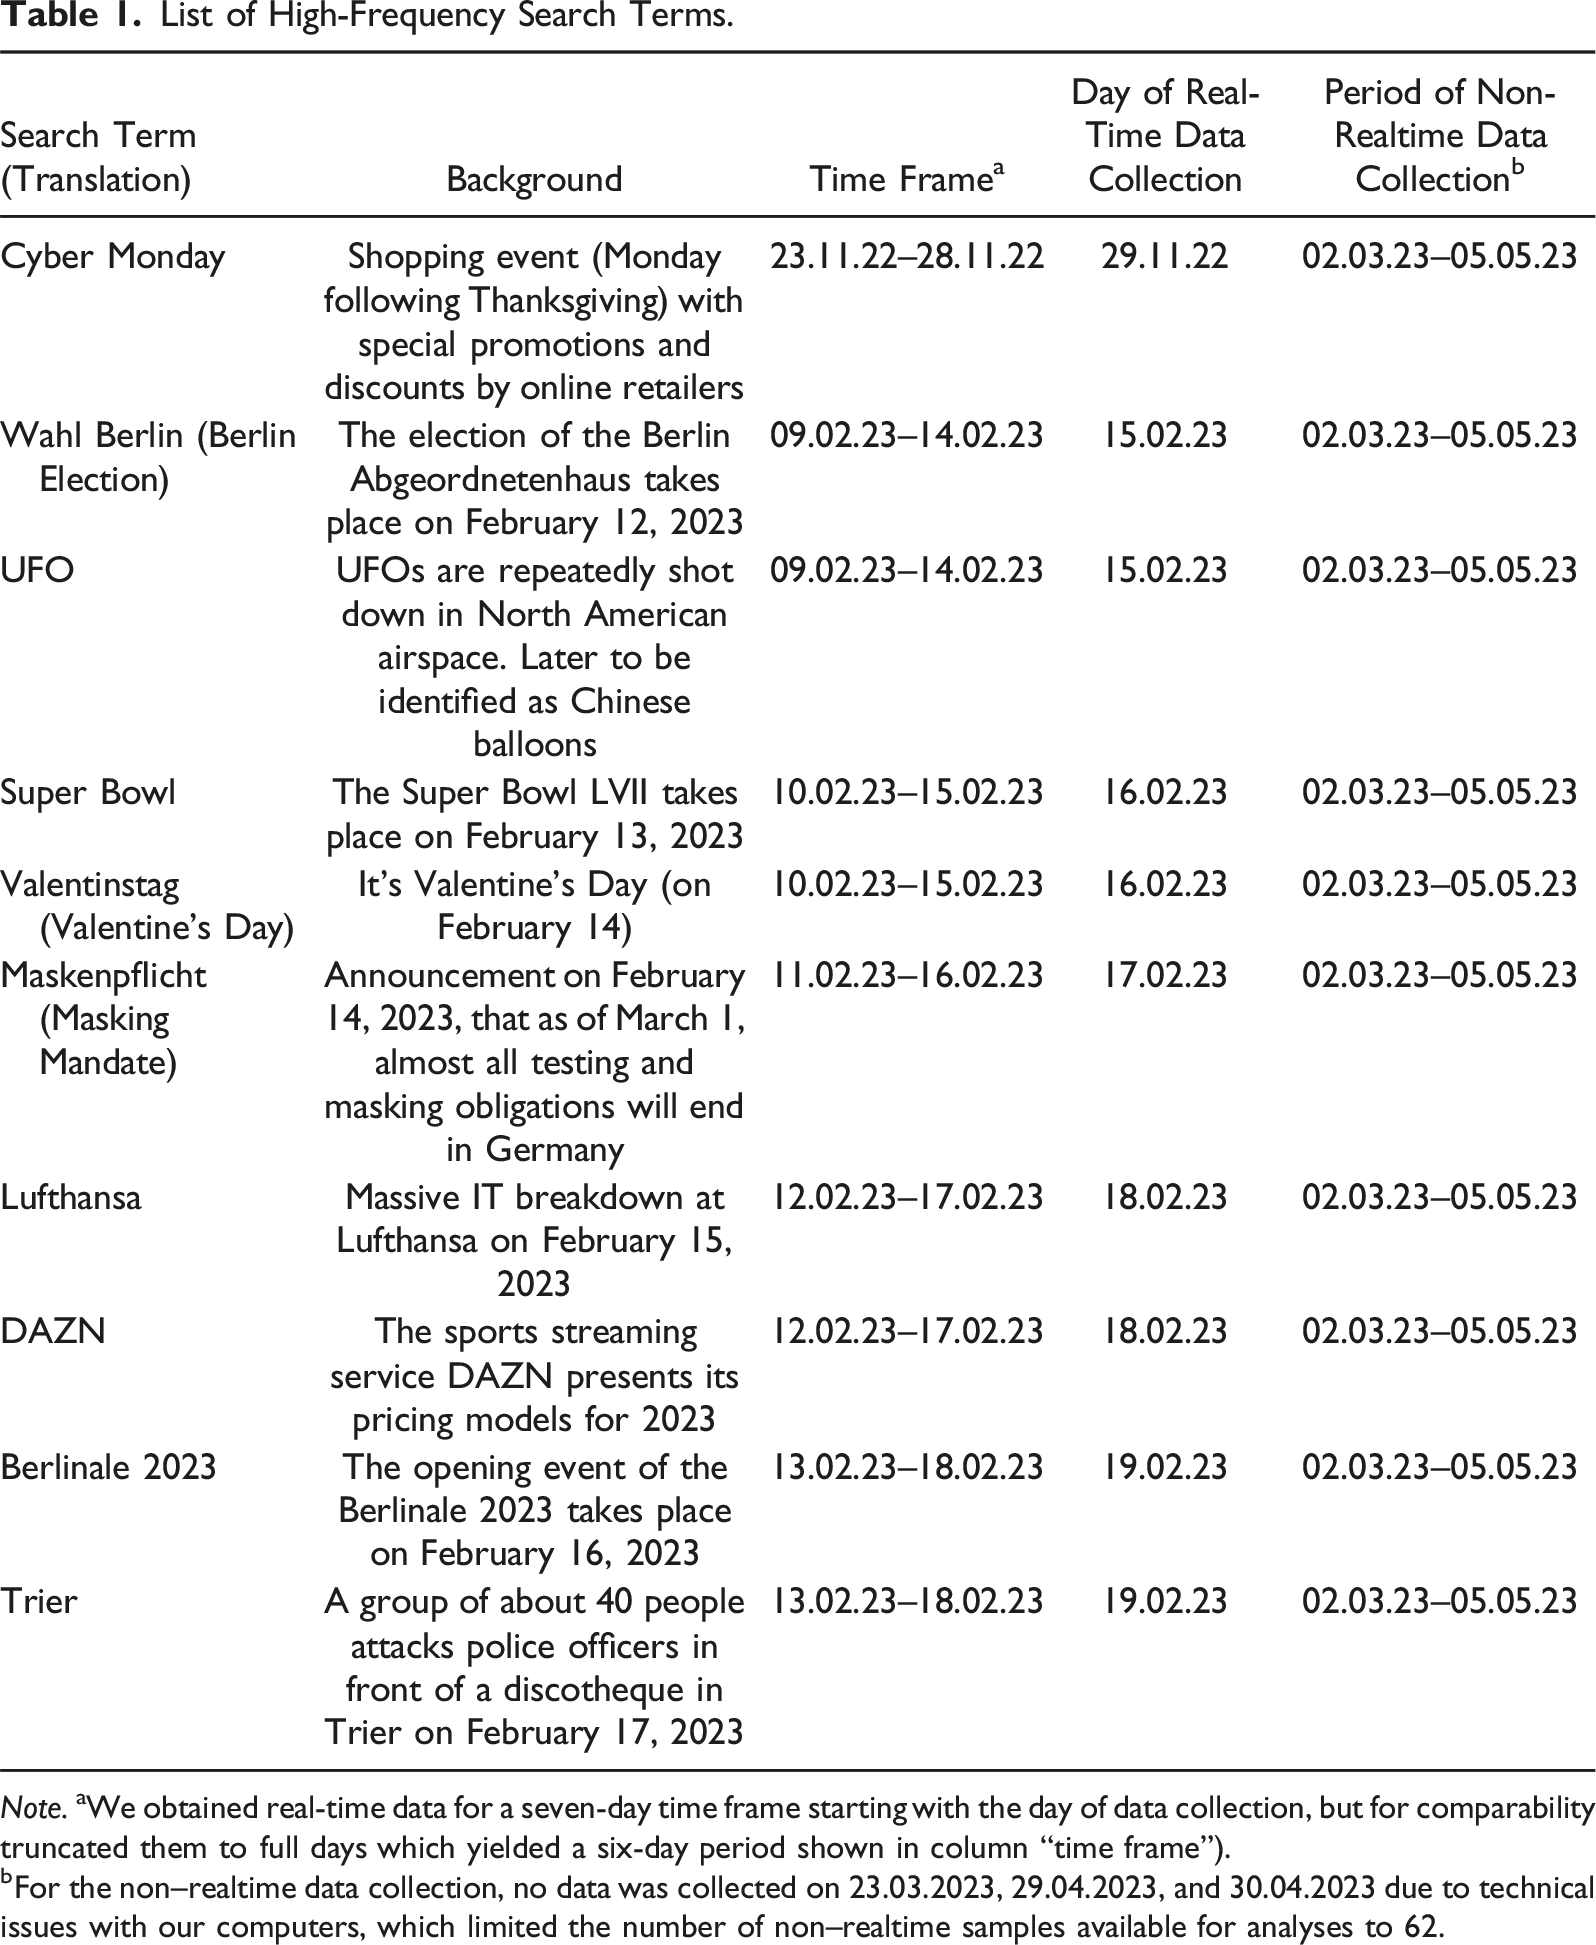
Note. aWe obtained real-time data for a seven-day time frame starting with the day of data collection, but for comparability truncated them to full days which yielded a six-day period shown in column “time frame”).
bFor the non–realtime data collection, no data was collected on 23.03.2023, 29.04.2023, and 30.04.2023 due to technical issues with our computers, which limited the number of non–realtime samples available for analyses to 62.
After selecting a search term for our high-frequency list, we obtained its maximum real-time GT data available, spanning seven days from the hour of retrieval. For each search term, we used the following query: “search term” with region set to Germany, category set to “All categories,” and Google property set to “Web Search.” The time frame was set to “Past 7 days.” To ensure comparability with non–realtime GT data, we transformed distributions of the more fine-grained real-time GT data to a daily granularity and truncated them to full days, which yielded a six-day period for each search term (see Table 1, column “Time frame”).
After completing our list of high-frequency search terms and obtaining corresponding real-time data, we began collecting non–realtime data for all 10 search terms, which were only available in daily granularity. We used the R package gtrendsR (Massicotte & Eddelbuettel, 2022) to collect the GT data and retrieved one sample per day over 62 consecutive days (see Table 1, column “Period of non–realtime data collection” for the days of data retrieval). To ensure comparability with the real-time samples, we collected all non–realtime samples by setting the same search queries that we had used to obtain the real-time data. We obtained RSVs for the same six-day time frame for which we previously collected the real-time data. This resulted in 62 non–realtime data samples for each high-frequency search term. Eventually, each sample contained RSVs on a daily granularity for the non–realtime samples and the transformed real-time samples.
To represent the low-frequency search terms, we drew on the replication data from the Gummer and Oehrlein (2023) study. These data included one real-time sample and 30 non–realtime samples for each of the search terms “FReDA” and “FReDA survey.” In contrast to our high-frequency search term data collection, the number of samples was lower for the low-frequency search terms, what limited the potential for comparisons between samples (see below). In addition, only two search terms (i.e., “FReDA” and “FReDA survey”) were available in the replication data. However, we still decided to rely on these data as the authors provided a reasonable argument that these search terms were unlikely to be used frequently in their case (i.e., searches in Germany). We decided in favor of internal validity and against quantity. Again, for comparability, we transformed the real-time data set to match the daily granularity of the non–realtime sample.
Methods
To evaluate the reliability issues of the non–realtime data, we relied on indicators that used different assumptions. First, we compared each of the non–realtime samples with the corresponding real-time sample for each search term (i.e., we made 62 comparisons per search term). We used the high-granular real-time data as the reference distribution, assuming that it would be more precise. By using this assumption, we followed the methods previously utilized by Gummer and Oehrlein (2023). We employed two indicators to assess the reliability issues based on a comparison between real-time and non–realtime data: Absolute Delta Between Non–realtime and Real-time Sample and Correctly Identified Distribution Maximum.
Behnen et al. (2020) reported inconsistencies in hourly GT data, which raised questions about whether real-time data are reliable and should serve as a benchmark. To relax the assumption we relied on previously, our third indicator did not consider real-time data and compared only the non–realtime samples with each other to investigate reliability from a different perspective. We call this indicator Absolute Delta Between Non–realtime Samples. It follows an approach similar to that used by Rovetta (2021).
Indicators Assuming the Reliability of Real-Time Data
Absolute Delta Between Real-Time and Non–Realtime Samples
We compared the six-day RSV distributions of each individual non–realtime sample to the RSV distribution of the real-time data sample for the respective search term. For each day, we calculated the absolute difference in RSVs between the two samples’ distributions (i.e., delta). The sum of each day’s delta was the Absolute Delta for each of the 62 samples.
To summarize the Absolute Deltas for each search term, we calculated the mean Absolute Delta and its standard deviation across all 62 samples. These figures served as indicators of how different the distributions were from each other in total.
Correctly Identified Distribution Maximum
This indicator focused on correctly identifying the peak of a distribution (i.e., its maximum). By using this indicator, we wanted to acknowledge that in some applications of GT data, an exact resemblance between RSV distributions may not be crucial; instead, it might be more important to identify the occurrence of important events (i.e., detecting anomalies). To compute this indicator, we determined whether the maximum of a non–realtime data RSV distribution happened on the same day as for the real-time data for the same search term. Again, we compared each of the 62 non–realtime samples with the real-time sample for each search term. Based on these comparisons, we calculated the share of the correctly identified distribution maximum across all non–realtime samples for each respective search term.
Indicator Not Assuming the Reliability of Real-Time Data
Absolute Delta Between Non–Realtime Samples
For each sample, we compared all 62 non–realtime samples with each other (30 in the case of the “FReDA” and “FReDA survey” search terms). Variation between the samples’ RSV distributions would indicate issues with reliability (i.e., the samples differed depending on when they were obtained). This approach resulted in comparing each of the 62 samples of each search term 61 times (i.e., comparing each sample to every other sample except itself). Respectively, we compared the 30 samples per low-frequency search term 29 times. As before, we computed the Absolute Delta for each sample comparison, which resulted in 61 Absolute Deltas per sample and 3782 Absolute Deltas per high-frequency search term, as well as 29 Absolute Deltas per sample and 870 Absolute Deltas per low-frequency search term. To feasibly work with this number of deltas, we decided to rely on summary statistics and calculated the mean of the 61 Absolute Deltas for each of the 62 samples of each search term (i.e., 62 mean Absolute Deltas per search term). To describe the properties of the 62 mean Absolute Deltas of each search term, we also computed the average of the mean Absolute Deltas and their standard deviation.
Results
Figure 1 displays the Absolute Delta Between Non–realtime and Real-time Samples for all 12 search terms. Although we observed varying levels of deltas between the 10 high-frequency search terms, relatively little variation occurred within each high-frequency search term. In other words, combining multiple samples is unlikely to significantly affect the disparities between the high and low deltas across different samples; it would likely yield similar deltas for a given high-frequency search term. The mean Absolute Deltas ranged between 1.17 (“Valentine’s Day”) and 12.74 (“Super Bowl”) with a standard deviation between 0.14 (“Valentine’s Day”) and 0.80 (“Berlinale 2023”). The latter descriptive statistic underlines the small variation we found between each search term’s samples. Average absolute deltas for 12 search terms.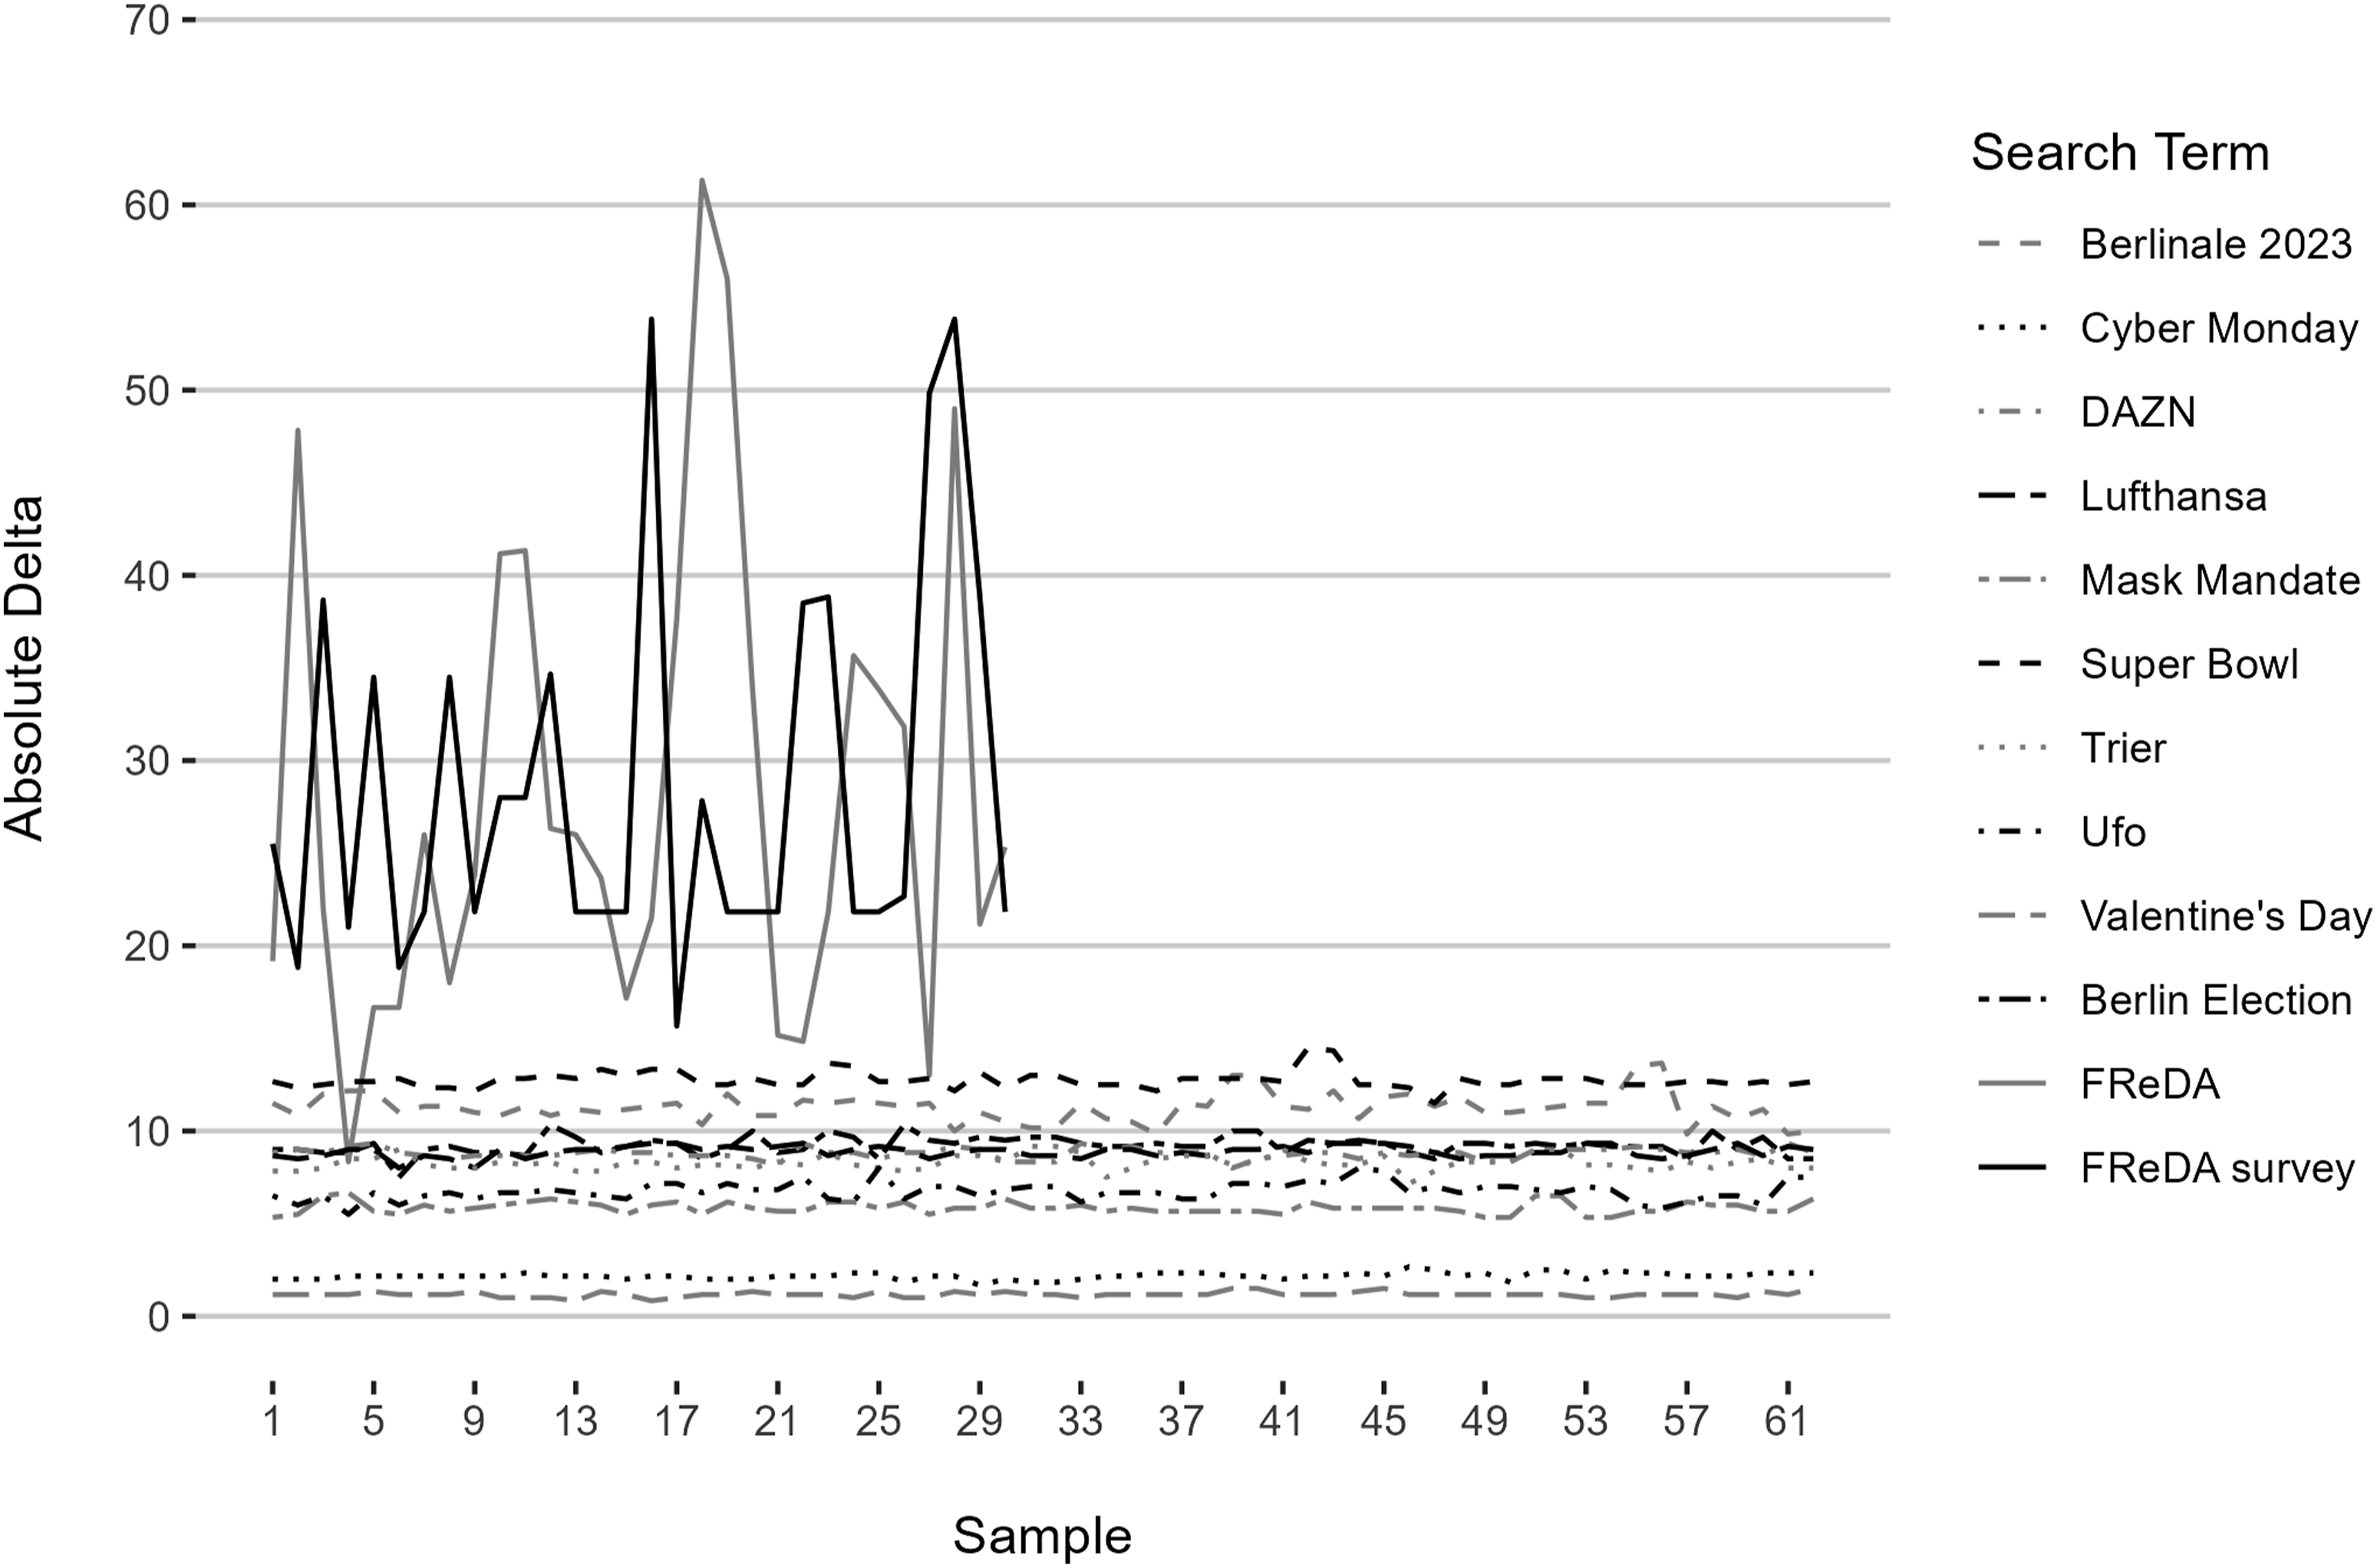
In contrast, when examining the two low-frequency search terms, we observed a substantial degree of variation between the samples for each search term. Furthermore, we found higher deltas for the low-frequency search terms compared to the high-frequency search term. This finding is a first indication of a difference in reliability issues dependent on the search term frequency. The mean Absolute Deltas of 28.20 (“FReDA”) and 28.75 (“FReDA survey”) were higher compared to the high-frequency search terms. Similarly, the comparatively high standard deviations of 13.17 (“FReDA”) and 10.51 (“FReDA survey”) signaled a high degree of variation between each search term’s samples.
Correctly Identified Distribution Maximum for 12 Search Terms.
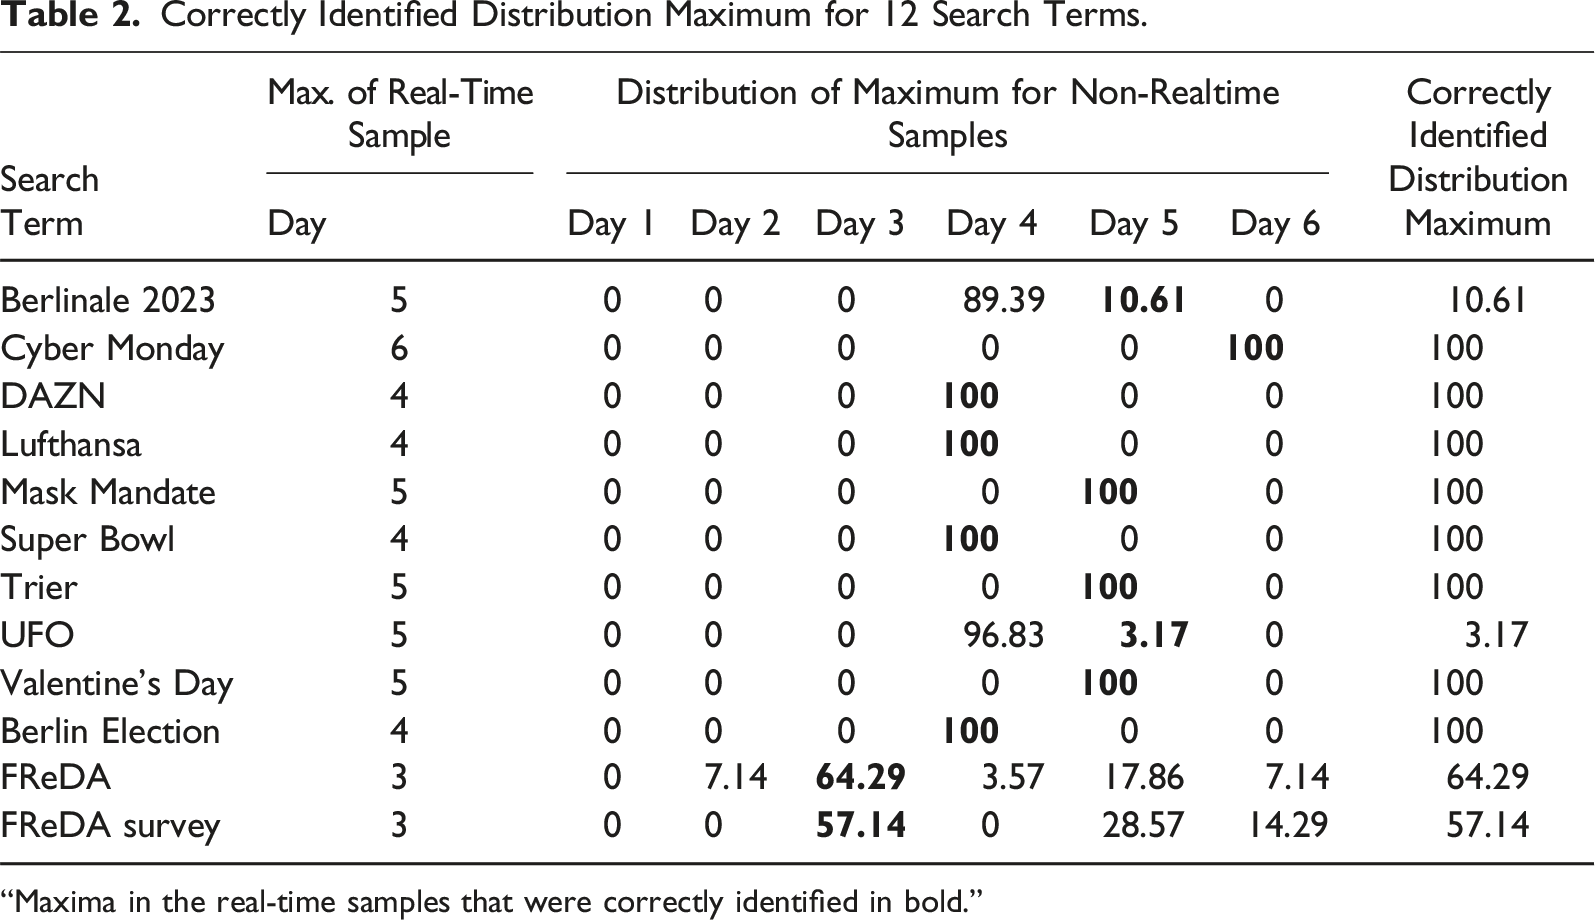
“Maxima in the real-time samples that were correctly identified in bold.”
Figure 2 illustrates the mean Absolute Delta Between Non–realtime Samples for each sample and each search term. For the high-frequency search terms, we again found little variation between the samples as indicated by the low degree of variation visible in the plots. On average, the mean Absolute Delta ranged between 0.24 (“Valentine’s Day”) and 2.06 (“Berlinale 2023”). The mean standard deviation ranged between 0.07 (“Valentine’s Day”) and 0.44 (“Berlinale 2023”), which indicated little variation between the samples of each term. As before, results were markedly different for the low-frequency search terms. The plots illustrate the variation between each search term’s non–realtime samples. In comparison to the high-frequency search terms, the mean Absolute Delta (30.71 [“FReDA”] and 19.42 [“FReDA survey”]) and the mean standard deviation (7.42 [“FReDA”] and 6.84 [“FReDA survey”]) were higher. Again, these figures indicate more variation between the samples obtained for these non–realtime data and point to reliability issues with low search frequencies. Between sample variation for 12 search terms. Note. Average absolute deltas displayed for comparison between non–realtime samples because each sample was compared to the remaining 61 other non–realtime samples. When comparing non–realtime to real-time samples, only one comparison was made per sample and absolute deltas are visualized.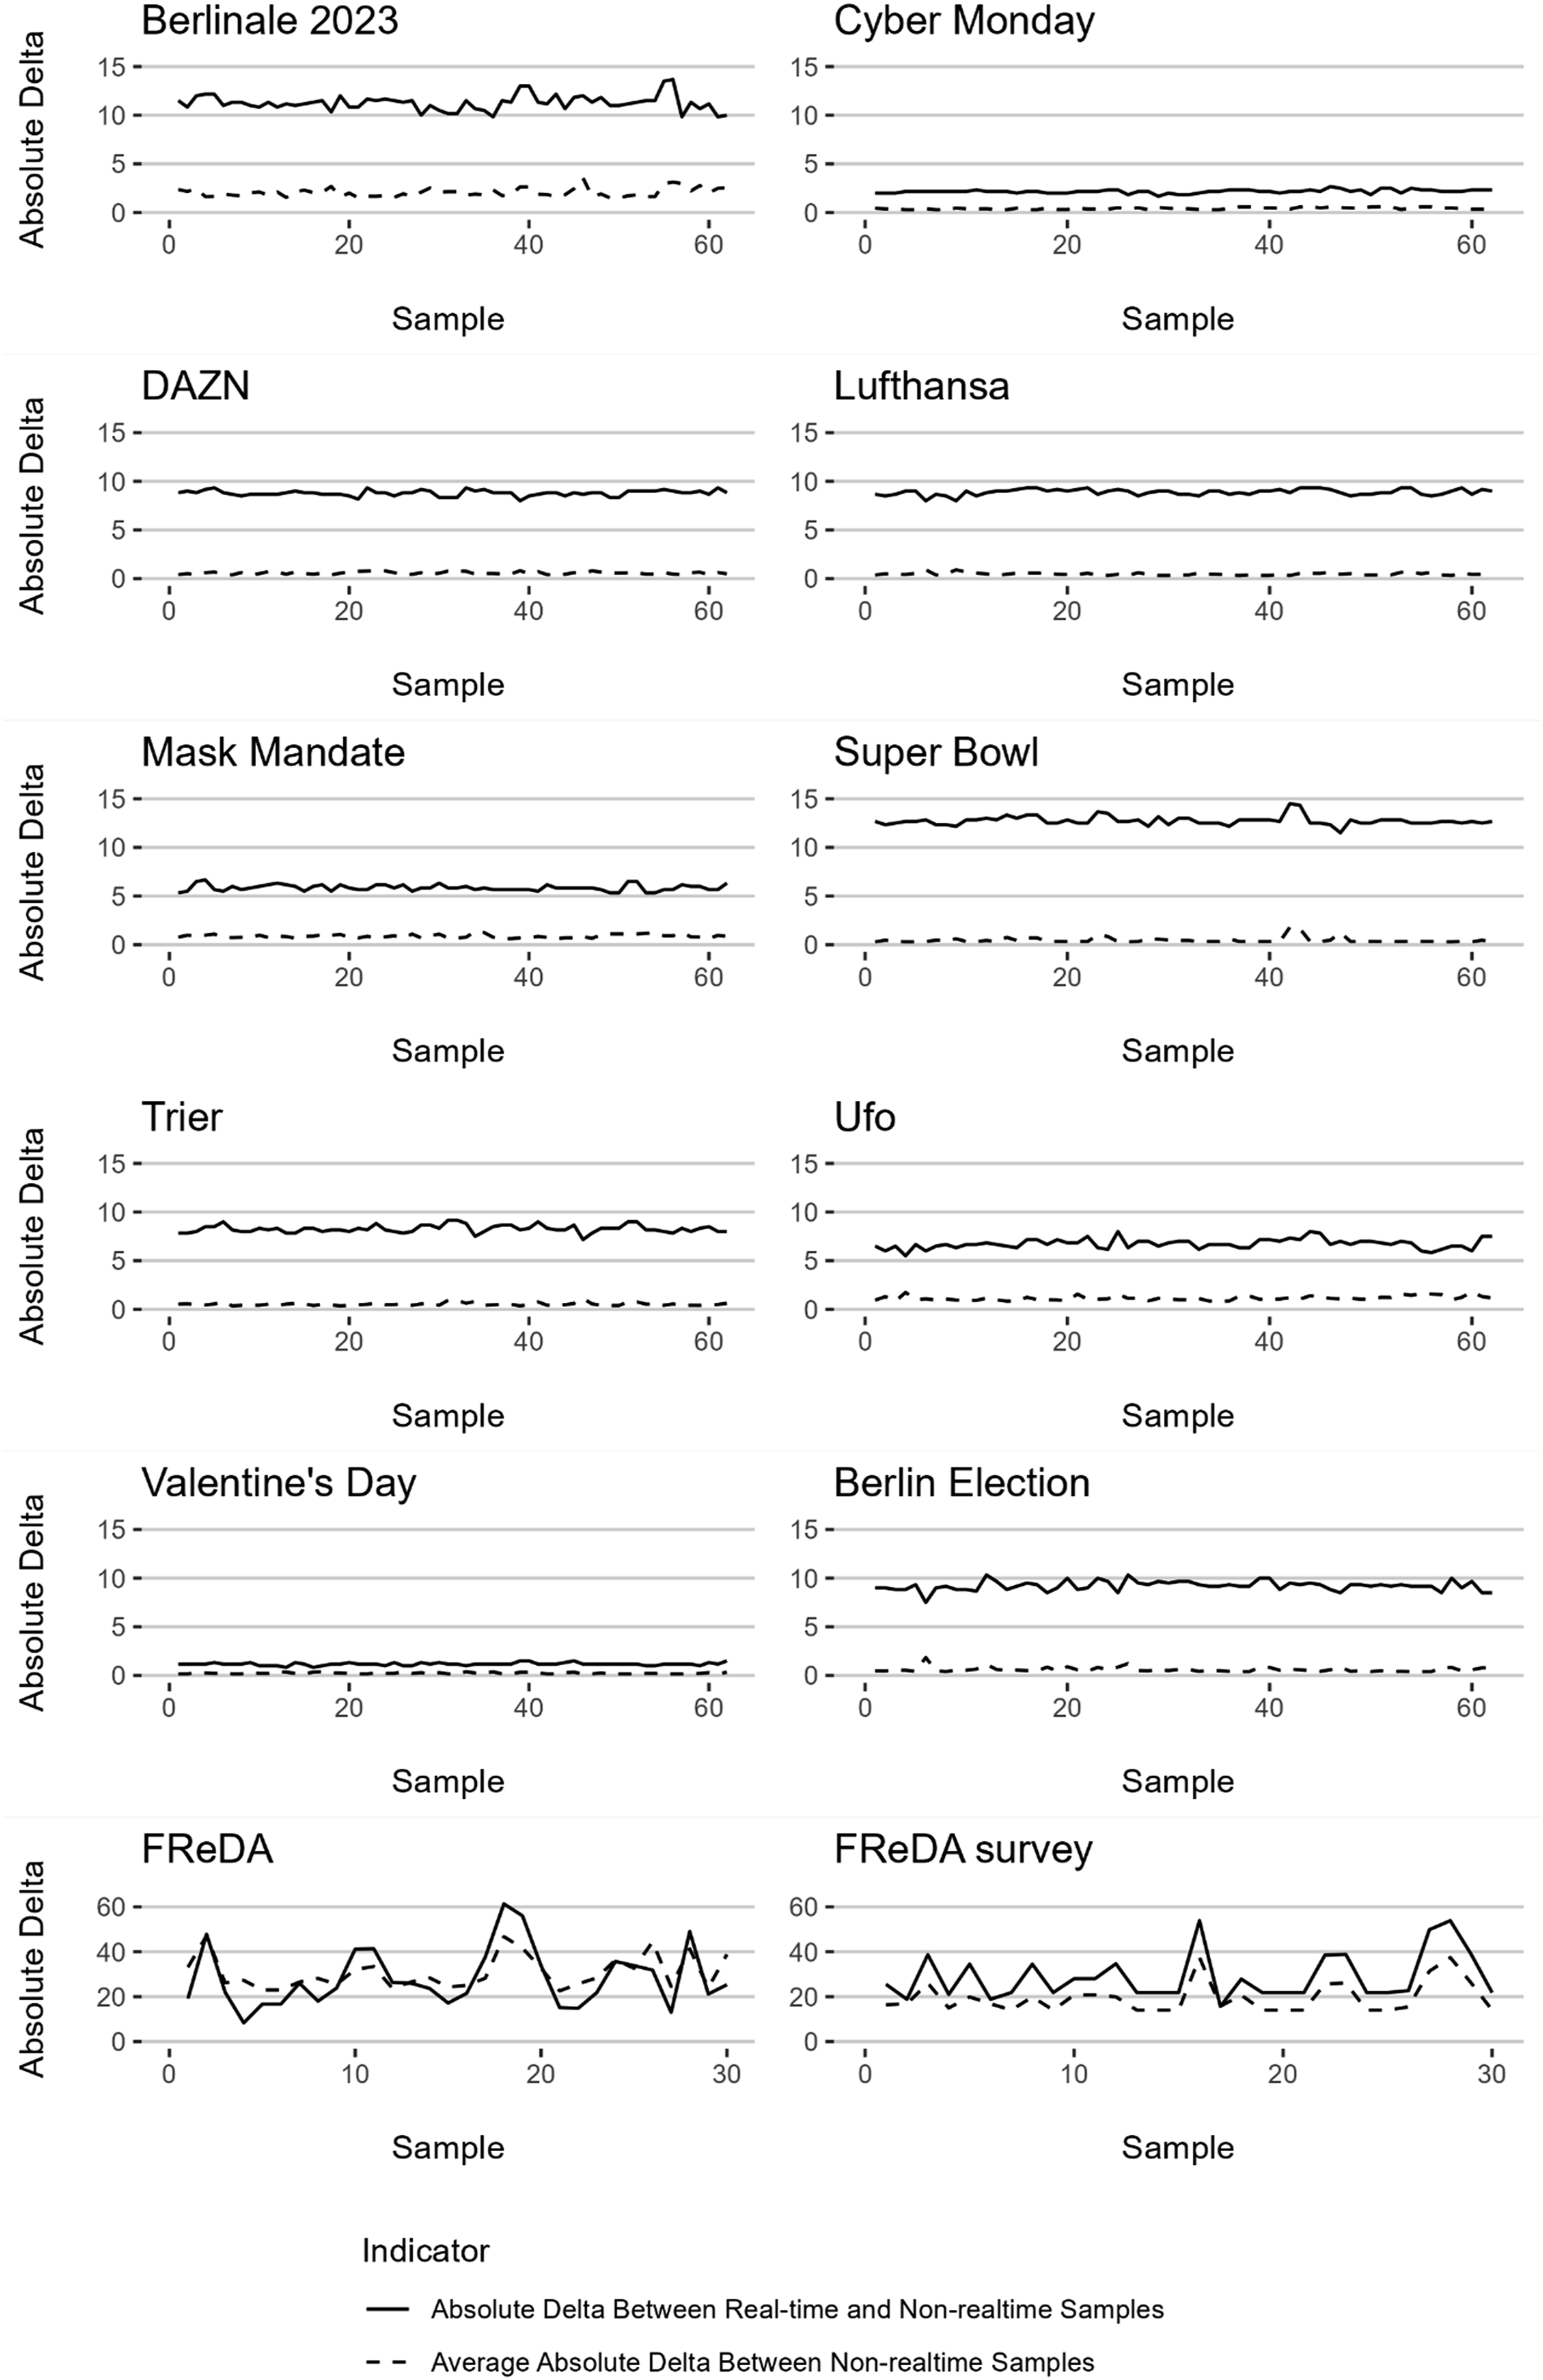
Conclusion
In the present study, we investigated whether the reliability issues identified by previous methodological studies on GT data also applied to high-frequency search terms. Based on a list of 10 high- and two low-frequency search terms, we found less reliability issues in the non–realtime samples of these search terms than for the low-frequency search terms. Across 62 samples obtained for each search term, we observed limited differences in distributions when compared to the real-time data distributions for the same search term. Additionally, when looking at the correct identification of the maximum of each distribution, we found only limited reliability issues regarding these high-frequency search terms. When comparing distributions between non–realtime samples, we observed the same pattern. Although across three different indicators, reliability issues were smaller for high-frequency than for low-frequency search terms, they were not zero, and so researchers should be aware of that when using GT data. Nevertheless, our findings clearly show that reliability issues of non–realtime GT data are more pronounced among low-frequency search terms. Regarding our research questions, our study provides an indication that a reliability-frequency continuum exists for GT data.
Our findings have practical implications for social science research that draws on GT data. First, when working with high-frequency search terms, non–realtime data appears to be usable with a comparatively smaller risk of reliability issues when compared to what previous research has reported for rare or low-frequency search terms. Several studies had indicated that distributions of non–realtime data did not properly resemble the distributions of the RSVs obtained from benchmark data or other GT data (Franzén, 2023; Gummer & Oehrlein, 2023; Rovetta, 2021; Timoneda & Wibbels, 2022). Similar to Behnen et al. (2020), we found that search term frequency did not account for all reliability issues. Differences in reliability varied between different search terms and different indicators for reliability. In general, we interpret our findings as supporting that GT data might be useful when obtained for certain high-frequency search terms.
Second, given the concerning findings for low-frequency search terms and the encouraging results for high-frequency search terms, there appears to be a reliability-frequency continuum. Our research suggests that researchers designing GT data collections should assess the frequency of the search terms they use. If the use of low-frequency search terms cannot be avoided, we recommend, in line with previous work (Gummer & Oehrlein, 2023; Raubenheimer, 2024; Rovetta, 2021; Stephens-Davidowitz & Varian, 2015), that multiple non–realtime samples should be aggregated to improve their reliability. As high-frequency search terms can also be subject to reliability issues, we also recommend aggregating several samples for these search terms. Having said this, we also would like to caution that more research on aggregation methods is warranted, since prior research has shown that not every method yields the same results (Raubenheimer, 2024) or is able to completely remedy the issue (Gummer & Oehrlein, 2023). Moreover, it remains unclear how many samples need to be aggregated to sufficiently improve their reliability or reach a saturation point at which no further improvement can be achieved. As our results indicate the existence of a reliability-frequency continuum, the number of samples required for this purpose likely varies between search terms of different frequencies. Unfortunately, a metric to determine whether search terms are of low- or high-frequency is currently lacking. In their study, Behnen et al. (2020) relied on proxy information obtained via the Google Ads service and the third party tool KWFinder to assess search term frequency. Future research is needed to create (none-black-boxed) methods to assess search term frequency, assess the reliability of existing proxy information, and compare the feasibility of different metrics. Given the reliability-frequency continuum highlighted by our study, we encourage future research to also search for thresholds at which reliability becomes problematic.
Third, since our findings illustrate a methodological challenge that can severely bias results drawn from GT data, we advocate for researchers to address the potential errors associated with GT data in their studies. This transparency would force researchers to test the quality of their data and enable readers to judge the quality of a study. In this regard, it is alarming that Mehltretter et al. (2023) found that in their systematic review of 360 studies, only four considered all the potential issues of their GT data. While our paper focused on reliability, we recommend that researchers who use GT data also assess the validity of their data critically and how this might impact their findings. To achieve this assessment, Mehltretter et al. (2023) provide practical guidelines. However, we would like to note that reporting standards for data collection processes and data quality control are lacking for GT data, and so we encourage more work on this issue.
As always, our research is not without limitations that should be addressed in future studies. First, we relied on 10 high-frequency search terms and two low-frequency search terms. We relied on these search terms as we were reasonably convinced that they would be of either high- or low-search frequency. However, as a result of this face validation approach, our search terms are likely located at the endpoints of the frequency continuum (i.e., very frequent or infrequent). The selection of search terms could have impacted our results and we would welcome replication studies. Consequently, although our list yielded clear results, we recommend that future research uses a more extensive list of search terms to test the generalizability of our findings. In our view, it would be especially important to systematically include search terms of different frequencies (e.g., 100 low-, 100 mid-, and 100 high-frequency search terms). The proposed design would require knowledge on how to reliably measure search term frequency (see above). If this challenge can be overcome, such research could help to explore how much variance in reliability is explained by frequency (along the lines of Behnen et al. (2020)) and how much by other factors. Depending on the extent of such a study, it may require automated data collection via the GT API, which could involve its own challenges such as the maximum daily queries to the API per IP address (e.g., Fang et al., 2021). For studies along those lines, we also recommend the use of an automated rule-based process to generate lists of search terms. Utilizing a list of popular search terms, as we did in our study, may be one way to obtain search terms that are known to be of high-frequency.
Second, our study was based on search terms obtained for Germany. We acknowledge the need for replication in other countries to test whether our findings generalize. We would especially welcome a cross-national comparison, since such a study would be particularly informative for assessing the differences in the reliability-frequency continuum of GT data between countries. Once again, we would recommend researchers interested in doing this kind of research to use a more extensive list of search terms.
Third, two of our indicators relied on the assumption that real-time data can serve as benchmark for non–realtime data. This assumption was based on previous studies such as Gummer and Oehrlein (2023) that reasoned that fine-granular real-time data should be more reliable. However, Behnen et al. (2020) have raised questions concerning this reasoning by showing that even hourly real-time data can suffer from reliability issues. As a result, we included a third indicator for reliability that did not rely on this assumption. We see merit in systematically testing the reliability of real-time data. Future studies could rely on overlapping intervals of real-time data and investigate whether RSVs can be replicated. This approach would require collecting multiple real-time samples for the same search terms with overlapping time frames (i.e., rolling intervals). Based on our findings, we would suggest using a variety of search terms across the whole search frequency range (low, medium, and high frequency).
Fourth, we relied on three indicators to capture different aspects of reliability. Currently, the methodological literature on GT data is lacking standards as to how the quality of these data should be assessed and which indicators to use for which purpose. For instance, Behnen et al. (2020) relied on absolute and relative standard deviations. In our study, we focused on deltas between RSV distributions and correctly classified maximums, since we were mainly interested in how specific figures of benchmark distributions (e.g., RSV of a day or maximum) could be replicated. We see merit in future research that outlines different indicators and metrics to assess various aspects of reliability or data quality in general. In our view, such research should outline for what purpose each indicator can be used and how it should be calculated to foster comparability between studies.
Fifth, while a few methodological studies on GT data collection and quality issues exist, the data generation and distribution process of GT remains a black box. How sampling Google searches for GT is done at Google and how this will affect data quality remains largely unknown. Therefore, we would like to acknowledge that due to the black box limitations regarding GT processes and operations, research on these data necessarily has to rely on assumptions that warrant further testing (e.g., the assumption of reliable real-time data). Consequently, we close with a call for more studies that try to better understand how GT should be collected and used.
Footnotes
Declaration of Conflicting Interests
The author(s) declared no potential conflicts of interest with respect to the research, authorship, and/or publication of this article.
Funding
The author(s) disclosed receipt of the following financial support for the research, authorship, and/or publication of this article: This work was funded by the German Federal Ministry of Education and Research (BMBF) as part of FReDA (grant number 01UW2001B).
Data Availability Statement
Replication data and code are available at the GESIS Data Archive for the Social Sciences: https://doi.org/10.7802/2748.