
Abstract
Online surveys are a widely used mode of data collection. However, as no interviewer is present, respondents face any difficulties they encounter alone, which may lead to measurement error and biased or (at worst) invalid conclusions. Detecting response difficulty is therefore vital. Previous research has predominantly focused on response times to detect general response difficulty. However, response difficulty may stem from different sources, such as overly complex wording or similarity between response options. So far, the question of whether indicators can discriminate between these sources has not been addressed. The goal of the present study, therefore, was to evaluate whether specific characteristics of participants’ cursor movements are related to specific properties of survey questions that increase response difficulty. In a preregistered online experiment, we manipulated the length of the question text, the complexity of the question wording, and the difficulty of the response options orthogonally between questions. We hypothesized that these changes would lead to increased response times, hovers (movement pauses), and y-flips (changes in vertical movement direction), respectively. As expected, each manipulation led to an increase in the corresponding measure, although the other dependent variables were affected as well. However, the strengths of the effects did differ as expected between the mouse-tracking indices: Hovers were more sensitive to complex wording than to question difficulty, while the opposite was true for y-flips. These results indicate that differentiating sources of response difficulty might indeed be feasible using mouse-tracking.
Introduction
The use of online surveys to obtain data for research purposes has become increasingly popular, due to the various advantages they offer compared to more traditional methods of data collection (Evans & Mathur, 2005). Such advantages include the low cost at which a comparably large amount of data can be gathered in a time-efficient manner without geographical constraints (Grandcolas et al., 2003; Granello & Wheaton, 2004; Wyatt, 2000). In addition, web surveys offer various technological features and design options as well as different question formats that can facilitate the response process, improve usability, and personalize respondents’ user experience (Couper, 2000; Evans & Mathur, 2005). Thereby, possible confusion and mistakes, which would lead to reduced data quality, can be avoided (Horwitz et al., 2019). For instance, the online setting enables the use of automated skip patterns, randomization or tailoring of questions or response options, or checking the completion of certain questions.
The global COVID-19 pandemic has significantly accelerated the shift toward online surveys, particularly evident in general social surveys (Gummer et al., 2020; Wolf et al., 2021). While this rapid growth underscores the importance of online surveys, it also necessitates a thoughtful consideration of potential challenges associated with their use. Despite their advantages, web surveys, like any data collection method, are susceptible to different sources of error which can lower data quality (Couper, 2000). One of these sources is measurement error arising when participants answer a survey. For instance, respondents may not understand the question as intended by the researcher, or they may experience difficulty when selecting a suitable response to specific questions (Couper, 2000; Lenzner, 2012). However, unlike in telephone surveys or face-to-face-interviews, no interviewer is present to offer help and clarification when conducting self-administered surveys online.
Therefore, to avoid the occurrence of such errors and guarantee high-quality data, researchers need to detect specific questions or wordings that are challenging for respondents (Fowler, 1992; Holbrook et al., 2006; Lee et al., 2012; Lenzner, 2014; Lenzner et al., 2011). This could occur prior to data collection based on results of a pretest, allowing researchers to adjust items and improve usability for future participants. It could also happen during data collection by offering guidance to participants whenever they experience difficulty, or post-hoc by labeling specific questions or answers as potentially problematic. For these purposes, paradata are often used, which are context and process information that are collected as a by-product of the survey mode itself (Kreuter, 2013; Mayerl et al., 2019; McClain et al., 2019). A recent addition to the family of paradata types is the tracking of mouse cursor movements which are assumed to reflect the cognitive processes underlying participants’ responses in the survey (Horwitz et al., 2017). Other indicators of response difficulties in web surveys are more expensive and might not even be available for the standard online survey participant (e.g., eye tracking) or sensitive to multiple sources of distortion (e.g., response times). Hence, tracking mouse movements in online surveys may be a valuable tool for detecting different sources of measurement error.
Despite its potential, only a small number of studies have already linked certain mouse movement patterns to overall response difficulty (Fernández-Fontelo et al., 2023; Horwitz et al., 2017, 2019) and none has tried to differentiate between different sources of difficulty so far. If, however, it was possible to distinguish between different causes of response difficulty using mouse-tracking, this would help researchers identify issues more quickly and improve the survey more thoroughly, or even provide assistance to respondents who exhibit such signs of difficulty in real-time. In the present study, our goal is to take a step in that direction. Specifically, we investigated how manipulating different question properties that are linked to different aspects of measurement error affects different mouse-tracking indices.
Sources of Measurement Error in Online Surveys
Measurement error is defined as the “deviation of the answers of respondents from their true values on the measurement” (Couper, 2000, p. 475) and is one of the main sources of survey error as stated in the total survey error framework (Groves, 1987; Groves & Lyberg, 2010). This deviation is assumed to emerge for various reasons, including attributes of the questionnaire, such as the question wording, order, or structure (cf. Groves, 1987; Lee et al., 2012). This assumption is consistent with findings indicating that questions which are complex or difficult to answer increase measurement error, for instance, due to missing, less reliable, biased, or neutral responses (Fowler, 1992; Graesser et al., 2006; Holbrook et al., 2006; Lenzner, 2012).
Measurement error can result in either increased error variance or biased estimates, depending on whether the questions are unsystematically or systematically misinterpreted by participants, respectively (Lee et al., 2012; Lenzner, 2014). Both outcomes are undesirable in research and therefore need to be avoided (Lenzner, 2014; Lenzner et al., 2011). Consequently, questions that are difficult to answer adequately, as well as words or phrases within these questions which might be challenging for respondents to comprehend, need to be detected and improved in order to gather accurate and valid data (Graesser et al., 2006). However, an indiscriminate measure of difficulty does not point survey designers to the root of the issue. Therefore, it would be particularly useful to be able to discriminate between different sources of response difficulties to understand where exactly improvements are required. If valid measures for different error sources could be identified, researchers could use them to identify and improve the specific features of questions that respondents experience difficulty with or do not comprehend as intended (e.g., during pretesting). In addition, it could enable researchers to identify respondents who struggle to respond to certain questions in order to provide help to those respondents in real-time, or to identify problematic datasets after data collection (Horwitz et al., 2019).
Therefore, the aim of the present study is to examine whether specific paradata measures are sensitive to a particular error source in online surveys. To achieve this, we used an experimental design to induce different sources of response difficulty in an online survey and examine whether (and to which degree) these differentially affect the different paradata measures.
Assessing Measurement Error in Online Surveys with Paradata
Among all kinds of paradata, response times are frequently used to assess whether respondents face difficulties or comprehension problems during the survey, with longer response times indicating higher levels of difficulty (Conrad et al., 2007; McClain et al., 2019). While cost-effective and easy to collect, response times do not identify the specific cause of the difficulty, for example, whether respondents struggled to understand the question text or to choose a suitable response (Graesser et al., 2006; Lenzner et al., 2011). Also, Yan and Tourangeau (2008) pointed out that baseline response times can vary between questions and participants, indicating that longer response times do not necessarily point to higher levels of difficulty. For instance, longer question texts or fully labeled rating scales may prolong response times without affecting accuracy (Lenzner et al., 2011; Yan & Tourangeau, 2008). Longer response times can also emerge due to an external source such as distractions or multi-tasking, rather than the question itself (Heerwegh, 2009; Horwitz et al., 2017). Notably, even challenging questions may not consistently result in longer response times, as the existence of problematic text features in a question does not necessarily correlate with mean reading time per word (Graesser et al., 2006).
Another type of paradata that is easily accessible in web surveys are break-offs. Break-off analyses can provide insight into problematic question or questionnaire design characteristics (Peytchev, 2009). However, similar to response times, they lack specificity in pinpointing the exact problems within a given question and they may also vary depending on person characteristics. In addition, break-offs may also result from cumulative burden over the course of a questionnaire rather than the characteristics of a given question (Emery et al., 2023; Galesic, 2006; Peytchev, 2009).
In contrast to response times and break-off analyses, eye-tracking enables researchers to identify specific sources of difficulties that respondents might experience, while ensuring their active involvement in the questionnaire. Hereby, the specific part of the question or response options that is likely to produce confusion can be detected by retracing participants’ gaze and thus the (overt) focus of their attention. As a result, eye-tracking offers much greater precision when detecting response difficulties (Lenzner et al., 2011). To date, however, eye-tracking is difficult to use outside a laboratory setting and is associated with high costs and substantial effort, compared to the efficient and automated collection of other paradata sources (Neuert & Lenzner, 2019).
Mouse-tracking—tracing respondents’ cursor movements—may combine the advantages of response times with those of eye-tracking. Mouse-tracking builds on the assumption that motor processes are continuously updated by the underlying cognitive processes rather than strictly an aftereffect of the already-completed decision and thus reflect the temporal evolution of the decision-making process (Cisek & Kalaska, 2010; Freeman, 2018; Freeman et al., 2011; Spivey & Dale, 2006). Therefore, mouse-tracking might offer valuable information about the specific sources of response difficulties, comparable to eye-tracking, while being more easily applicable in online settings and associated with almost no additional cost (Horwitz et al., 2017). Furthermore, in contrast to response times, mouse-tracking indices (when calculated solely based on movements on the questionnaire page) are considerably less susceptible to multi-tasking or distraction since mouse movements only occur if the respondent is actively involved in the questionnaire (Horwitz et al., 2017).
Despite the promising advantages over other methods, only few studies have tried to link certain mouse movement patterns to sources of measurement error in online surveys. Horwitz et al. (2017) manually coded several types of movements observed in a laboratory study and found that three of these movement patterns predicted the question difficulty as assessed via participants’ self-report. Those movements were hovers (holding the mouse over the question text for more than 2 seconds), markers (holding the mouse over a response option text or a radio button for more than 2 seconds), and regressive movements (moving the mouse back and forth between two areas of interest, specifically, between question text, white space, next button, and response options). Based on these findings, Horwitz et al. (2017) concluded that mouse movement patterns are indeed a valid measure of overall response difficulty, especially when combined with response times. However, as the authors were concerned with the overall perceived difficulty, they did not differentiate between various sources of difficulty.
Horwitz et al. (2019) collected mouse-tracking indices in a web survey, on a large scale and in a field setting. Their goal was to determine if suboptimally constructed items can be detected through mouse movement patterns. Therefore, the authors experimentally manipulated question features, for example, changing one question concerning employment to be either straightforward or complex (i.e., longer response option texts including superfluous and long-winded technical information). As expected by the researchers, respondents hovered more frequently in the complex condition. In addition, they traveled a greater distance with the cursor and engaged in a greater number of y-flips, which are changes in the direction of cursor movement along the vertical axis (i.e., a shift from upward to downward movement or vice versa), and are interpretable analogous to regressive movements in the context of the study. However, the manipulation of complexity in this study induced various sources of difficulty at the same time—increased question length with a more complex sentence structure and more technical phrases. Therefore, it is not possible to single out the effects of these different question properties and if they might influence different mouse-tracking indices.
Building upon Fernández-Fontelo et al. (2023); Horwitz et al. (2019) employed a machine learning approach on the same dataset to investigate the extent to which it is possible to predict respondent burden (i.e., whether a respondent answered the straightforward or complex version of a question), utilizing multiple mouse-tracking indices concurrently. The study shows that the machine-learning approach benefits from using mouse-tracking measures in addition to response times, thus again demonstrating the linkage between respondent burden and mouse-tracking indices. However, as the analysis was based on the data from Horwitz et al. (2019), it shares the same limitation: As each study manipulation varied several sources of question difficulty simultaneously, the relationship between distinct question properties and specific mouse-tracking indices cannot be inferred precisely. In the most extreme case, it cannot even be ruled out that only one specific question property had an effect on mouse-tracking indices while the others had no effect. If so, researchers utilizing mouse-tracking to detect respondent burden may overlook other sources of difficulty if they exist as the sole feature in a question.
Mapping Question Properties on Mouse-Tracking Indices
The goal of the present study is to enable such a distinction by testing whether mouse-tracking indices can detect and differentiate sources of measurement error within an online survey. Following Holbrook et al. (2006), understanding a question, and mapping the answer to an adequate response are two distinct steps in responding to questions. Therefore, we systematically varied question properties likely to cause participants to experience difficulty in these two distinct processes: First, complex wording (which we will refer to as complexity) can lead to measurement error if respondents do not understand the question as intended by the researcher (Holbrook et al., 2006; Horwitz et al., 2019). Second, response options that are more similar to one another (which we will refer to as difficulty) can make a question more difficult to answer accurately and, as a result, lead to measurement error (Krosnick, 1991; Lenzner, 2012). Our goal was to introduce these two issues in a questionnaire and investigate if they affect different mouse-tracking indices, which could then function as valid measures of these properties in turn.
Beyond direct sources of response difficulty, another factor that varies greatly between questions in online surveys is the length of the question text. Question length might be an important confound to consider—particularly when interpreting response times—simply because reading longer questions takes more time. This would pose a challenge for using response time as an indicator of response difficulty. In the extreme case, response times would not be able to distinguish between questions that are long but easy and understandable, and questions that are short but difficult or complex. In this case, mouse movement indicators might provide a viable alternative, particularly if they are less affected by the question length. Therefore, we also manipulated the length of the question, assuming that a longer question text should lead to longer response times irrespective of its difficulty or complexity. To ensure that the topic of a question was not confounded with the manipulation, which has been a limitation in previous research (Horwitz et al., 2019), we implemented a full factorial design. Specifically, we independently manipulated these three properties by constructing different versions of each substantive question, including all combinations of understandable versus complex question wording, easy versus difficult distractor options, and short versus long question text (see Methods section for detailed examples). Every item a participant encountered was subject to one of these combinations, and, across the entire questionnaire, all participants encountered every possible variation once.
Hypotheses
In the following, we will develop hypotheses as to which manipulation should affect which mouse-tracking index based on the previous literature.
Hovers are assumed to occur when respondents encounter complex terms, resulting in an interruption of the current movement in order to process the meaning of the relevant phrase or word before continuing (Horwitz et al., 2017, 2019). For instance, Horwitz et al. (2017) assume that hovering would be more likely when terms are technical or unfamiliar compared to more familiar ones. Findings in eye-tracking research support these assumptions. For instance, Lenzner et al. (2011) and Graesser et al. (2006) found text fixation periods to be associated with text features that made the questions more complex. Since a close relationship was found between gaze and cursor position when comparing eye and mouse movements (Chen et al., 2001; Huang et al., 2011), it seems reasonable to assume that complex text features will also lead to cursor fixation periods. Therefore, we expect that complex questions lead to a greater number of hovers than more understandable questions (H1).
If a question is difficult, respondents struggle to map their individual response to the options available (Holbrook et al., 2006). Not knowing which response option suits the personal value or the task instruction best should result in mouse movements indicating the conflict between different options along the axis of decision (Dale et al., 2008). In the classical laboratory mouse-tracking setting, two response options are presented in the upper corners of the screen. In these settings, the x-axis is the axis of decision, hence, x-flips are believed to reflect the indecisiveness between options (Dale et al., 2008; O'Hora et al., 2016). In the online survey mode that is investigated in the current study, response options are typically presented in a multiple-choice item format, resulting in options that are distributed along the y-rather than the x-axis of the screen. In this setup, mouse movements indicating difficulties in deciding between different options are likely to result in a change of movement direction along the vertical axis of the screen. Hence, these mouse movements are assumed to be reflected in the number of y-flips. Therefore, we expect that difficult questions lead to a greater number of y-flips than easy questions (H2).
Lastly, besides complexity and difficulty as relevant question properties, the question length will also be manipulated. Hereby, the aim is to demonstrate that questions that consist of considerably longer question text will not impact mouse-tracking indices if this question text is easy to read and does not increase complexity. However, response times should still be affected by such a manipulation as reading longer question texts is more time consuming than reading shorter question texts. Consequently, we expect that longer question texts lead to longer response times than shorter question texts (H3).
It cannot be ruled out that the different manipulations affect the other specified indices as well. If so, we assume that for each mouse-tracking index the question property specified in the corresponding hypothesis has the strongest effect.
Methods
The hypotheses, design, and analysis plan of the present study were preregistered via the Open Science Framework prior to data collection (https://osf.io/r5392).
Design
We collected all data in an online survey consisting of eight questions of interest. For each question, we created eight variants corresponding to all possible combinations of the manipulated factors: complexity (understandable, complex), difficulty (easy, difficult), and length (short, long). Each participant received one version of each of these questions, and each of these combinations of features once throughout the survey. All questions were presented with four short response options, each of which contained between one and three words. For every question, there was only one correct response and participants could only choose one response option. After answering each question, participants had to click on a “Next”-button in the bottom center of the screen to be presented with the next question. The screen layout including the position of the response options and the “Next” button was held constant across all questions. The question-manipulation assignment, question order, and the position of the correct response option among the four response alternatives were counterbalanced, with every possible combination occurring once in every set of 256 participants. During the survey, the mouse-cursor position on the x- and y-axis of the screen, as well as the associated time stamp was recorded whenever the mouse moved (on average every 16 ms during continuous mouse movements) using the mousetrap-web package (Henninger & Kieslich, in press).
For each question, we computed the three relevant indices specified in the hypotheses (y-flips, hovers, and response time). The number of hovers was computed by counting how often a participant stopped moving the mouse for longer than 500 ms (without counting the time participants took to start moving the mouse at the beginning of each new question). The number of y-flips was calculated as the number of movement reversals along the y-axis. The response time was computed by calculating the time from the first presentation of the question on the computer screen to the submission of the chosen response option via click on the “Next” button.
Materials
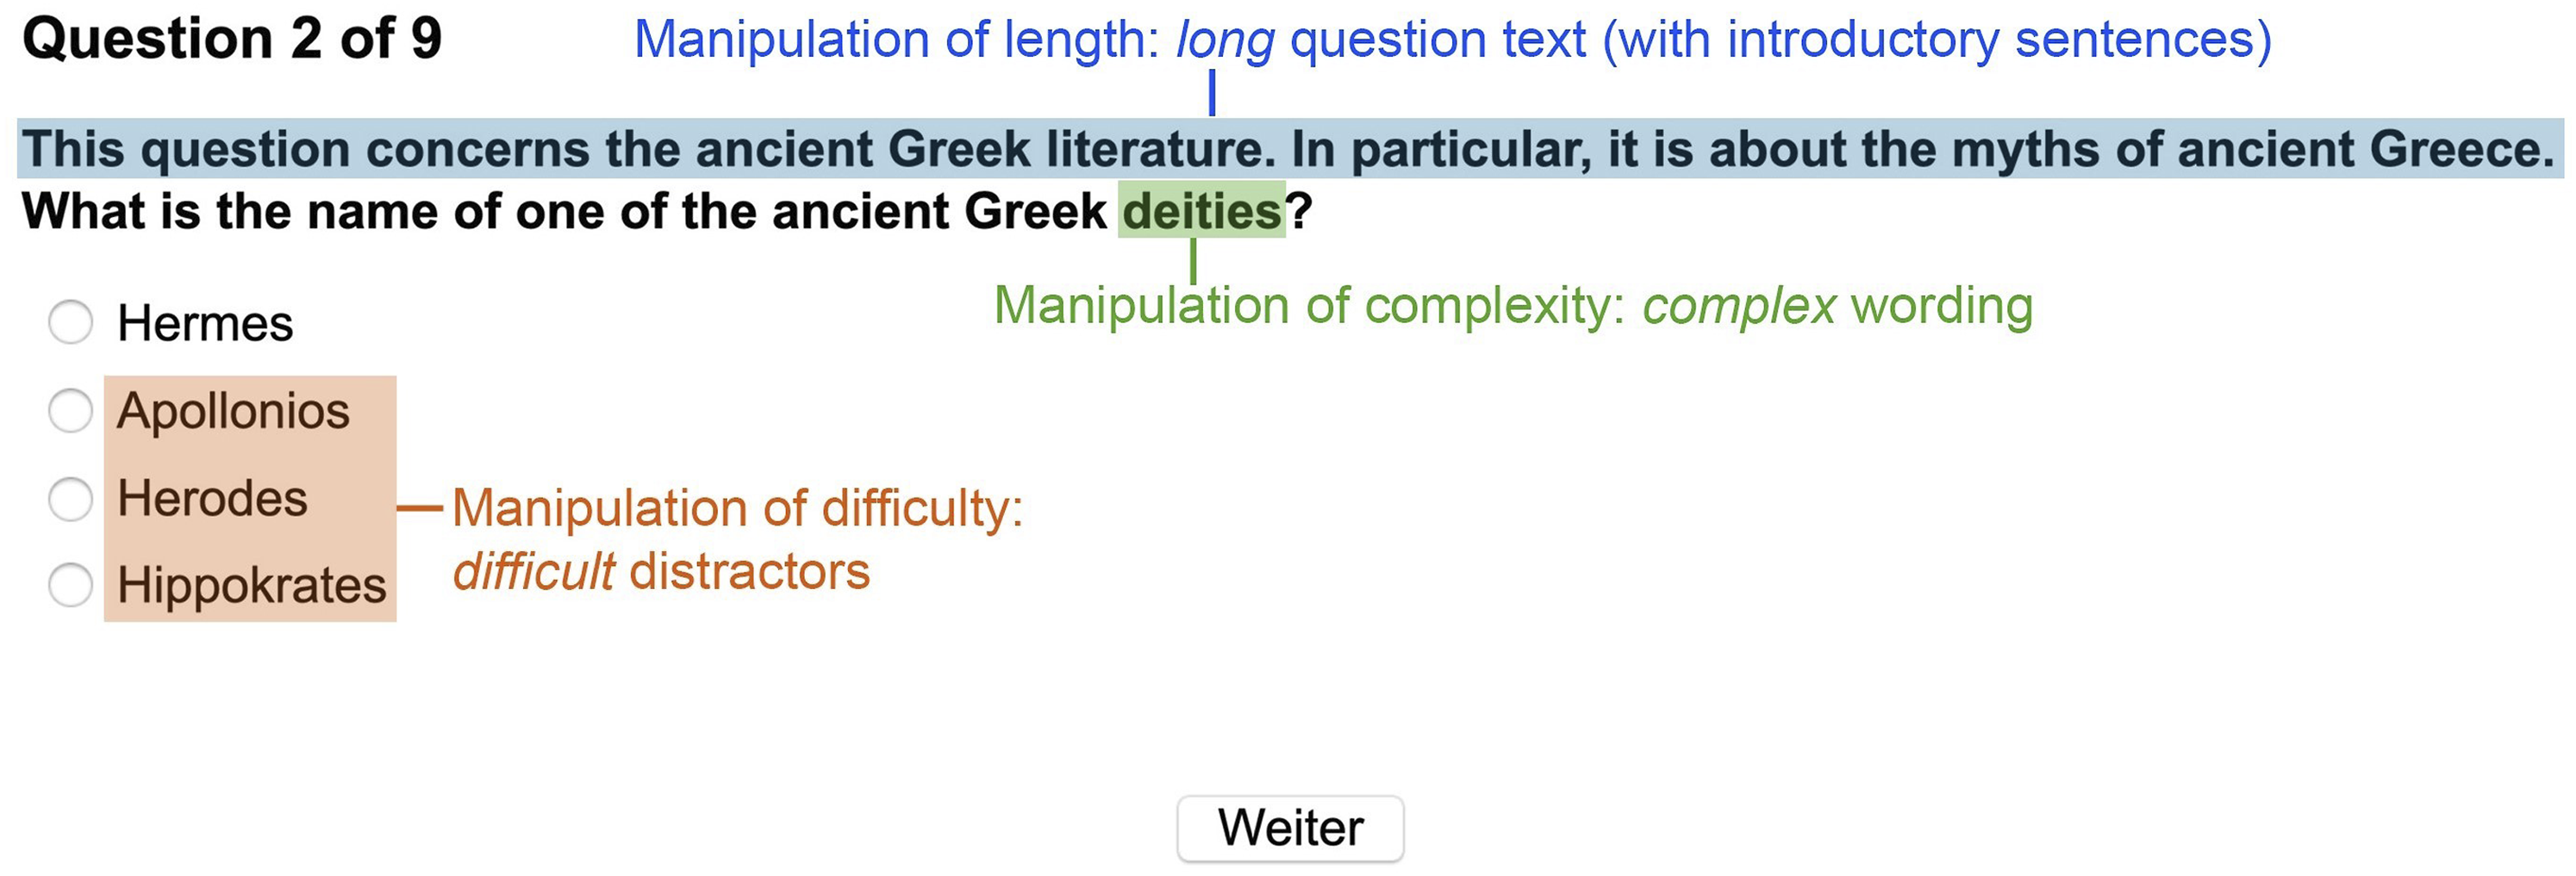
All questions and their variations as well as the preprocessed data and the analysis script are provided at the Open Science Framework and can be accessed online via https://osf.io/8xwt3/. In terms of content, all questions concerned general knowledge from different fields like geography, religion, biology, and history. The questions were designed such that the correct response would likely not be directly available even for well-educated participants but could most probably be retrieved by examining all options. The eight questions of interest were manipulated to be understandable or complex (complexity), easy or difficult (difficulty), and short or long (length). How the manipulations were implemented is specified in the following sections. Figure 1 illustrates one version of a question in the easy, understandable, and short condition, while Figure 2 presents the difficult, complex, and long version of the same question. Example of a question in the easy, understandable, and short condition. Note. The original German question as presented in the questionnaire was translated for illustrative purposes. The position of the question within the questionnaire (hence, the number of the question as mentioned above the question text), as well as the position of the correct response option “Hermes,” were randomized between participants. Example of a question in the difficult, complex, and long condition. Note. The difficulty was manipulated by using distractors which were more appealing when compared to the response options in Figure 1. The complexity was manipulated by replacing the word “gods” (as in Figure 1) with the less frequent word “deities.” The length of the question was manipulated by prepending the first two sentences to the question text.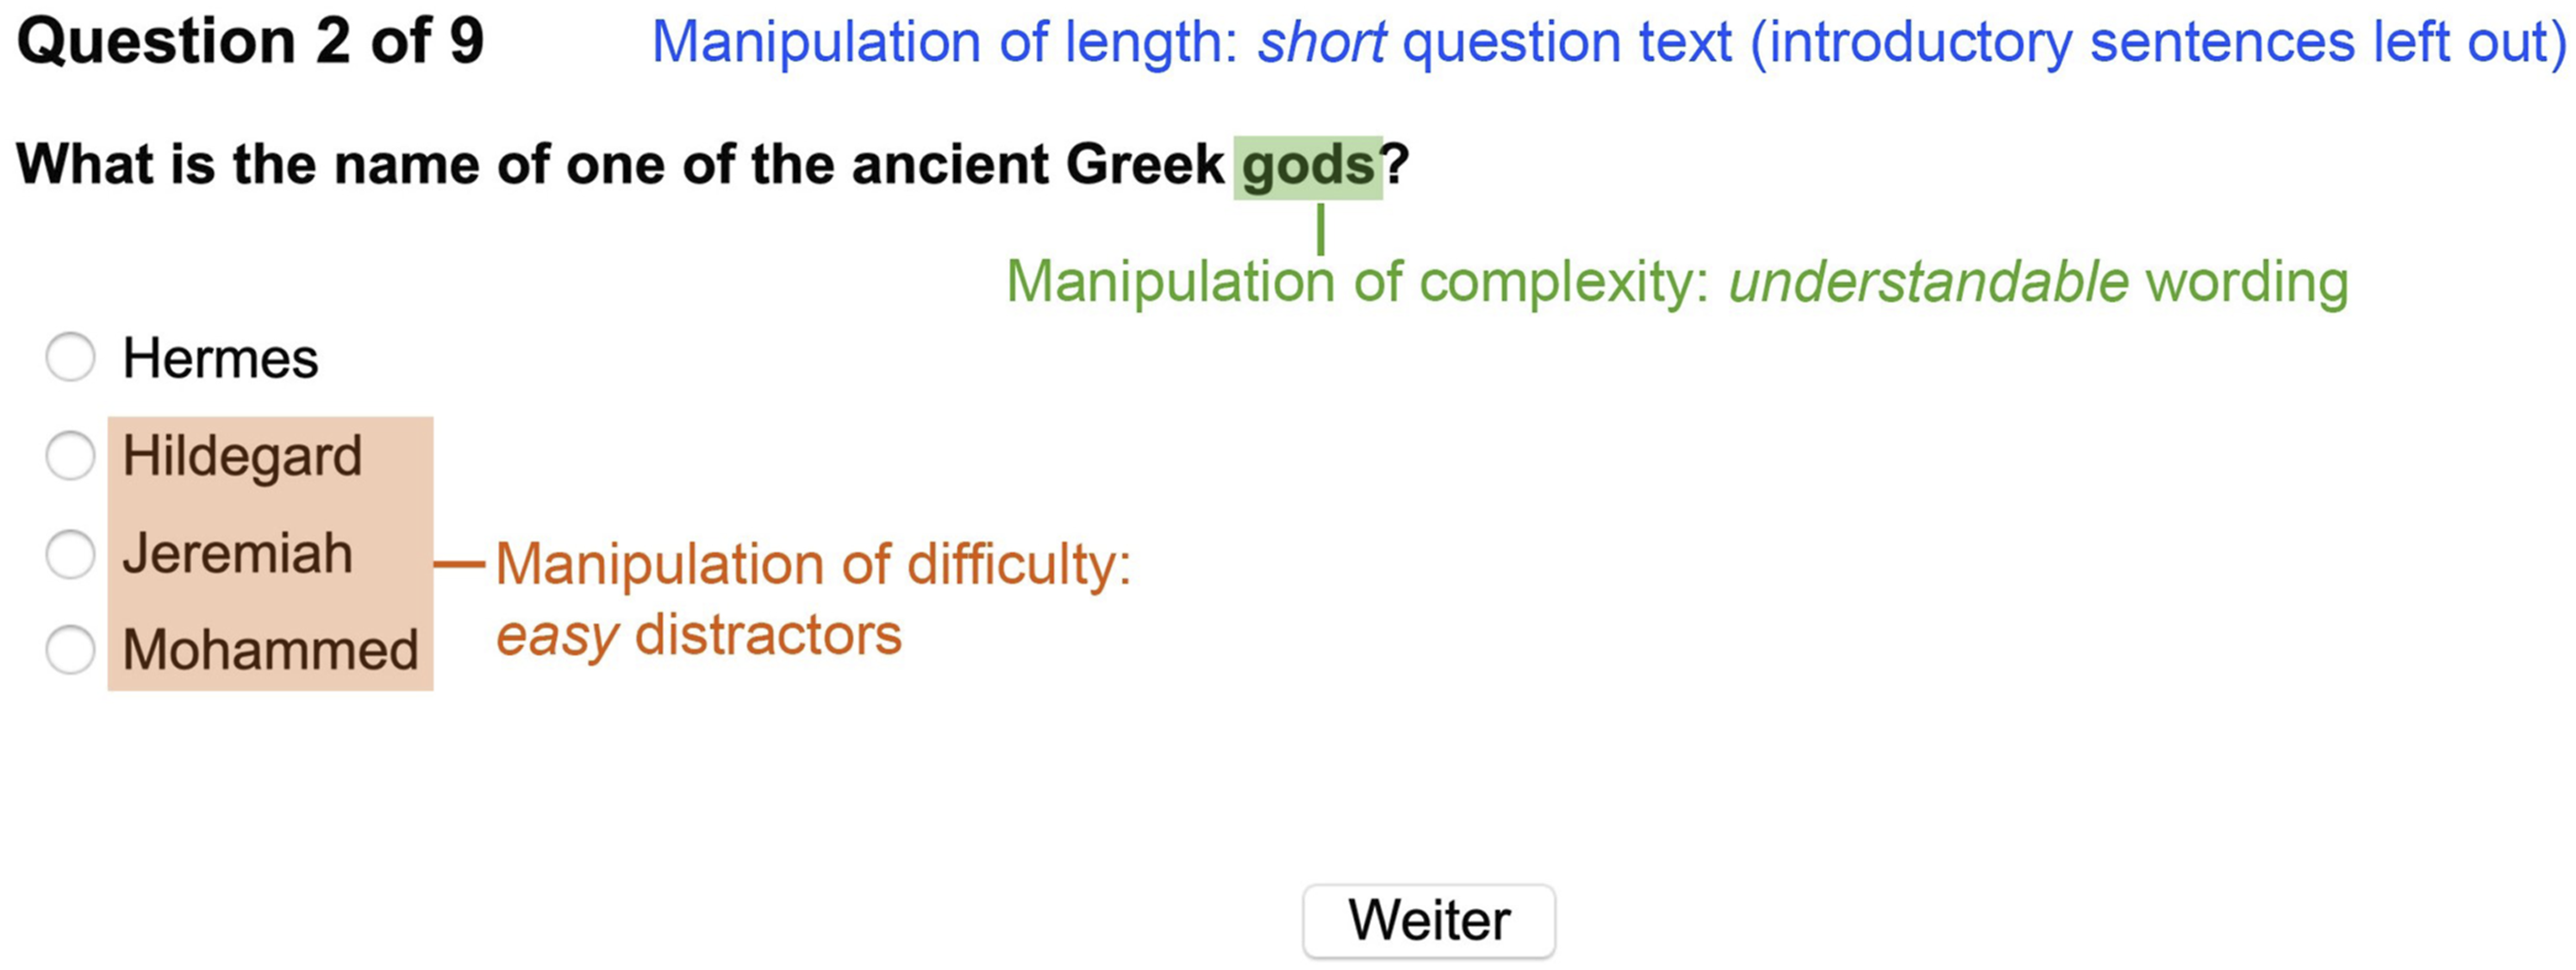
Complexity
Of the text features that Lenzner et al. (2010) found to undermine reading comprehension and, thus, to be associated with respondent burden and lower data quality, uncommon words are one of the most frequently investigated ones. For example, low-frequency words are associated with longer fixation times in eye-tracking studies due to comprehension difficulties (Graesser et al., 2006; Inhoff & Rayner, 1986; Lenzner, 2012). Therefore, in the present study, we manipulated complexity by replacing understandable (high-frequency) words or phrases in the question text with more complex (low-frequency) words or phrases. We chose this subtle manipulation in order to introduce a source of complexity likely to go undetected by researchers during question construction. In case an effect of the manipulation on accuracy (and thus measurement error) and mouse tracking indices (for detection) can be shown, this would thus underline the practical importance of our study. To rule out the possibility that effects of length confound the effects of complexity, we ensured that the length (as measured by the number of characters, excluding spaces) of the question texts within the complex and understandable conditions did not differ by more than three characters for each question.
Difficulty
The difficulty was manipulated by varying the distractor response options. Distractor response options in the difficult condition were more relevant to the content of the question and more closely related to the correct option, whereas the distractor response options in the easy condition were less content-related. Hence, the difficult distractor response options were more appealing and harder to distinguish from the correct option. We again ensured that the overall length of all response options in sum did not differ by more than three characters between the easy and the difficult conditions for each question. To prove that the manipulation of the difficulty of the questions was successful, we test below whether the number of correct responses differed significantly between the easy and difficult condition. We expected that this manipulation check will confirm that the difficult distractor condition leads on average to more incorrect responses than the easy condition.
Length
The length of the question texts was manipulated by prepending related but uninformative sentences to the questions. These were constructed such that neither the purpose of the question nor the correct answer to the question were revealed, so as not to influence the difficulty or complexity of the questions through the added text.
Procedure
The study was created using the survey software SoSci Survey (Leiner, 2019). It was conducted online as well as in the laboratory in order to facilitate the collection of a sufficiently large participant sample. Participants were told that the questionnaire was a short test of their general knowledge and were asked to only fill out the survey on a desktop computer or laptop using a computer mouse for technical reasons. After participants confirmed that they met the technical requirements, they were presented with the consent form and the instructions. In the latter, they were also informed that they would receive feedback about their performance after the completion of the survey. The survey started with a constant introductory question that was designed to be easy and understandable to accustom the respondents to the question format, followed by the eight manipulated questions of interest. After responding to all nine questions, participants answered demographic items. Additionally, they indicated which kind of device they used to move the cursor, which hand they used to control this device both during this survey and usually, and if they used external aids to answer the questions. At the end of the survey, participants had the opportunity to receive feedback on their performance on the test and information about the true purpose of the study.
Participants
The sample size rationale was specified within the preregistration and is described in the supplemental material. The laboratory study was conducted in 2019 for two weeks at the University of Mannheim and the online study for three weeks, starting at the same time. All participants who took part during that period were admitted. In return for their participation, respondents were able to take part in a raffle with two Amazon vouchers of 20€ each and psychology students of the University of Mannheim could additionally receive partial course credit.
The survey was completed by 439 participants (191 participated in the laboratory and 248 online). Several exclusion criteria were preregistered and applied, resulting in a total of 147 excluded participants. From the data of the remaining 292 participants, 34 individual trials were excluded based on additional preregistered criteria, which resulted in a total number of 2305 trials (after the trials from the introductory question were excluded as well). A detailed overview of all exclusion criteria and the corresponding number of excluded participants and individual trials is provided in the supplemental materials.
Of the N = 292 participants included in the final sample, n = 179 (61.3%) participants were female and n = 113 (38.7%) were male. The average age was 25.2 years (SD = 10.0, range = [18; 79]). Of the total sample, 231 respondents (79.1%) were students, and 119 of these (51.5%) indicated that they studied psychology or behavioral science. On average, participants in the final sample attained 7.13 correct responses for the eight questions of interest (SD = 0.97, range = [5.00; 8.00]) and took 3.42 minutes to answer the survey (SD = 1.19, range = [2.00; 13.76]).
Results
Summary of Descriptive Values and Correlations Between the Dependent Variables.
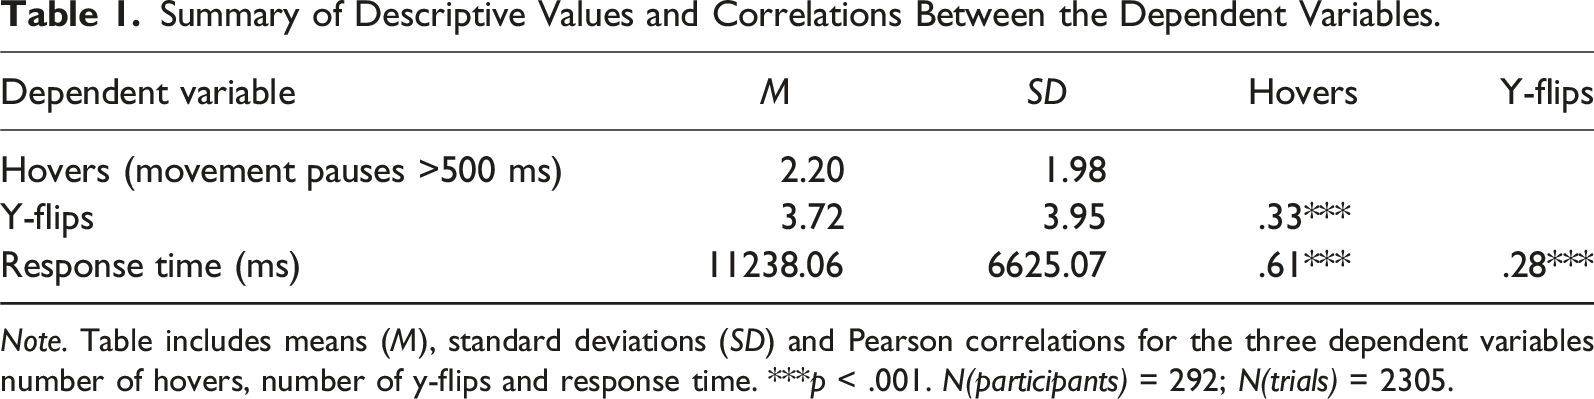
Note. Table includes means (M), standard deviations (SD) and Pearson correlations for the three dependent variables number of hovers, number of y-flips and response time. ***p < .001. N(participants) = 292; N(trials) = 2305.
Mean Values on the Dependent Variables and Sample Size in the Experimental Conditions.
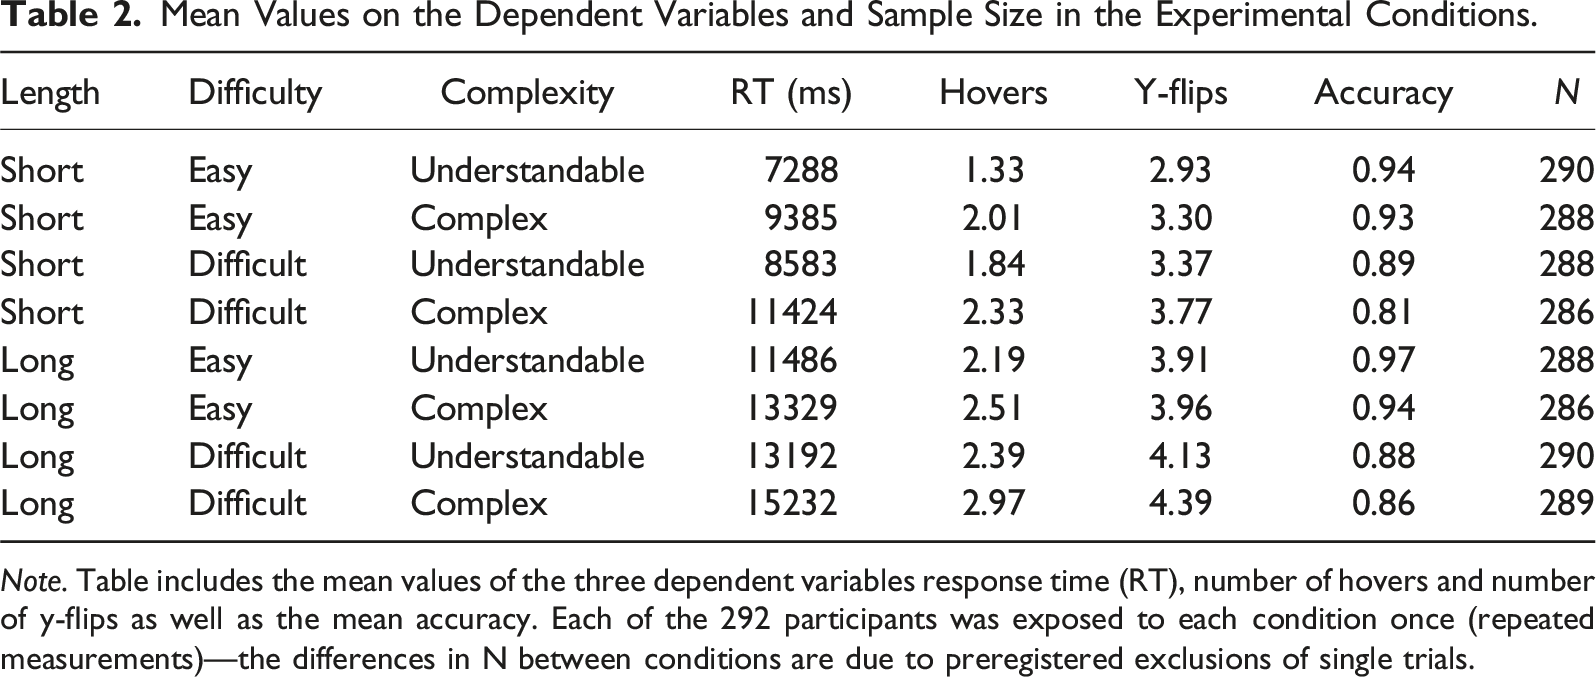
Note. Table includes the mean values of the three dependent variables response time (RT), number of hovers and number of y-flips as well as the mean accuracy. Each of the 292 participants was exposed to each condition once (repeated measurements)—the differences in N between conditions are due to preregistered exclusions of single trials.
Manipulation Check
Results of a Generalized Linear Mixed Model With a Logit Link Function Predicting the Probability of Correctly Answering a Question With the Manipulated Question Properties and Their Interactions as Predictors.
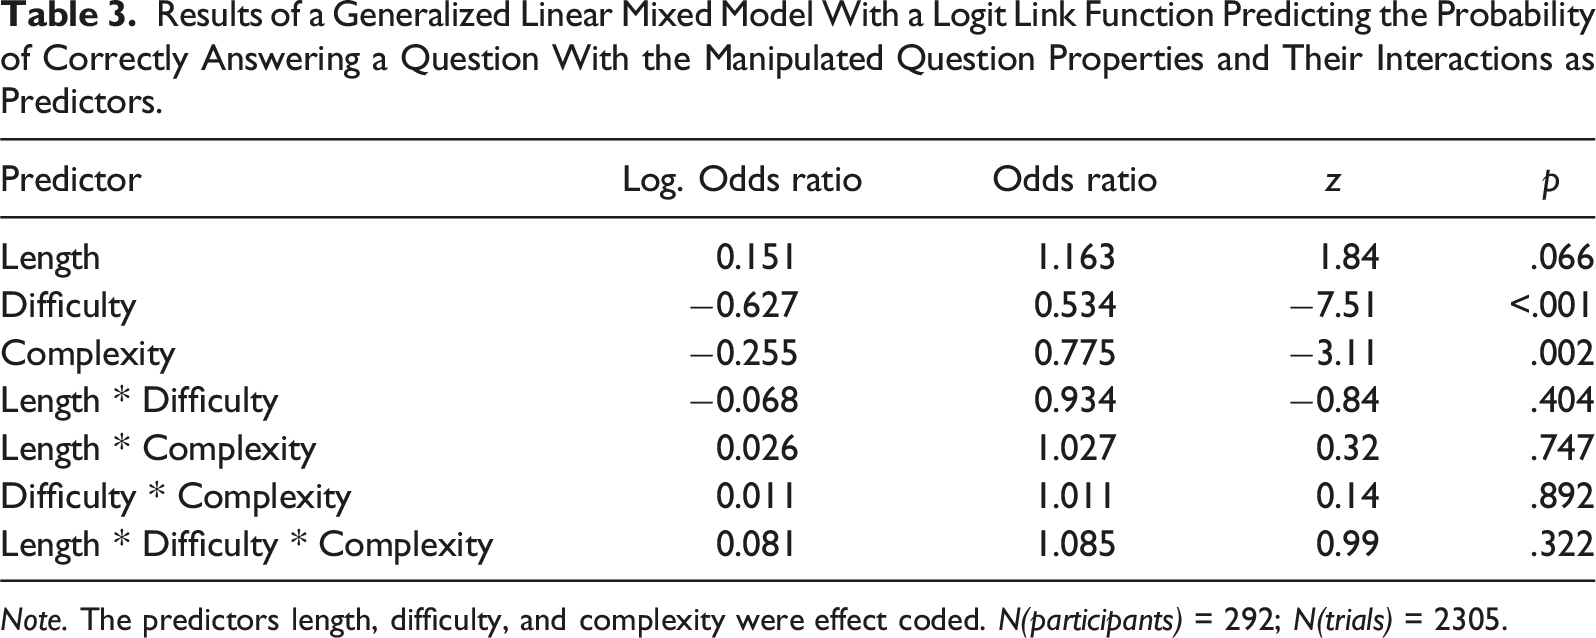
Note. The predictors length, difficulty, and complexity were effect coded. N(participants) = 292; N(trials) = 2305.
Main Analysis
To test our hypotheses, we calculated three linear mixed models, one for each dependent variable (hovers, y-flips, response time). As preregistered, we analyzed all trials regardless of the veracity of the given responses 2 . We included the effect coded manipulations and their interactions as fixed effects as well as the position of the correct answer and the position of the question within the questionnaire (to control for potential order effects). The variation between questions and the variation between participants were included as crossed random intercepts.
Hovers
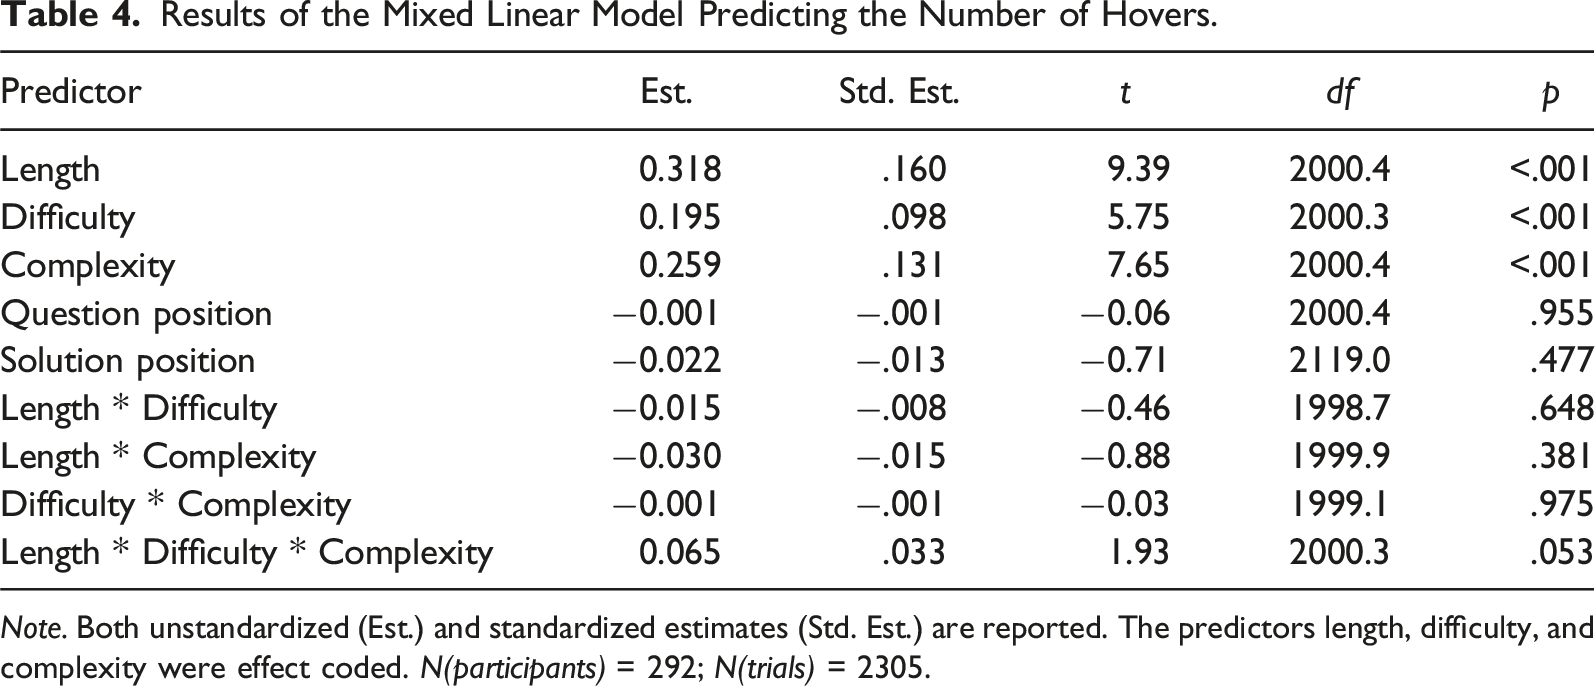
Our first hypothesis posited that complex wording would lead to a greater number of hovers than more understandable question wording. The model-based means of all conditions are shown in Figure 3. A significant main effect of complexity confirmed our prediction, t(2000.4) = 7.65, p < .001, with more complex questions leading to a greater number of hovers. However, as can be seen in Table 4, longer and more difficult questions also led to a significantly greater number of hovers. None of the interactions or control variables were significant
3
. Given that all manipulations had a significant effect on the number of hovers, we compared their standardized estimates to determine which manipulation had the strongest effect. As expected, the standardized estimate of complexity (.131) was stronger than that of difficulty (.098). Contrary to our assumptions, however, question length had the strongest standardized effect on the number of hovers (.160). Mean numbers of hovers for all conditions resulting from the factor level combinations of the manipulated question properties. Note. The means represent the estimated marginal means of the linear mixed model reported in the main text. Error bars indicate the 95% CIs. Results of the Mixed Linear Model Predicting the Number of Hovers. Note. Both unstandardized (Est.) and standardized estimates (Std. Est.) are reported. The predictors length, difficulty, and complexity were effect coded. N(participants) = 292; N(trials) = 2305.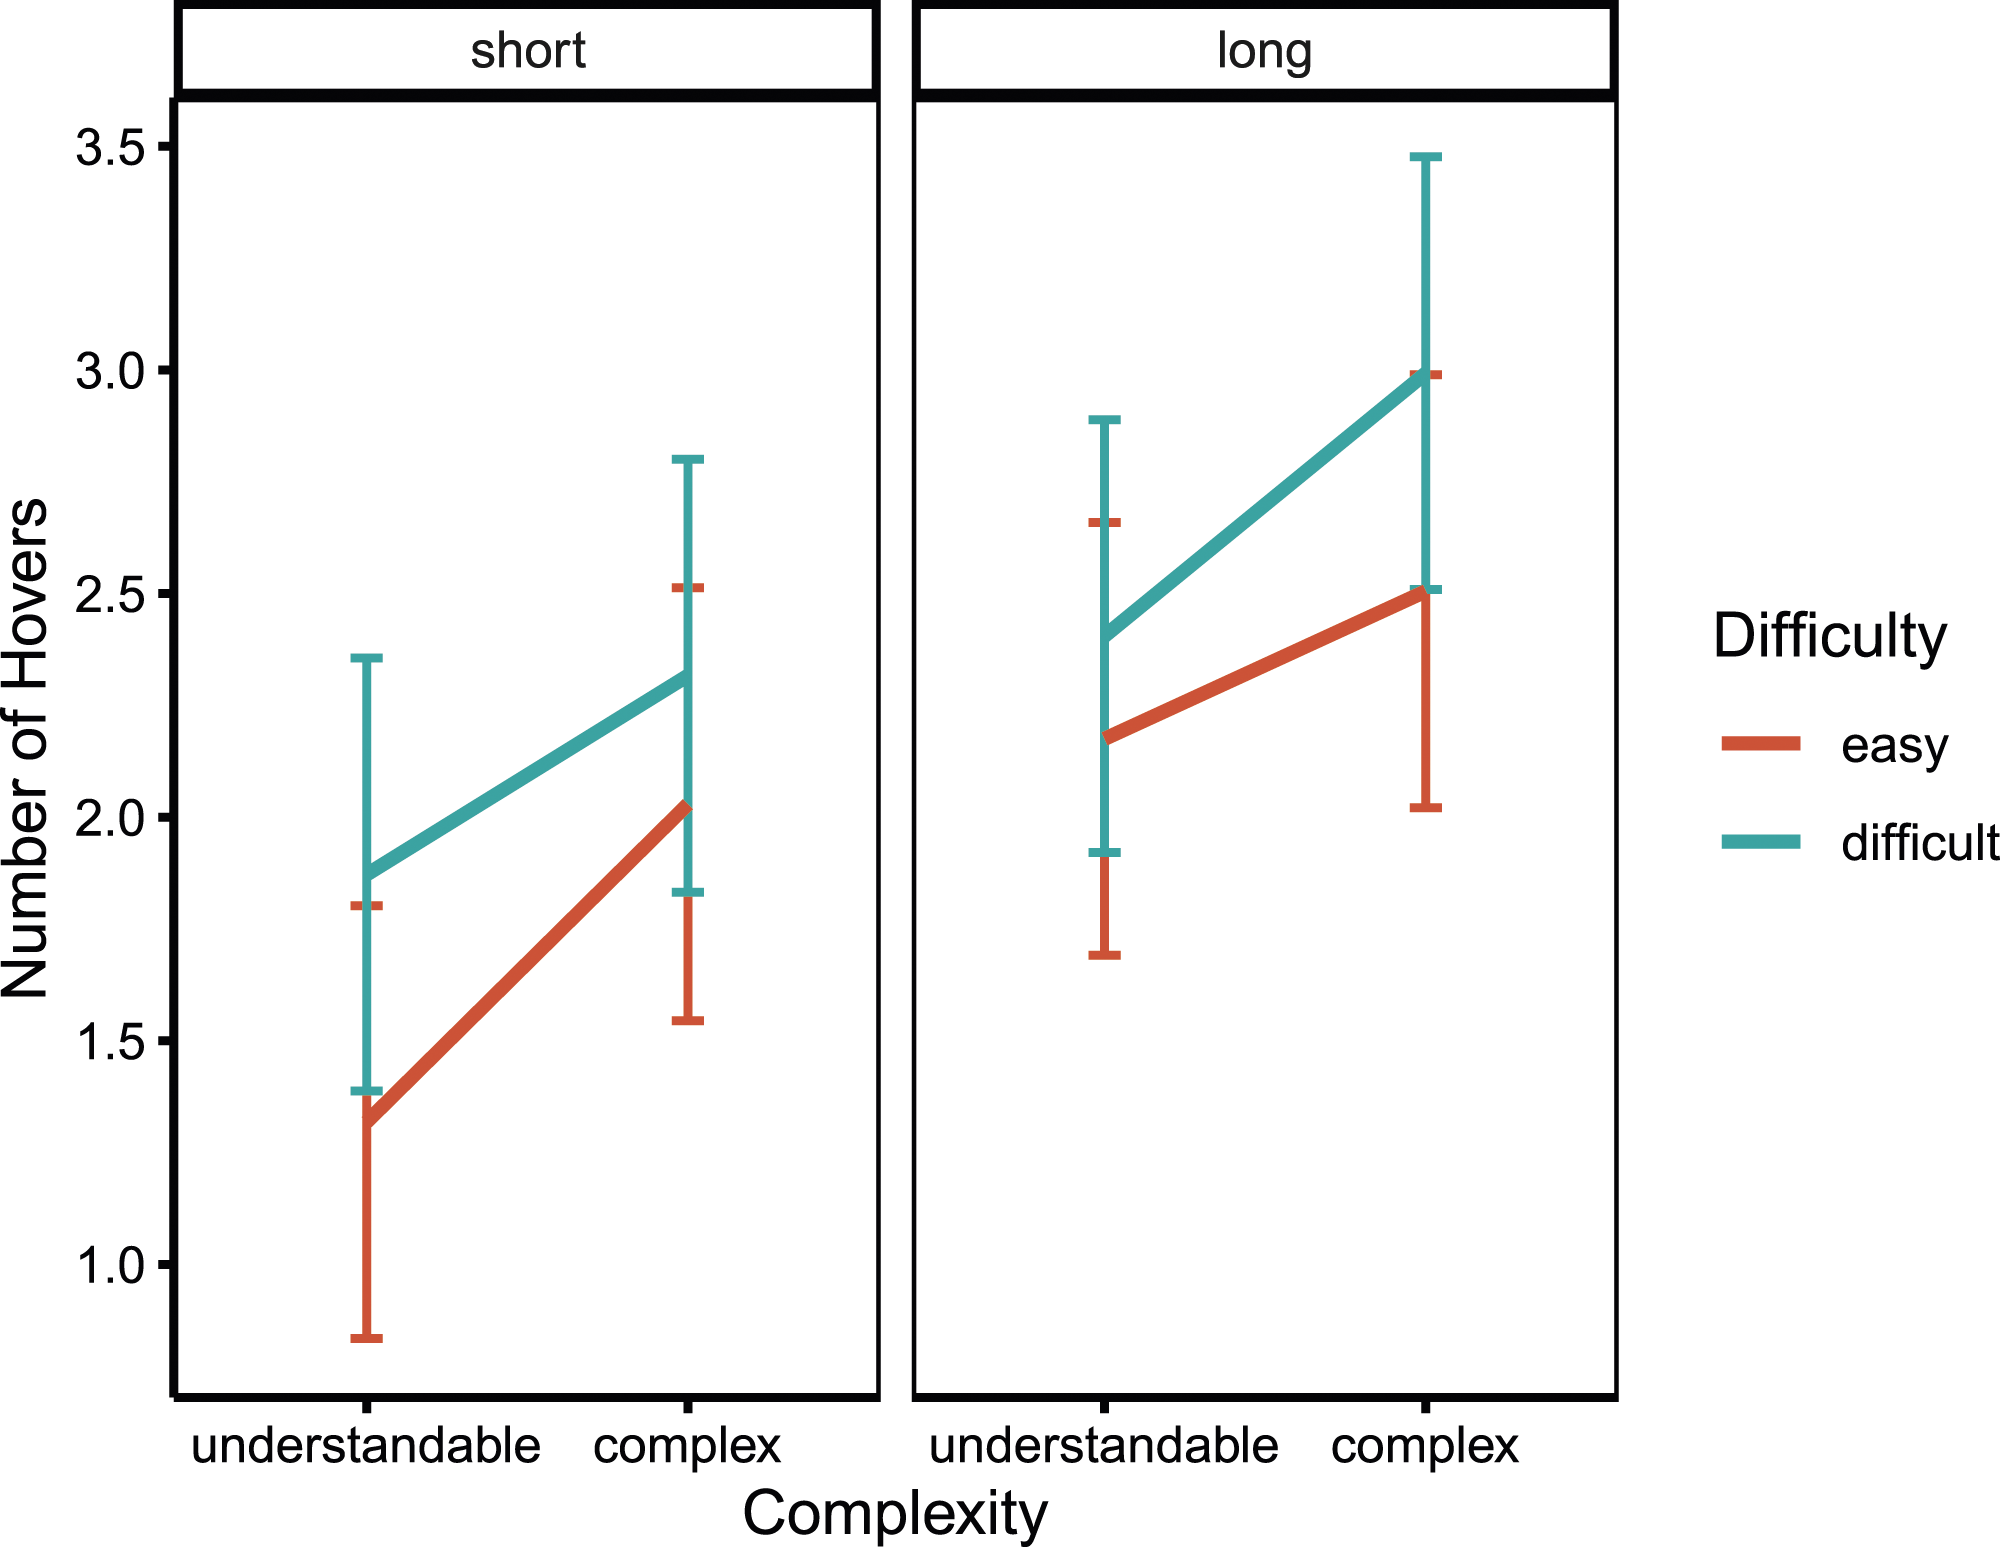
Y-flips
Results of the Mixed Linear Model Predicting the Number of y-Flips.
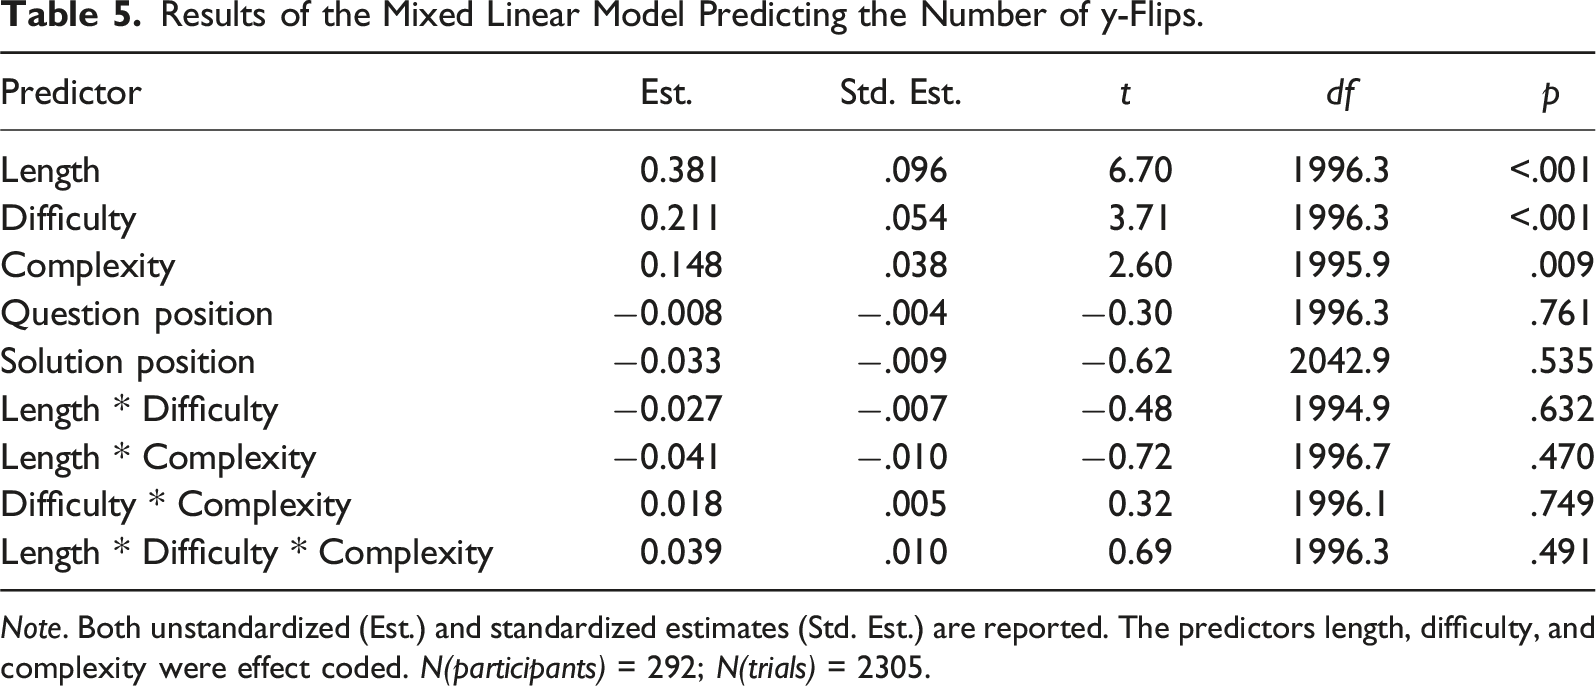
Note. Both unstandardized (Est.) and standardized estimates (Std. Est.) are reported. The predictors length, difficulty, and complexity were effect coded. N(participants) = 292; N(trials) = 2305.
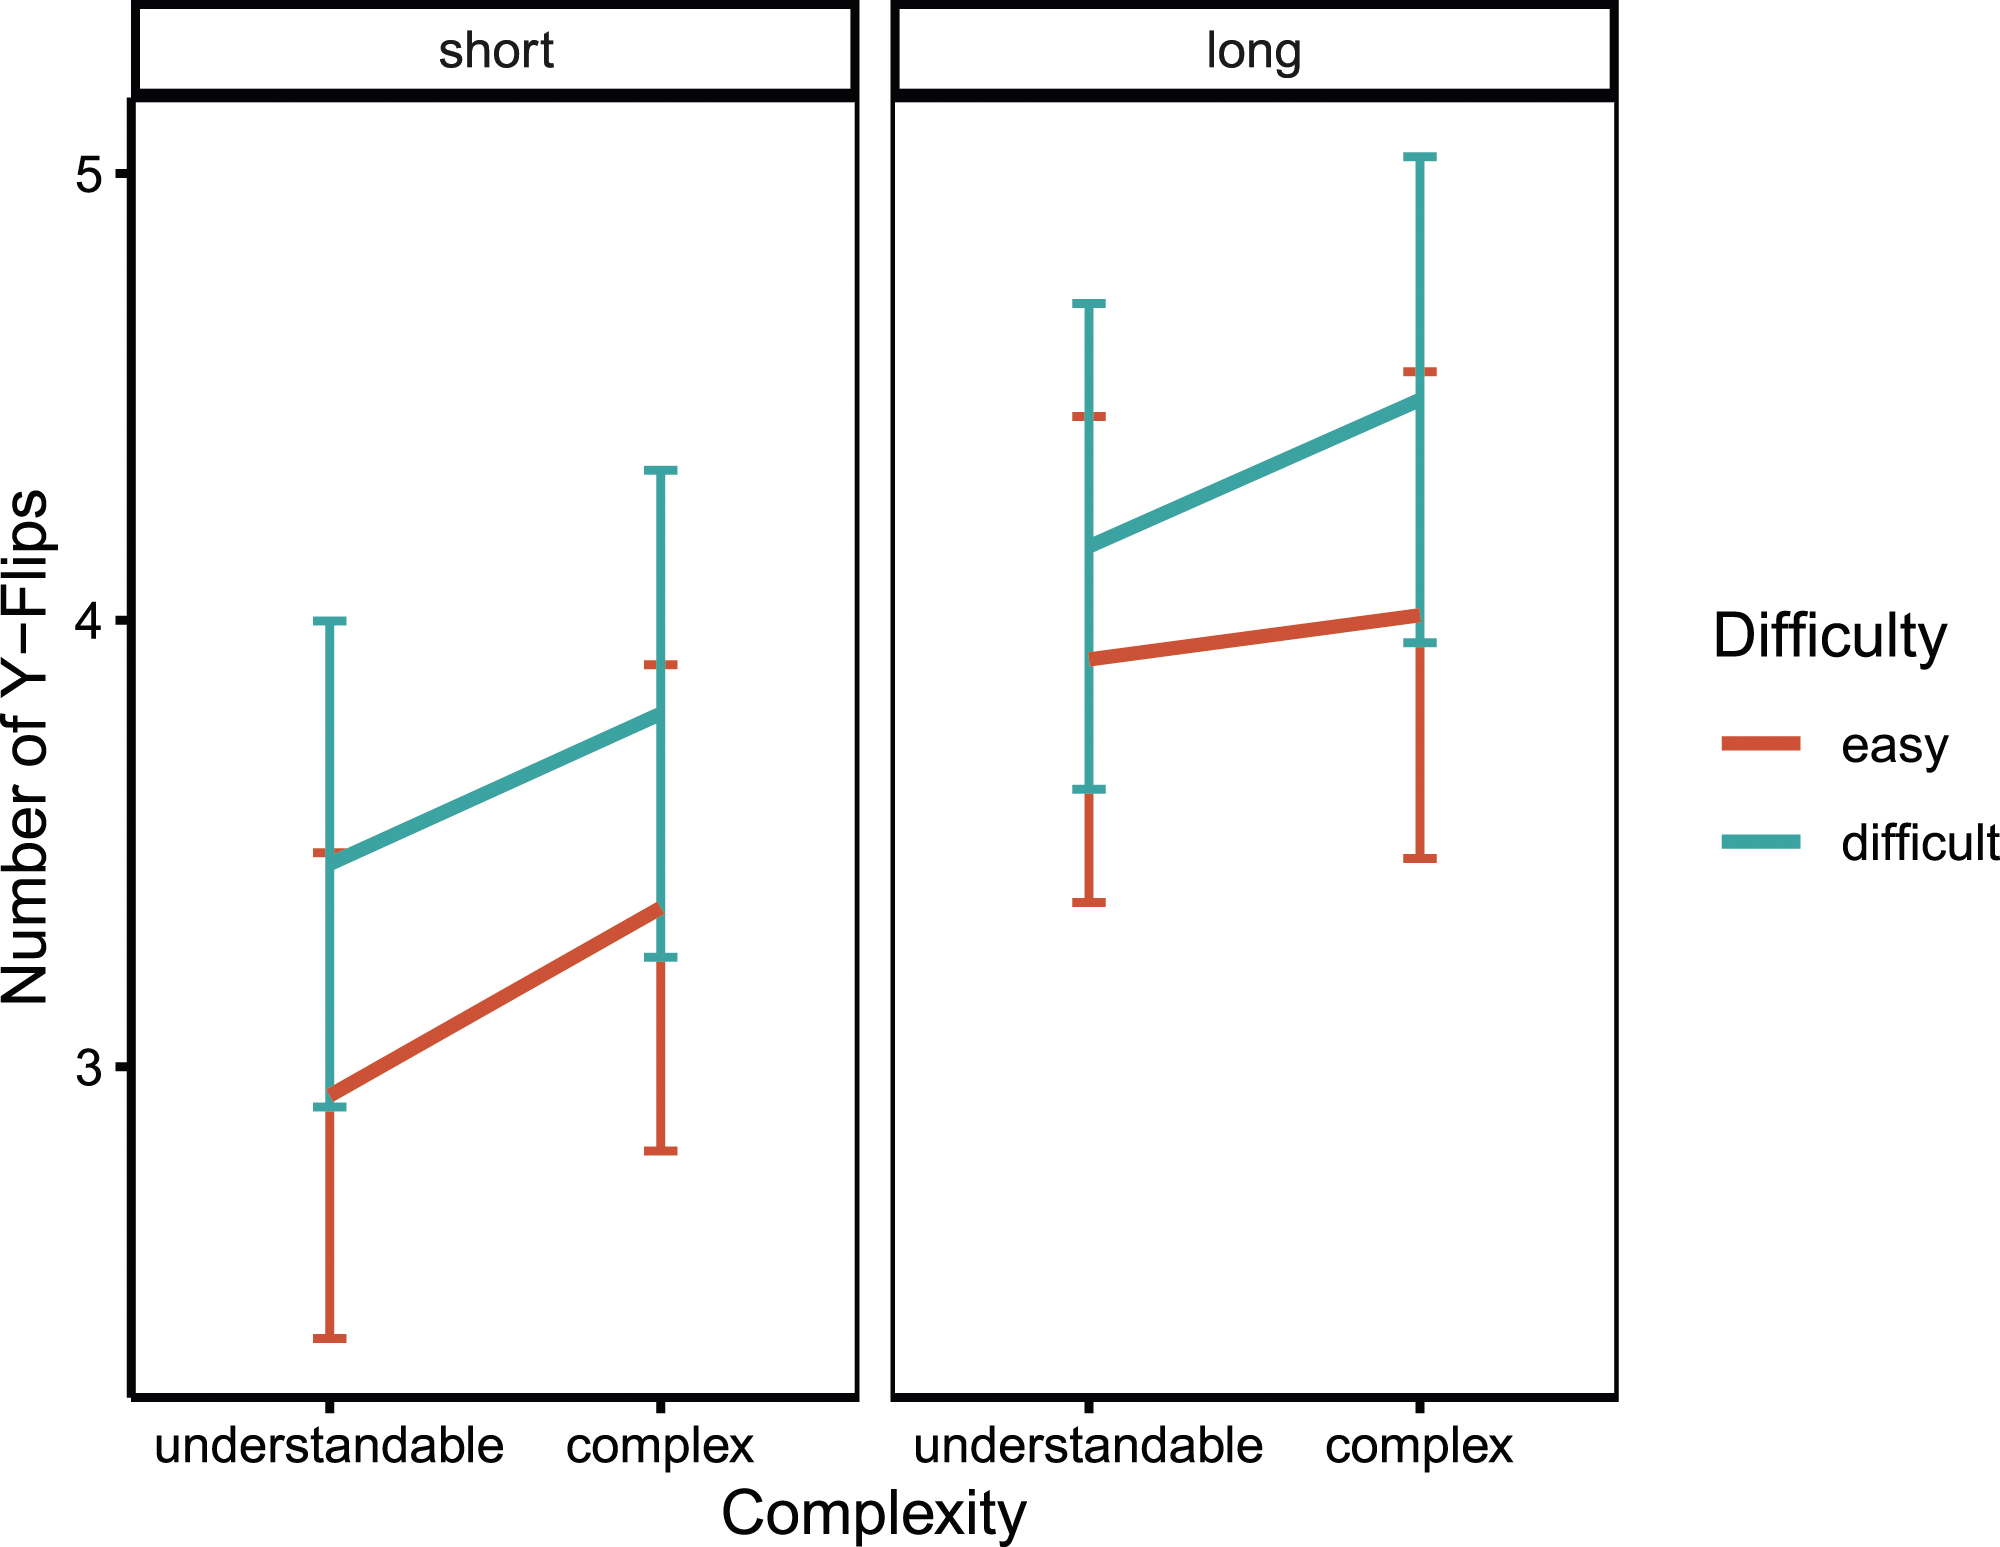
Mean numbers of y-flips for all conditions resulting from the factor level combinations of the manipulated question properties. Note. The means represent the estimated marginal means of the linear mixed model reported in the main text. Error bars indicate the 95% CIs.
Response Time
Results of the Mixed Linear Model Predicting Response Times.
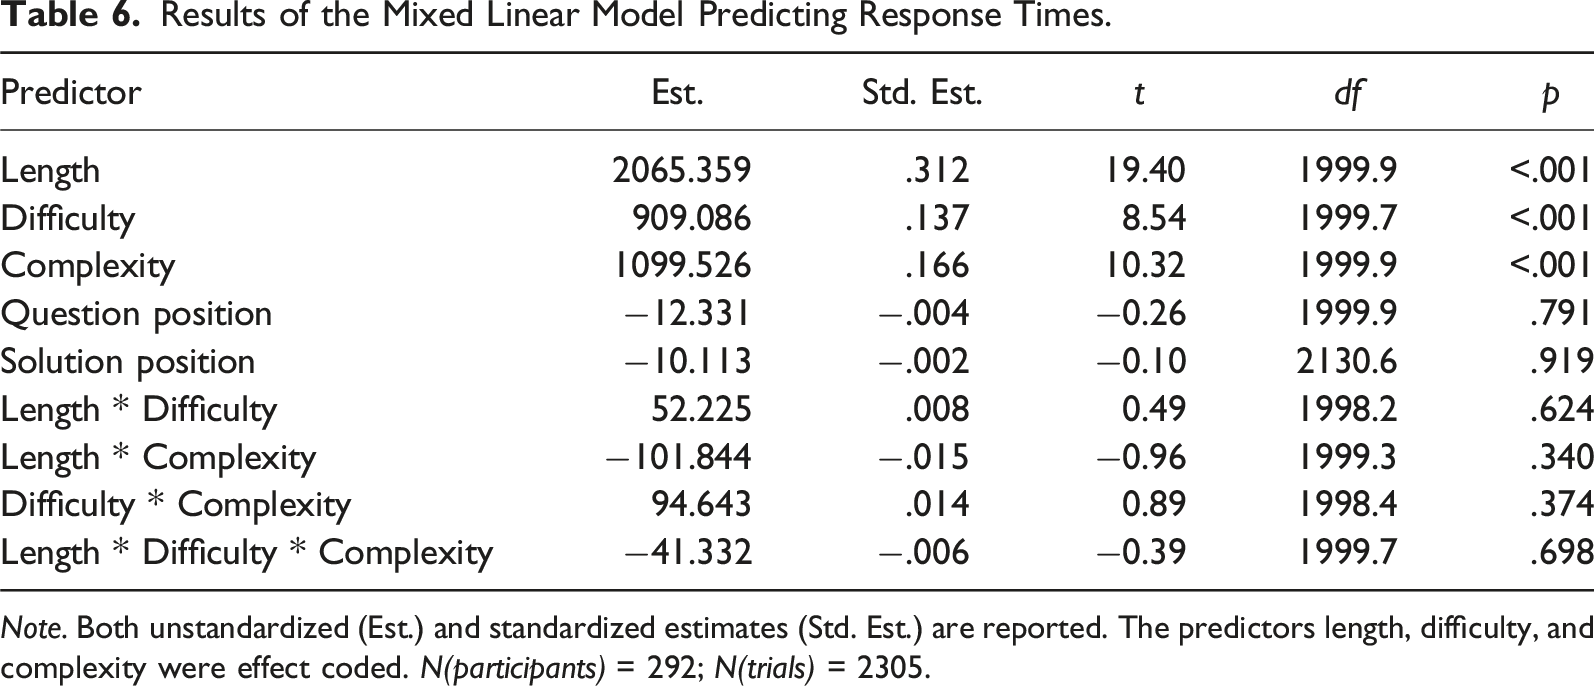
Note. Both unstandardized (Est.) and standardized estimates (Std. Est.) are reported. The predictors length, difficulty, and complexity were effect coded. N(participants) = 292; N(trials) = 2305.
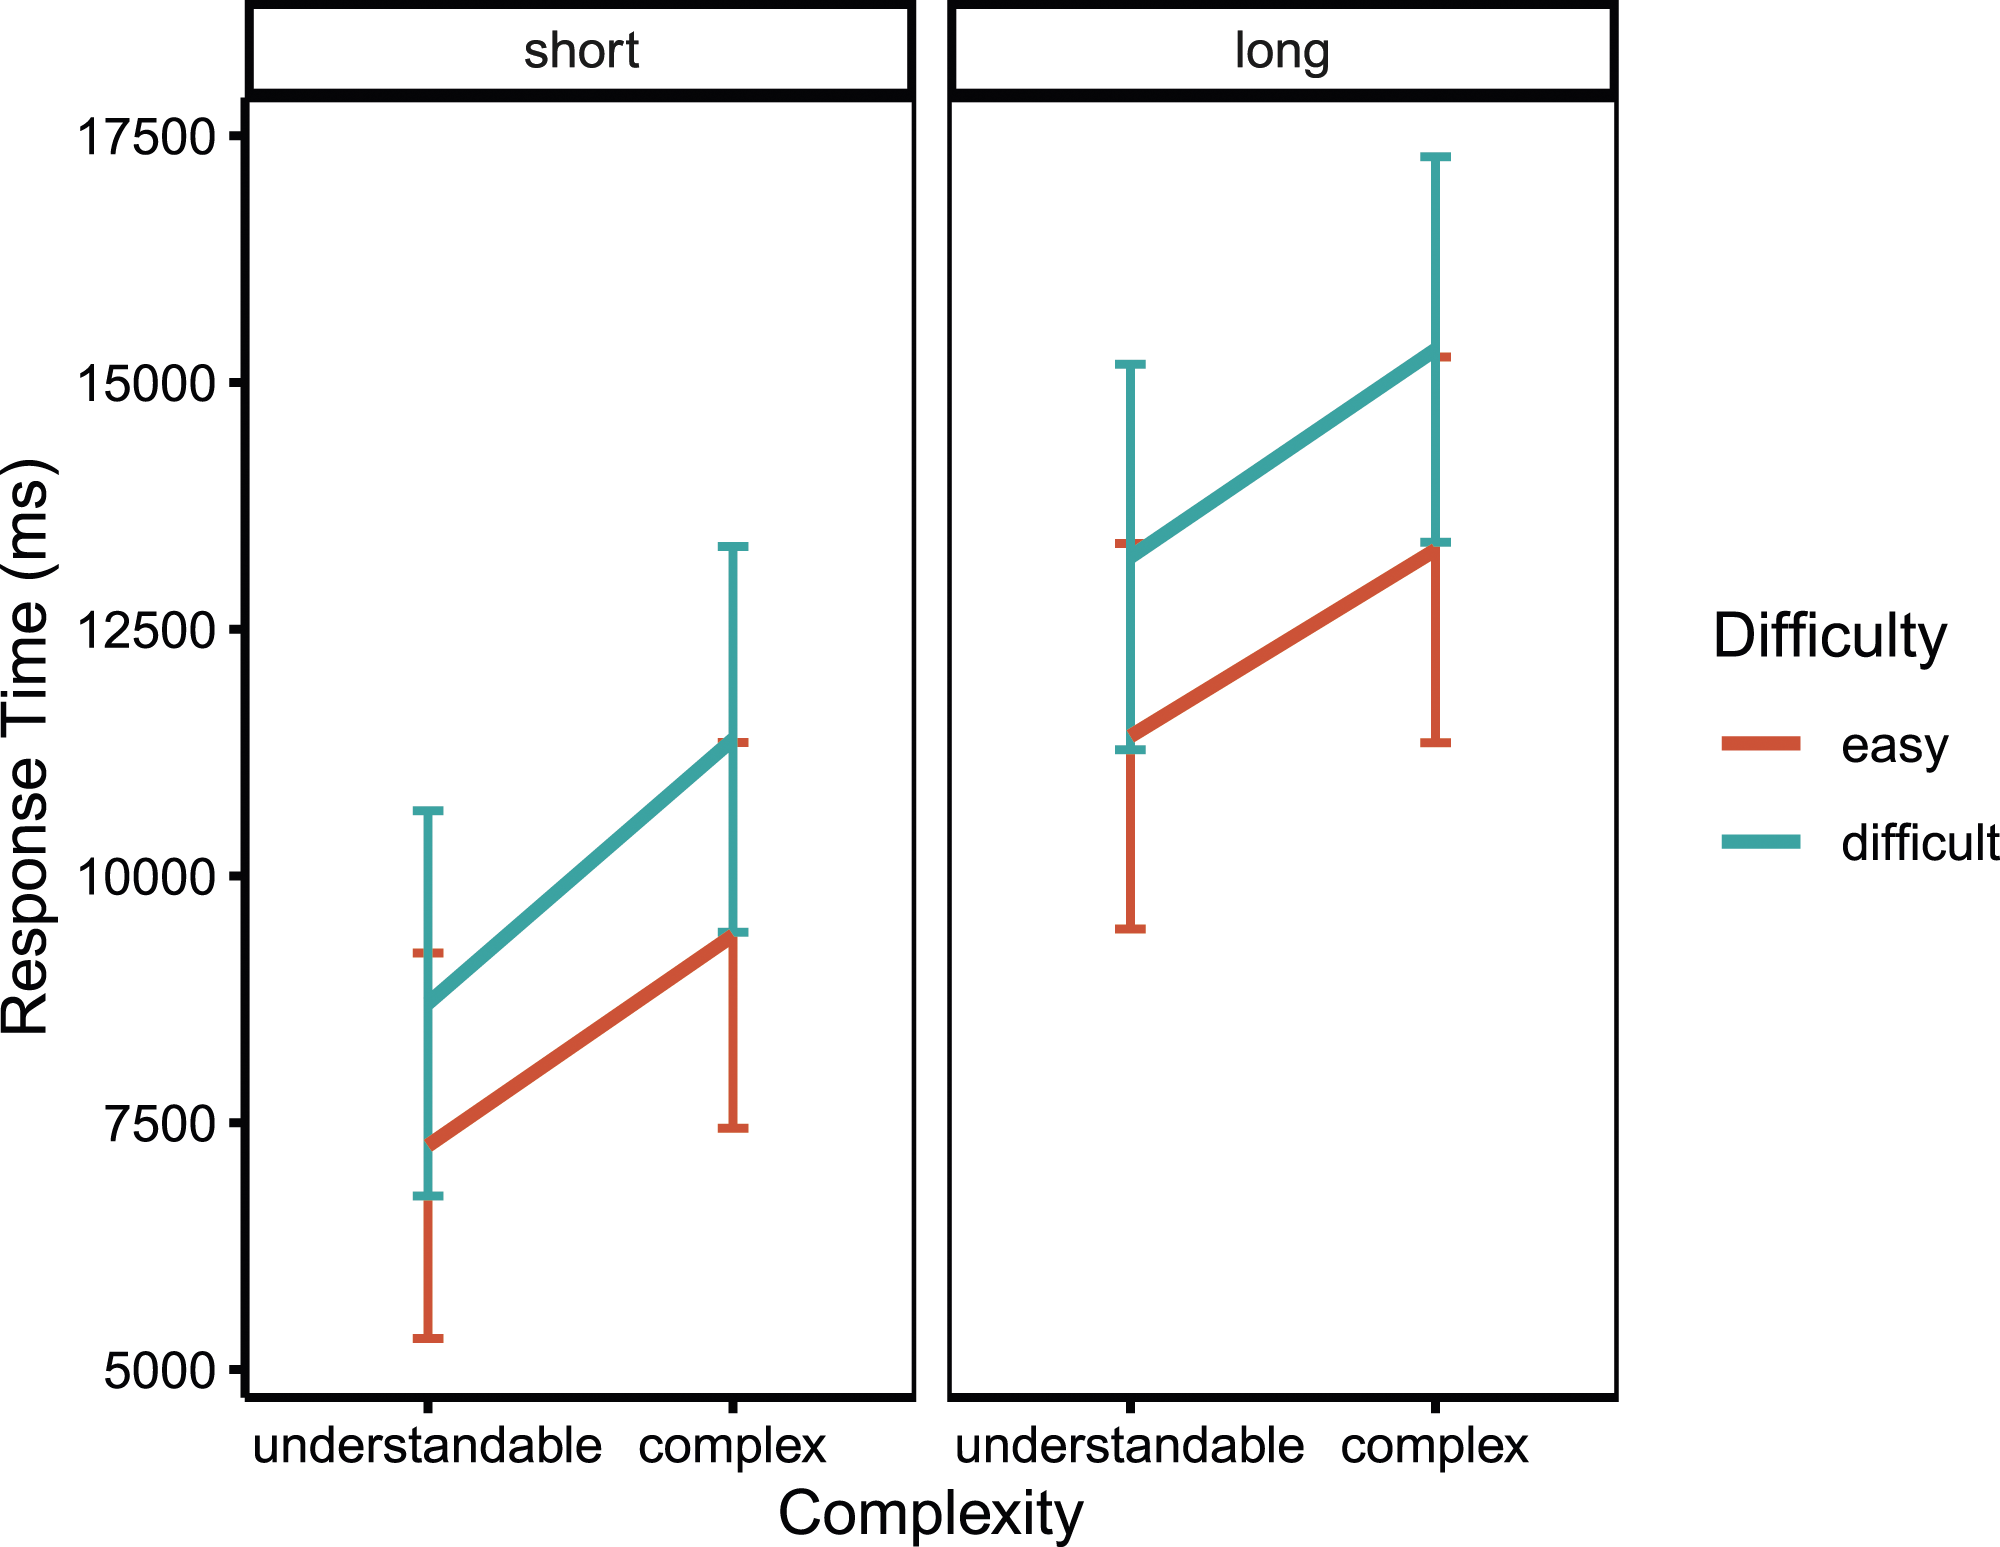
Mean response times for all conditions resulting from the factor level combinations of the manipulated question properties. Note. The means represent the estimated marginal means of the linear mixed model reported in the main text. Error bars indicate the 95% CIs.
Discussion
The goal of the present study was to determine whether different mouse-tracking indices capture different sources of response difficulty. This serves as a first step towards using mouse-tracking data for detecting problematic features of items (e.g., in pretests), which could then be improved. It could also allow researchers to identify when respondents are experiencing particular kinds of response difficulty, and offer them appropriate help, potentially even in real-time. As a result, the accuracy of survey data as well as participants’ user experience could be improved considerably. To examine links between mouse-tracking indices and sources of response difficulty, we induced different kinds of difficulty in an online survey, presenting questions that were either easy or difficult in terms of the presence of appealing distractors (difficulty), used understandable or complex wording in the instructions (complexity), and were short or long (length). We hypothesized that these manipulations would influence y-flips (changes in vertical movement direction), hovers (movement pauses), and response times, respectively.
The main effects of all three manipulations were significant for all three indices, indicating that questions that were difficult, complex, or long led to longer response times as well as a greater number of hovers and y-flips. Descriptively, however, the strength of these effects differed between manipulations for each dependent variable. In line with our first hypothesis, complex questions led to more hovers and the effect of complexity on hovers was stronger than the effect of difficulty; unexpectedly, however, length had the strongest effect. In line with our second hypothesis, difficult questions led to more y-flips and the effect of difficulty on y-flips was larger than the effect of complexity, yet unexpectedly length again had the strongest effect. In line with our third hypothesis, longer questions led to longer response times and the effect of question length on response time was stronger than the effects of the other manipulations.
The overall results of the present study are in line with the findings of previous studies that tried to link mouse-tracking indices to response difficulties in online surveys. Horwitz et al. (2017, 2019) showed that question difficulty influenced a number of mouse movement indicators, including the ones investigated in this study. However, the present study was the first that orthogonally manipulated different sources of difficulty in online surveys to link specific kinds of cursor movements to specific sources of measurement error.
Several substantive inferences can be drawn from this study based on the independent manipulation of different sources of respondent burden. First, as shown in the manipulation check, complexity and difficulty as manipulated in the present study led to a significant decrease in response accuracy, thus confirming that measurement error occurs when these sources of respondent burden are present in survey questions. This supports previous findings that questions that are complex or difficult to answer increase measurement error and thus need to be detected and improved to ensure that accurate data is gathered and valid conclusions are drawn (e.g., Graesser et al., 2006; Holbrook et al., 2006; Lenzner, 2012).
Besides affecting accuracy, complex words in question texts and the difficulty of response options also significantly increased the time participants took to respond to a question. In the extreme case of comparing long, complex, and difficult question versions to their short, understandable, and easy counterparts, response times more than doubled in the present study. While the length of the question had the strongest effect on response time, the effects of complexity and difficulty still were substantial even though the specific manipulations within this study were rather slight. This highlights that improving clarity in question formulation (complexity) and distinctness of response options (difficulty) could not only decrease measurement error caused by less accurate responses, but could also contribute to a decrease in the average overall completion time of the questionnaire. Since longer questionnaires are associated with increased respondent burden and number of break-offs as well as measurement error within the survey (Galesic & Bosnjak, 2009), this again highlights the importance of detecting and improving such question features in web surveys.
Concerning the influence of respondent burden on mouse-tracking measures, the present study was the first to independently and orthogonally manipulate different sources of respondent burden. The results show that the two a priori identified mouse tracking measures (hovers and y-flips) are influenced by specific sources of respondent burden (complexity and difficulty), even if these are the sole source of difficulty in a question. This is a novel finding as previous mouse-tracking studies in survey contexts were all based on difficulty manipulations that induced multiple sources of difficulty simultaneously (Fernández-Fontelo et al., 2023; Horwitz et al., 2017, 2019). It thus emphasizes the potential of using mouse-tracking indices to detect respondent burden in online surveys generally.
The primary objective of our study was to explore whether mouse-tracking indices differentially map onto distinct sources of respondent burden (i.e., a one-to-one mapping of specific indices to specific question properties), enabling researchers to pinpoint the exact problem within a given question. While we do find differential effects of our complexity and difficulty manipulations on the two mouse-tracking indices in the hypothesized way, this effect was not as distinct as we had expected, and particularly overshadowed by a large influence of question length on all dependent variables. While unexpected based on our previously outlined reasoning, two possible explanations are conceivable for this finding.
First, the manipulation of length might have caused participants to experience difficulty in the process of understanding and responding to the question, resulting in the increased number of y-flips and hovers. Such difficulties were not expected since the manipulation of length was implemented so as to ensure that the prepended sentences did not add any information relevant to understanding and responding to the question. An indicator that this goal was met is that the probability of answering a question correctly did not differ significantly between the short and long condition. Nevertheless, as participants were unaware that these prepended sentences lacked relevant information, they might have exerted additional cognitive effort trying to extract and integrate presumed relevant details. This, in turn, could have provoked further mouse movements, resulting in increased hovers and y-flips as observed for the long condition. This assumption is supported by Holbrook et al. (2006), who found question length to be associated with comprehension difficulties as well as with difficulties to map the individual value to one of the available options.
The second possible explanation for the strong effect of length on all dependent variables could be that respondents simply produce additional mouse movements as they read the additional text in the question instruction. If this explanation were true, it would indicate that future studies that want to interpret y-flips and hovers as indices for difficulty and complexity would have to control for the question length (e.g., by counting the number of characters of a question) in order to exclude effects of word processing. Such approaches were already partly implemented in eye-tracking studies by dividing the eye-tracking parameters through the number of characters (e.g., Hervet et al., 2011; Lenzner et al., 2011).
Limitations
While discussing and comparing the effects of the implemented manipulations on the different measures, it is important to mention as a limitation that it cannot be ensured that the different question properties were manipulated to the same extent. The observed differences in the effect sizes could, consequently, not only be due to the sensitivity of the indices to the different manipulations but could also be caused by differently strong implementations of these manipulations. Accordingly, another explanation for the effect of length being the strongest for all indices could be that the length was simply manipulated to a stronger extent than complexity and difficulty. While it is likely challenging to find a way to ensure that the strengths of the different manipulations are indeed comparable, future studies could examine more fine-grained variations of each of the question property manipulations (e.g., easy, medium, and high complexity of the instruction wording) and examine to what extent they are reflected in the mouse-tracking measures.
Another limitation is that while all of our manipulations exerted unexpectedly strong effects on all dependent variables, one might argue that different survey layouts might have resulted in stronger effects yet, and we suspect that effects could easily be amplified in practice. For example, we applied a standard, compact survey layout, with fairly little room for the cursor to travel. Also, the manipulations of difficulty and complexity were rather slight and personal relevance was low. Hence, more substantial causes of difficulty or complexity might increase the size of effects as well as the differences between them, making detection and differentiation through mouse movement indices even easier.
As our study was a first step towards the validation of mouse-tracking indices as differential indicators for sources of measurement error in online surveys, an important avenue for further research concerns the generalizability of our findings beyond the exact context of our study. For example, beyond the specific sources of difficulty and complexity investigated in the present study, many more are possible. Difficulty, for example, could also stem from the content of the question itself. Complexity, on the other hand, might also result from other text features that undermine reading comprehension, such as those identified by Lenzner et al. (2010), for instance, complex syntax or vague or imprecise relative terms (e.g., “often” or “frequently”). It remains to be seen whether these sources of difficulty manifest in effects of similar magnitude, or potentially even different movement patterns. Likewise, other questionnaires might also differ in the topic of their questions, and though previous eye-tracking studies demonstrated similar result patterns for questions containing different content (Lenzner et al., 2011), the generalizability of our effects across subject areas remains to be tested empirically. Similarly, future research should investigate if the mouse-tracking measures that are indicative of response difficulty and question complexity may also differ between question and response formats.
In addition, the generalizability of our results concerning differing characteristics of participant samples should be examined. As the sample of the present study contained a high proportion of university students, the effects of difficulty and complexity found in the present study are likely even more pronounced for a sample that is more representative for the entire population concerning the cognitive ability and age range of participants.
Practical Implications
The study demonstrates that mouse-tracking indices, namely hovers and y-flips, are associated—to varying extent—with each of the studied sources of respondent burden and, in turn, may serve as indicators of these. Therefore, mouse-tracking indices could serve as a viable complement to relying solely on response times for identifying problematic question features. As a practical application, these indices could thus be leveraged in pre-tests to identify and adjust problematic features and improve usability before fielding a survey. Comparisons between questions or different versions of the same question could be made based on their impact on hovers and y-flips, serving as a proxy for respondent burden. If these comparisons reveal differences in mouse-tracking indices (controlling for differences in question text length), the affected index may guide researchers toward focusing revisions on either the available response options (y-flips) or the complexity of the question text (hovers). Moreover, the advantages of mouse-tracking may be more pronounced in longer surveys, where external factors like distractions, mind-wandering, or multi-tasking can influence response times to a greater extent as these factors are less likely to impact mouse-tracking indices, which require active engagement in the survey (Horwitz et al., 2019).
Another practical implication involves using mouse-tracking indices in adaptive survey design (Horwitz et al., 2019). The study demonstrates that increased question difficulty and complexity lead to significantly increased numbers of hovers and y-flips. In adaptive surveys, these indices could consequently serve as the basis for determining person- or question-specific thresholds, which, if surpassed, trigger the display of additional information or examples for a given question. Such an approach could contribute to streamlining a questionnaire, reducing overall length and thereby respondent burden by providing additional information only when more likely to be actually needed.
Concluding Remarks
The aim of the present study was to link specific mouse-tracking measures to different question properties that are likely to cause measurement error, decrease usability, and impair user experience in online surveys. In line with our hypothesis that different kinds of mouse movements are more sensitive to specific question properties than others, hovers were more strongly affected by the complexity of the question wording whereas y-flips were more strongly affected by the difficulty of the response options.
These differential effects suggest that mouse-tracking indices might indeed enable the detection of different sources of response difficulty in online surveys. Accordingly, future research could benefit from integrating mouse-tracking into online surveys at multiple steps of the survey process. In pretests, mouse-tracking could be used to detect and adjust problematic items and improve usability for subsequent participants. During data collection, mouse-tracking could reveal participants struggling with the wording of question texts or the decision between response options, and guidance could be offered to them in real-time by providing more detailed information. After data collection is completed, the recorded mouse-tracking data could be used to identify specific answers where participants experienced difficulty and this could be taken into account in the following analyses to improve data quality.
However, as we just took a first step towards validating mouse-tracking indices as indicators for different sources of response difficulty in online surveys, we can give no final assessment or precise recommendation for practical application yet. Further research is needed to examine whether hovers and y-flips in practice allow for the detection of different sources of response difficulty in online surveys. Such research could build on the approach by Fernández-Fontelo et al. (2023) who showed that machine-learning models using mouse movement indicators are able to predict the overall difficulty of a question and could extend this approach to predicting different types of difficulty. Also, the finding that the length of the question had a substantial effect on the mouse-tracking indices (and not only on response time) was a priori unexpected and should be addressed in future research. So far, this finding suggests that research on response difficulty could benefit from controlling for question length, regardless of whether response time or mouse-tracking is used as an indicator.
Overall, our findings indicate that mouse-tracking holds promise as a nuanced indicator of specific sources of respondent burden. We hope that our contribution will enable researchers to harness the potential of mouse-tracking in survey research and we look forward to seeing it developed further.
Supplemental Material
Supplemental Material - Detecting Respondent Burden in Online Surveys: How Different Sources of Question Difficulty Influence Cursor Movements
Supplemental Material for Detecting Respondent Burden in Online Surveys: How Different Sources of Question Difficulty Influence Cursor Movements by Franziska M. Leipold, Pascal J. Kieslich, Felix Henninger, Amanda Fernández-Fontelo, Sonja Greven, and Frauke Kreuter in Social Science Computer Review
Footnotes
Authors Note
Franziska M. Leipold is now at the School of Social Sciences, Department of Psychology, University of Mannheim. Pascal J. Kieslich's affiliation reflects the affiliation at the time of involvement in the publication.
Declaration of Conflicting Interests
The author(s) declared no potential conflicts of interest with respect to the research, authorship, and/or publication of this article.
Funding
The authors disclosed receipt of the following financial support for the research, authorship and/or publication of this article: This work was supported by Deutsche Forschungsgemeinschaft (GR 3793/2-1, KR 2211/5-1).
Ethical Statement
Open Practices Statement
The experiment was preregistered at the Open Science Framework (OSF) (https://osf.io/r5392). Data and materials are available at ![]() .
.
Data Availability Statement
Supplemental Material
Supplemental material for this article is available online.
Notes
Author Biographies
References
Supplementary Material
Please find the following supplemental material available below.
For Open Access articles published under a Creative Commons License, all supplemental material carries the same license as the article it is associated with.
For non-Open Access articles published, all supplemental material carries a non-exclusive license, and permission requests for re-use of supplemental material or any part of supplemental material shall be sent directly to the copyright owner as specified in the copyright notice associated with the article.