
Abstract
In 2017, Facebook’s news feed algorithm began weighting emoji reactions (e.g., love and angry) as five times more valuable than the like button. Such a change is theoretically intriguing because existing research largely suggests that women tend to use emojis more than men on social media. Within the context of political campaigns, prior work has revealed a host of other “gender gaps,” from documenting men’s and women’s differing tolerance for negative campaigns, to examining variations in online political participation and—more broadly—charting gendered imbalances in party demographic support. To date, however, no study has looked to investigate this potential gender emoji gap within the online political environment. This paper explores just such a gap, combining data across three US election cycles (2016–2020), over thirty million individual observations, and thousands of (federal and state) candidates. The data shows that women exhibited a greater preference for emoji reactions than men in response to posts from the 2016 presidential election candidates. Party, and candidate negativity, also appeared to moderate this effect. Likely due to this (moderated) gender gap, Democratic candidates continued to see a much higher proportion of emoji reactions to their posts, than Republicans in 2018, and 2020. In turn, the results offer clear evidence of a persistent emoji gender gap in US political campaigns on Facebook. Such findings strengthen our theoretical understanding of political communication and behavior online, and prompt important questions going forward for future research.
Introduction
In 2021, Congress obtained internal Facebook documents that sparked a wealth of criticism. From potentially corrupting teenage girls’ mental health and body image (Wells et al., 2021), to featuring as a hotbed for spreading vaccine misinformation (Schechner et al., 2021), Facebook stood accused of harming its users and the world around it.
Emoji reactions featured prominently in this controversy. According to the whistleblower’s leaked documents, Facebook began weighting all emoji reactions (e.g., love and angry) as five times more valuable than likes from 2017 (Merrill & Oremus, 2021). Meaning, a post that provoked reactions received an algorithmic boost—further increasing its reach across user newsfeeds. The new weighting scheme effectively continued until sometime in 2020.
While there are seemingly many variables Facebook’s news feed algorithm uses to either boost—or limit—a post’s visibility (Facebook, 2021), the subsequent media coverage focused considerably on Facebook’s angry reaction in particular. “Angries,” it seemed, disproportionately boosted “civic low quality news, civic misinfo, civic toxicity, health misinfo, and health antivax content” on the platform, and these imbalances raised internal worries that the emoji was specifically ‘‘being weaponized’ by political figures” (Merrill & Oremus, 2021). In other words, internal Facebook research suggested the angry reaction was being uniquely leveraged by candidates to further their reach across the platform, prompting them to specifically remove the angry emoji’s weighting in late 2020.
Political campaigners and their consultants are indeed well familiar with the strategic power of sparking anger. We know, for example, that negative campaigns routinely seek to foster this specific emotion in order to promote desired behavior, like boosting political participation (e.g., see Valentino et al., 2009). Conversely, campaign strategists similarly look to leverage positive appeals to win elections (Malloy & Pearson-Merkowitz, 2016). From attaching enthusiasm to a candidate, to inspiring hope and excitement among the electorate, positive emotional cues are seen as complementary tools in a campaigner’s toolbox (Brader, 2006).
Importantly, campaigners also tailor their emotional political messages with gender in mind, most notably (for example) in gender-based appeals to “court the women’s vote” (Kam et al., 2017). Recognizing such gender differences is strategically wise. Take anger appeals as one example: evidence shows that men and women publicly respond differently to anger (Archer, 2004), a gender gap that appears related (Brooks, 2010) to a gender-based varied tolerance for negative political campaigns themselves (Fridkin & Kenney, 2019; Kern & Just, 1997).
The bulk of this research into positive and negative emotional appeals tends to argue that social norms best explain how men and women externally respond to emotional political cues (Fridkin et al., 2021). For example, cultural norms expect women to publicly display positive emotions (Simpson & Stroh, 2004), potentially increasing their tendency to respond to positive political appeals. According to similar cultural norms, men are stereotypically expected to limit nonverbal expressions of positive emotions publicly (e.g., like smiling, see: Hall et al., 2000).
In fact, these norms also largely form the basis for theorizing about women’s comparative preference for emoji use on social media more generally. Well outside election contests, large online behavioral datasets (Chen et al., 2018), including on Facebook (Oleszkiewicz et al., 2017), and survey responses (Jones et al., 2020) have indeed documented women’s tendency to use emojis on social media more than men. Though some debate exists on the nature of this emoji gender gap more widely (e.g., see discussion in Prada et al., 2018), ultimately such a discrepancy only further points to a need to examine gendered emoji use in the political context—something that has to date gone unaddressed.
This paper is designed to investigate this potential gendered emoji gap using Facebook data from three US federal election cycles (i.e., 2016, 2018, and 2020), spanning over thirty million individual observations (2016) and thousands of candidates (2018–2020). As the results suggest, women showed a much greater preference for emoji reactions than men in 2016. Tone, candidate gender, and party were further explored as potential moderating factors. Likely due to this gender gap, Democratic candidates continued to prompt more emoji reactions as a proportion of their overall support than Republicans in 2018 and 2020.
Before turning to these results in greater detail, I now offer the theoretical foundation that informs this study.
Literature Review
With nearly 7 in 10 US adults now on Facebook (Auxier & Anderson, 2021), there is very little question regarding the—immense—reach of social media in our lives. As a great deal of evidence reveals, emotional gratification drives this online engagement (Wang et al., 2012). In turn, these platforms possess vast behavioral data that can be used to fine tune our understanding of user emotional responses via mass experimentation (for one well-known controversial example, see: Kramer et al., 2014), though such efforts understandably prompt controversy (Hunter & Evans, 2016). The public concern, of course, is that social media platforms (algorithmically) capitalize on these real-world effects to promote even greater engagement (Hallinan et al., 2020).
Despite such concerns, emotionally incentivizing users to engage during elections arguably offers positive democratic outcomes. Helping politics reach—and participate with—a greater audience in an era where political disaffection is on the rise (Pharr & Putnam, 2018; Torcal & Montero, 2006) represents one of the more obvious social benefits. Social media also provides a critical avenue where candidates and parties can directly bypass the (potentially problematic) filter of traditional media (Herman & Chomsky, 1988).
Emotional Appeals of Political Campaigns
Beyond the efforts of social media platforms themselves, we know that candidates and political parties also rely heavily on stimulating emotions. Positive and negative televised ad campaigns reflect the most overt and simplistic efforts to spark emotions, and strategically beneficial behavioral responses from the electorate. From 30 second ad spots like Morning in America to the Willie Horton ads, billions of dollars are spent every election cycle attempting to inspire hope and excitement, or cultivate fear and anger in voters.
Anger, for example, is one emotion particularly useful in the political realm. As prior work demonstrates, anger can be used to drive voters to the polls (Valentino & Neuner, 2017; Weber, 2012), and—paradoxically—to deter some from showing up (Magni, 2017). In contrast, positive emotional appeals are also leveraged during elections. Enthusiasm cues provide one such obvious example, by generating interest and public support (Brader, 2005; Marcus & MacKuen, 1993), including among potential volunteers, on and offline, who formulate the backbone of any campaign (Levenshus, 2010). This is why, for example, campaigns often strategically devote their (limited) financial resources to more positive enthusiastic appeals early in an election cycle, rather than at the end (Ridout & Searles, 2011).
Social media platforms provide a unique—theoretically free—tool by which these emotional political campaigns can be distributed to the public, though paid political advertising on the medium is certainly growing (e.g., see Facebook’s Ad Transparency Library, 2019). With the click of a button, candidates, parties, Super PACs, and various other outside actors can attempt to spark anger, or foster hope and enthusiasm via posts reaching millions of potential voters. In turn, there’s little question that social media represents the new battlefield of campaigns.
Gendered Responses to Emotions
Responses to emotional stimuli—such as political appeals—understandably differ across a variety of factors. Gender, nevertheless, commands the current study’s focus, and for good reason: we know, for example, that campaigns make specific gender-targeted efforts to prompt emotions in men or women voters (Kam et al., 2017).
Critically, there is long-running debate about how social norms determine the efficacy of these gendered emotional appeals in campaigns (e.g., see emotional appeals from female political candidates in Hitchon et al., 1997). We know, for example, that social norms feature as the primary explanation for why women publicly express and display (more) positive emotions in contrast to men (Simpson & Stroh, 2004; Stoppard & Gunn Gruchy, 1993). In fact, we know that cultural norms stereotypically expect men to be less likely to express positive emotions publicly (Hall et al., 2000).
Emojis Gap
The existing Facebook-specific evidence reflects these—likely normatively driven—gender differences at scale. For example, one study of nearly 90,000 Facebook users (Oleszkiewicz et al., 2017) found women used emojis more than men in their public posts. Facebook studies have observed similar gendered behavioral tendencies within language use too, with one paper documenting women’s comparative preference for expressing and discussing positive emotions—including love specifically across millions of observations (Park et al., 2016).
Returning to emoji use specifically, data from other platforms reflect a similar gender gap. From studies of WhatsApp (Koch et al., 2022; Pérez-Sabater, 2019), to Android users (Chen et al., 2018), online chatrooms (Fullwood et al., 2013), and private text messages (Tossell et al., 2012), the bulk of online data suggests that women do indeed use emojis more than men both in public and in private online settings. Survey data reinforces women’s comparative preference for emojis as well (Jones et al., 2020). Prada et al. (2018) find a similar self-reported gender gap in their survey, though they acknowledge there are a handful of exceptions among these emoji studies (e.g., see Luor et al.’s (2010) study of workplace instant messaging in Taiwan). Ultimately the bulk of this work, however, clearly points to a gender gap in emoji use across digital mediums—including on Facebook.
Negativity Gap
Given the discussion so far, it seems reasonable to expect women to prefer emojis in response to political appeals on Facebook. There is, however, evidence that suggests the tone of a political appeal might moderate that effect. The large body of work that investigates the effects of negative political communication (Lau et al., 2007) therefore contributes a more nuanced theoretical explanation for tone’s capacity to moderate women’s preference for emoji reactions.
Candidate gender takes a primary focus of this negative campaign literature, with studies of how female political candidates attack (Kahn, 1993); how they are perceived (by the electorate) when they go negative (Gordon et al., 2003; Krupnikov & Bauer, 2014); or when they are attacked themselves (Fridkin et al., 2009). An important—and critically relevant—subset of this research explicitly considers voter gender as a moderating factor (Brooks, 2010). This small collection of negativity literature demonstrates an appreciable difference between how men and women voters respond when candidates go on the attack (Brooks, 2010; Kern & Just, 1997; King & McConnell, 2003), including now on social media (Phillips, 2021a). While some debate about the nature of this gap exists, the collective evidence suggests men tend to reward candidate negativity and women may punish it.
Like above, social norms provide the groundwork to explain these effects. While, for example, men and women experience the same amount of anger in the experimental setting (Archer, 2004), it seems women tend to be less publicly aggressive in their behavioral response to the emotion (e.g., see Archer & Coyne, 2005; Crick & Grotpeter, 1995). When anonymity is provided though, that anger-provoked behavioral difference disappears altogether (Lightdale & Prentice, 1994). Social media platforms—like Facebook—are quite public. Friends, family, and other acquaintances are the backbone of the network, not to mention the platform’s real name requirement. Viewed through this lens, any exploration of Facebook emoji use must also, at least, consider the tone of a political appeal.
Party Differences
Finally, there is reason to believe party may also play an important factor in the current study. For example, one study of Facebook emoji use found Republican and Democratic political candidates used flag emojis at different rates (Kariryaa et al., 2022). In fact, as new evidence suggests, political parties across the world tend to elicit different types of reactions on Facebook from their supporters as well (Muraoka et al., 2021). That particular study, an aggregate assessment of love and anger reactions to 2 million Facebook posts, from 690 political party pages in 79 democracies, found that ideology (among other party factors) partially determined the types of reactions that parties received. The researchers in that study conclude with future questions on—differing—individual motivations for clicking emoji reactions. For the reasons outlined above, I suggest that gender might help explain the differences they observe at the party level across the globe, and (varying) party demographics offer further insight into that potential answer.
As is well established by decades worth of US political science literature, women tend to support the Democratic Party in greater numbers than men (Box-Steffensmeier et al., 2004; Ondercin, 2017). There is, however, unquestionable complexity that exists within this relationship: for example, African-American and Hispanic women make up the bulk of this gap, whereas a slim majority of white women historically vote Republican (Junn & Masuoka, 2020).
This partisan demographic disparity is all the more important, because the regulation of emotional displays may vary not only by gender as previously discussed but also across race and ethnicity as well (Weiss et al., 2022), variations that (similarly) have decades worth of research (Matsumoto, 1993). For example, we know that public displays of emotions are regulated unequally in the workplace, with minorities expressing clear fears of violating normative expectations and reinforcing racial stereotypes (e.g., see the “angry black man” discussion in Wingfield, 2010). In fact, attempts to specifically distinguish similar emotional display rules among minorities on social media are now emerging (e.g., see Horner & Akiva, 2020). Like gender, ethnic-dependent public expressions of emotions are complex and contextual, but the possibility of such behavioral variations from a party demographics perspective introduces another factor demanding exploration.
Research Questions
The above theoretical background suggests women may exhibit a greater preference for emoji reactions than men on Facebook, though some countervailing conditions have also been identified. When applied to the context of political campaigns, this prior research has also documented different gendered proclivities for negative appeals, introducing tone as another important potential conditional factor. Finally, the varied demographic makeup of political parties may exert additional influence on emoji use.
In order to assess these potential relationships—and discuss their consequences—this paper offers the following three research questions:
I now turn to the methods by which this paper will explore these three research questions.
Method
In this study I have enlisted two separate Facebook datasets spanning three US federal (and state) elections (i.e., 2016; 2018; 2020). The 2016 datasets was collected and examined as part of a larger previous study designed to examine potential differences between how men and women respond to negative campaigns on Facebook (Phillips, 2021a). That study found women exhibit a reduced tendency to click the like button when confronted with negative political appeals, though that analysis was not extended to emoji reactions. The current paper builds on that dataset by exploring whether similar gender differentials are expressed via Facebook emoji reactions, and then extends that analysis to observing potential differences via fresh aggregate data collected from the 2018 and 2020 elections.
The 2016 dataset contain approximately 33 million individual reactions to 636 posts from the general presidential election candidates (i.e., Secretary Clinton and Donald Trump). This dataset was extracted during the 2016 election via the Facebook API—when it was available to the public, and the data collection period spans from the opening of the conventions (effectively the start of the general election) to election day.
Approximately 6 million unique users in this 2016 dataset were categorized by gender using baby (first) name data released by the Social Security Administration (SSA) over the past century. The SSA dataset contains 90,000 unique names assigned to children during the post war (1945) period. Each name in the data contains the number of births associated with each name categorized by gender, making first name gender classification a straightforward process. For example, individuals with the name Lindsey are much more likely to be female than male in the US, as the SSA data shows just over 95% of children born with the name in the post-war period were women. Similar first name assignment processes have been used in large datasets across a wide range of situations from both public and private sector interests (e.g., see discussion in Fiscella & Fremont, 2006), including gender identification on social media (e.g., see Liu & Ruths, 2013), and as discussed this specific gender dataset has been deployed in the previous study (Phillips, 2021a).
The aforementioned previous study also classified negative posts. That is, Facebook appeals from the candidates were categorized using a combined evaluative and directional approach. In other words, posts were first assessed for a direct attack on a clearly defined opponent (following Geer, 2006), and if not, appeals were then examined qualitatively for verbal or visual cues (e.g., sarcasm and satire) that might lead a reasonable voter to view the post as negative campaigning. Additional details for this qualitative coding process can be found in the previous study (Phillips, 2021a).
Turning to the new dataset, the 2018 and 2020 election data was extracted via CrowdTangle, the Facebook owned and platform approved data collection company. This dataset contains aggregate (i.e., total reactions) observations for roughly 800 thousand posts from 2.5 thousand candidates running for elected office from 2018 to 2020. These contests include federal candidates for the House, Senate, and President, in addition to state contests (e.g., gubernatorial and state legislatures).
In order to categorize negative political appeals at this large scale (i.e., hundreds of thousands of observations), machine learning was enlisted to classify posts. The Stanford CoreNLP toolkit was used to categorize the sentiment of text from each post, after standard language pre-processing (i.e., removing non-alphabetic characters and converting to lowercase). This particular research tool has been deployed in the various election contexts (e.g., see Bakliwal et al., 2013; Caetano et al., 2018), including in US campaigns both online (e.g. Phand & Phand, 2017) and on traditional media (Phillips, 2021b).
This unavoidable, though different method of coding negativity in the aggregate data obviously prevents direct comparisons of tonal results between datasets. Nevertheless, this approach provides a valuable rough estimate for assessing tone as a moderating influence in the newer data. Sentiment analysis of this nature also bypasses the rigid debates about operationalizing negative campaigning as well (e.g., Jamieson et al., 2000; Lipsitz & Geer, 2017; Walter & Vliegenthart, 2010), by instead simplistically identifying negative language designed to spark the emotion itself—the precise point made by Ridout and Searles’ (2011) research on anger provoking political ads. For example, such discourse might indeed include mudslinging (e.g., “crooked Hillary”), but could just as easily emerge from less directional language (e.g., “[o]ur jobs have been destroyed!”). In other words, this method of natural language processing provides notable logistic and conceptual advantages, but any findings must be cautiously interpreted.
Examining behavior at both the individual (2016) and mass aggregate (2018–2020) level is critically important to addressing the current study’s three research questions, hence the need for multiple, complementary, datasets. The 2016 dataset offers unique insights into the individual behavior of millions of voters on Facebook. However, this individual level data is restricted to one—rather unique—election, making it hard to generalize these findings beyond that context. Unfortunately, to date, no such similar vast individual level data exists elsewhere that is publicly available to researchers—that includes the recent release of Facebook collaborative research data on the 2020 presidential election (e.g., Nyhan et al., 2023) found on the Social Media Archive, which mostly offers aggregate level, non-gender coded, Facebook data as supplementary material for the public. Given this data limitation, the 2018 and 2020 aggregate dataset is utilized to assess the inferred effects (observed in the previous data) across hundreds of thousands of (other) candidate appeals. Just as critical, campaigns within the aggregate data occurred while Facebook algorithmically boosted emoji reactions (2017–2020).
Regarding this three year boosted time period, reporting is somewhat unclear on Facebook’s efforts to fine-tune the algorithm between 2017 and 2020 (Merrill & Oremus, 2021). Despite this ambiguity, the coverage nevertheless documents that Facebook’s algorithm continued to value emoji reactions over likes during this time, whether it be a 5:1 ratio, 4:1, 2:1, or otherwise. As previously mentioned, at some point in late 2020 the angry reaction was removed from the weighting scheme, but Meta further boosted love and sad reactions as a counterbalance (Merrill & Oremus, 2021). Given it is methodologically impossible to account for these ongoing revisions, reactions in the figures to come are simply multiplied by 5. This scaling is offered to visually depict the algorithmic weighting these reactions would generally have received during the 2017–2020 boosted period. To be clear, this scaling makes no statistical difference for comparisons within reactions in 2016 (i.e., RQ1-2).
The following applies two statistical tests to answer this paper’s three research questions. First, to establish the presence of a potential gender gap, I use the Wilcoxon-Mann-Whitney population test on the 2016 aggregate engagement data. This non-parametric paired test is useful given its non-distributional assumptions, and allows for a simplistic direct comparison between the population of men’s and women’s reactions in 2016 (i.e., RQ1-2). To more deeply explore the moderating factors in this relationship (i.e., tone and party affiliation from RQ2), I construct negative binomial regression models of the aggregate count data from the 2018 and 2020 election cycles. Finally, both sets of data (2016; 2018–2020) were restricted to non-Facebook Live posts. This is methodologically critical because the API permits users to react multiple times to a Live post, in contrast to allowing only one reaction per person for all other posts.
Results
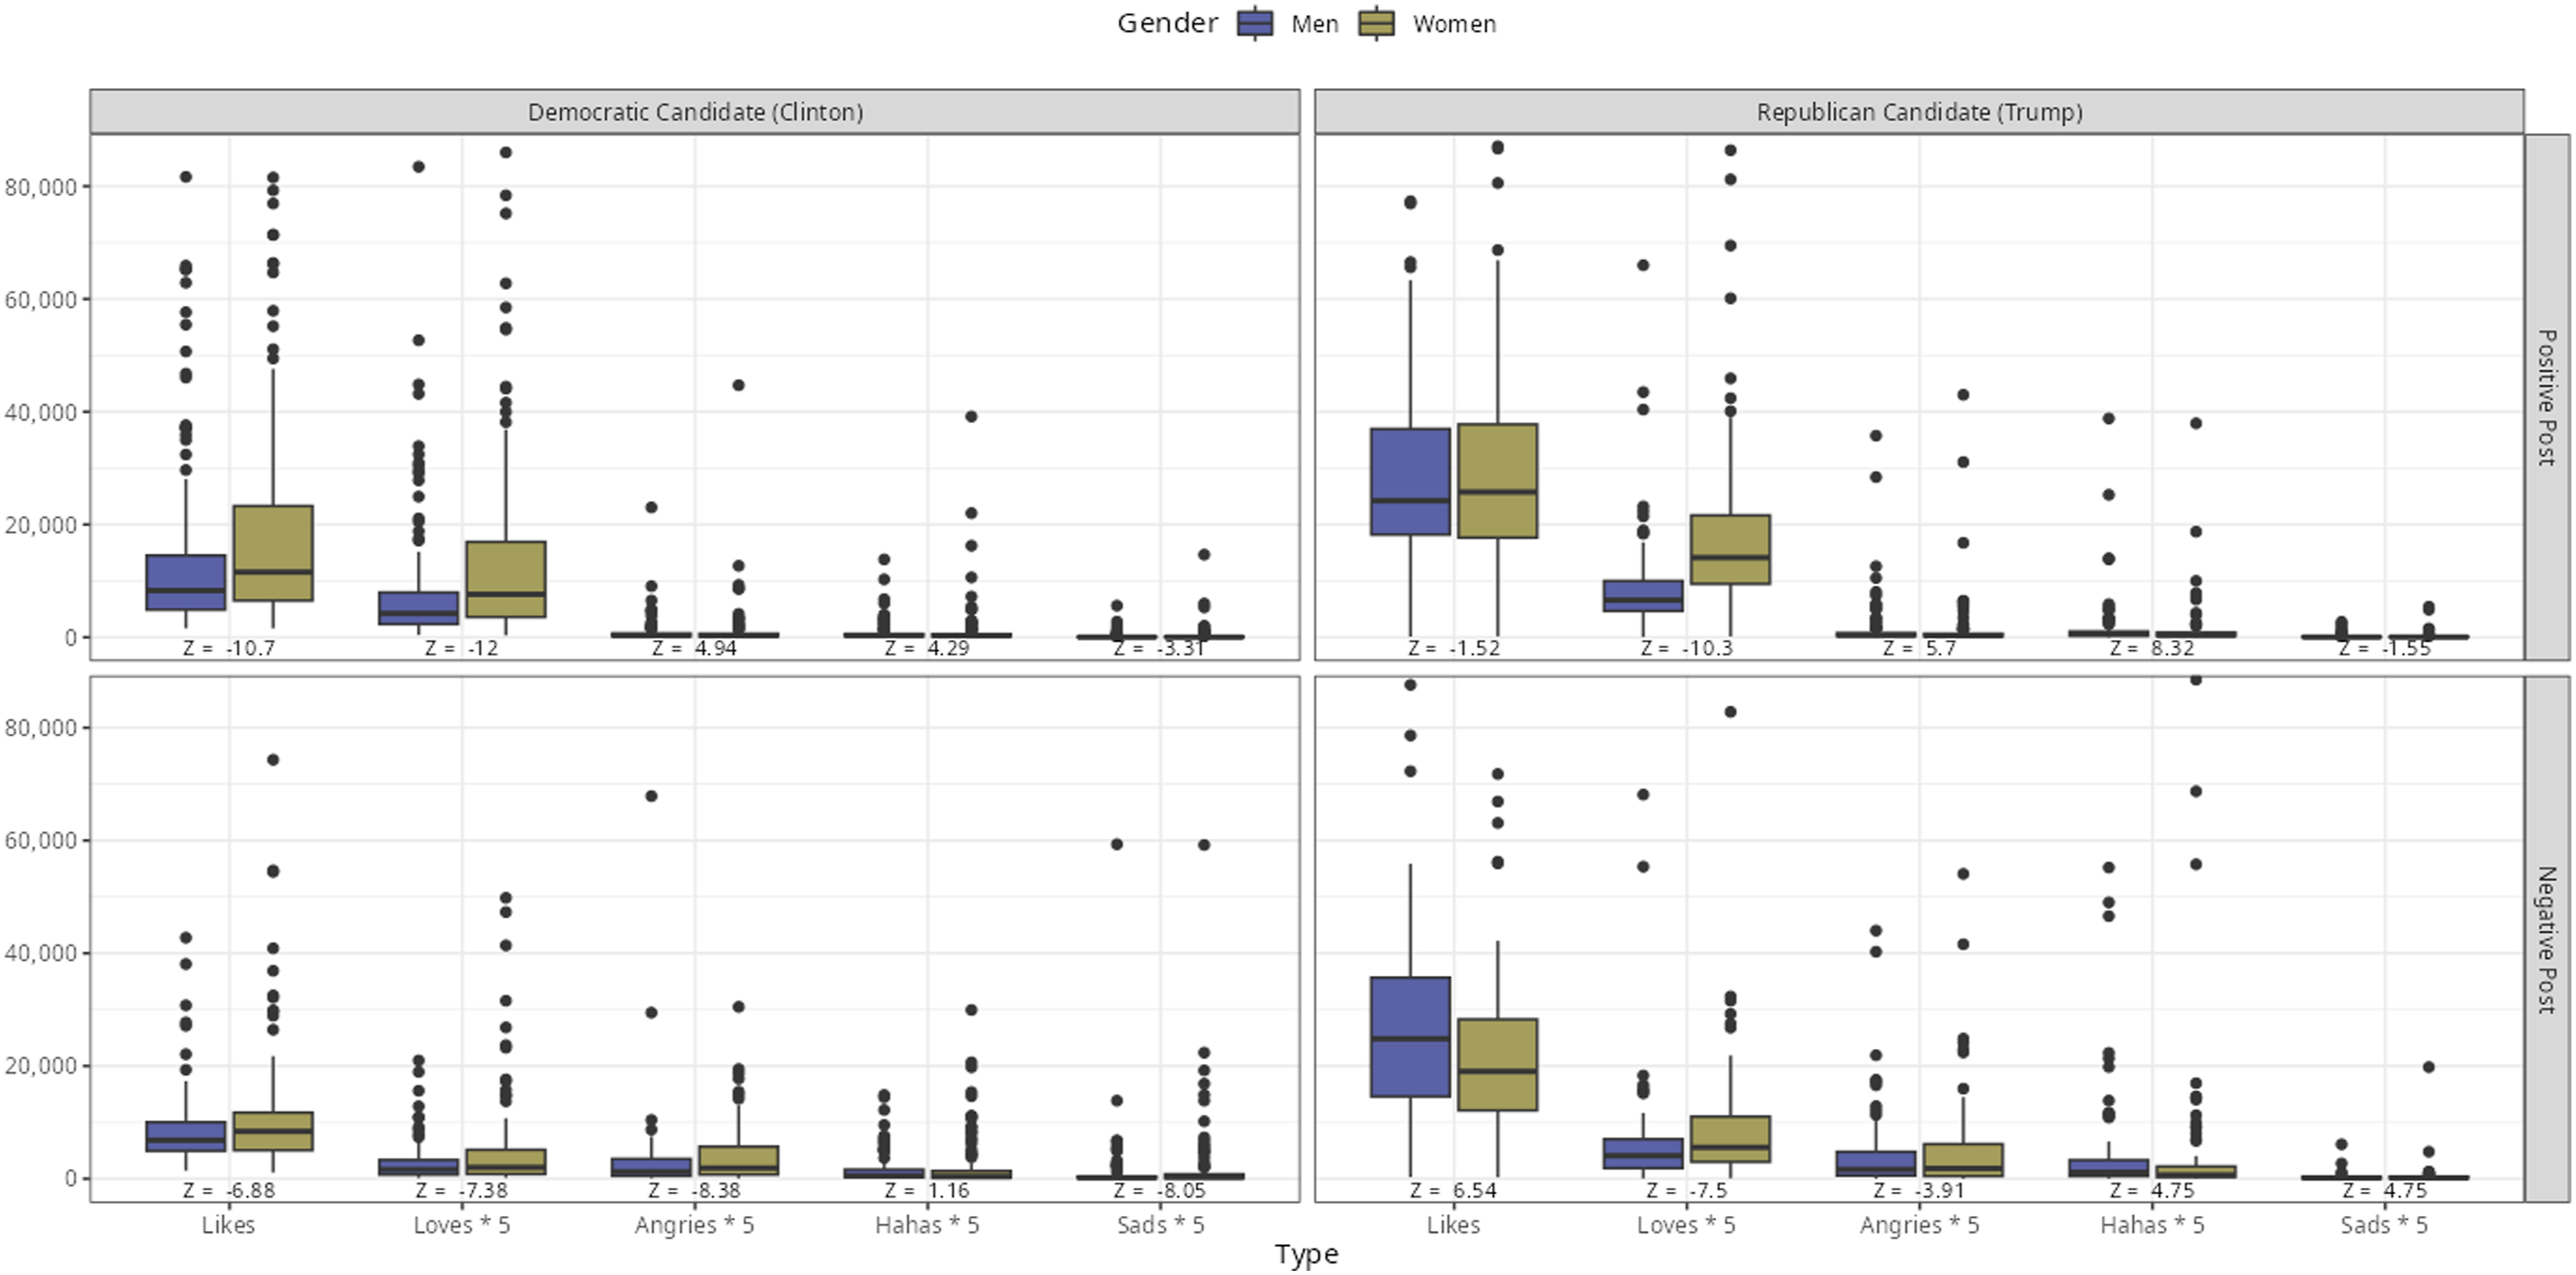
Figures 1 and 2 present the spread of likes, and reactions, for the Democratic (on the left) and Republican (on the right) for the 2016 candidates. The engagements are divided into responses from men (purple) and women (gold). Figure 2 is further separated by post sentiment, with the top row representing positive appeals and the bottom row showing reactions to negative ones. Again, reactions in both figures are multiplied by 5 in order to visually depict the algorithmic weighting these reactions would have received during the later boosted period. 2016 presidential election likes and total reactions (x5) by gender. 2016 presidential election likes and distinct reactions (x5), by gender and post tone.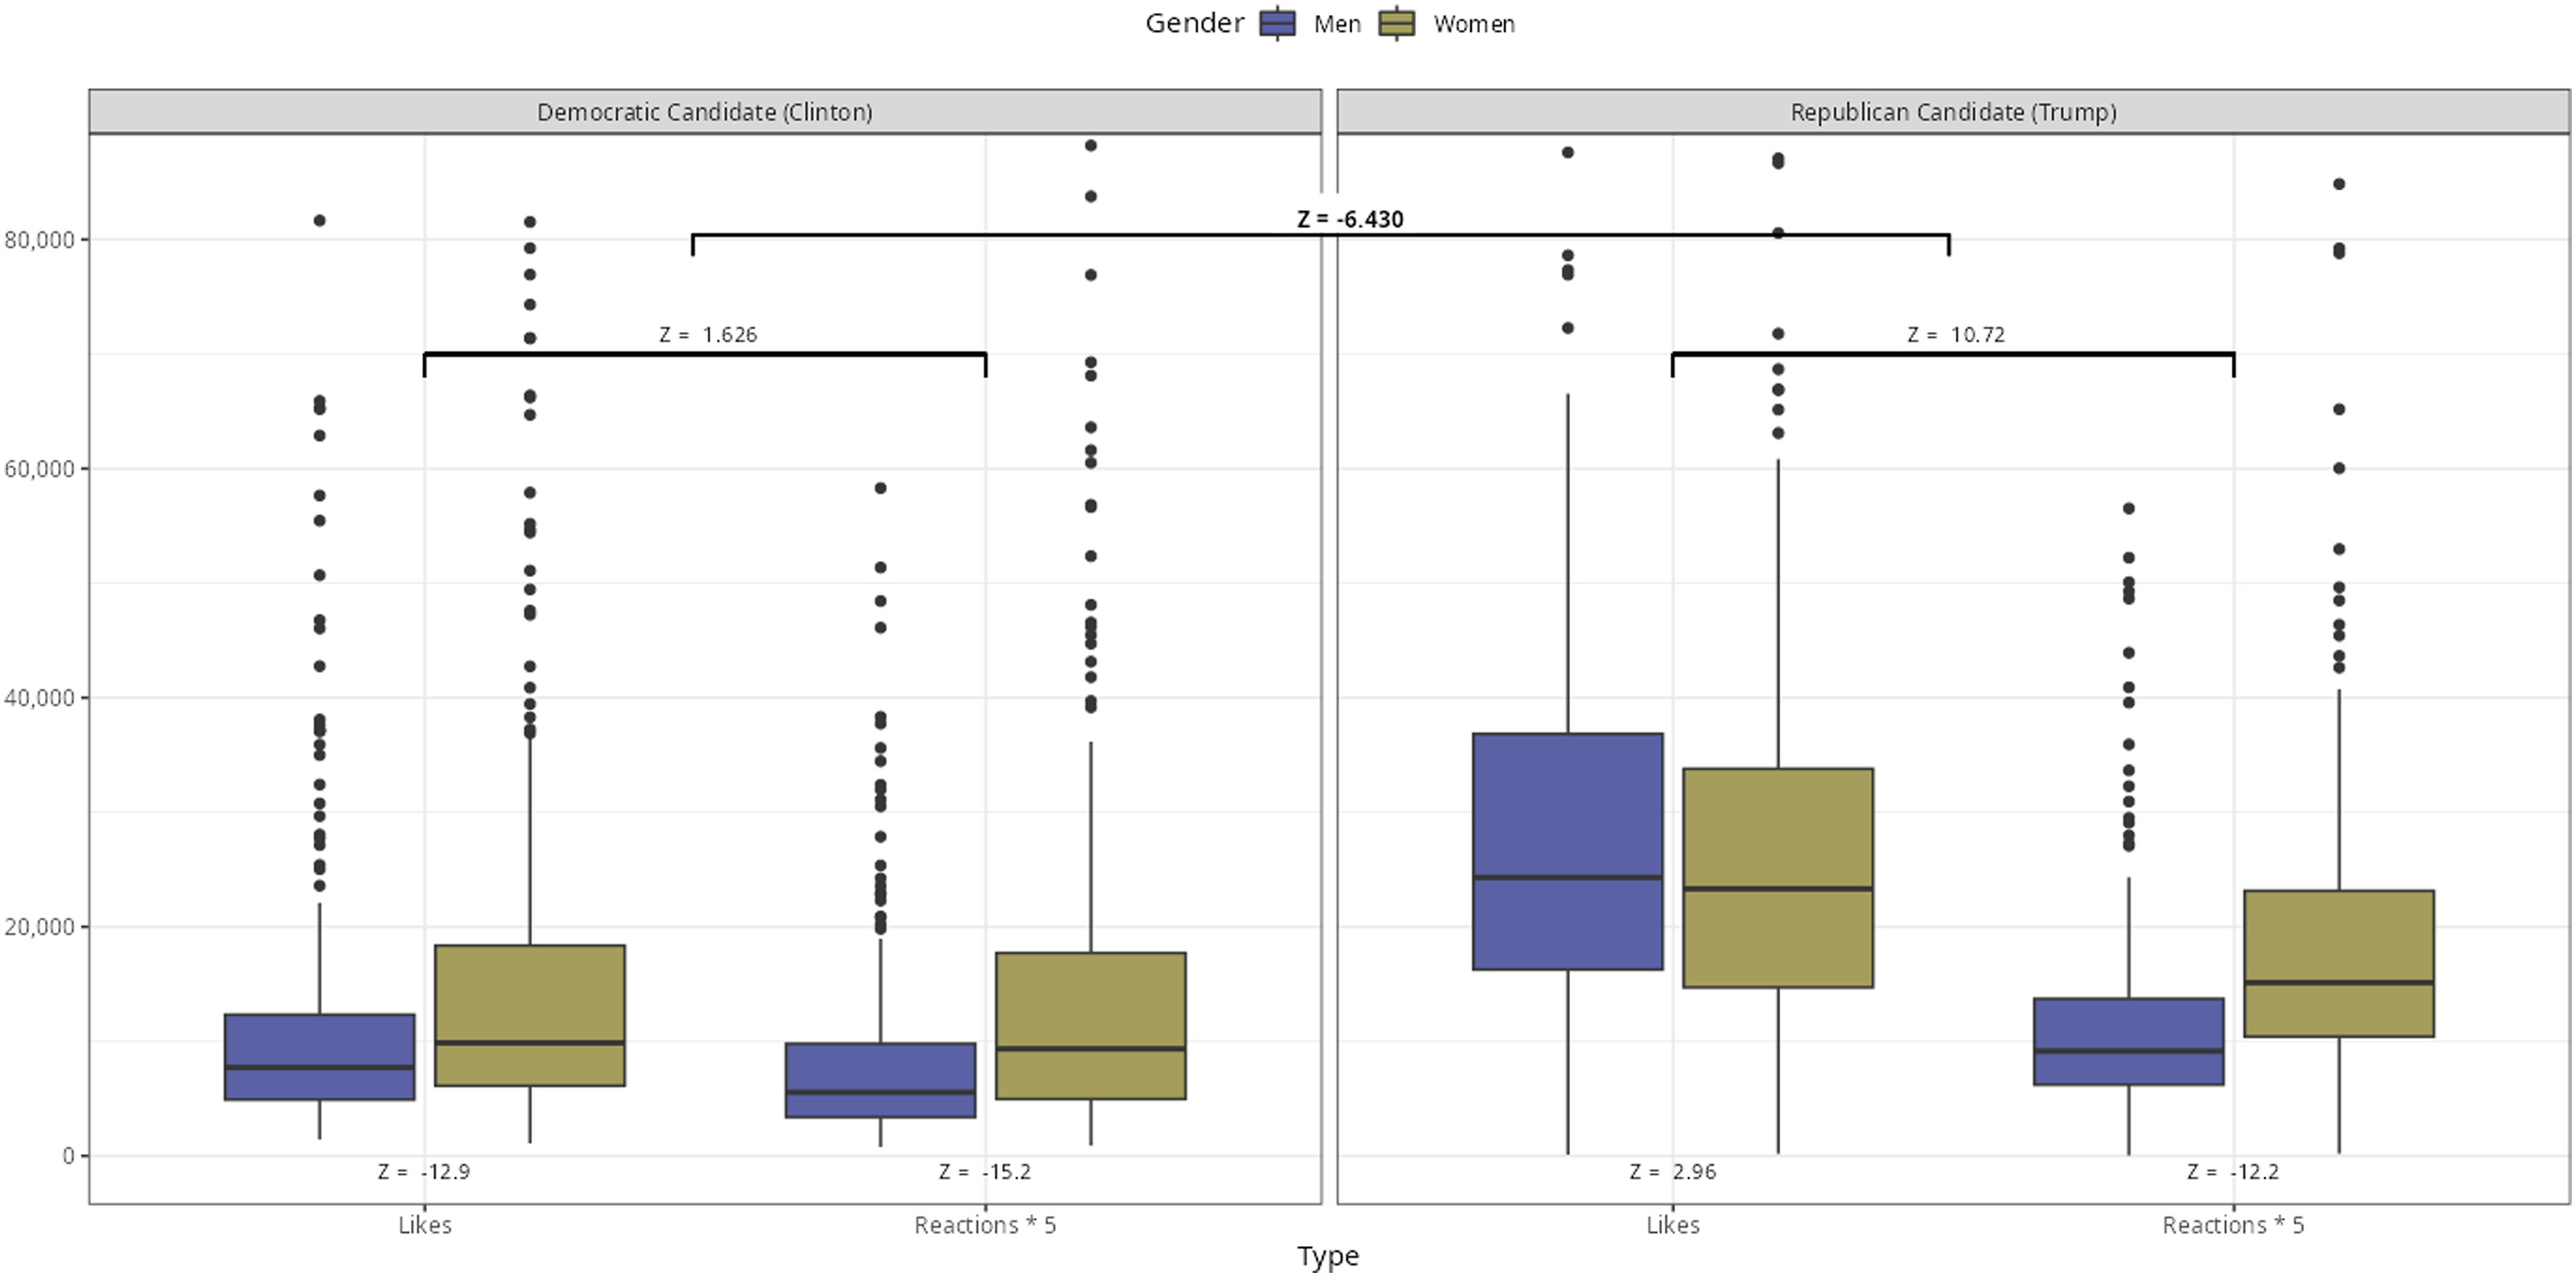
Starting with Figure 1, the results clearly show several ways in which men and women differed in their reactions to the candidates’ posts. Z scores above (1.645) indicate the population of engagements on the left is significantly (p > .05) greater than on the right; and scores below (−1.645) show the opposite. For example, the population of likes from men was statistically less than the population of likes from women for Hillary Clinton in 2016 (Z = −12.9; p < .001). Women therefore tended to like Clinton’s posts more than men, as the box plots visually suggest. Conversely, Donald Trump saw a significant positive difference between his likes from men and from women (Z = 2.96, p < .001), that is, Trump’s posts generally received more likes from men.
As expected (i.e., RQ1), women show a considerably greater preference for emoji reactions in contrast to men in 2016. Clinton’s population of male reactions was substantially less than women’s (Z = −15.2; p < .001). Trump’s reactions from women similarly outnumbered men (Z = −12.2; p < .001).
As mentioned previously, reactions in these figures are multiplied by five—reflecting the algorithmic weighting they would have received during the future boosted time period. The statistical comparisons in Figure 1 between likes and reactions (i.e., the two bars above the candidates) and total engagements from the candidates (i.e., the top long bar between the candidates), therefore reflect tests for algorithmic weighting before the scheme was implemented. Such a test (calculated via Stouffer method) is useful because it foreshadows potential differences that might be discernable in data during the boosted time period.
Take, for example, the statistical difference between the population of likes and reactions—multiplied by 5—for Hillary Clinton in 2016. Had the algorithm been implemented, her likes would have made up slightly more of her algorithmic weighting (Z = 1.626; p = .052) than the population of her reactions (multiplied by 5). In contrast, Trump’s likes would have substantially outweighed his reactions (multiplied by 5) had the boosted algorithm scheme been implemented (Z = 10.72; p < .001). As the top bar suggests, Clinton would have therefore relied far more on reactions than Trump (Z = −6.430, p < .001) under the boosted scheme.
Beyond the statistical tests, these imbalances are all visually apparent in Figure 1: women clearly used emoji reactions more than men in 2016 (RQ1) for both candidates. Hillary Clinton would also have relied much more on her emoji reactions under the new algorithmic weighting scheme than her opponent. Emoji use not only depends on gender, but seemingly also on party (i.e., RQ2), at least in 2016.
Figure 2 looks to determine whether a candidate’s (x axis) post tone (y axis) also moderates this gender gap. In this figure the five most used emoji reactions are displayed (ordered from left to right) to show notable variations within the emoji reaction set. Again, the visual results differ little from Figure 1, as women tend to outnumber men among the most popular reactions. What is also apparent from the figure is that emoji reactions differ depending on candidate tone: positive appeals prompt love reactions, and negative appeals provoke more angry reactions. Negative political appeals also appear to depress engagements and likes (along the y axis). This depression is notable in population tests between the total men’s and women’s reactions to positive and negative appeals—not pictured for readability. Clinton’s gender gap for positive emoji reactions (Z = −12.0; p < .001) shrinks when she goes on the attack (Z = −9.42; p < .001); Trump sees a more substantial decline, with his positive emoji gender gap (Z = −10.1; p < .001) declining as he went negative (Z = −6.26; p < .001). As the Z scores—and a visual survey of the data—shows negativity does appear to narrow the emoji gender gap, but women’s overall preference for emoji reactions persists. In this respect, tone may moderate the preference for certain emojis, but it does not appear to reverse women’s preference for emoji reactions in contrast to men (i.e., RQ2).
2018 and 2020 Campaign Regression Models.
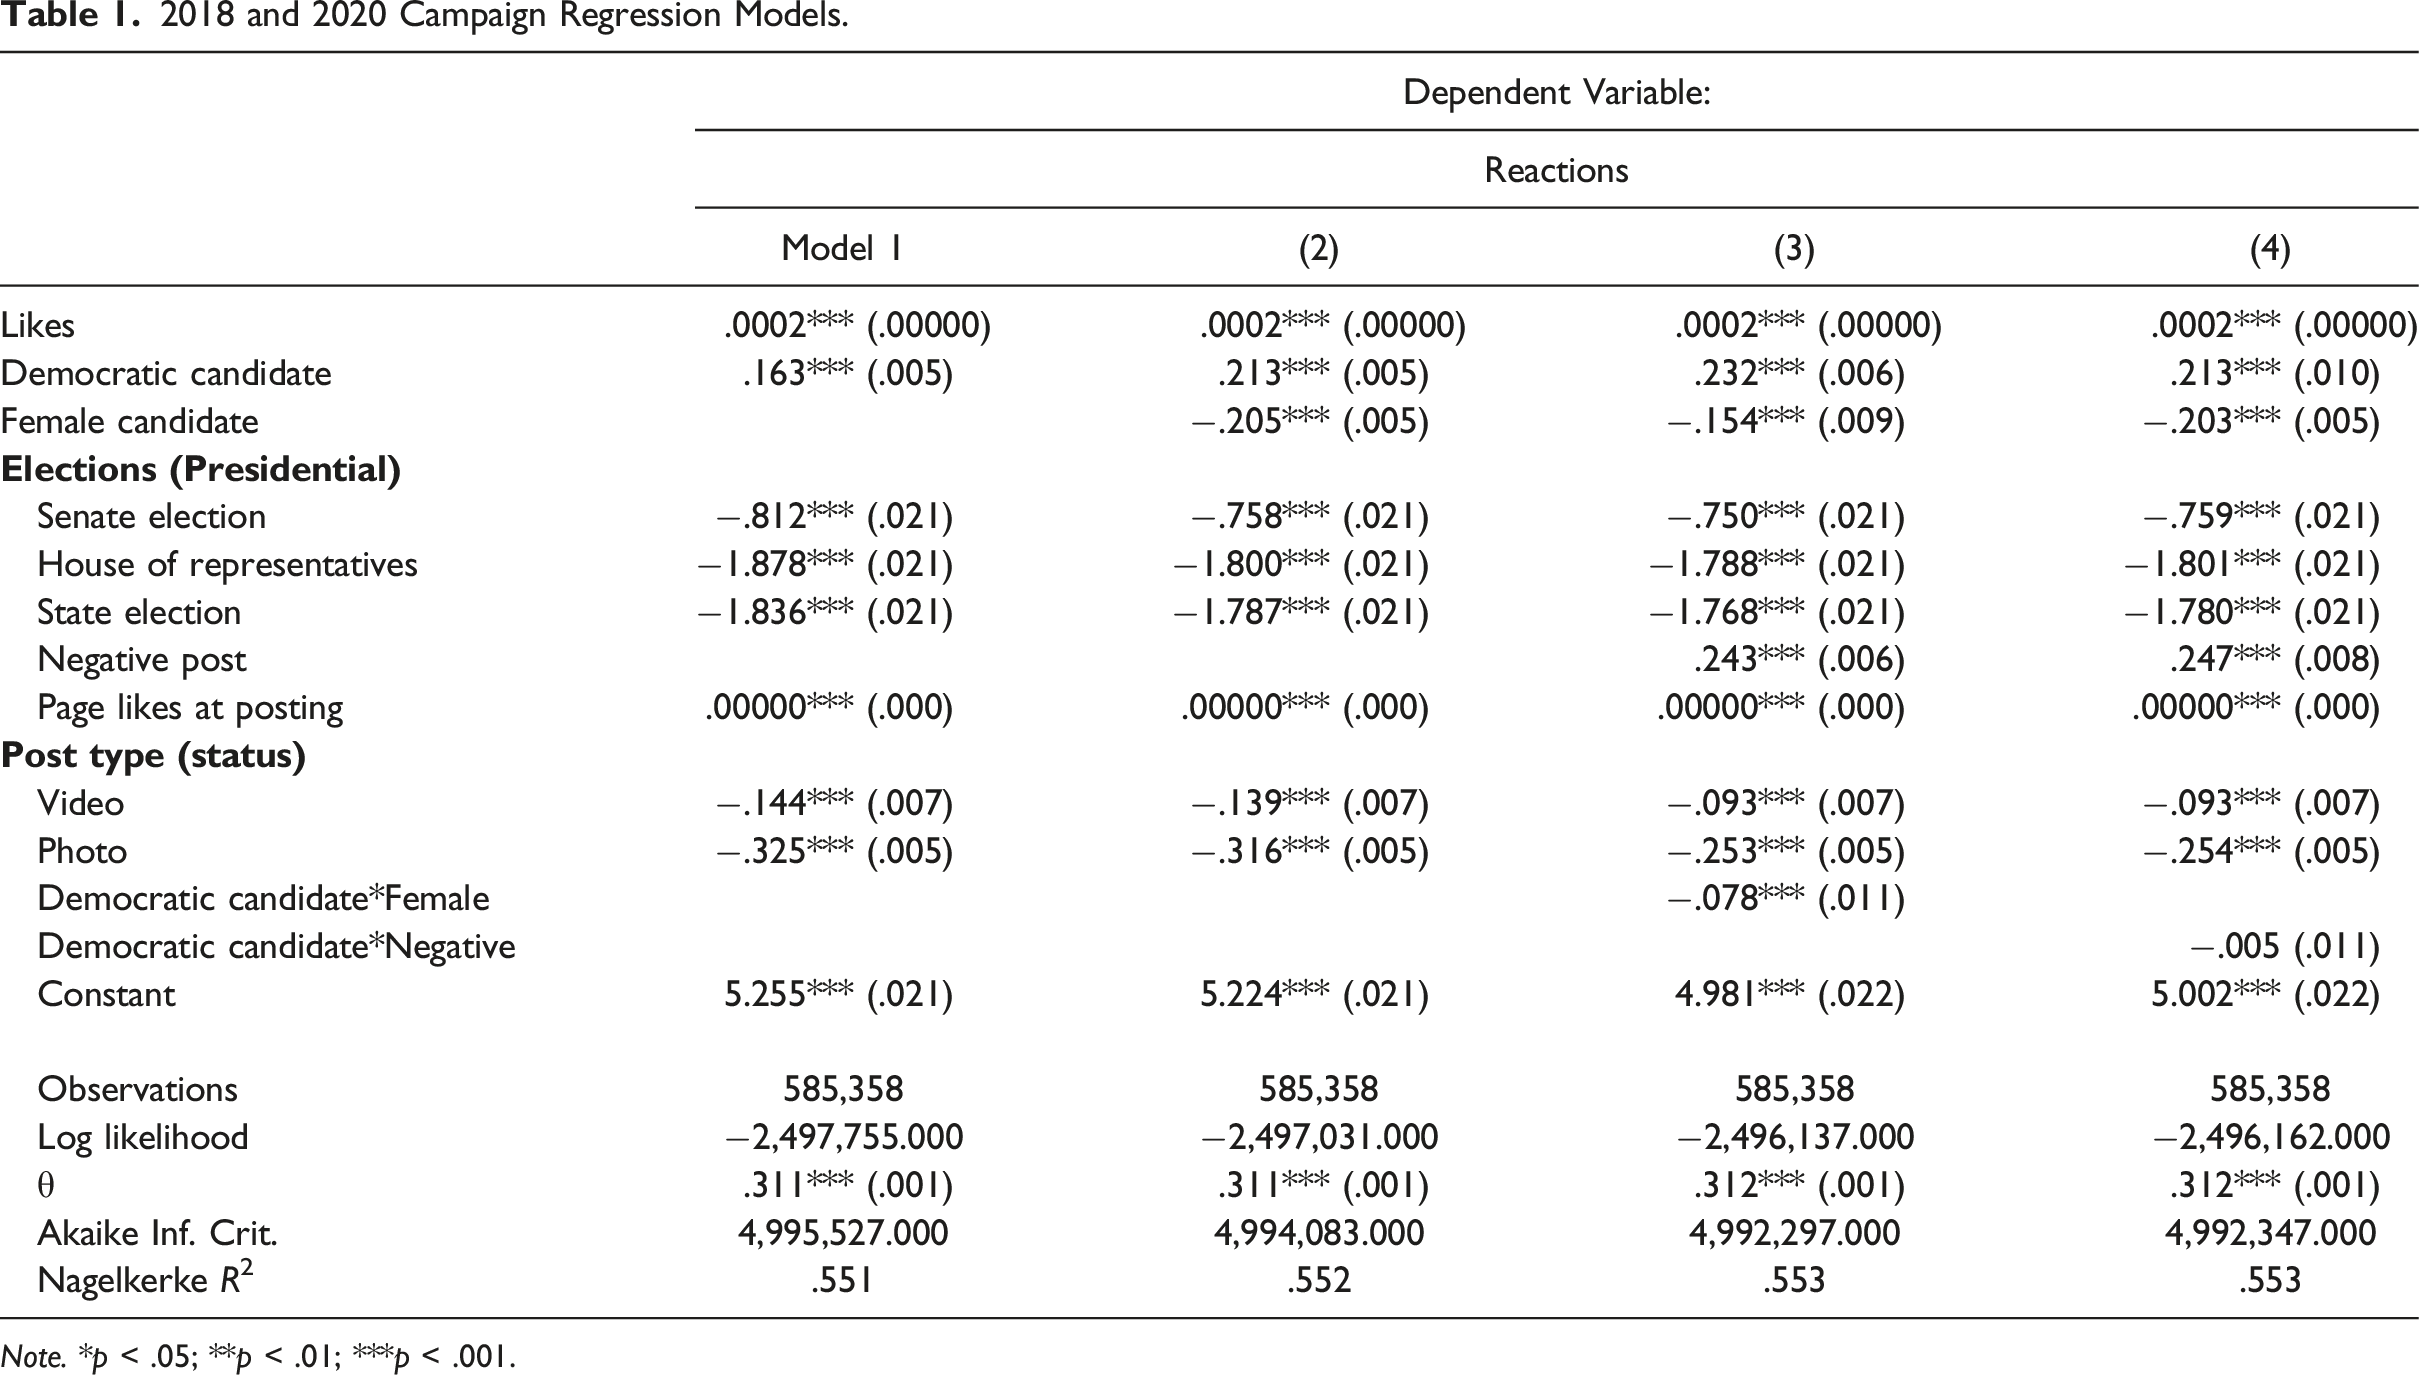
Note. *p < .05; **p < .01; ***p < .001.
Figure 3 visualizes this considerable difference between emoji reactions for Democratic and Republican posts between 2018 and 2020. The figure has been zoomed in on the bulk of all reactions within the dataset. As before, reactions (y axis) are multiplied by 5 in the figure to reflect algorithmic weighting during the boosted time period. The dashed black line represents an equal weighting between the amount of reactions and likes (i.e., y = x). Posts below the line rely (proportionally) more on likes than reactions under the new weighting scheme; conversely, posts above the line see more of an algorithmic boost from reactions than likes. Republican posts appear to straddle the dashed line, suggesting their candidates tend to see equal proportions of likes and reactions. A line of best fit (not pictured) reflects this (Reactions = 1.3*Likes + −.03, R2 = .74). Conversely, Democratic posts congregate well above this dashed line of equivalence, something also reflected in the line of best fit (Reactions = 1.7*Likes+56; R2 = .70). Indeed, beyond the statistical evidence, a simple visual assessment of the figure confirms that party plays a moderating factor in emoji preference. The aggregate data is therefore consistent with individual results from 2016 (i.e., RQ3). As Figure 3 shows, Democratic candidates continue to see a much higher proportion of emoji reactions to likes across thousands of candidates during the algorithmic boosted period between 2018 and 2020. 2018–2020 federal and state candidate likes and reactions (x5) by party.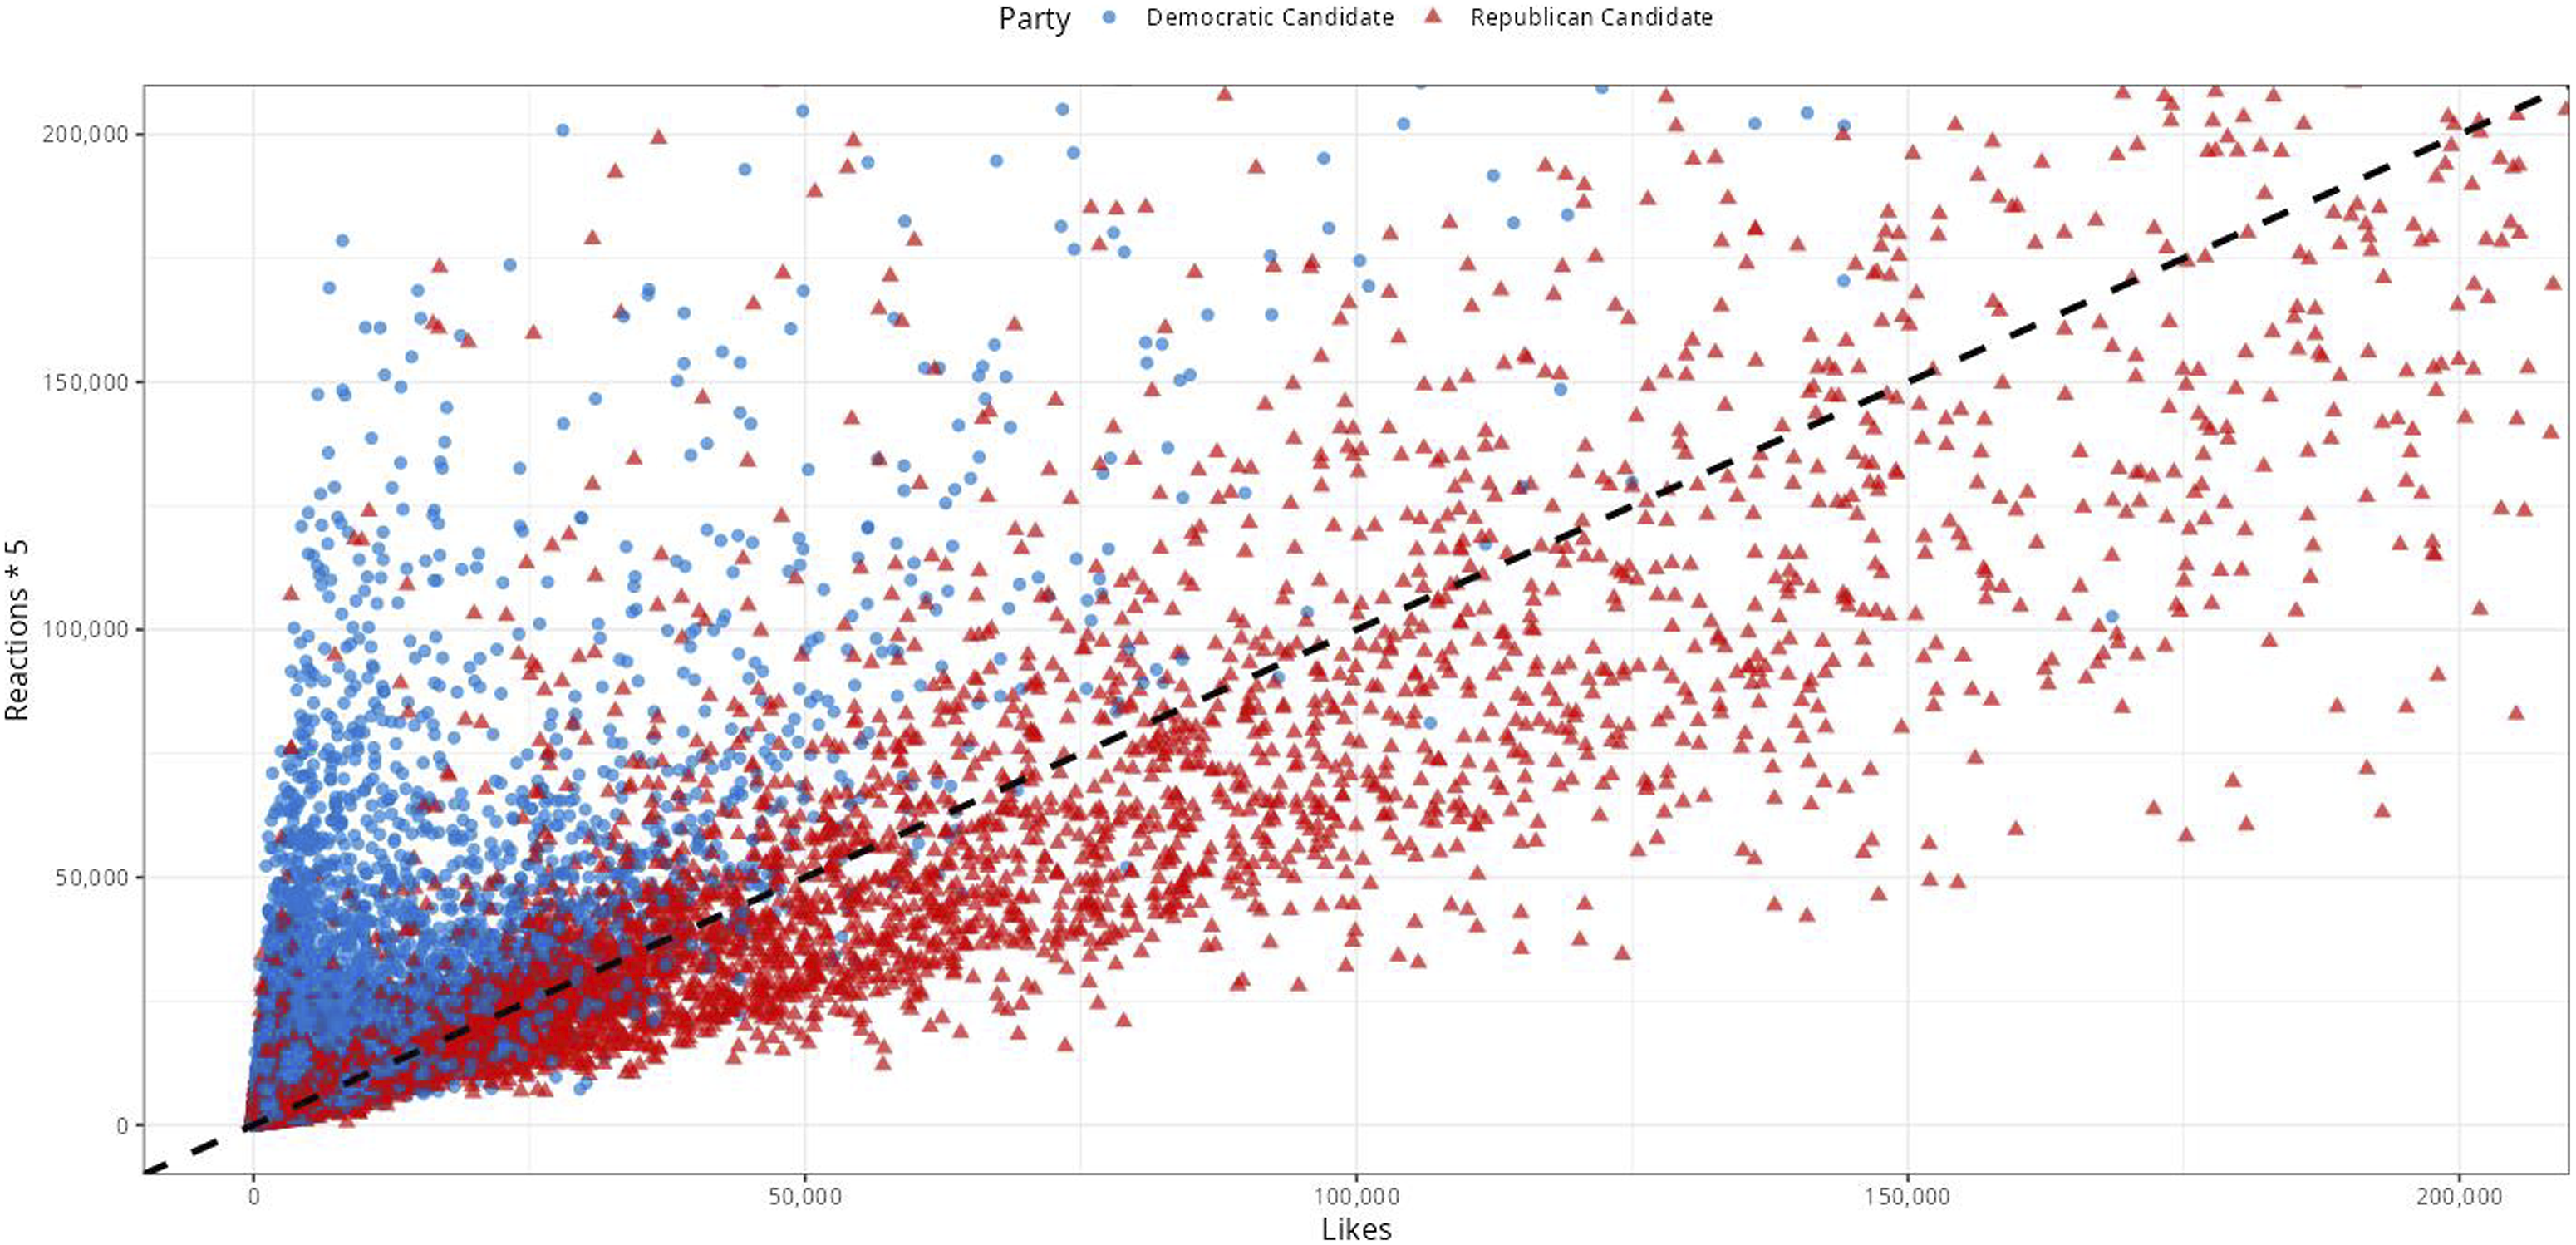
Discussion and Conclusion
This study was designed to investigate the presence of a (potentially moderated) gender gap in emoji reactions during US political campaigns on Facebook. In doing so, the current paper proposed three research questions and enlisted individual and aggregate level data across millions of observations, thousands of candidates, and three election cycles. I now turn to answering those three research questions.
The data in this study shows a clear gender gap in Facebook emoji reactions to political appeals during the 2016 campaign. Women considerably outnumbered men in their preference for emoji reactions for both 2016 candidates. This result is consistent with theoretical expectations, and the existing (non-political) evidence that women may exhibit a greater preference for emoji reactions than men on Facebook.
The results also showed party—and to some degree—negativity moderated the gender gap in 2016. Women’s emoji reactions, for example, made up a much more sizable proportion of total engagements for Clinton than for Trump. Negativity appeared to provoke different sets of emoji reactions (e.g., positive appeals prompt loves and negatives cue angries). While negative appeals slightly diminished the gender gap in emoji reactions for both candidates, women continued to significantly outnumber men in total emoji reactions for both Clinton and Trump despite this dampening effect. Both these 2016 results (i.e., party and tone as moderating factors) suggest that party demographics, men’s and women’s differing tolerance for negative campaigns, and perhaps even candidate gender may offer some theoretical explanation for this behavior.
The results clearly depict a gender gap in engagements in 2016—driven by women’s preference for emoji reactions. Party, in 2016, also moderated individual preference for likes over emojis: Trump's (predominantly male) likes far outweighed the emoji reactions he received, but Clinton’s likes only slightly outweighed the reactions her posts received. If the 2016 data were an aberration due to the unique nature of that contest, then we might expect to see a more equivalent distribution of emoji reactions in future contests across both parties. Figure 3 shows quite the opposite. Posts from Democratic candidates from 2018 to 2020 continue to produce emoji reactions at greater proportions of their total engagements than Republicans—a visually unmistakable conclusion depicted in Figure 3. Across 2.5 thousand candidates, 2 years’ worth of election cycles, and over a half million observations, the results are largely consistent with RQ1 and RQ2. A brief word on limitations is needed here, before drawing any further conclusions. The obvious standard caveats of discussing causation in observational versus experimental studies of campaigns unquestionably apply (Arceneaux, 2010). On a related point, one cannot untangle a number of endogenous factors: for example, candidates might have wider reach for a variety of reasons that result in greater emoji reactions (or likes); indeed, candidate characteristics, and the nature of their individual appeals, might also prompt more (or fewer) emoji reactions. Nevertheless, the power of applying the findings of millions of individual behavioral observations in a complementary fashion to subsequent elections across several thousand candidates permits exploration of these research questions and allows for at least some limited generalizability. Provided the aforementioned caveats, this study’s findings persistently point to a gender emoji gap, and one that is partially moderated by tone and party. Theoretically there was a great deal of reason to suggest such a gap might exist, though to date no work had sought to document that difference, and this paper appears to confirm that prospect. Having now produced evidence of an emoji gender gap, it may be tempting to speculate on the potential effects of this gap: however, the black box nature of Facebook’s algorithm prohibits such discussions. We simply cannot know from this study whether such a gap had any notable influence; meaning, that work is best left to future research. Future research, therefore, could look to address such a question in various ways—should they have access to the platform’s inner workings and its vast data (much like the recently released 2020 research collaboration). That would be one valuable path forward for the future. Another fruitful endeavor might involve looking more closely at campaign communication itself: in what instances do parties and candidates elicit emoji reactions on Facebook? Do those—emoji provoking—messages produce algorithmic benefits (e.g., increased reach)? If so, what emoji appeals are the most successful, and do campaign strategists capitalize on that advantage or do they seem unaware (to build on a question from Muraoka et al., 2021)? These are just some of the many questions that might be addressed going forward. The hope is that this paper, and its evidence, has sparked further interest in this area of research.
Footnotes
Declaration of Conflicting Interests
The author is a member of a team that has been granted a Facebook research award. Those funds were not used for the current paper, nor did the award influence this study in any way.
Funding
The author(s) received no financial support for the research, authorship, and/or publication of this article.