Abstract
The smartphone increase in web surveys, coupled with technological developments, provides novel opportunities for measuring attitudes. For example, smartphones allow the collection of voice instead of text answers by using the built-in microphone. This may facilitate answering questions with open answer formats resulting in richer information and higher data quality. So far, there is only a little body of research investigating voice and text answers to open questions. In this study, we therefore compare the linguistic and content characteristics of voice and text answers to open questions on sensitive topics. For this purpose, we ran an experiment in a smartphone survey (N = 1001) and randomly assigned respondents to an answer format condition (text or voice). The findings indicate that voice answers have a higher number of words and a higher number of topics than their text counterparts. We find no differences regarding sentiments (or extremity of answers). Our study provides new insights into the linguistic and content characteristics of voice and text answers. Furthermore, it helps to evaluate the usefulness and usability of voice answers for future smartphone surveys.
Keywords
Introduction and Background
In recent years, self-administered web surveys have become an established data collection method in social science research and many adjacent research fields to gather information on people’s attitudes toward economic, political, and social phenomena. One reason for the increase in web surveys, compared to other established data collection methods, such as face-to-face and telephone surveys, is that web surveys provide some key advantages, including timeliness and cost-effectiveness (Callegaro et al., 2015). From a respondent perspective, web surveys are also tempting because they can participate with only few time and location restrictions (Mavletova, 2013). This particularly applies if they use mobile devices, such as smartphones, for web survey participation.
Another key aspect is that web surveys are highly amenable to technological advances (Couper, 2008; Struminskaya et al., 2020). Particularly, the increasing share of smartphone respondents (Gummer et al., 2019, 2023; Peterson et al., 2017; Revilla et al., 2016) opens novel ways for social science research. Smartphones contain a large number of built-in sensors, such as accelerometer, Global Positioning System (GPS) sensor, and microphone, that facilitate the collection of unprecedented data augmenting and extending the information collected about respondents in web surveys (Struminskaya et al., 2020). For instance, the built-in microphone of smartphones enables the administration of open questions with requests for voice instead of text answers (Gavras et al., 2022; Gavras & Höhne, 2022; Höhne & Claassen, 2024; Höhne et al., 2023; Revilla & Couper, 2021; Revilla et al., 2020; Schober et al., 2015).
The collection of voice instead of text answers to open questions in web surveys via smartphones is a promising method since respondents potentially get into open narrations, resulting in rich and in-depth information. For voice answers, respondents only need to press a recording button to record their answers. In contrast, for text answers, respondents need to type in text, which might be problematic for two reasons: first, some respondents find it difficult to express themselves in a written way (e.g., respondents with literacy issues). Grotlüschen et al. (2019), for instance, estimate that in 2018 about 6 million (or 12%) of the adult population in Germany could not sufficiently read and write and another 11 million (or 21%) showed misspellings even with commonly used words. Data from the UNESCO Institute for Statistics (2017) estimate that in 2016 about 750 million (or 14%) of the global population was illiterate. For these respondents, voice answers may represent a simple way to provide informed answers. Second, it might be burdensome to type in answers in text fields via keyboards. This particularly applies to smartphones with virtual on-screen keyboards shrinking the viewing space (Höhne et al., 2020; Revilla & Ochoa, 2016). In line with this reasoning, Gavras et al. (2022) and Revilla et al. (2020) found that voice answers to open questions are longer (in terms of words and characters, respectively) than their text counterparts. Correspondingly, Gavras et al. (2022) reported a higher number of topics mentioned by respondents in voice than in text answers. Revilla et al. (2020) also found that voice answers, compared to text answers, produce shorter response times (see also Lütters et al., 2018). This suggests that voice answers result in more information on the object of interest but require less time to answer. In turn, this indicates less respondent burden.
According to results reported by Gavras et al. (2022), voice answers seem to produce more extreme (positive and negative) sentiments than their text counterparts. This indicates that voice answers might be less affected by social norms and values and thus they may be a good way to reduce social desirability bias. The authors mainly see the answer delivery process responsible for this phenomenon. Whereas open questions with requests for text answers facilitate respondents to easily edit their typed in answers (as part of the response stage; Kreuter et al., 2008; Tourangeau et al., 2000), open questions with requests for voice answers usually do not allow respondents to edit (parts of) their recorded answers. As noted by the authors, however, their questions did not deal with overly sensitive topics, such as the deportation of delinquent refugees. Thus, they recommended to investigate text and voice answers to open questions on sensitive topics.
Even though voice answers represent a promising new way of collecting information on respondents’ attitudes in web surveys, they are also associated with some methodological drawbacks. For instance, Gavras and Höhne (2022) reported a break-off rate of about 45% for voice answers, compared to a break-off rate of about 13% for text answers. This finding corresponds to findings reported by Lütters et al. (2018) who found a break-off rate of about 50% for voice answers. There are also studies reporting higher item-nonresponse rates for voice than for text answers: about 25% for voice answers to about 5% for text answers (Gavras et al., 2022) and about 60% for voice answers 1 to less than 5% for text answers (Revilla et al., 2020). In addition, Revilla and Couper (2021) experimentally tested instructions explaining how to record voice answers in order to decrease item-nonresponse. However, the authors did not find a clear decreasing effect across instructions and item-nonresponse rates were still about 40%. These findings suggest that a substantial minority of respondents is not able and/or willing to provide voice answers in smartphone surveys.
During the last decade, technology has taken a leap allowing us to collect and store voice answers from large-scale web surveys. Developments in Natural Language Processing (NLP), Automatic Speech Recognition (ASR), and Text-as-Data methods also facilitate a proper handling and analysis of voice answers. However, so far, there are very few studies pointing out the merits and limits of voice answers collected in web surveys. Methodological research on the usefulness and usability of voice answers is still in its infancy. In this study, we contribute to the current state of research and present the results of an experiment in a smartphone survey conducted in the Forsa Omninet Panel in Germany. Specifically, we investigate the linguistic and content characteristics of text and voice answers to open questions on sensitive topics, such as the deportation of delinquent refugees. We look at number of words, lexical structure, sentiments, and topics. Preliminarily, we also report break-off and item-nonresponse rates, as part of the method section, to provide further insights on the level of missing data when it comes to text and voice answers.
Research Questions
As suggested by Gavras et al. (2022), text answers may trigger a memory-based processing. Accordingly, respondents build their attitudes (in the moment) when they are asked to assess an object of interest by creating a mental representation that is based on information retrieved from long-term memory (Zaller & Feldman, 1992). Memory-based processing fosters a rather intentional and conscious answering, which rests upon a comprehensive information basis. In contrast, voice answers may trigger an on-line processing (Gavras et al., 2022). This implies that respondents draw on a previously created and continuously updated on-line tally when they are exposed to an attitude object (Lodge et al., 1989; McGraw et al., 2003). On-line processing fosters a rather intuitive and spontaneous answering.
The answer delivery process is another aspect that must be considered when it comes to answering open questions with requests for text and voice answers. In the request for text answers, respondents need to type in their answers via a virtual on-screen keyboard. This might be burdensome, particularly for respondents with literacy issues. In addition, respondents can consider social desirability aspects and edit their typed in answers during the response stage (Kreuter et al., 2008; Tourangeau et al., 2000). Similar to the voice input functions of popular instant messengers, such as WhatsApp and WeChat, in the request for voice answers, respondents only need to press a recording button to record their answers. Because of their answer delivery process, voice answers cannot be easily edited (see endnote 3). In turn, this may impede considering social desirability aspects.
In the following, we outline our four research questions under investigation. Starting with the first research question, we compare the number of words of text and voice answers. Since open questions with requests for text and voice answers may trigger different cognitive processes (i.e., memory-based vs. on-line), they may also result in different lengths (Gavras et al., 2022; Revilla et al., 2020). In addition, the answer delivery process (i.e., typing in answers vs. recording answers) may affect the answer length. Thus, our first research question is as follows: (1) Do text and voice answers to sensitive open questions result in different numbers of words?
With respect to our second research question, we compare the lexical structure (i.e., lexical richness, lexical diversity, and readability) of text and voice answers. The memory-based processing associated with text answers results in a more intentional and conscious answering, whereas the on-line processing associated with voice answers results in a more intuitive and spontaneous answering. Consequently, text and voice answers to open questions may differ in terms of lexical structure and thus our second research question is as follows: (2) Do text and voice answers to sensitive open questions result in different lexical structures?
When answering open questions with requests for text answers respondents can take social norms and values into consideration and edit their typed in answers accordingly. When answering open questions with requests for voice answers respondents usually cannot easily edit (parts of) their recorded answers. The more intentional and conscious answering as well as the editing possibilities in text answers provide greater scope for social desirability bias than the intuitive and spontaneous answering (including the limited editing possibilities) in voice answers. However, when it comes to voice answers there is the chance that third parties overhear them, which may also foster socially desirable answer behavior (Couper et al., 2003; Smith, 1997). This particularly applies to open questions on sensitive topics. Text answers, in contrast, are less likely to be caught by third parties so that respondents’ answer behavior should be less influenced by third party effects. Our third research question is as follows: (3) Do text and voice answers to sensitive open questions result in different sentiments?
Finally, we compare the number of topics in text and voice answers. The differences in processing and delivering text and voice answers to open questions may affect the number of topics. For instance, it can be assumed that the intentional and conscious memory-based processing associated with text answers results in a higher number of topics mentioned by respondents than the intuitive and spontaneous on-line processing associated with voice answers. However, the potentially more burdensome answer delivery process associated with text answers (i.e., typing in text via a virtual on-screen keyboard) may prevent respondents from mentioning all relevant aspects that come to mind. Thus, our fourth research question is as follows: (4) Do text and voice answers to sensitive open questions result in different numbers of topics?
Method
Data Collection and Study Procedure
Data were collected in the Forsa Omninet Panel (omninet.forsa.de) in Germany in November 2021. Forsa drew a cross-quota sample from their online panel based on age (young, middle, and old) and gender (female and male). In addition, they drew quotas on education (low, medium, and high). The quotas were calculated based on the German Microcensus, which served as a population benchmark.
The email invitation to the web survey included information on the device to be used for participation (i.e., smartphone) and a link that re-directed respondents to the web survey. The first page of the web survey introduced the topic and outlined the overall procedure. In addition, it included a statement of confidentiality assuring that the study adheres to existing data protection laws and regulations. Prior informed consent for data collection was obtained by Forsa. Respondents also received financial compensation for their participation from Forsa.
In order to restrict web survey participation to smartphone respondents, we detected respondents’ device at the beginning of the web survey. Respondents who attempted to access the web survey using a non-smartphone device were prevented from proceeding to the web survey and were asked to use a smartphone.
At the beginning of the web survey, respondents were randomly assigned to one out of two experimental groups. The first experimental group received four open questions on sensitive topics with a request for text answers (text condition). The second experimental group received four identical open questions on sensitive topics but with a request for voice answers (voice condition).
Sample Description
Forsa invited 6745 respondents to take part in the web survey; no respondents were screened out because of full quotas or because they tried to access the web survey with another device than a smartphone. A total of 1681 respondents started the web survey, but 680 of them broke-off before they were asked any study-relevant questions. In the text condition 159 (about 24%) respondents broke-off, whereas in the voice condition 521 (about 51%) respondents broke-off.
Of the 1001 respondents, 500 took part in the text condition and 501 took part in the voice condition. Participation rate was about 15% among all invitees.
Sample Characteristics of the Text and Voice Conditions.
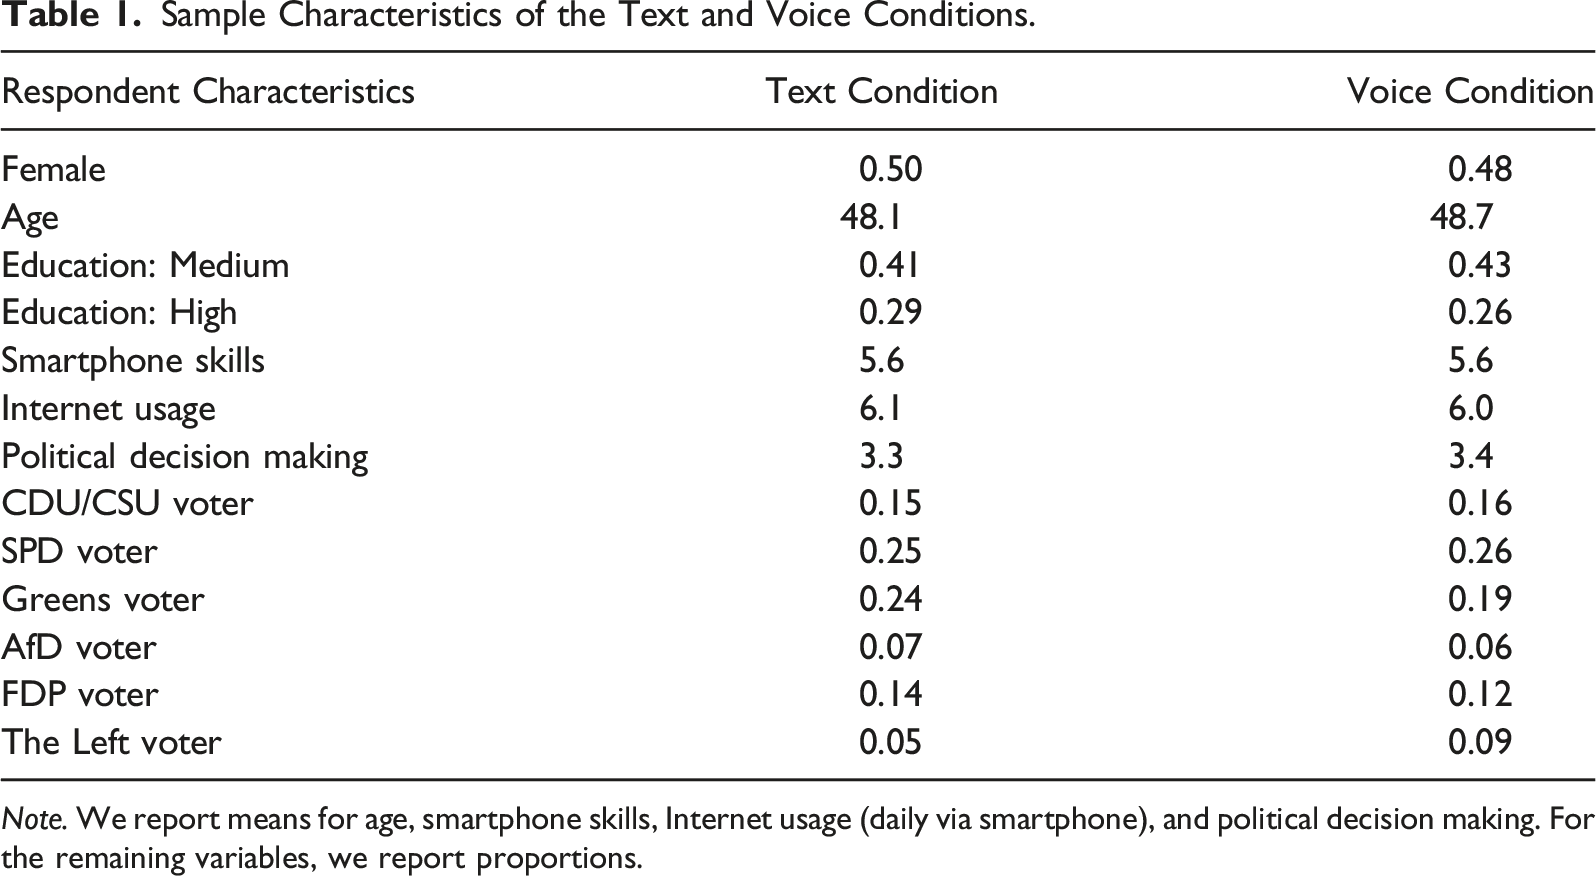
Note. We report means for age, smartphone skills, Internet usage (daily via smartphone), and political decision making. For the remaining variables, we report proportions.
Sensitive Open Questions With Requests for Text and Voice Answers
In total, we asked four open questions dealing with sensitive topics, such as the deportation of delinquent refugees. The questions were inspired by questions from established social surveys. The formulations were as follow (English translations): (1) What do you think about the fact that refugees who have committed crimes in Germany are not always deported to their home countries? (refugees) (2) What do you think about the fact that women in Germany are increasingly choosing their careers over starting a family? (working women) (3) What do you think about the public criticism that media reports in Germany are exaggerated and politically controlled? (media reports) (4) What do you think about the vaccination campaign of the German government to tackle the Corona pandemic? (vaccination campaign)
The order of the questions was randomized to limit the occurrence of question order effects and placed towards the beginning of the web survey (the original German wordings of the open questions are available from the first author upon request). We used an optimized survey layout that avoids horizontal scrolling and presented only one question per web survey page (single question presentation). Respondents could skip questions but were not provided with an explicit non-substantive answer option, such as “don’t know” or “no opinion.” The open questions were preceded by answer instructions that were tailored to the requests for text and voice answers (see Appendix A for English translations of the instructions).
For recording respondents’ voice answers, we implemented the open-source “SurveyVoice” (SVoice) tool (Höhne et al., 2021) in the Forsa web survey system. SVoice is based on different program languages, such as JavaScript and PHP, and records respondents’ voice answers via the built-in microphone of smartphones, irrespective of the operating system (e.g., Android or iOS).
3
Figure 1 shows the design of the open questions with requests for text and voice answers. Example of the open question on the German vaccination campaign with requests for text (on the left) and voice answers (on the right). Note. In both conditions, respondents were asked to answer as detailed as possible. The text condition instructed respondents to enter their answer in the text field and the voice condition instructed respondents to press the microphone icon while recording their answer. We did not limit the number of characters in the text field or the recording time in the SVoice tool.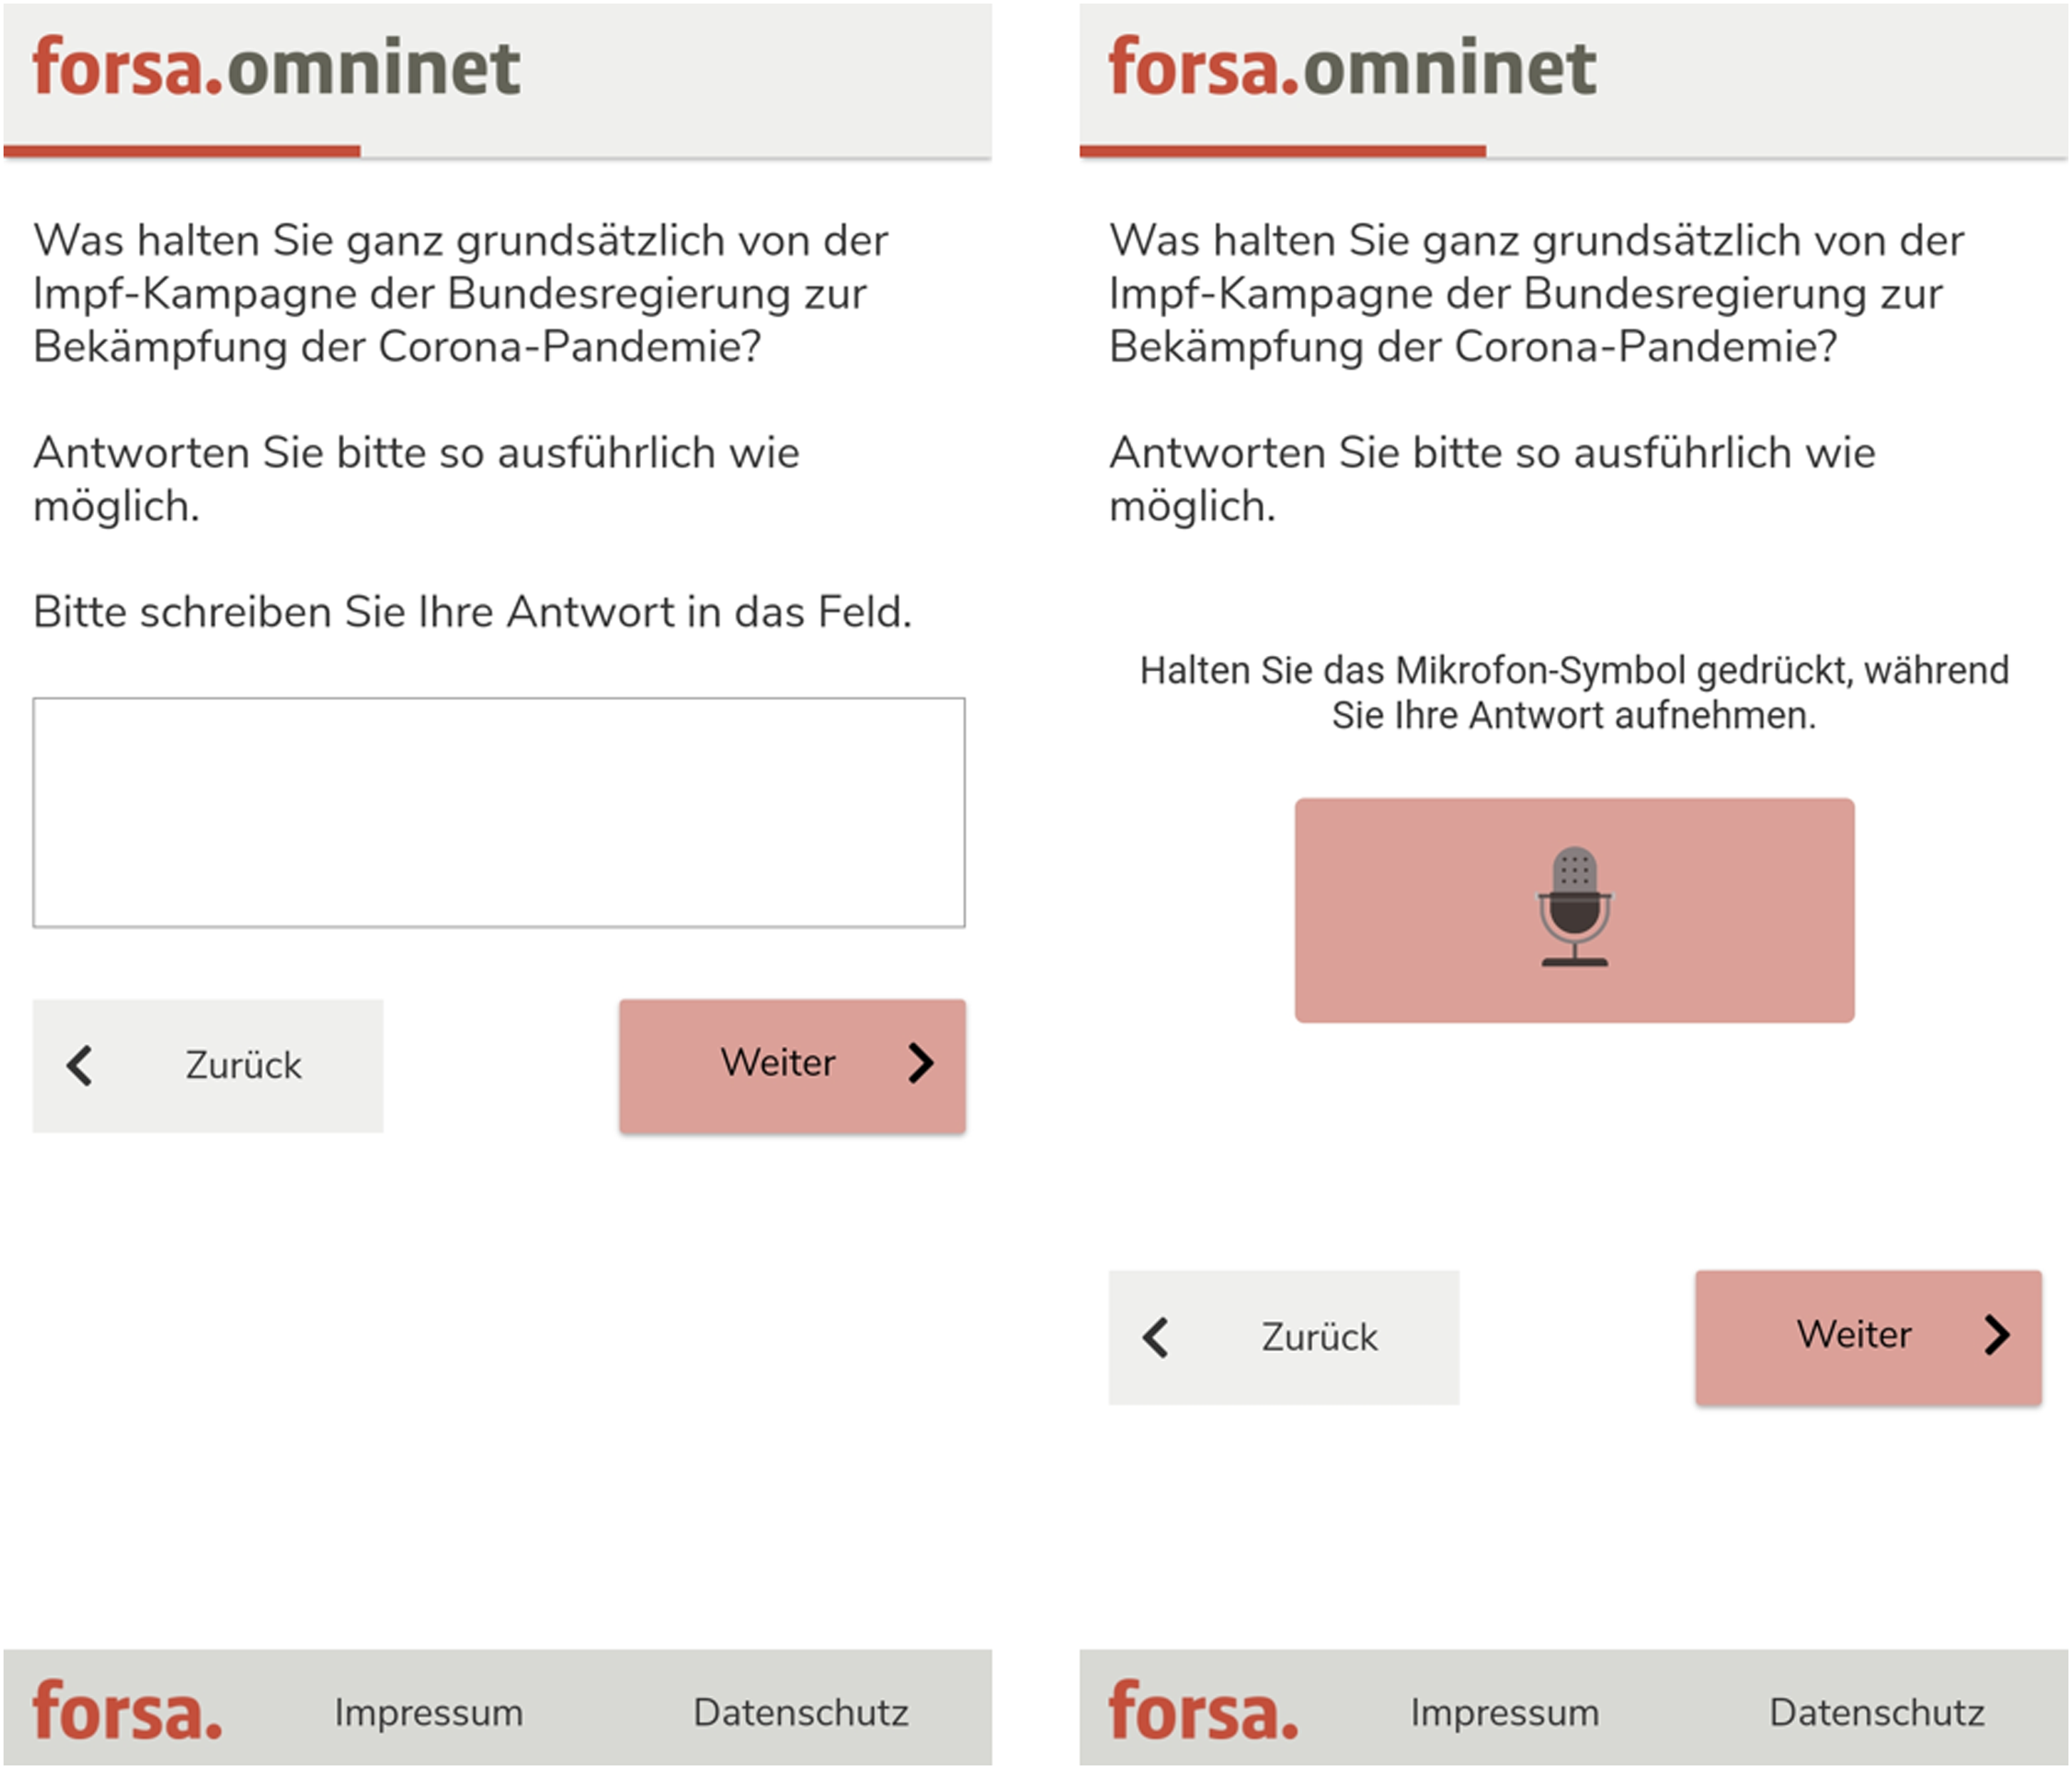
Results
Before applying text analyses, we automatically transcribed respondents’ voice answers into text by employing OpenAI’s automatic speech recognition system Whisper (Radford et al., 2023). As a quality assurance measure, a student assistant listened to about 20% of the recordings and systematically notated any differences between the recordings and the transcripts. The differences were assessed by the third author, revealing only minor discrepancies and an overall high transcription quality.
In what follows, we describe the analytical strategies in relation to our four research questions and report the results. Importantly, we only consider given answers—not including break-off and item-nonresponse. We compare text and voice answers in terms of length, lexical structure, sentiment, and topic. We conducted various robustness checks, such as hierarchical regressions (with questions nested in respondents), but the main conclusions did not change. For replication purposes, we released data including analysis script through Harvard Dataverse (see https://doi.org/10.7910/DVN/3KCPNK).
Research Question 1
To investigate our first research question, we count the number of words included in text and voice answers. 4 To this end, we use the quanteda package in R (Benoit et al., 2018) and count the number of “tokens” (or words) and determine the mean number of tokens. We then run two-sample t-tests with unequal variances to compare the number of words between text and voice answers.
Mean Answer Length (Number of Words) of Text and Voice Answers.
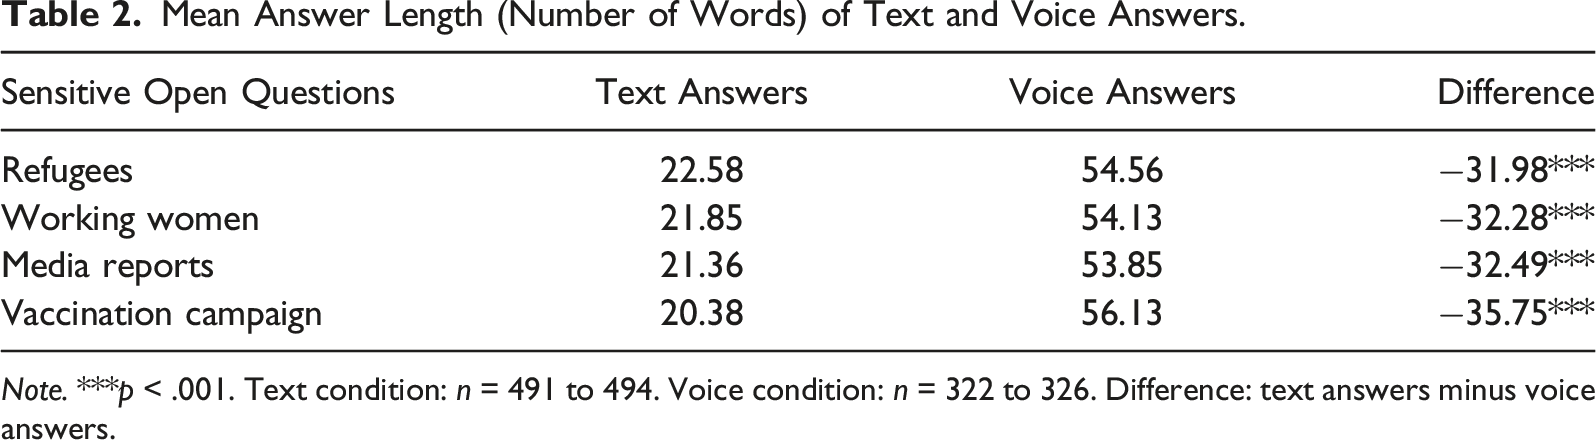
Note. ***p < .001. Text condition: n = 491 to 494. Voice condition: n = 322 to 326. Difference: text answers minus voice answers.
Research Question 2
In line with Benjamin (2012), we analyze lexical richness, lexical diversity, and readability. This is done to determine the level of lexical structure of text and voice answers. We analyze the three measures separately to simplify the interpretation of the results and, most importantly, to not confound any results. Specifically, using the quanteda.textstats package in R (Benoit et al., 2018) we compare Yule’s K (lexical richness), Type-Token Ratio (lexical diversity), and Flesch Reading Ease (readability) and run two-sample t-tests with unequal variances, except for the Flesch Reading Ease comparison of the question on working women where we run a t-test with equal variances: (1) Yule’s K determines lexical richness and varies between 0 and ∞. Higher scores stand for lower lexical richness. (2) Type-Token Ratio (TTR) determines lexical diversity and varies between 0 and 1. Higher scores stand for higher lexical diversity. (3) Flesch Reading Ease (FRE) determines readability and varies between –∞ and 121.22. Higher scores stand for easier readability.
Lexical Structure—Lexical Richness, Lexical Diversity, and Readability—of Text and Voice Answers.
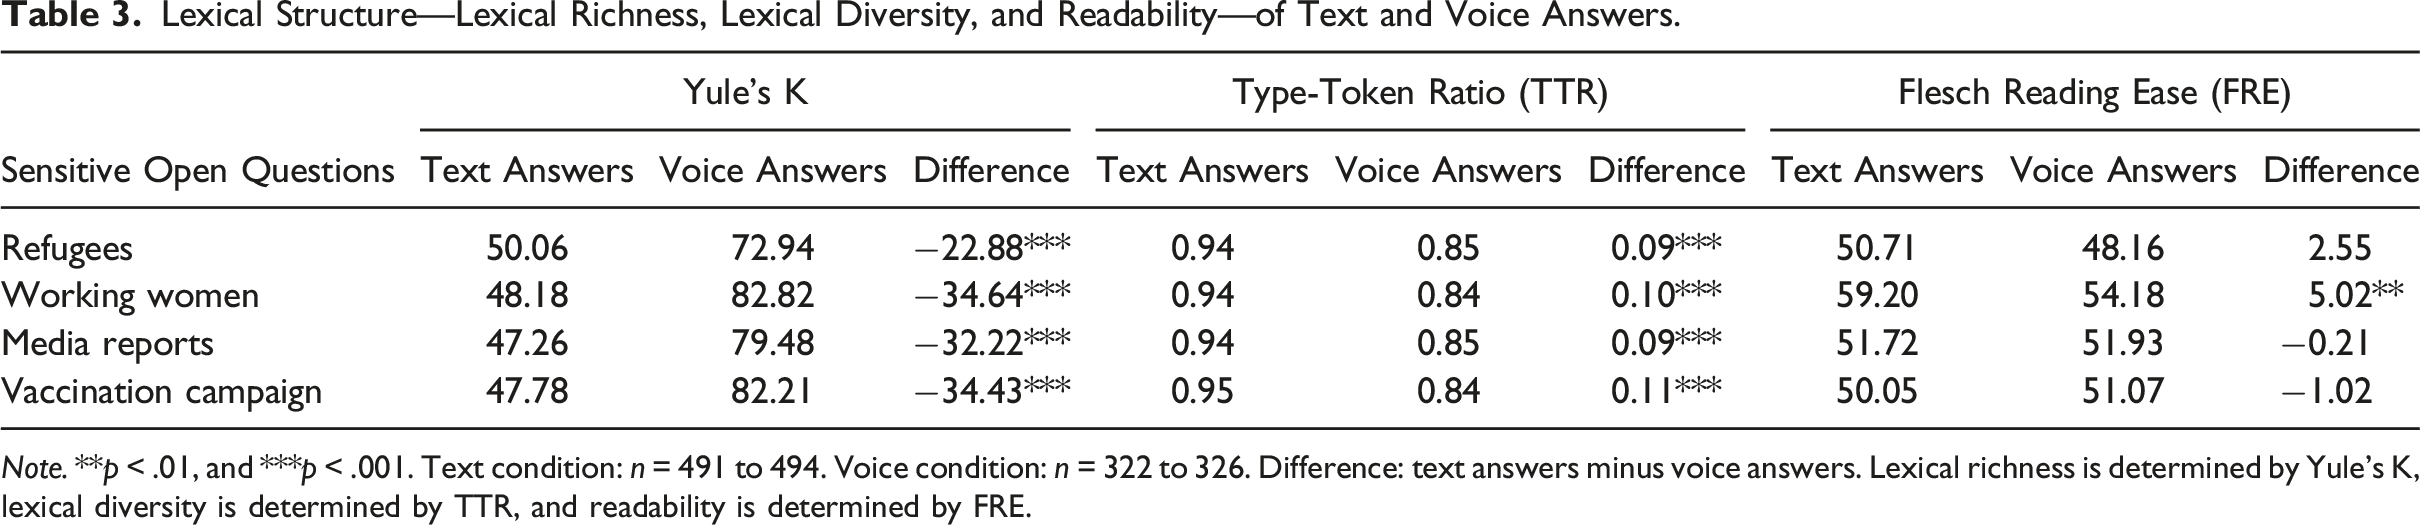
Note. **p < .01, and ***p < .001. Text condition: n = 491 to 494. Voice condition: n = 322 to 326. Difference: text answers minus voice answers. Lexical richness is determined by Yule’s K, lexical diversity is determined by TTR, and readability is determined by FRE.
Research Question 3
To investigate the extremity of text and voice answers, we run sentiment analyses (Pang & Lee, 2008). To this end, we use the German sentiment vocabulary SentiWS v2.0 developed by Remus et al. (2010), containing about 3500 basic word forms and about 30,500 inflections. In SentiWS, words (including inflections) are assigned scores—varying between −1 (negative) and 1 (positive)—that suggest the strength of the sentiment-afflicted words.
We compare the mean logged scores between text and voice answers. In doing so, we run two-sample t-tests with equal variances for the questions on refugees, working women, and vaccination campaign and a two-sample t-test with unequal variances for the question on media reports.
Sentiment Ratio of Text and Voice Answers.
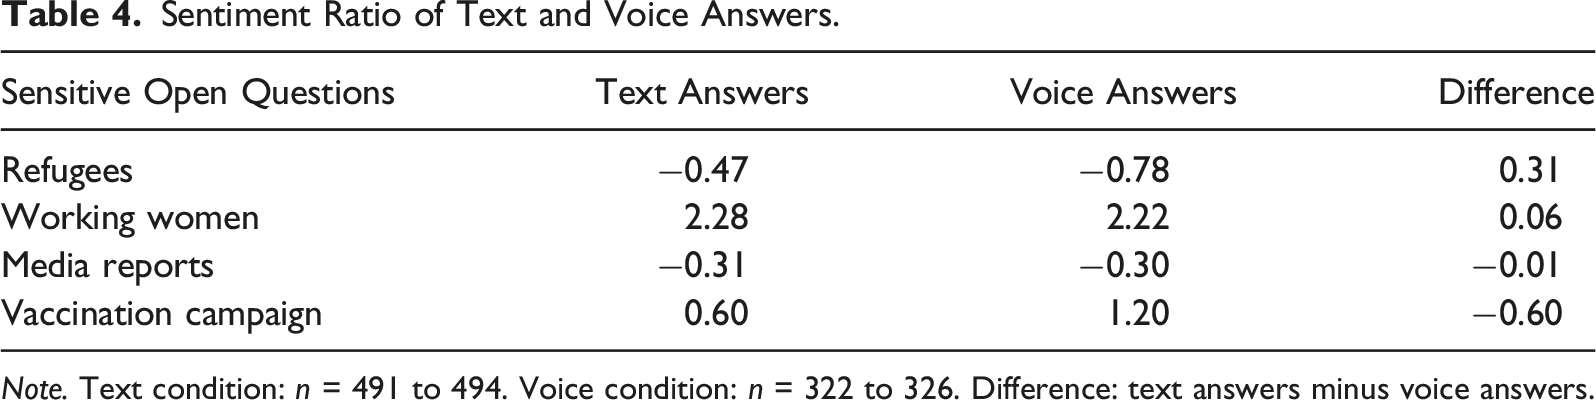
Note. Text condition: n = 491 to 494. Voice condition: n = 322 to 326. Difference: text answers minus voice answers.
To provide some further descriptive evidence, we also estimated the correlation matrices of the sentiment scores (see Appendix B for correlation matrices). The results indicate that the sentiment scores are marginally correlated.
Research Question 4
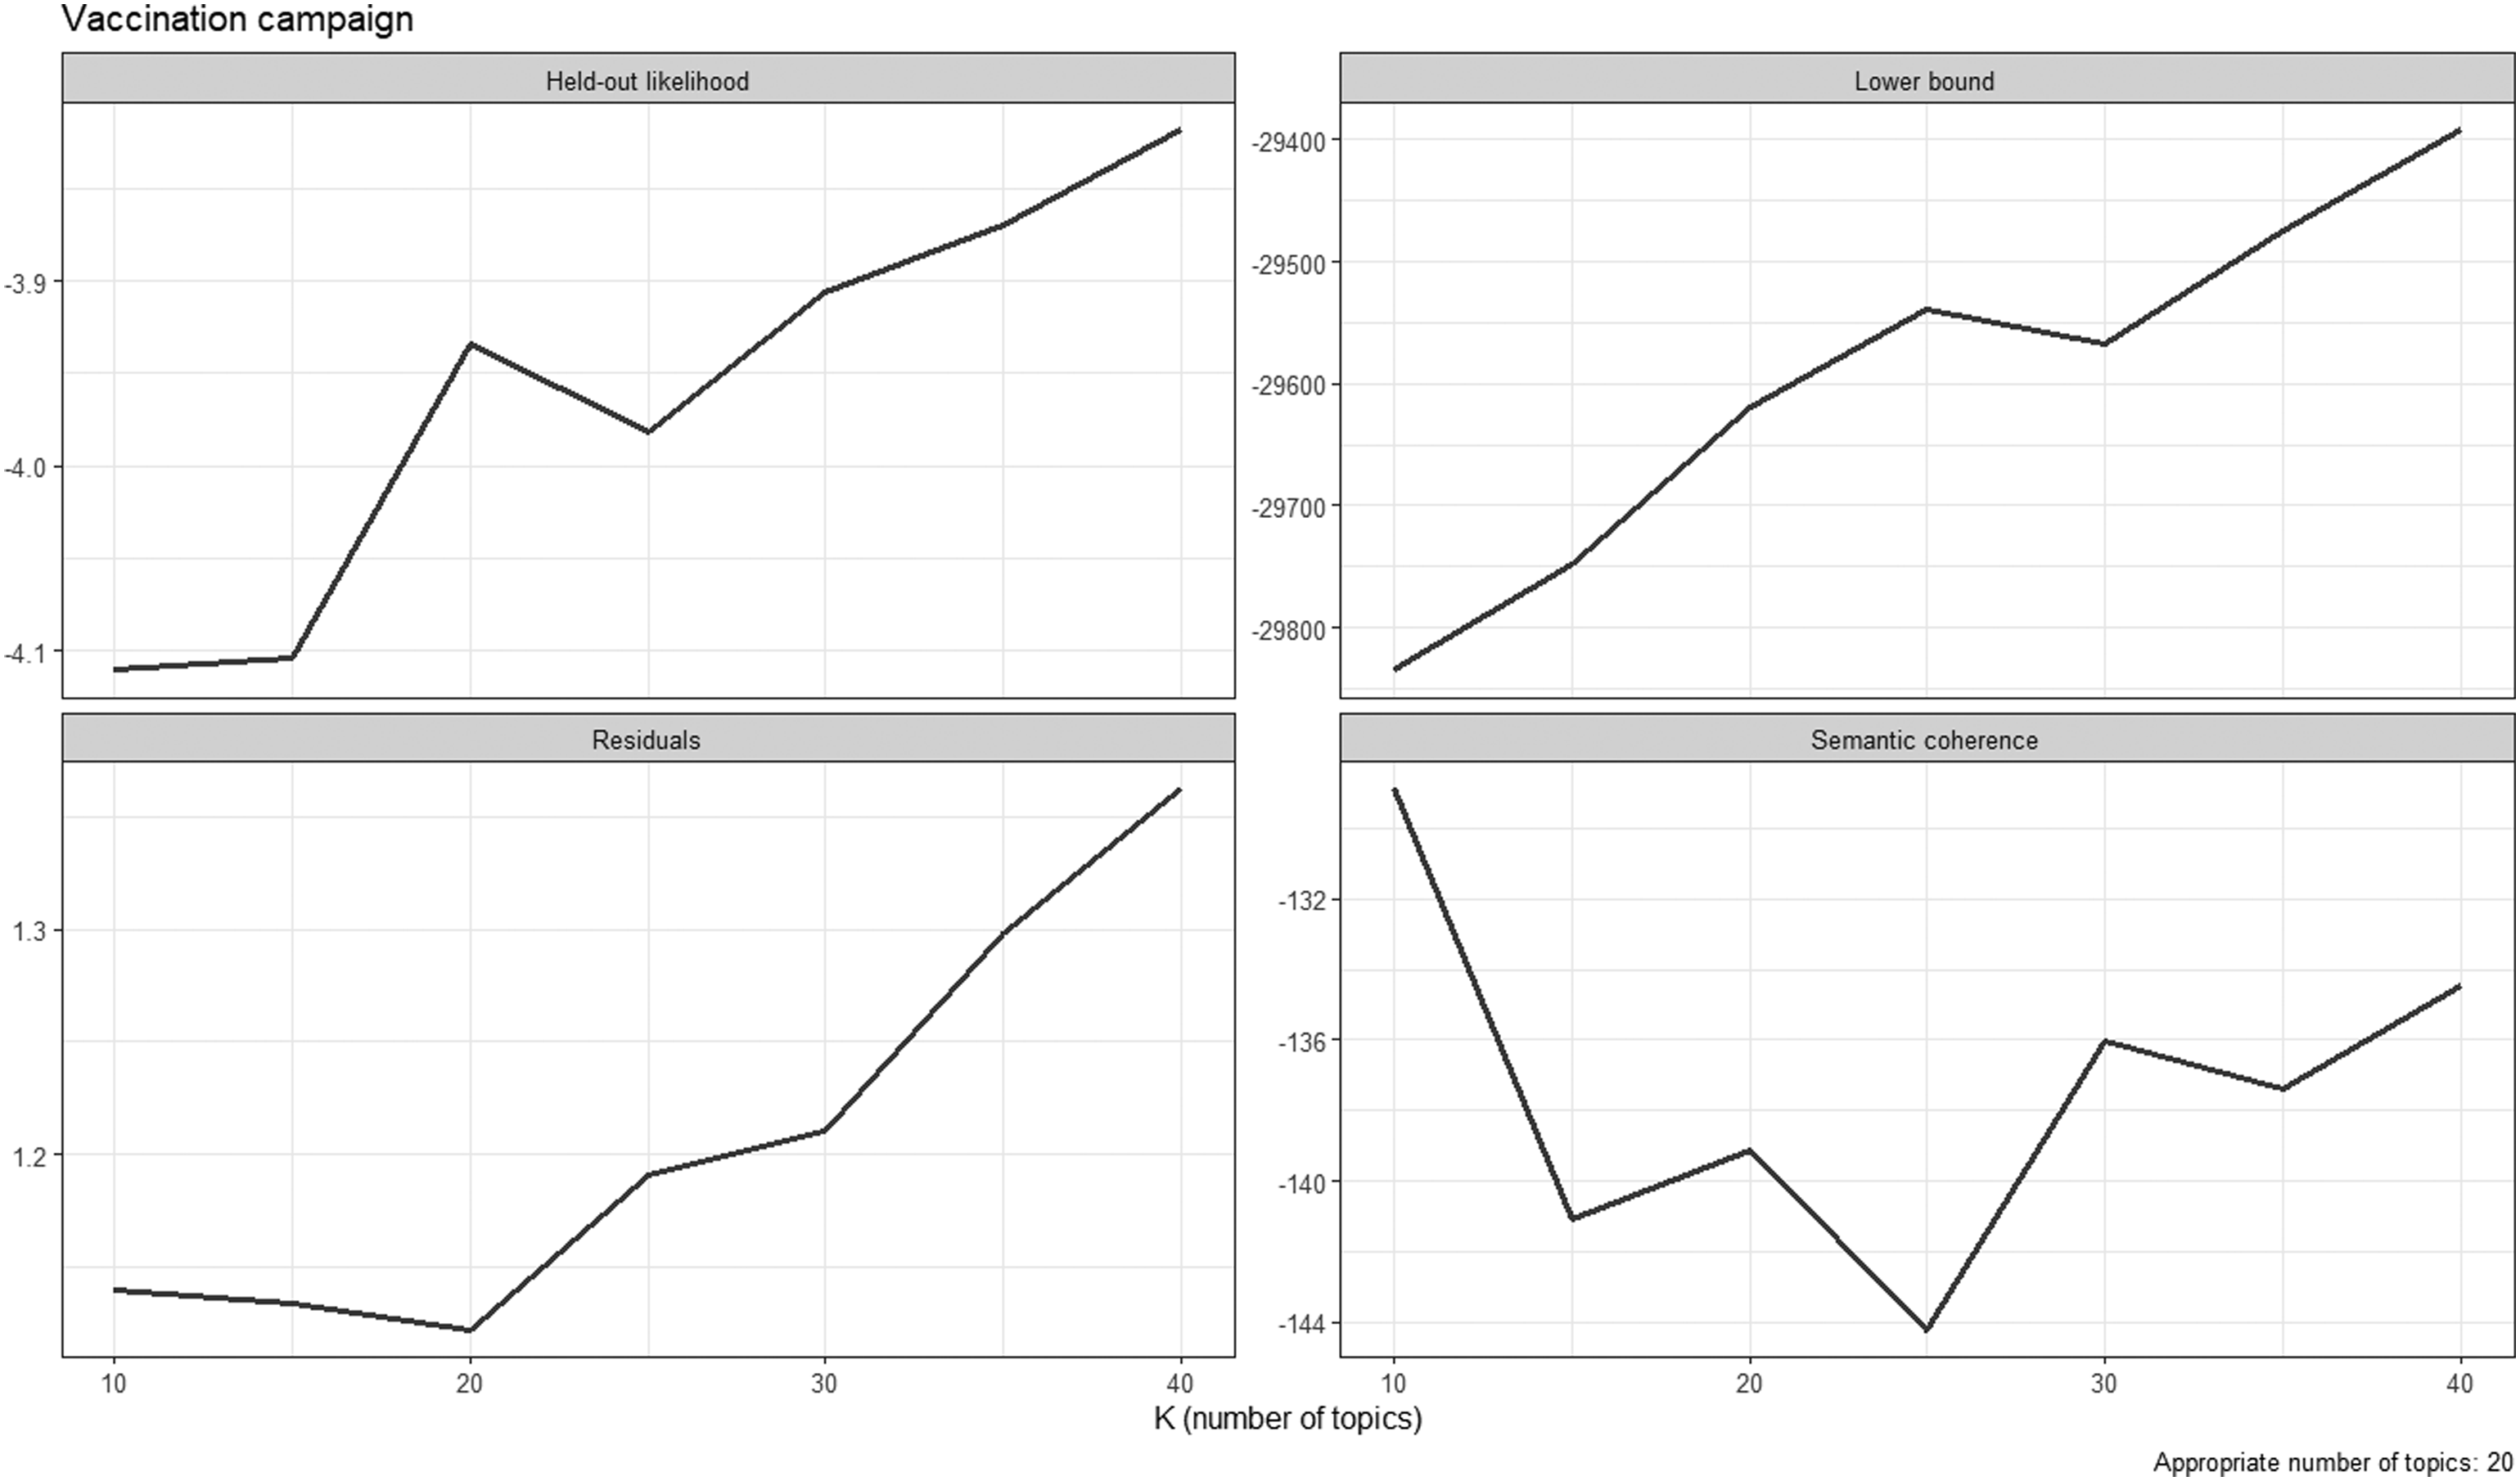
Finally, we conduct structural topic models (STMs; Roberts et al., 2014) employing the stm package in R. The stm package infers the number of topics mentioned by respondents. Importantly, we only take words into account that were mentioned in more than ten answers. 5 We drop stop words and count the number of topics for all answers to which (at least) 10% of the individual answers are attributed. 6 In line with Roberts et al. (2019), Wallach et al. (2009), and Weston et al. (2023), we employ the following diagnostic criteria for inferring the number of topics: held-out likelihood, residuals, semantic coherence, and level of lower bound (see Appendix C for diagnostic plots). We calculate the number of topics for text and voice answers and run two-sample t-tests with equal variances for the questions on refugees, working women, and media reports and a two-sample t-test with unequal variances for the question on vaccination campaign. We then descriptively compare the topics mentioned in text and voice answers.
Mean Number of Topics in Text and Voice Answers.
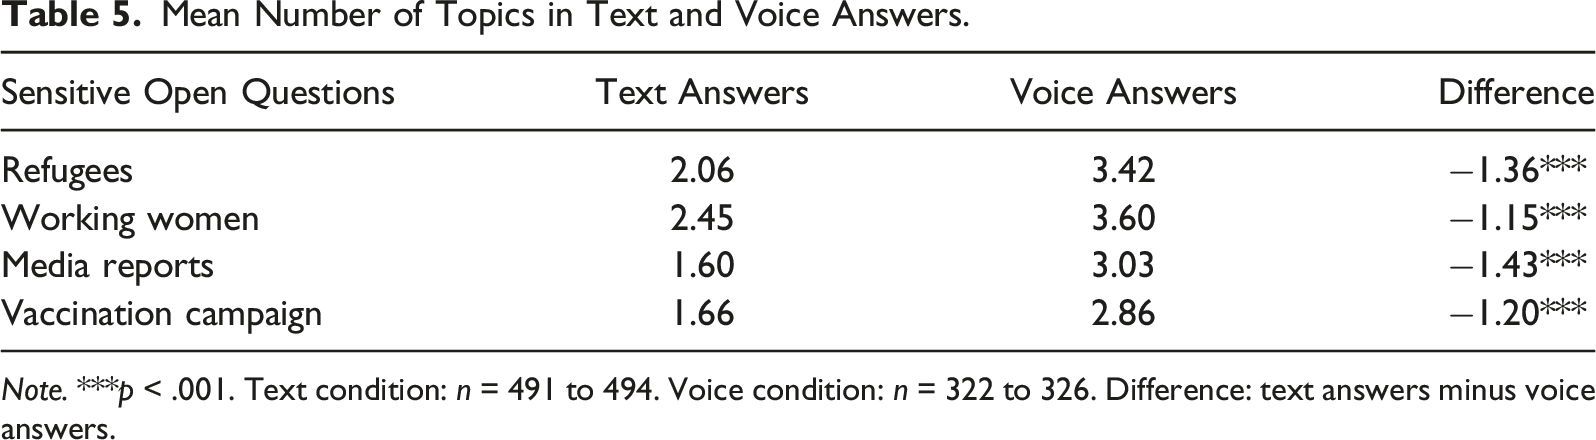
Note. ***p < .001. Text condition: n = 491 to 494. Voice condition: n = 322 to 326. Difference: text answers minus voice answers.
Ten Most Frequently Mentioned Topics in Text and Voice Answers.
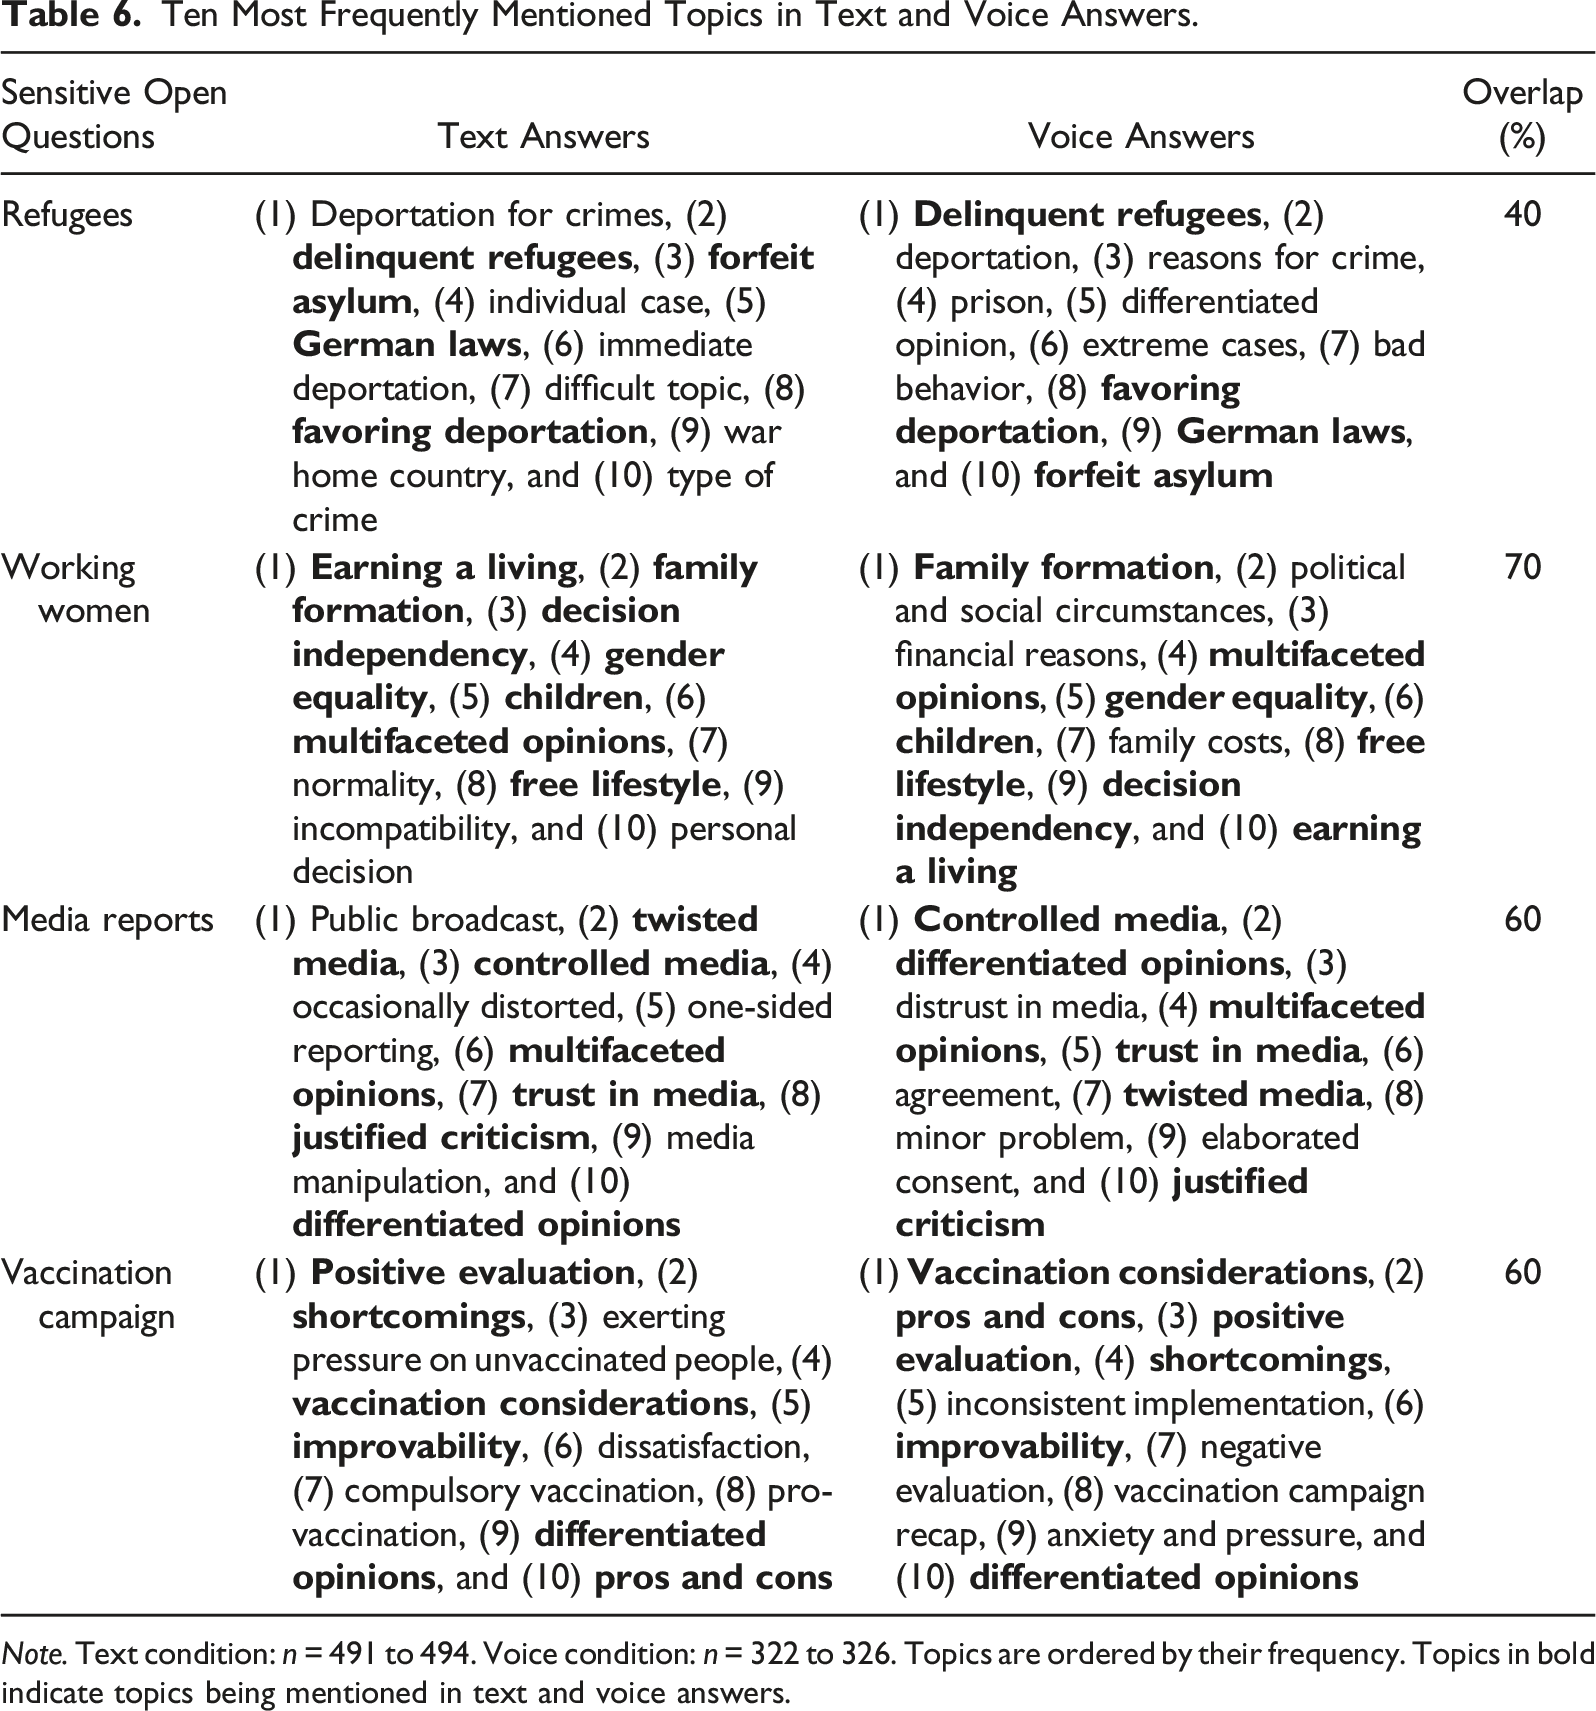
Note. Text condition: n = 491 to 494. Voice condition: n = 322 to 326. Topics are ordered by their frequency. Topics in bold indicate topics being mentioned in text and voice answers.
Considering the topics it is to observe that text and voice answers refer to rather general aspects, such as family formation (working women), trust in media (media reports), and improvability (vaccination campaign). Some other topics refer to clear instructions for action, such as forfeit asylum and favoring deportation (refugees) as well as compulsory vaccination (vaccination campaign).
Discussion and Conclusion
In this experimental study, we investigated the linguistic and content characteristics of text and voice answers to four open sensitive questions: refugees, working women, media reports, and vaccination campaign. We ran a smartphone survey experiment in the Forsa Omninet Panel in Germany and randomized respondents to text or voice answer conditions. The findings show that text and voice answers differ in terms of number of words, lexical structure, and topics. There are no differences with respect to the sentiments (or extremity) of text and voice answers. The overall results suggest that text and voice answers may start off different attitude formation processes and that they differ in terms of respondent burden.
With respect to our first research question, we found that voice answers are twice as long as their text counterparts. It appears that voice answers trigger a more intuitive and spontaneous on-line processing, whereas text answers trigger a more intentional and conscious memory-based processing. In addition, voice answers require a less burdensome answer delivery (i.e., respondents only need to press a recording button and record their answer) than text answers (i.e., respondents need to type in their answer via a virtual on-screen keyboard). Both the type of attitude formation and the higher respondent burden associated with text answers may induce respondents to select their words more carefully, which in turn results in shorter answers.
Our second research question deals with the lexical structure of text and voice answers. Lexical structure was evaluated in terms of lexical richness, lexical diversity, and readability. We found that voice answers consist of lower lexical richness and lower lexical diversity than text answers. There is no difference with respect to readability. One explanation is that the intentional and conscious memory-based processing triggered by text answers may push respondents to formulate their answers more thoughtfully and polish their written language. However, this is only an attempted explanation that lacks empirical evidence. We therefore advocate for a refined (methodological) investigation of the lexical structure of text and voice answers collected in smartphone surveys.
Regarding our third research question, we investigated whether and to what extent text and voice answers differ in terms of sentiments. In contrast to Gavras et al. (2022), we did not find any evidence that voice answers are more extreme than text answers. The reasons for this discrepancy might be twofold: first, the authors did not test open questions on sensitive topics, such as the deportation of delinquent refugees, but open questions on political attitudes, such as attitudes towards the German chancellor. Second, although the way of delivering text answers facilitates editing answers so that they are in line with social norms and values, voice answers salvage the danger to be overheard by third parties, which also fosters socially desirable answer behavior (Couper et al., 2003; Smith, 1997). This salvage particularly applies to smartphone surveys with almost no time and location limitations (Mavletova, 2013). We therefore encourage future research to further investigate the association between open questions with requests for text and voice answers and social desirability bias. One potential avenue might be to include scales in upcoming surveys that are designed to measure respondents concern for social approval (see, for instance, Crowne & Marlowe, 1960).
Our fourth research question dealt with the number of topics in text and voice answers. Similar to the answer length in terms of number of words, we found that text answers consist of a significantly lower number of topics than their voice counterparts. This similarly applies to all four open questions (refugees, working women, media reports, and vaccination campaign). Particularly, we see the answer delivery process associated with text answers responsible. Even if the intentional and conscious memory-based processing may facilitate that respondents have more topics in mind, the answer delivery via the virtual on-screen keyboard may prevent respondents from acknowledging all topics (see Revilla & Ochoa, 2016 for a comprehensive discussion of providing text answers to open questions in web surveys). In contrast, voice answers seem to trigger open narrations that result in rich and in-depth information (or topics) on the attitude object of interest. We see the answer delivery via the built-in microphone, coupled with the intuitive and spontaneous on-line processing, responsible. Nonetheless, future research may investigate the respondent burden associated with text and voice answers to open questions by, for instance, employing self-report questions and/or collecting response times.
This study has some limitations that provide perspectives for future research. Similar to previous studies on text and voice answers in smartphone surveys (see, for instance, Gavras & Höhne, 2022; Gavras et al., 2022; Höhne & Claassen, 2024; Revilla & Couper, 2021; Revilla et al., 2020), data collection was conducted in a non-probability access panel. This might be problematic for two reasons. First, although we used quotas on age, gender, and education for building a sample that matches the population on specific benchmarks, this may reduce the generalizability of our results. We therefore recommend investigating text and voice answers to open questions in probability-based panels. Second, respondents from non-probability panels frequently have a high survey experience. Previous research, however, has shown that such respondents tend to produce data of lower quality (Toepoel et al., 2008). Another point is that we investigated the linguistic and content characteristics of text and voice answers to open sensitive questions, but we did not look at data quality beyond missing data (i.e., break-off and item-nonresponse rates). In our opinion, it is key to investigate data quality more closely. Following Gavras and Höhne (2022), it might be worthwhile to use the predicted sentiment scores of respondents to evaluate the correlation between these scores and appropriate criterion variables. This analysis was beyond the scope of this study but would allow to compare the criterion validity of text and voice answers.
The comparatively high level of missing data in terms of break-off and item-nonresponse remains a major concern (see Gavras et al., 2022; Gavras & Höhne, 2022; Höhne & Claassen, 2024; Lütters et al., 2018; Revilla & Couper, 2021; Revilla et al., 2020). This level of missing data may affect survey outcomes and reduce the generalizability of the results. A reason for the high level of missing data might be that respondents of the panel in this study and respondents of the panels in previous studies were used to questions with requests for text answers. Findings may differ for newly recruited panels in which respondents do not consider a specific answer format as the default one. We recommend investigating appropriate ways in future studies to tackle missing data. One way might be to increase incentives for survey participation and/or to let respondents decide on the answer format. As shown by previous studies on respondents’ willingness to provide voice answers (see Höhne, 2023; Lenzner & Höhne, 2022; Revilla et al., 2018), some specific respondent groups, such as younger and more extraverted respondents, are more attached to voice answers than others. Open questions with requests for voice answers may also be worthwhile when surveying foreign population groups and immigrants, such as in the “Immigrant German Election Study (IMGES).” These studies are frequently characterized by respondents with relatively low literacy skills of the survey language having problems to express themselves in a written way. Voice answers have the great potential to tackle language barriers in surveys, allowing respondents to provide informed answers.
Considering our results and the possible field of applications we conclude that voice answers, compared to text answers, to open questions represent a promising extension of the existing methodological toolkit in web survey research. It appears that voice answers result in richer information on the attitude objects under investigation and that they are similarly robust against socially desirable answer behavior as their text counterparts. The methodological research on voice answers to open questions is still in its infancy, even though the technological and analytical requirements for collecting and analyzing voice answers in large-scale web surveys are met. For now, we recommend being open to voice answers and to investigate their merits and limits for web survey research in future studies.
Footnotes
Acknowledgments
We would like to thank Forsa—in particular, Aleksa Moentmann and Marcus Wilkin—for conducting this study. We acknowledge that Forsa—Gesellschaft für Sozialforschung und statistische Analysen mbH Marplan—conducted the data collection free of charge.
Declaration of Conflicting Interests
The author(s) declared no potential conflicts of interest with respect to the research, authorship, and/or publication of this article.
Funding
The author(s) received no financial support for the research, authorship, and/or publication of this article.
Human Rights Declaration
This research has been conducted in accordance with established ethical norms. Furthermore, informed consent was obtained for experimentation with human subjects.
Data Availability Statement
For replication purposes, we released data including analysis script through Harvard Dataverse (see https://doi.org/10.7910/DVN/3KCPNK).
Notes
Appendix A
English translation of the instructions on how to answer the open questions with requests for text and voice answers.
Appendix B
Correlation matrices.
Table B1
Correlation Matrix of Sentiment Ratio: Text Answers. Note. *p < .05. Pearson’s correlation coefficients. n = 491 to 494.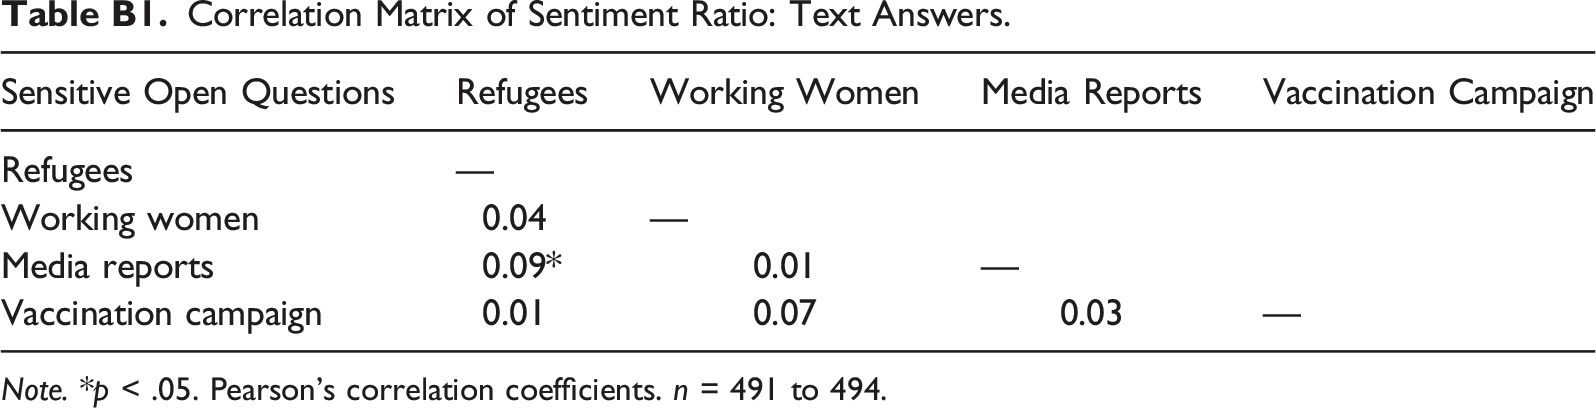
Sensitive Open Questions
Refugees
Working Women
Media Reports
Vaccination Campaign
Refugees
—
Working women
0.04
—
Media reports
0.09*
0.01
—
Vaccination campaign
0.01
0.07
0.03
—
Table B2
Correlation Matrix of Sentiment Ratio: Voice Answers. Note. **p < .01. Pearson’s correlation coefficients. n = 322 to 326.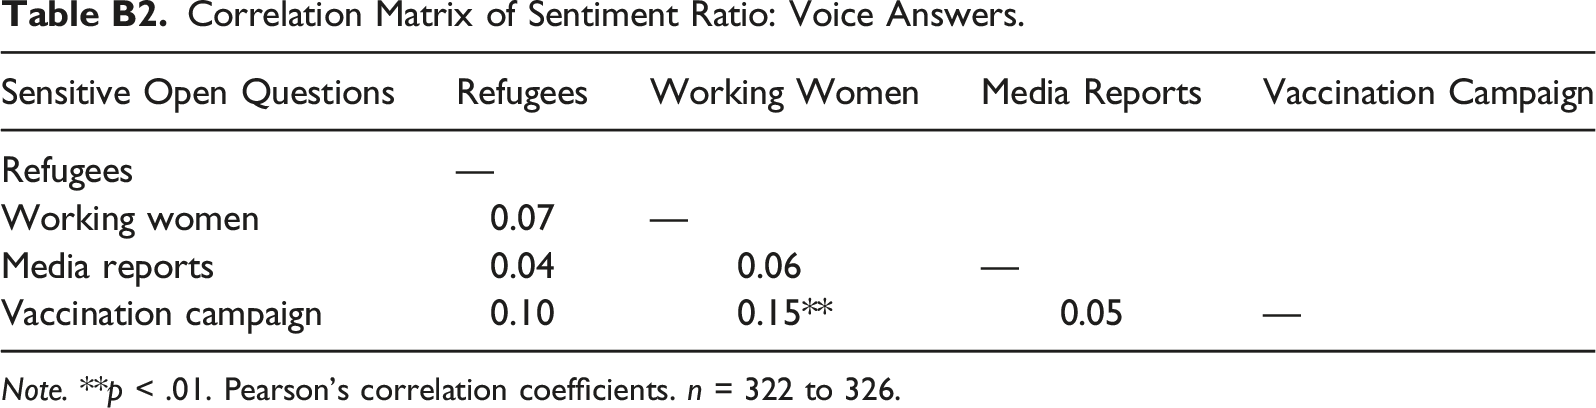
Sensitive Open Questions
Refugees
Working Women
Media Reports
Vaccination Campaign
Refugees
—
Working women
0.07
—
Media reports
0.04
0.06
—
Vaccination campaign
0.10
0.15**
0.05
—
Appendix C
Diagnostic plots for determining the number of topics.
Figure C1
Diagnostic plots for the open question on refugees.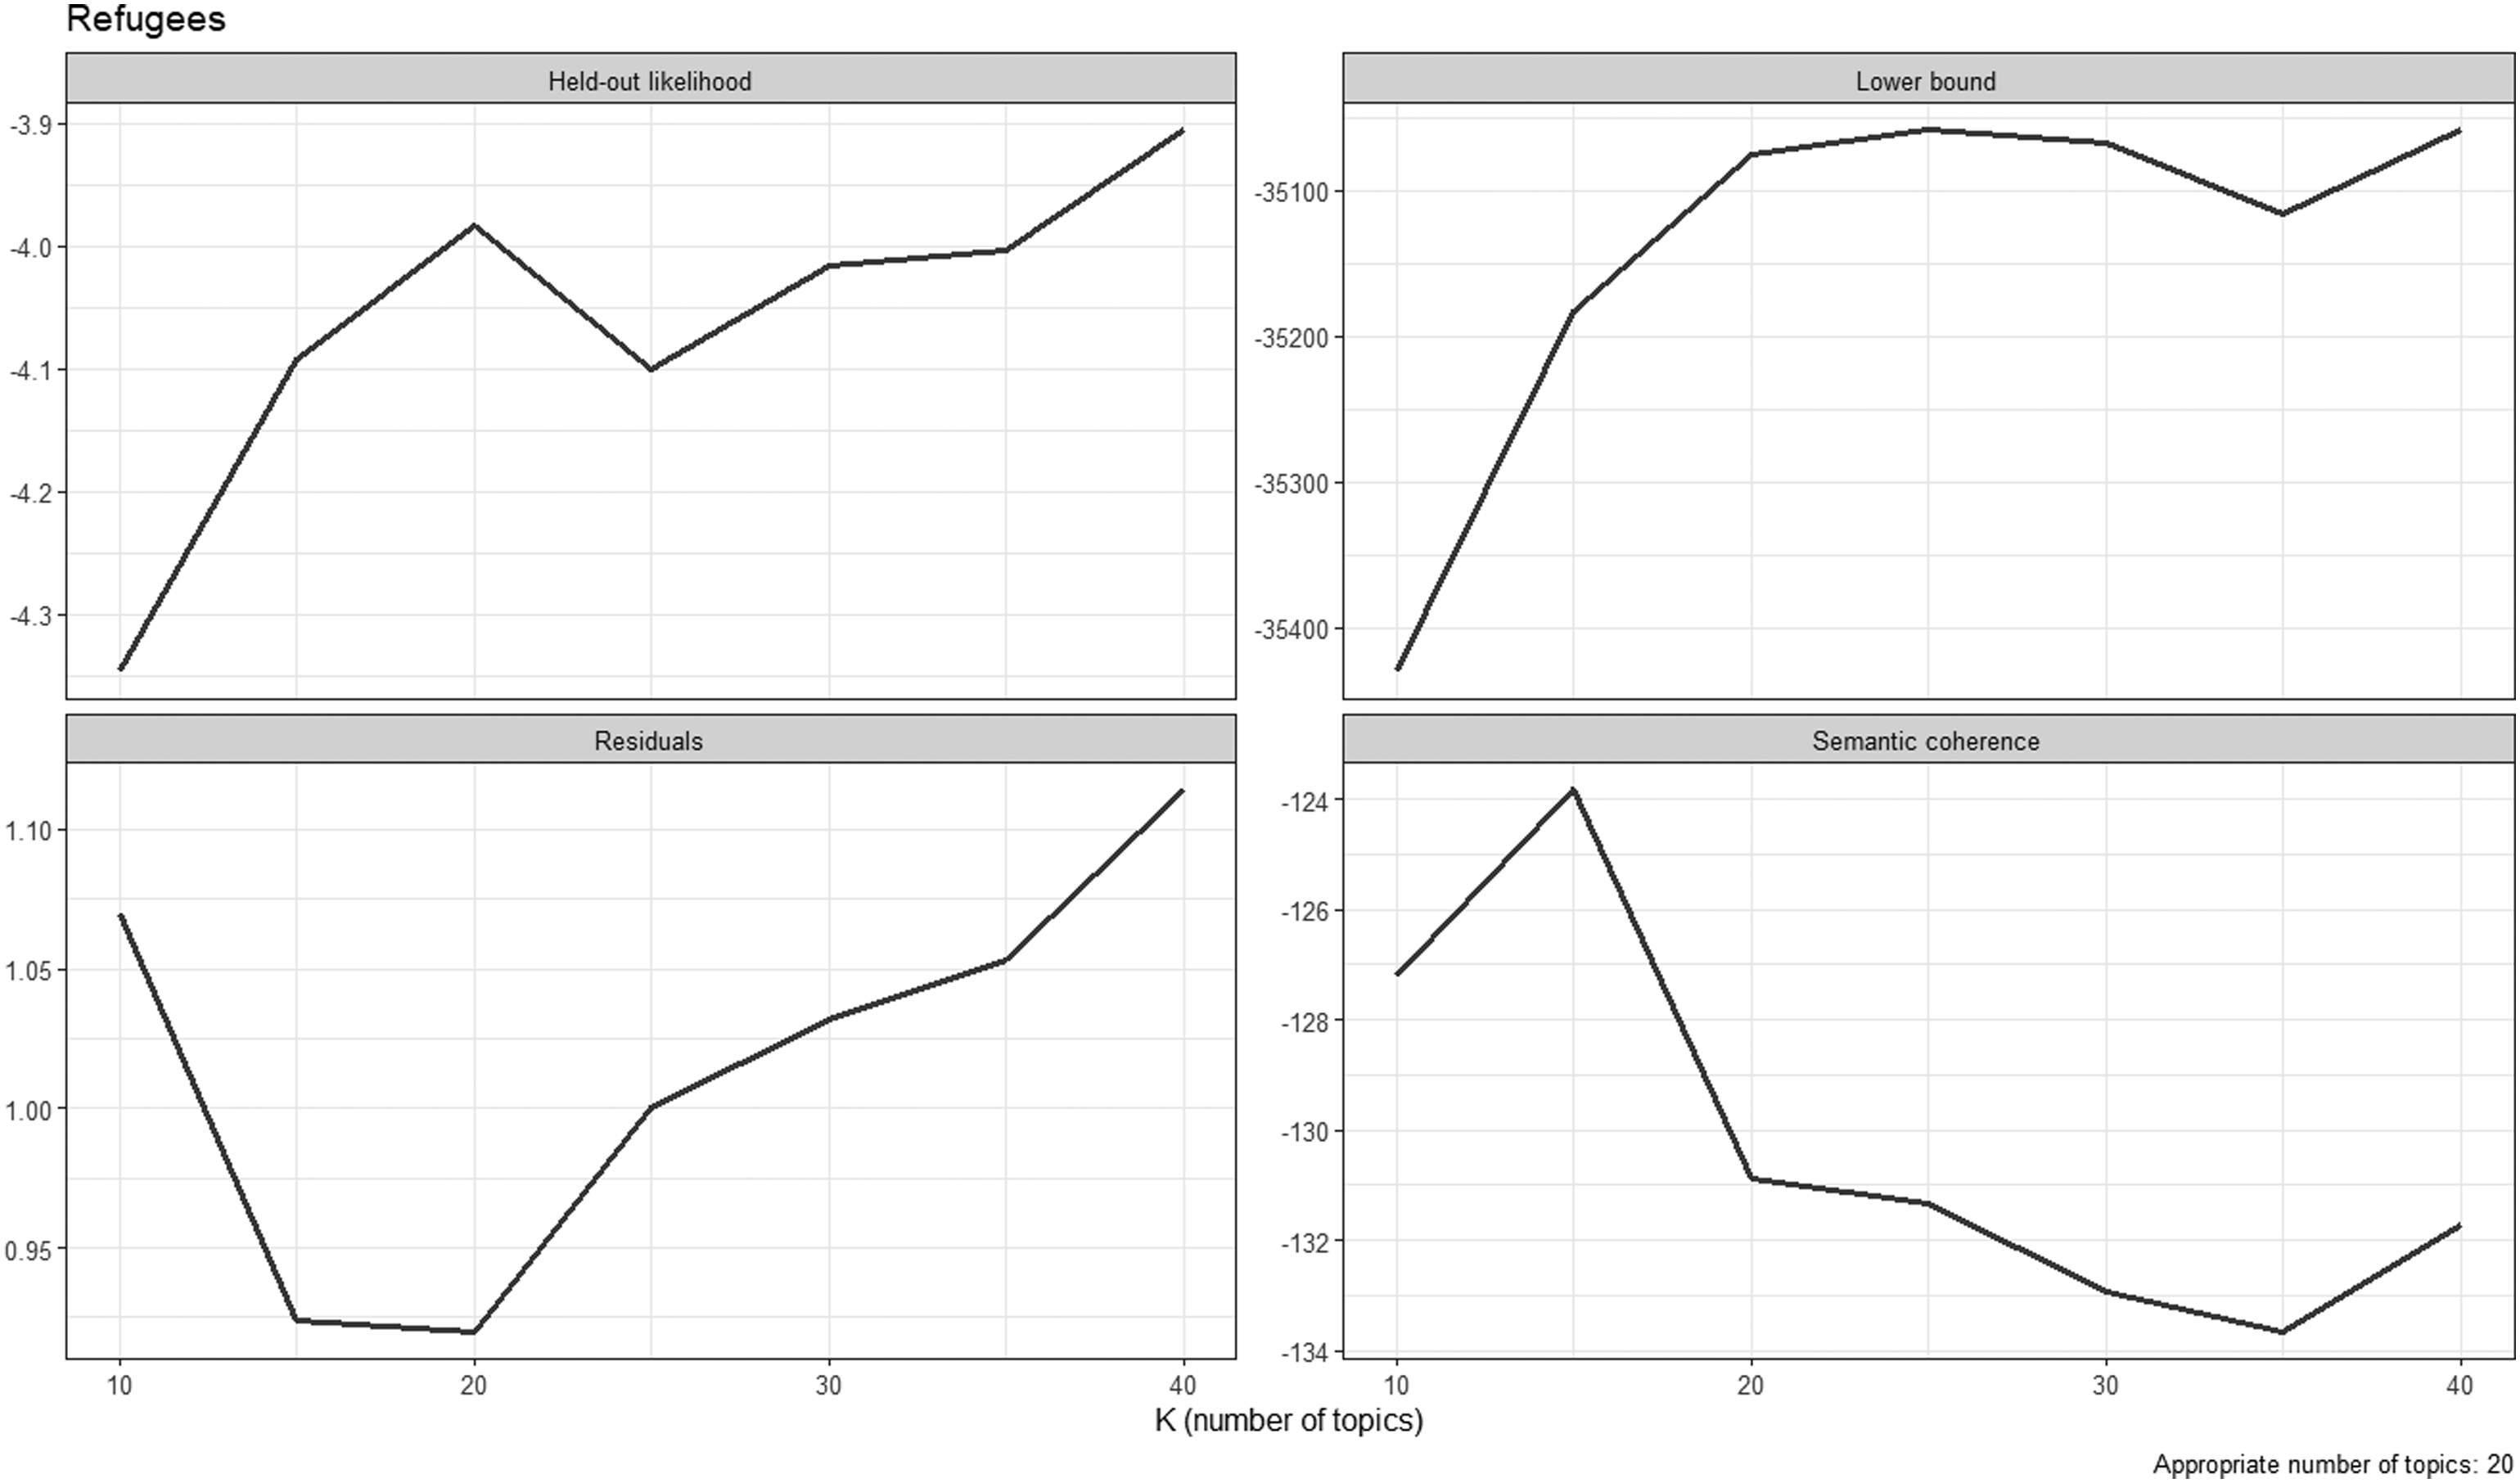
Figure C2
Diagnostic plots for the open question on working women.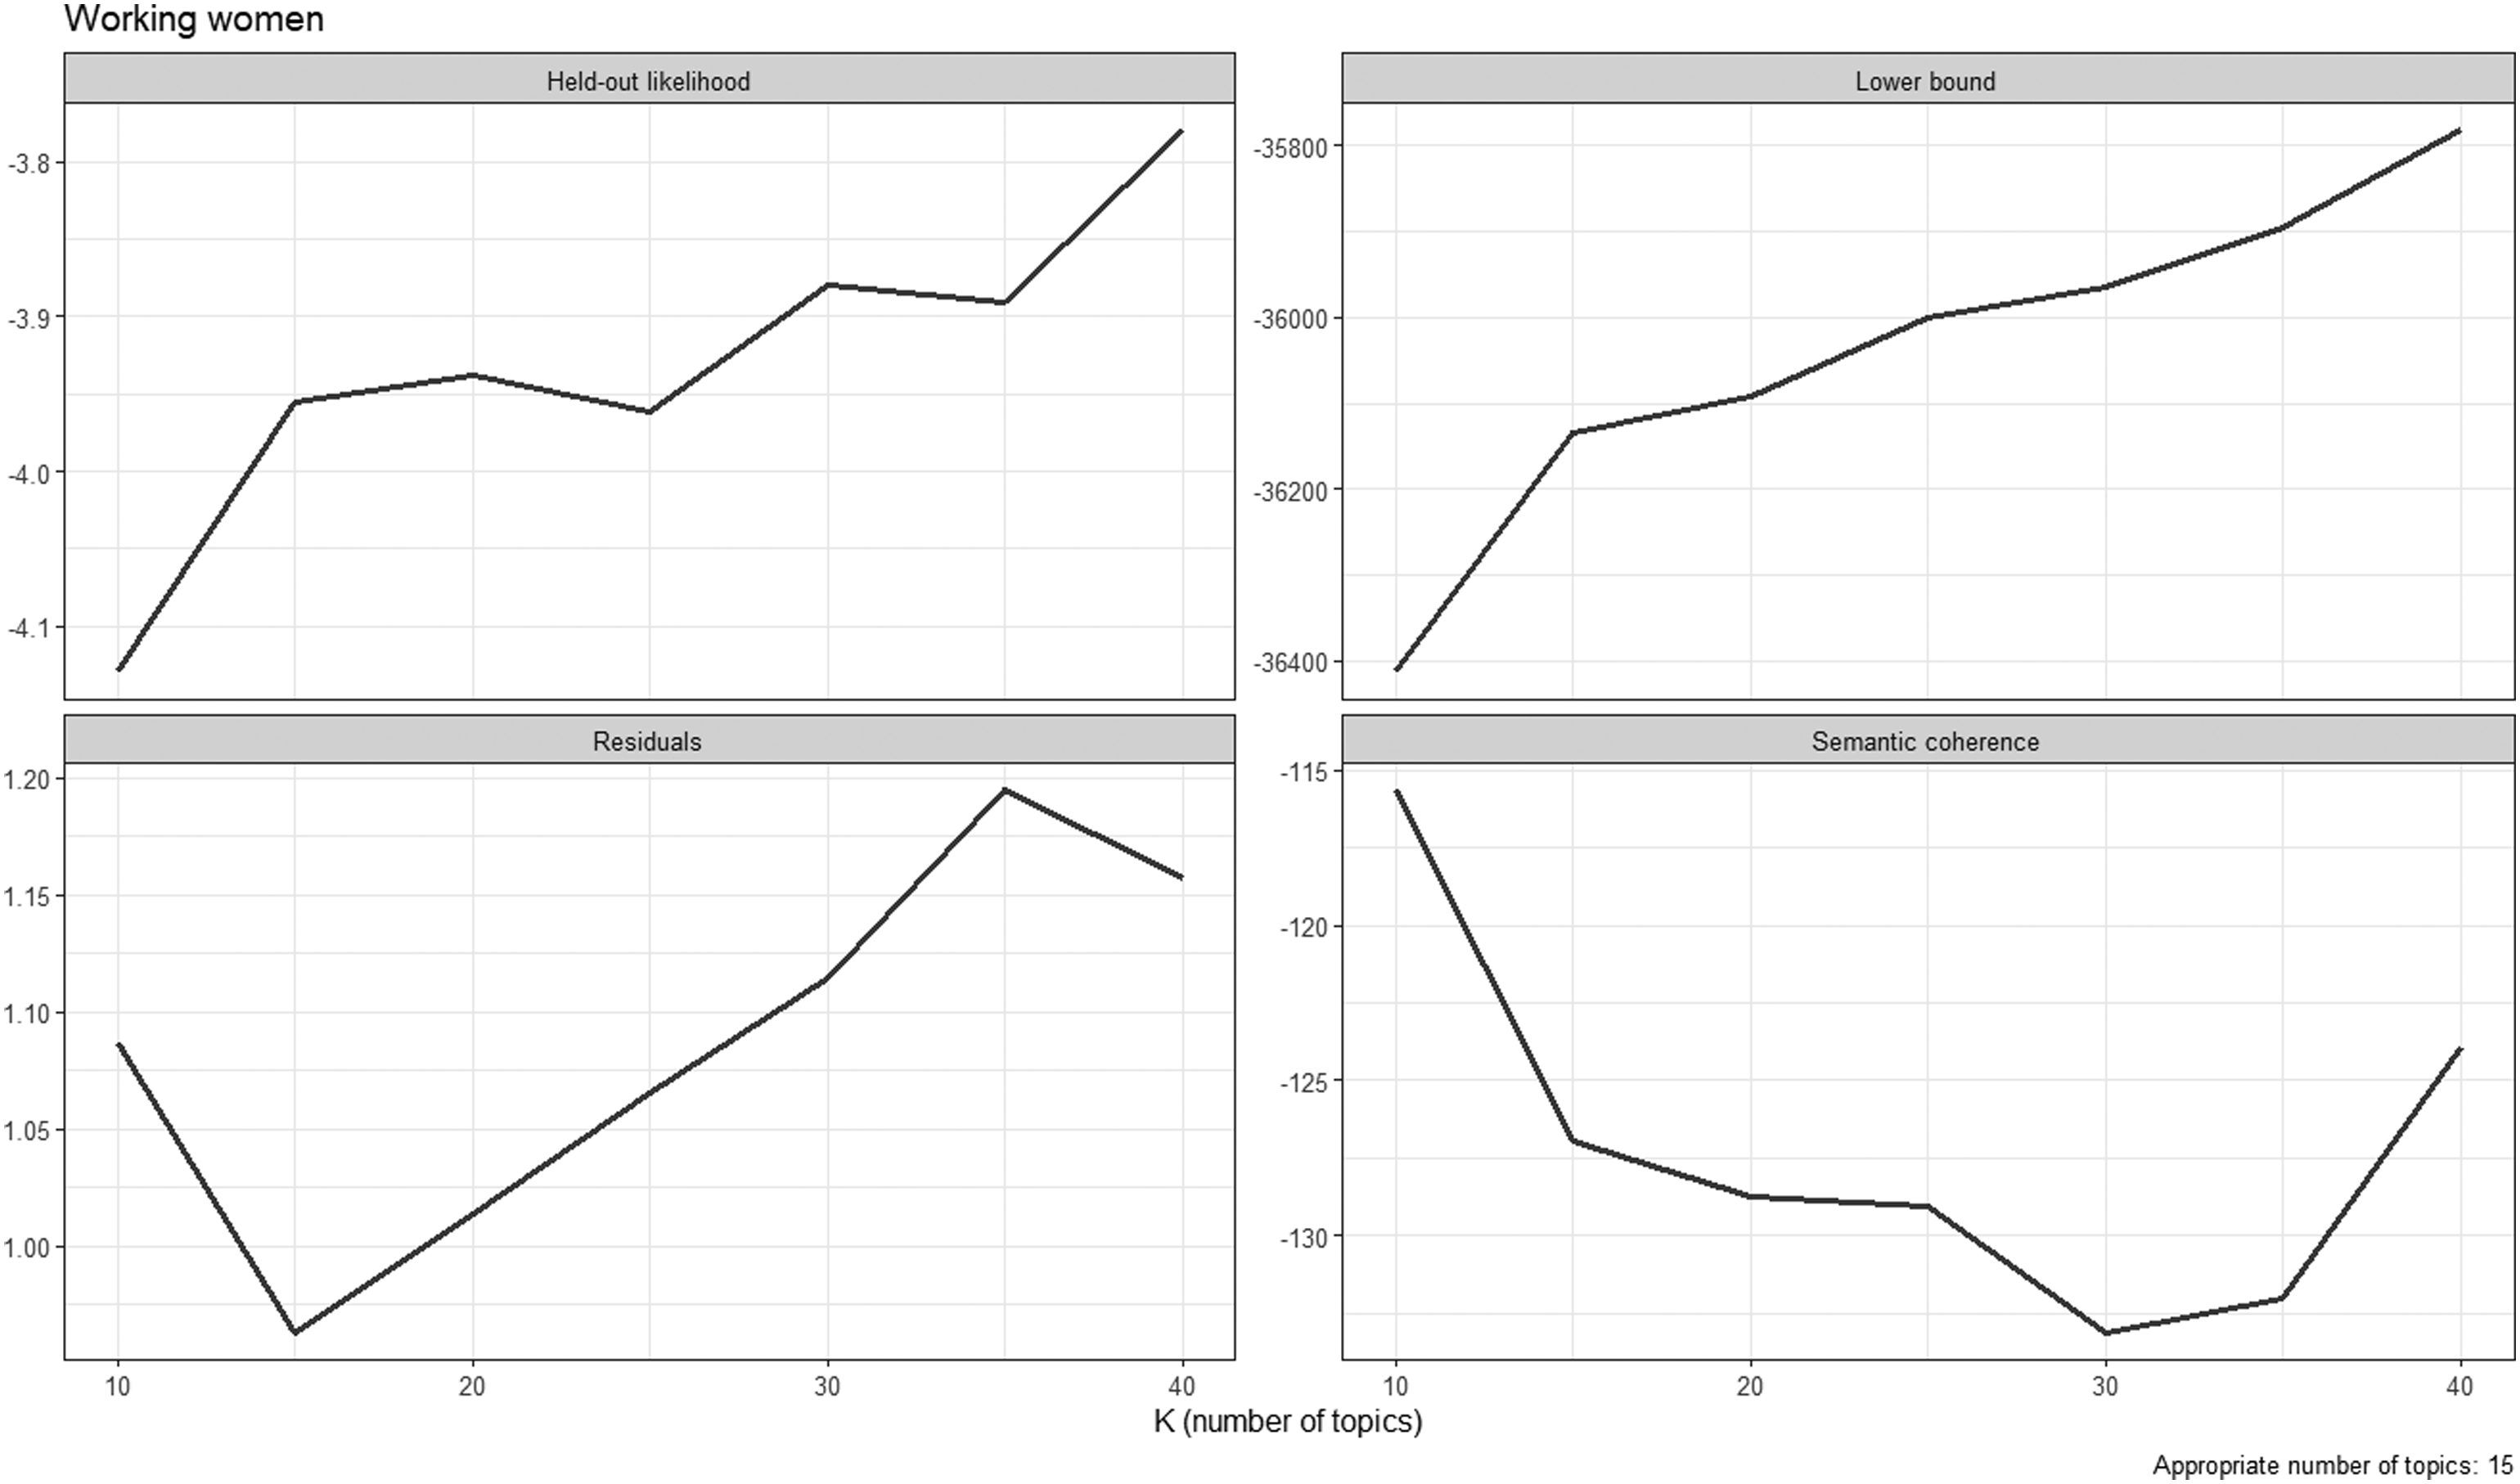
Figure C3
Diagnostic plots for the open question on media reports.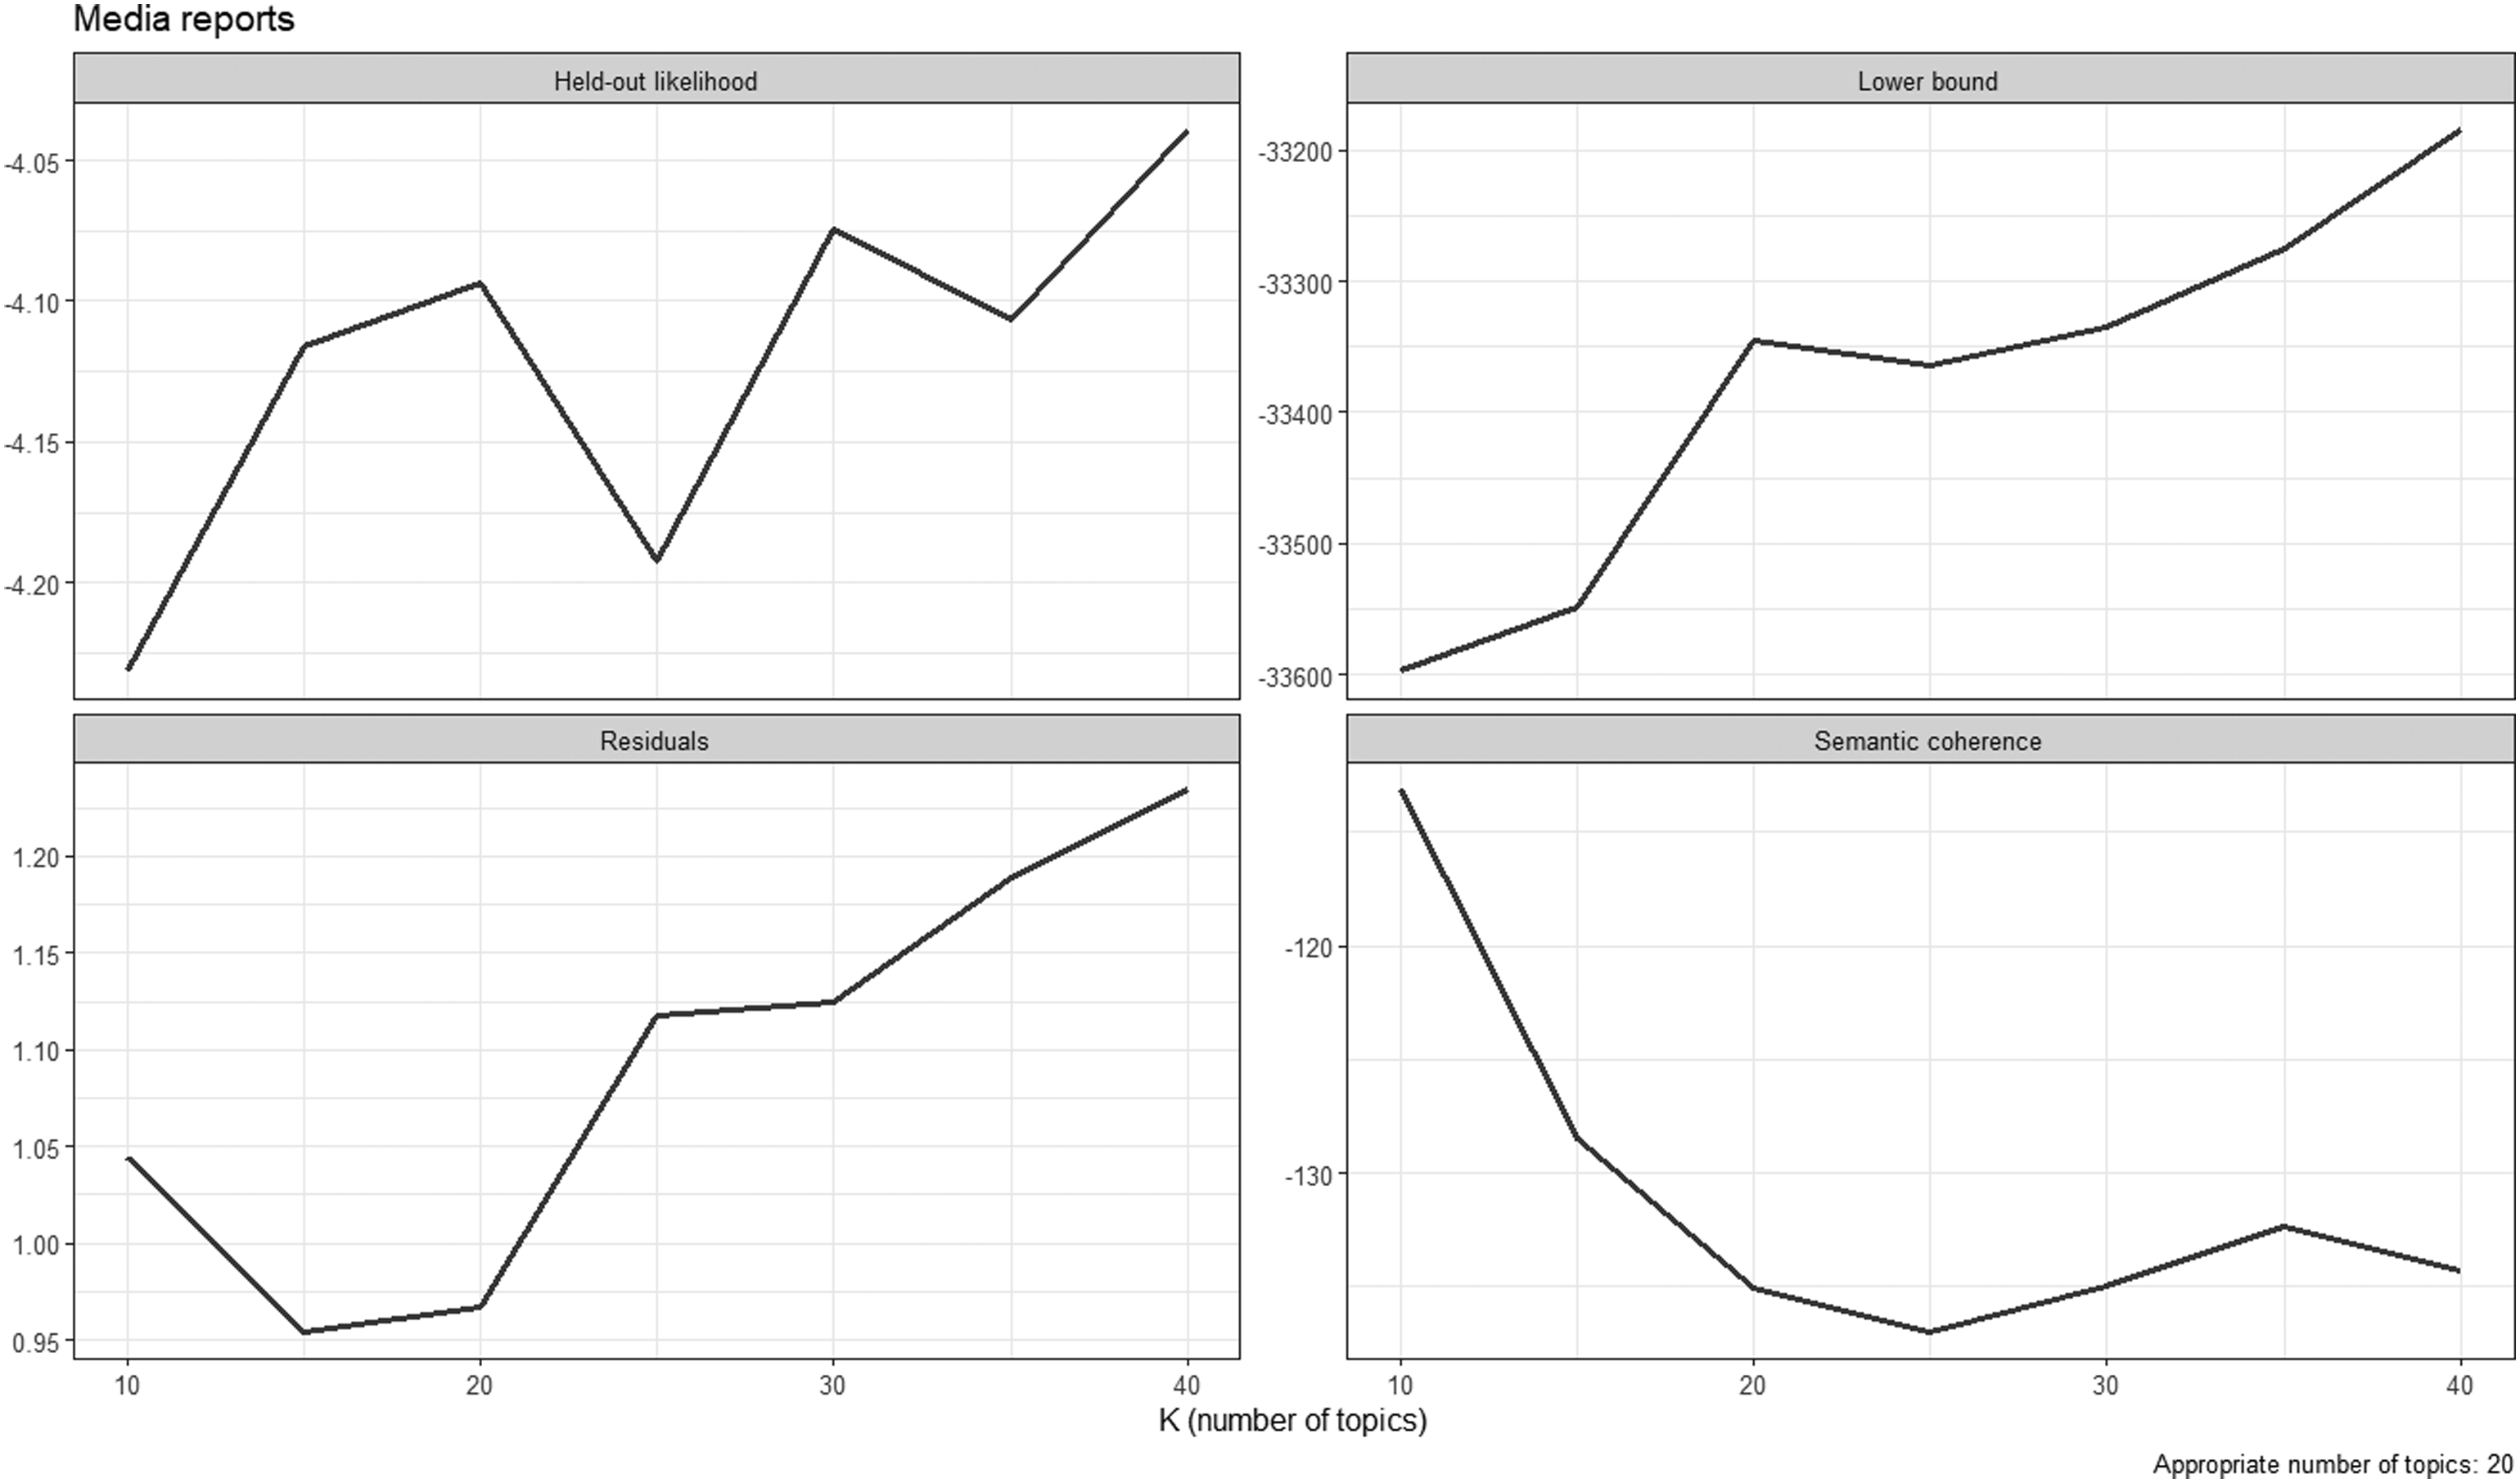
Figure C4
Diagnostic plots for the open question on vaccination campaign.