
Abstract
Nonresponse is a fundamental issue in survey research, due to the trend of declining response rates across survey modes. This issue is particularly serious for web surveys: A recent meta-analysis found that unit nonresponse in web surveys is, on average, higher by 12 percentage points than in other modes (Daikeler et al., 2020). Although the issue of unit nonresponse in web and other survey modes has been investigated in several meta-analyses, item nonresponse has not been examined meta-analytically, a gap addressed by this paper. Are web surveys at a disadvantage compared to other survey modes in terms of item nonresponse as well? To address this question, 13 eligible experimental manuscripts reporting 23 effect sizes were identified in a comprehensive literature search. Meta-analytic findings showed that there was no statistically significant difference in the average item nonresponse rate in web versus other survey modes. However, six moderator variables were found to statistically significantly affect the relation between the survey mode and the item nonresponse rate, namely, the target population, the number of contacts, the mode to which the web survey mode was compared, the survey sponsor, the age of the survey, and the baseline item nonresponse rate of the compared mode. The main practical implication is that while web and other survey modes differ in terms of unit nonresponse (on average), item nonresponse rates in web surveys are similar compared to other modes.
Keywords
Introduction
The term nonresponse refers to situations where some expected responses to survey questions are not obtained from units in the survey sample. This can either be because units do not respond at all, or because they do not respond to some items in the questionnaire. The first situation is defined as unit nonresponse, which means no (usable) responses were obtained from a survey unit. The second is defined as item nonresponse, which signifies that a survey unit did not respond to a certain survey question (item), despite the unit being otherwise eligible and cooperative (Callegaro et al., 2015).
Nonresponse is a fundamental issue in survey research. This is because of declining survey response rates (de Leeuw et al., 2018; Groves et al., 2009) and the increasing costs of conducting surveys, as more effort is required to achieve the target response rates (Bethlehem et al., 2011; Tourangeau et al., 2013) or the number of complete responses. Unit nonresponse can lead to increased nonresponse error, because underrepresentation (or overrepresentation) of some population segments within a sample results in biased estimates of population characteristics. Moreover, although the effect of item nonresponse on some statistics is effectively the same as unit nonresponse, harm is limited to statistics based on items affected by item nonresponse (see Groves et al., 2009).
The relative extent of unit nonresponse is a particularly serious problem for web surveys. Comparisons of response rates between web and other modes have previously been conducted in several meta-analyses 1 (Daikeler et al., 2020; de Leeuw & van der Zouwen, 1988; (Lozar Manfreda et al., 2008); Medway & Fulton, 2012; Shih & Fan, 2007, 2008, 2009). The most recent meta-analytic research indicated that the response rates of web surveys are 12 percentage points lower (on average) compared to other survey modes (Daikeler et al., 2020).
The important question is whether web surveys are also at a disadvantage (compared to other survey modes) in terms of differences in item nonresponse rates. It is known that different measures of nonresponse have specific causes and effects on data quality (Callegaro et al., 2015; Groves et al., 2009). Further, the mechanism of item nonresponse (which is the focus of this paper) differs from that of unit nonresponse: unit nonresponse typically results from a decision by the respondent before starting the questionnaire, whereas item nonresponse occurs after the respondent has started to answer questions.
While several experimental studies have been conducted, item nonresponse in web surveys compared to other survey modes has not been investigated through meta-analysis (see Čehovin et al., 2018), which is a research gap that we aim to address in this paper. Specifically, the aim of this meta-analysis is to investigate the effect of survey mode (i.e., web vs. other survey modes) on differences in the mean rate of item nonresponse, which complements existing research on the issue of nonresponse. Furthermore, by only considering surveys with random assignment to modes, the aim is to disentangle mode effects in more detail, evaluate the heterogeneity of results and investigate moderator variables that may systematically affect the relation between survey mode and item nonresponse rate.
Background and Research Questions
The literature on item nonresponse and related mode-specific issues are discussed below, after which the paper’s research questions are stated. The literature search strategy and the meta-analytic procedure are described, followed by a summary of the main findings. Finally, the implications of the results for survey methodology and future research are discussed.
Item Nonresponse in Different Survey Modes
In this paper, differences in item nonresponse rates (web vs. other survey modes) were investigated meta-analytically for the first time. In this context, item nonresponse indicates that although units responded to the questionnaire, they did not provide the expected responses to certain question items. It should be noted that if a question is not applicable due to a conditional display of the question (i.e., skip logic), the respondent cannot be expected to answer, which cannot be counted as item nonresponse. Moreover, if some of the expected responses are missing due to a unit prematurely quitting the survey, this is counted as survey breakoff and not item nonresponse. This is because the unit is not exposed to questions after the breakoff point. Furthermore, certain non-substantive answers can be counted as legitimate responses (e.g., “do not know”), while other answers can be considered item nonresponse (e.g., “prefer not to answer”; Callegaro et al., 2015).
Different survey design decisions can affect item nonresponse in web and other survey modes during fieldwork, particularly those that reduce respondents’ burden, increase the level of privacy, and increase respondent engagement (Groves et al., 2009). For example, in interviewer-administered modes, an interviewer can be used to clarify and motivate responses, especially for long and/or complex questionnaires, which is not possible in self-administered modes, such as web surveys. Conversely, self-administered modes are advantageous in terms of privacy, as well as convenience, as respondents can choose their own time and pace of response to the survey. The absence of the interviewer (as well as other persons) can be particularly beneficial for questions about sensitive or embarrassing behavior, which is typically underreported in interviewer-administered surveys (Groves et al., 2009; Tourangeau et al., 2013).
In addition to the presence or absence of the interviewer and the survey topic, many factors of questionnaire design can affect item nonresponse in different modes, including question types and complexity (Millar & Dillman, 2012; Wolfe et al., 2008). Furthermore, the survey software used for web surveys can provide validation and prompts for item nonresponse; on paper self-administered surveys (e.g., mail), such prompts are unavailable. The above can lead to considerable differences in the item nonresponse rate between the modes for certain types of questions in particular, such as open-ended questions (Denscombe, 2009; Wolfe et al., 2008).
The existing experimental research complements the theoretical discussion on differences in survey mode and potential effects of item nonresponse. Specifically, face-to-face and telephone surveys perform better than self-administered modes in terms of item nonresponse, because the interviewer can provide probing and motivation (Bowling, 2005; de Leeuw, 1992). When sensitive topics are introduced, however, the relation between survey mode and item nonresponse becomes less clear, and self-administered surveys have been found to report sensitive information more often (de Leeuw, 1992; Kreuter et al., 2008).
Studies also showed that web surveys have a higher item nonresponse rate compared to face-to-face and telephone surveys (Al Baghal & Lynn, 2015; Heerwegh & Loosveldt, 2008; Woo et al., 2015). Compared to mail surveys, however, the evidence is less clear. On the one hand, item nonresponse was found to be lower in web surveys (Hsu & McFall 2015; Kwak & Radler, 2002; Messer et al., 2012). On the other, studies have also found that mail surveys outperformed the web survey mode in terms of item nonresponse for certain parts of the questionnaire (Börkan, 2010) and certain target populations (Wolfe et al., 2008).
Meta-Analysis Research Questions
The overall aim of this meta-analysis was to explore how the item nonresponse rate in web surveys differs from that in other survey modes, and what potential moderators affect this difference. The following two research questions are raised. RQ.1: Is the item nonresponse rate in web surveys higher, the same, or lower compared to that in other survey modes? The expectation is that the mean item nonresponse rate in web surveys is not statistically significantly different from the mean item nonresponse rate in other survey modes; however, a large amount of heterogeneity of the effect size distribution is also expected. RQ.2: Are specific survey design characteristics moderator variables; that is, do they have a systematic effect on the difference in the item nonresponse rate between web and other survey modes? Despite the overall expectation of no statistically significant difference in the mean item nonresponse rate between web and other survey modes, we expect several survey design characteristics to have a significant effect on the difference in the item nonresponse rate. More specifically: 1) Survey mode compared to the web survey mode. We expect that the item nonresponse rate in web surveys is, on average, similar to that in other self-administered modes, but statistically significantly higher when compared to interviewer-administered modes, due to interviewer motivation and probing. 2) The percentage of open-ended items on the questionnaire. Open-ended questions increase the respondents’ burden, and may impact item nonresponse (Callegaro et al., 2015). We expect this impact to be more pronounced in web surveys due to the absence of interviewer probing. 3) Whether prompts for item nonresponse are used in the web survey mode. We expect that the use of prompts in web surveys at least partly compensates for the absence of interviewer probing. 4) Survey topic. We expect that the difference in the item nonresponse rate between web and other survey modes changes statistically significantly across survey topics. For example, if the survey topic is salient, interesting, or beneficial to the respondents’ agenda, they are more likely to rationalize the survey burden (Boulianne & Basson, 2008), in which cases the differences in the item nonresponse rate between the survey modes would likely diminish, and vice versa. 5) Target population. The characteristics of the target population can vary, such as sociodemographics and knowledge of the survey topic. In general, high nonresponse is expected for the general public, but the highest rates are expected for executives and celebrities (Callegaro et al., 2015). For item nonresponse specifically, we expect that the target population would have a statistically significant effect on the difference in the item nonresponse rate between web and other survey modes.
Ten additional survey design characteristics are available for coding from experimental studies. However, the following survey design characteristics refer to the recruitment phase (i.e., before the respondent has begun answering questions; see Callegaro et al., 2015; Groves & Couper, 1998). Accordingly, we do not expect the characteristics to have a statistically significant effect on the difference in item nonresponse. The characteristics are numbered as follows: (1) contact method for the web survey mode, (2) contact method for the compared mode, (3) cross-sectional versus longitudinal survey design, (4) number of contacts, (5) use of prenotification, (6) list-based versus panel recruitment strategy, and (7) survey sponsor. We may also add (8) incentives here, which can be conditional on cooperation with the survey request. Further, their effect on item nonresponse has been ambiguous (e.g., Yu et al., 2017). The remaining two survey design characteristics of (9) region of survey study and (10) year of study are also not expected to have a statistically significant effect on differences in item nonresponse. The effect of survey region is not expected because the majority of the available studies are conducted in the United States and Europe, where web surveys are equally suitable for general population surveys due to the increasing percentage of the population with internet access (Callegaro et al., 2015). For year of study, no effect on the difference in item nonresponse is expected, because previous meta-analyses have indicated a stable pattern of differences in unit nonresponse over time (see Daikeler et al., 2020; Lozar Manfreda et al., 2008).
Method
Literature Search Strategy
The literature search strategy comprised two steps (i.e., for the period before 2016 and 2016–2018) and aimed to identify experimental studies comparing the item nonresponse rate in web versus other survey modes. 2 For consistency, the strategy also followed the procedures used in two previous meta-analyses of the unit nonresponse rate (i.e., Daikeler et al., 2020; Lozar Manfreda et al., 2008). In the first step, all experimental studies published before 2016 and selected for screening by (Daikeler et al., 2020) and (Lozar Manfreda et al., 2008) were obtained (i.e., all studies potentially reporting experimental comparisons of unit nonresponse rates in web vs. other survey modes). For this paper, relevant studies were re-evaluated with keywords extended to item nonresponse to determine whether they also reported experiments on item nonresponse rates in web versus other survey modes (see the list of keywords and eligibility criteria below). This investigation of all experimental studies found in the previous meta-analyses was relevant as the present paper investigated the same intervention (i.e., web vs. other modes) but different effect sizes (i.e., difference in the item nonresponse rate).
In the second step, the procedure above was supplemented for the period after 2016 with a comprehensive literature search using the DiKUL 3 bibliographic harvester in January 2018, which enabled searching in 132 bibliographic databases (see Table S1 in the Online Supplement for the full list). This process included results until the end of 2017, and the keywords from the previous two meta-analyses (i.e., Daikeler et al., 2020; Lozar Manfreda et al., 2008) were extended to include item nonresponse. The following combinations of keywords were used for the search: “web survey,” “internet survey,” “online survey,” “web-based survey,” “internet-based survey,” and “electronic survey,” supplemented with “response rate,” “return rate,” “participation rate,” “nonresponse rate,” “item response,” and “item nonresponse.”
Six eligibility criteria were defined. The first three criteria defined the type of eligible studies: 1. One of the survey modes in the experimental study must correspond to the basic web survey mode (Callegaro et al., 2015), which uses a computerized self-administered questionnaire to gather responses on a server which the respondents access with a web browser. 2. The web survey must be compared to data from one or more other survey modes. 3. The experimental study must report data on item nonresponse and the sample size for web and other modes, which enable the calculation of the mean item nonresponse rate for each mode and the meta-analytic confidence intervals.
The next three criteria defined the experimental design that separates the mode from confounding factors: 4. A split-sample experimental design must be used to randomly assign units from the same population to different survey modes. 5. Item nonresponse rates must be based on retaining the respondents within the mode to which they were initially randomly assigned. 6. The only difference in the survey design across experimental groups should be the survey mode. For example, studies with unequal incentives across the modes were excluded.
Moreover, the results were limited to manuscripts in the English language published in the scientific literature; unpublished studies and gray literature were not explored or included. No additional limits were imposed on the date of publication.
Literature Selection and Data Extraction
The literature selection process resulted in 13 eligible manuscripts reporting 16 studies and 23 effect sizes. The process is illustrated in the Preferred Reporting Items for Systematic Reviews and Meta-Analyses flow diagram (Moher et al., 2009) in Figure 1. PRISMA flow diagram of the literature selection process. PRISMA: Preferred Reporting Items for Systematic Reviews and Meta-Analyses.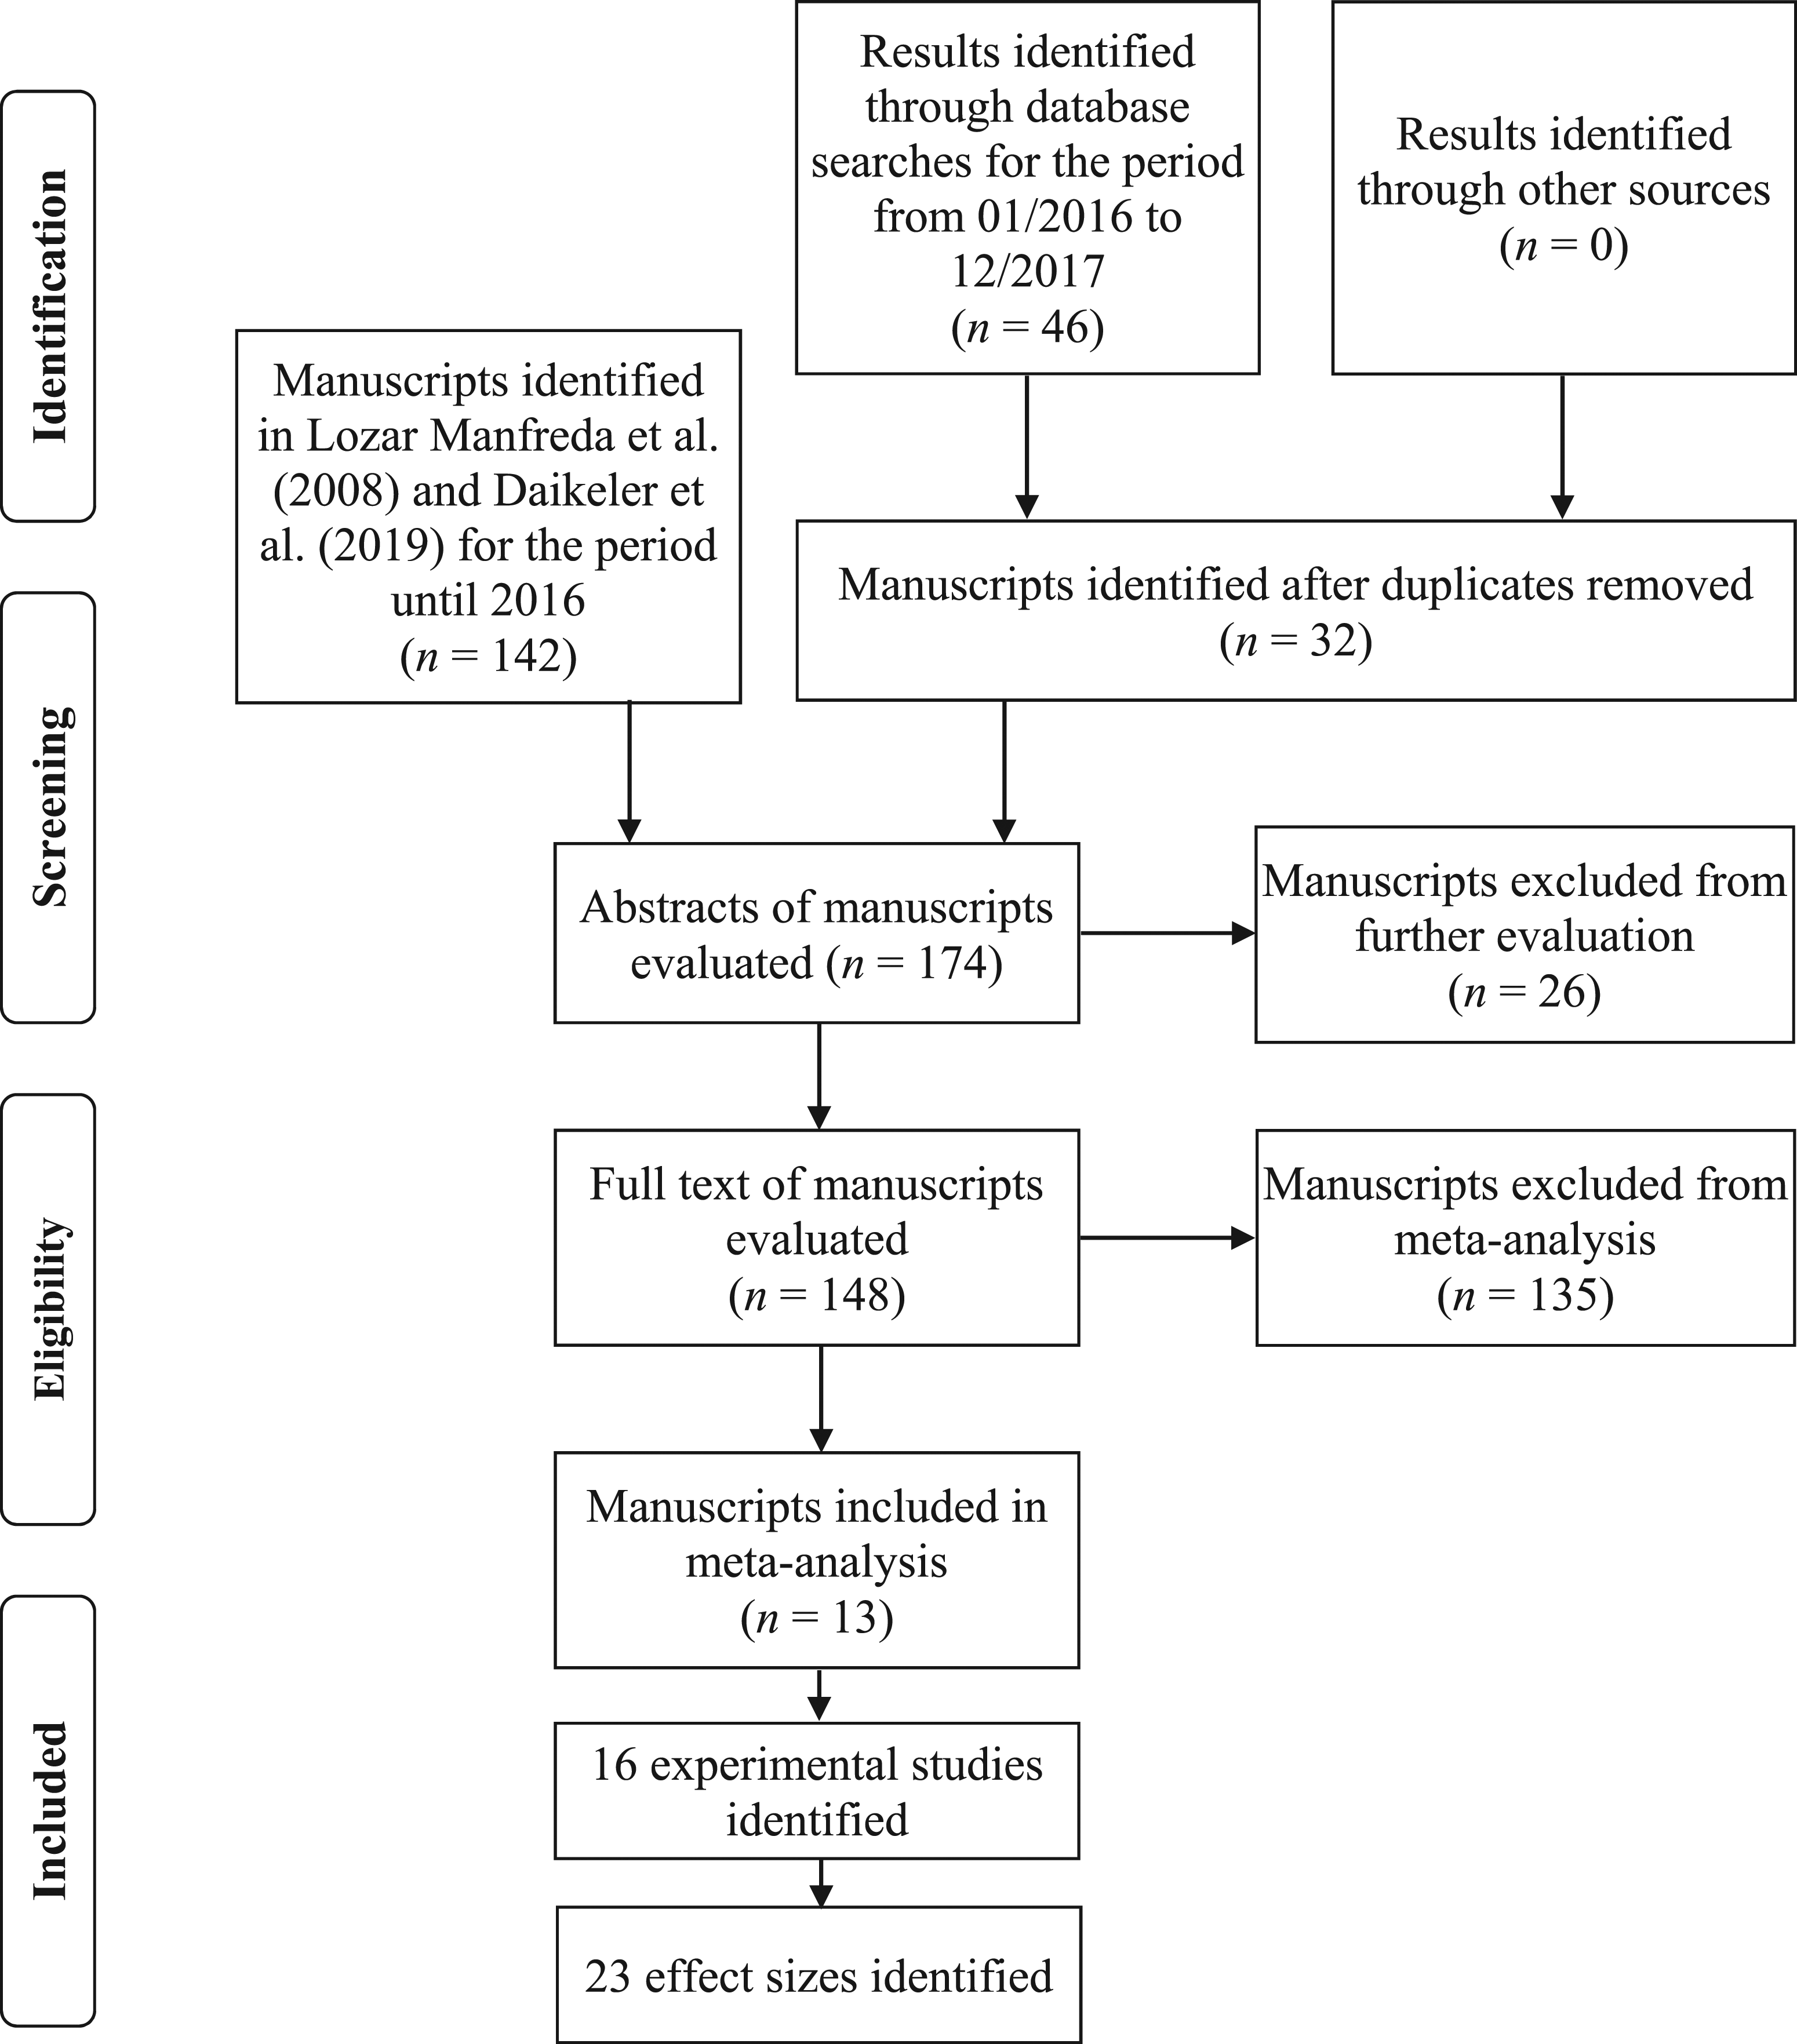
The initial search results comprised 142 manuscripts from two previous meta-analyses (i.e., Daikeler et al., 2020; Lozar Manfreda et al., 2008) and 46 additional manuscripts from the DiKUL harvester. After duplicates were removed, 174 manuscripts remained for abstract screening, during which they were excluded only if it was possible to determine their ineligibility beyond any doubt based on the criteria defined in the Literature Search Strategy section. Specifically, 148 manuscripts were selected in the abstract screening for full-text assessment in accordance with the eligibility criteria. In the full-text evaluation, 13 manuscripts were identified as eligible for inclusion in the meta-analysis. 10 of these 13 eligible manuscripts were identified from the 142 search results of studies published before 2016 in the two previous meta-analyses (i.e., Daikeler et al., 2020; Lozar Manfreda et al., 2008), and the remaining three were identified through additional database searches of studies published between 2016 and 2018.
Two manuscripts reported more than one study (Messer et al., 2012; Millar & Dillman, 2012), meaning that the reported experimental comparisons were implemented in different studies with dissimilar designs (e.g., different questionnaire content). Three manuscripts reported more than one effect size (de Leeuw et al., 2016; Messer, 2012), meaning that a single study from a manuscript reported more than one experimental comparison of the difference in the item nonresponse rate between web and other survey modes (e.g., concurrently conducting a survey with the same questionnaire content and methodology in different states).
The data structure for the data extraction process based on the 13 manuscripts was prepared by all three authors. Discussion was used to address questions for five manuscripts that did not report data unambiguously for the purpose of the data structure, which were all resolved unanimously. The next step required extracting the data related to the percent of missing items among the requested responses, to calculate the meta-analytic effect sizes and the corresponding confidence intervals. More specifically, item nonresponse for a specific mode was operationalized as the mean percent of missing items, aggregated across items and respondents. For example, having 10 items, 100 respondents, and 50 instances of missing items would correspond to a mean item nonresponse rate of 50/(10 × 100), or 5%. This type of data can be assessed objectively with basic bibliographic descriptors and study characteristics corresponding to potential moderator variables, and were extracted from the 13 manuscripts by the first author.
Meta-Analysis Procedure
During a meta-analysis, an effect size that corresponds to the magnitude and direction of the results is calculated for each primary study. This enables synthesizing the results into the summary effect size, a single quantitative estimate also referred to as the overall or mean effect size (Borenstein et al., 2009; Card, 2012; Cumming, 2013). The 23 effect sizes included in this meta-analysis correspond to the item nonresponse rate difference (RD) in web versus other survey modes. The item nonresponse RD is expressed in percentage points, and is calculated as RD = R w − R c , where R w denotes the mean item nonresponse rate of the web survey mode, and R c denotes the mean item nonresponse rate of the compared mode. Thus, if the RD has a negative value, then the item nonresponse rate is smaller in the web survey mode (i.e., to the advantage of the web survey mode), and vice versa. For example, an R w of 5% and an R c of 10% would indicate that the item nonresponse rate is to the advantage of the web survey mode by five percentage points (RD = 0.05–0.10 = −0.05).
The summary effect size of this meta-analysis corresponds to the weighted mean difference in the item nonresponse rates in web versus other survey modes, and is computed under the random-effects model. This model allows for the true effect size to differ between primary studies, because the model takes into account between-study variance in addition to within-study variance. Because the true effect size is not assumed to be the same across all studies, the random-effects model allows for unconditional inferences, which makes it possible to generalize meta-analytic findings beyond the scope of the included primary studies (Borenstein et al., 2009, 2010; Hedges & Vevea, 1998).
Homogeneity analysis was performed in this study by using the Q-test, which tests the null hypothesis that all studies share a common effect size. A statistically significant Q would allow for rejection of the null hypothesis, and the conclusion that the results are heterogeneous (Card, 2012; Ellis, 2010). If meta-analytic results are determined to be homogeneous, then any variability between them occurs only due to chance, and the summary effect size can be argued to be a robust overall estimate. Conversely, in the case of heterogeneous results, systematic differences between the results of primary studies would have to be explored (Borenstein et al., 2009; Koricheva & Gurevitch, 2013; Littell et al., 2008).
To assess the scope of heterogeneity, that is, the percentage of the variability in effect sizes that occurs due to heterogeneity on a scale from 0 to 100% (Card, 2012; Littell et al., 2008), the I 2 statistic was used. Potential sources of heterogeneity and their magnitude were explored in using moderator analysis, which examines potential sources of variability corresponding to the characteristics of the primary studies that could explain inconsistencies in the results.
The aim of a meta-analysis is to include all relevant studies, but some could have been missed, because they were not published in the literature. The risk of publication bias is introduced if the omitted studies are systematically different from the included ones. To investigate whether some type of publication bias could have affected the meta-analysis findings, a visual inspection of the funnel plot was performed. A funnel plot is a scatterplot that compares individual study standard error on the Y axis and the distribution of the effect sizes on the X axis (Borenstein et al., 2010; Cumming, 2013; Sterne & Egger, 2001). In the ideal situation (i.e., with no indication of publication bias), the effect sizes on the X axis are distributed symmetrically around the summary effect size for any standard error value on the Y axis. Furthermore, the expected spread of the effect sizes is funnel-shaped and wider at the bottom, as smaller sample sizes have larger standard error values and vice versa. To supplement the visual examination with a formal statistical test, the linear regression test was used (Egger et al., 1997). It is a widely used formal statistical test for plot asymmetry. The test looks for a linear relationship between each effect size and its standard error, and investigates whether the association between effect sizes and standard errors is greater than can be expected to occur by chance. If the latter is found to be true, it implies asymmetry in the funnel plot and potential publication bias (Sterne et al., 2008).
To investigate the robustness of the meta-analytic findings, sensitivity analysis was used. If no meaningful differences in meta-analytic findings are found under different sets of statistical assumptions, the conclusions can be justified with greater confidence. However, if some differences are discovered, then conclusions are formed with caution, and alternative interpretations are considered (Cooper et al., 2009; Sterne et al., 2008).
Description of Included Manuscripts
The 13 eligible manuscripts reporting 16 studies and 23 effect sizes are listed in Table S2 in the Online Supplement, with references and summary information about the compared mode, the mean difference in the item nonresponse rate, and the number of respondents. The 13 manuscripts in Table S2 in the Online Supplement include 11 scientific journal papers, one government report (Hsu & McFall 2015), and one doctoral dissertation (Messer, 2012). The 23 effect sizes comprise comparisons of the web survey mode to mail (15 effect sizes), phone/CATI (5 effect sizes), face-to-face (2 effect sizes), and other self-administered paper modes (1 effect size where a paper questionnaire was distributed to students during school hours).
Findings
Weighted Mean Difference in the Item Nonresponse Rate
The forest plot in Figure 2 illustrates that all but four effect sizes fell within the range of [−0.05, 0.05], and that the differences in the item nonresponse rate were close to zero. The summary effect size equaled −0.016, 95% CI [−0.044, 0.012], suggesting that the weighted mean difference in the item nonresponse rate in web versus other survey modes equaled 1.6 percentage points to the advantage of the web survey mode. However, the summary effect was not statistically significant (p = .257), which, in the broader context, means that the survey mode has no effect on the difference in the item nonresponse rate. Cumulative forest plot listing the valuesa of the effect sizesb reported in manuscripts, the summary effect size under the random-effects model, and the corresponding 95% confidence interval. aA negative value indicates that the difference in the mean item nonresponse rate is to the advantage of the web survey mode. bThe labels on the left-hand side of Figure 2 comprise the first author of the corresponding manuscript, the number of the study, and the effect size number within the manuscript. For example, the label [Kongsved_2007]_s1.es1 refers to the first study (i.e., s1) and the first effect size (i.e., es1) of the manuscript Kongsved et al. (2007). The effect size labels and values can be cross-referenced with Table S2 for additional information about the effect sizes reported in the manuscripts.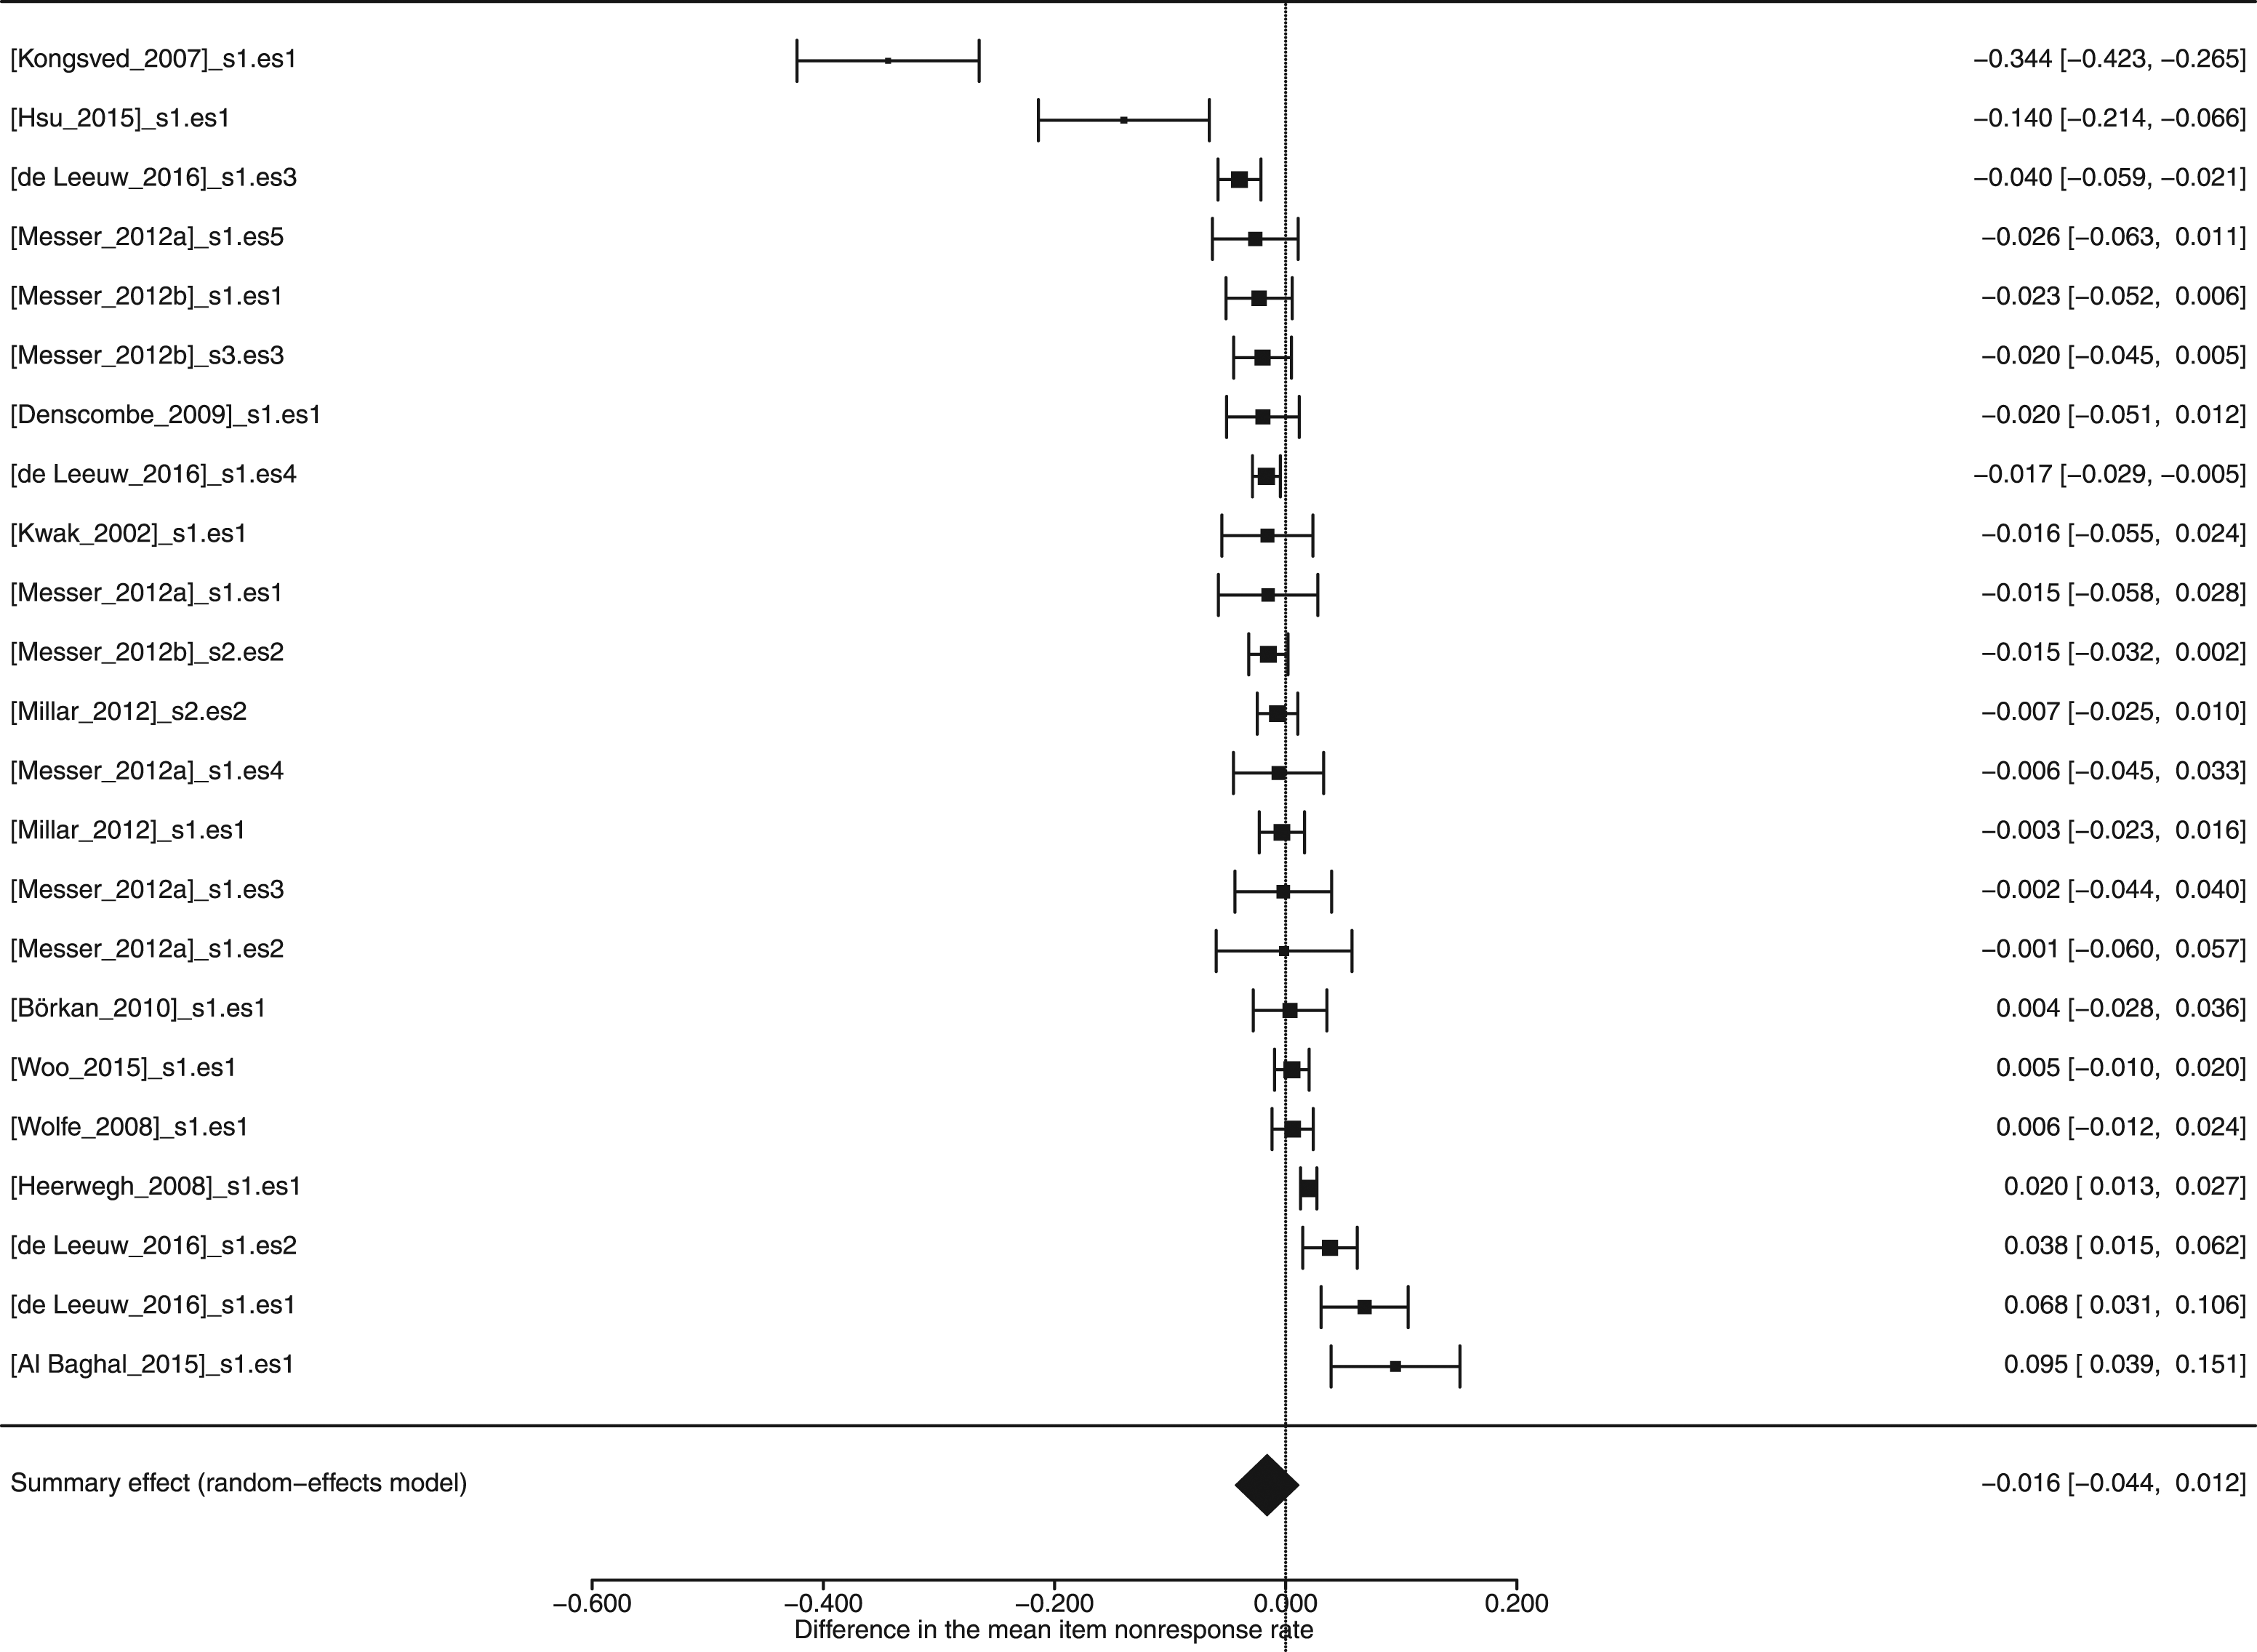
Figure 2 shows one outlier corresponding to the first line of the forest plot (i.e., Kongsved et al., 2007). After outlier and influential case diagnostics were performed (see Viechtbauer & Cheung, 2010), inspection of the plot (see Figure S1 in the Online Supplement) confirmed that the study above is the only one with large enough values in the standardized residuals and Cook’s distances plots to be considered an outlier with a potential influence on the results. The questionnaire’s design characteristics could potentially explain this outlier, as the questions were specifically prepared for women younger than 67 years who did not have a history of breast cancer and were referred for a mammography. The questionnaire relied heavily on scales, which are expected to increase task difficulty and, consequently, influence response quality. For example, under strong satisficing, respondents might respond that they do not know the answer to a question instead of reporting an opinion (Krosnick, 1991). Furthermore, the web version included reminders for missing answers, which could not be implemented in the compared mail mode. The implications of including this outlier in the analysis are discussed in the Sensitivity and Publication Bias Analysis section.
Homogeneity analysis revealed a statistically significant Q statistic (see the Meta-Analysis Procedure section) of 190.6 (df = 22, p < 0.0001), and thus, heterogeneity of the effect size distribution. I2 equaled 97.3%, and suggested a high degree of heterogeneity. Because sampling variation seemed to exist not only due to random sampling errors, moderator variables that could explain systematic differences between the effect sizes are discussed in the Moderator Analysis section.
Sensitivity and Publication Bias Analysis
Three sensitivity analyses were performed (see Table S3 in the Online Supplement). The first one repeated the analysis, while within-manuscript dependencies were taken into account using a multilevel random-effects model. The second sensitivity analysis included only the 16 effect sizes that compared web and self-administered survey modes. The third sensitivity analysis removed the previously discussed outlier (i.e., Kongsved et al., 2007).
Taking within-manuscript dependencies (i.e., effect sizes and studies in the same manuscript) into account resulted in a slightly larger difference in the item nonresponse rate (i.e., −0.029 vs. the initial −0.016), but the summary effect size remained statistically nonsignificant. Including comparisons of only web and self-administered survey modes also resulted in a larger item nonresponse RD (i.e., −0.034) that remained statistically nonsignificant. Omitting the outlier resulted in a smaller item nonresponse RD (−0.004) that also remained statistically nonsignificant. On the whole, all three sensitivity analyses suggested that the results remained in line with the original interpretation, which argued that the survey mode has no overall effect on the item nonresponse rate.
The funnel plot in Figure 3 illustrates the observed effect sizes on the X axis and the corresponding standard errors on the Y axis. Visual examination of Figure 3 suggests that more points are distributed on the positive side at the top and middle of the plot, which points to some asymmetry of the plot distribution and potential positivity bias of the manuscripts. In addition, the outlier mentioned previously (i.e., Kongsved et al., 2007) is visible in the lower left, with high values for the standard error and the effect size. The situation thus seems similar to typical cases of publication bias, where symmetry is usually found at the top of the plot, with slight asymmetry in the middle with a few studies missing, and more apparent asymmetry at the bottom of the plot (Borenstein et al., 2010; Cumming, 2013). Funnel plot comparing the standard errors and effect sizes of the primary studies included in the meta-analysis.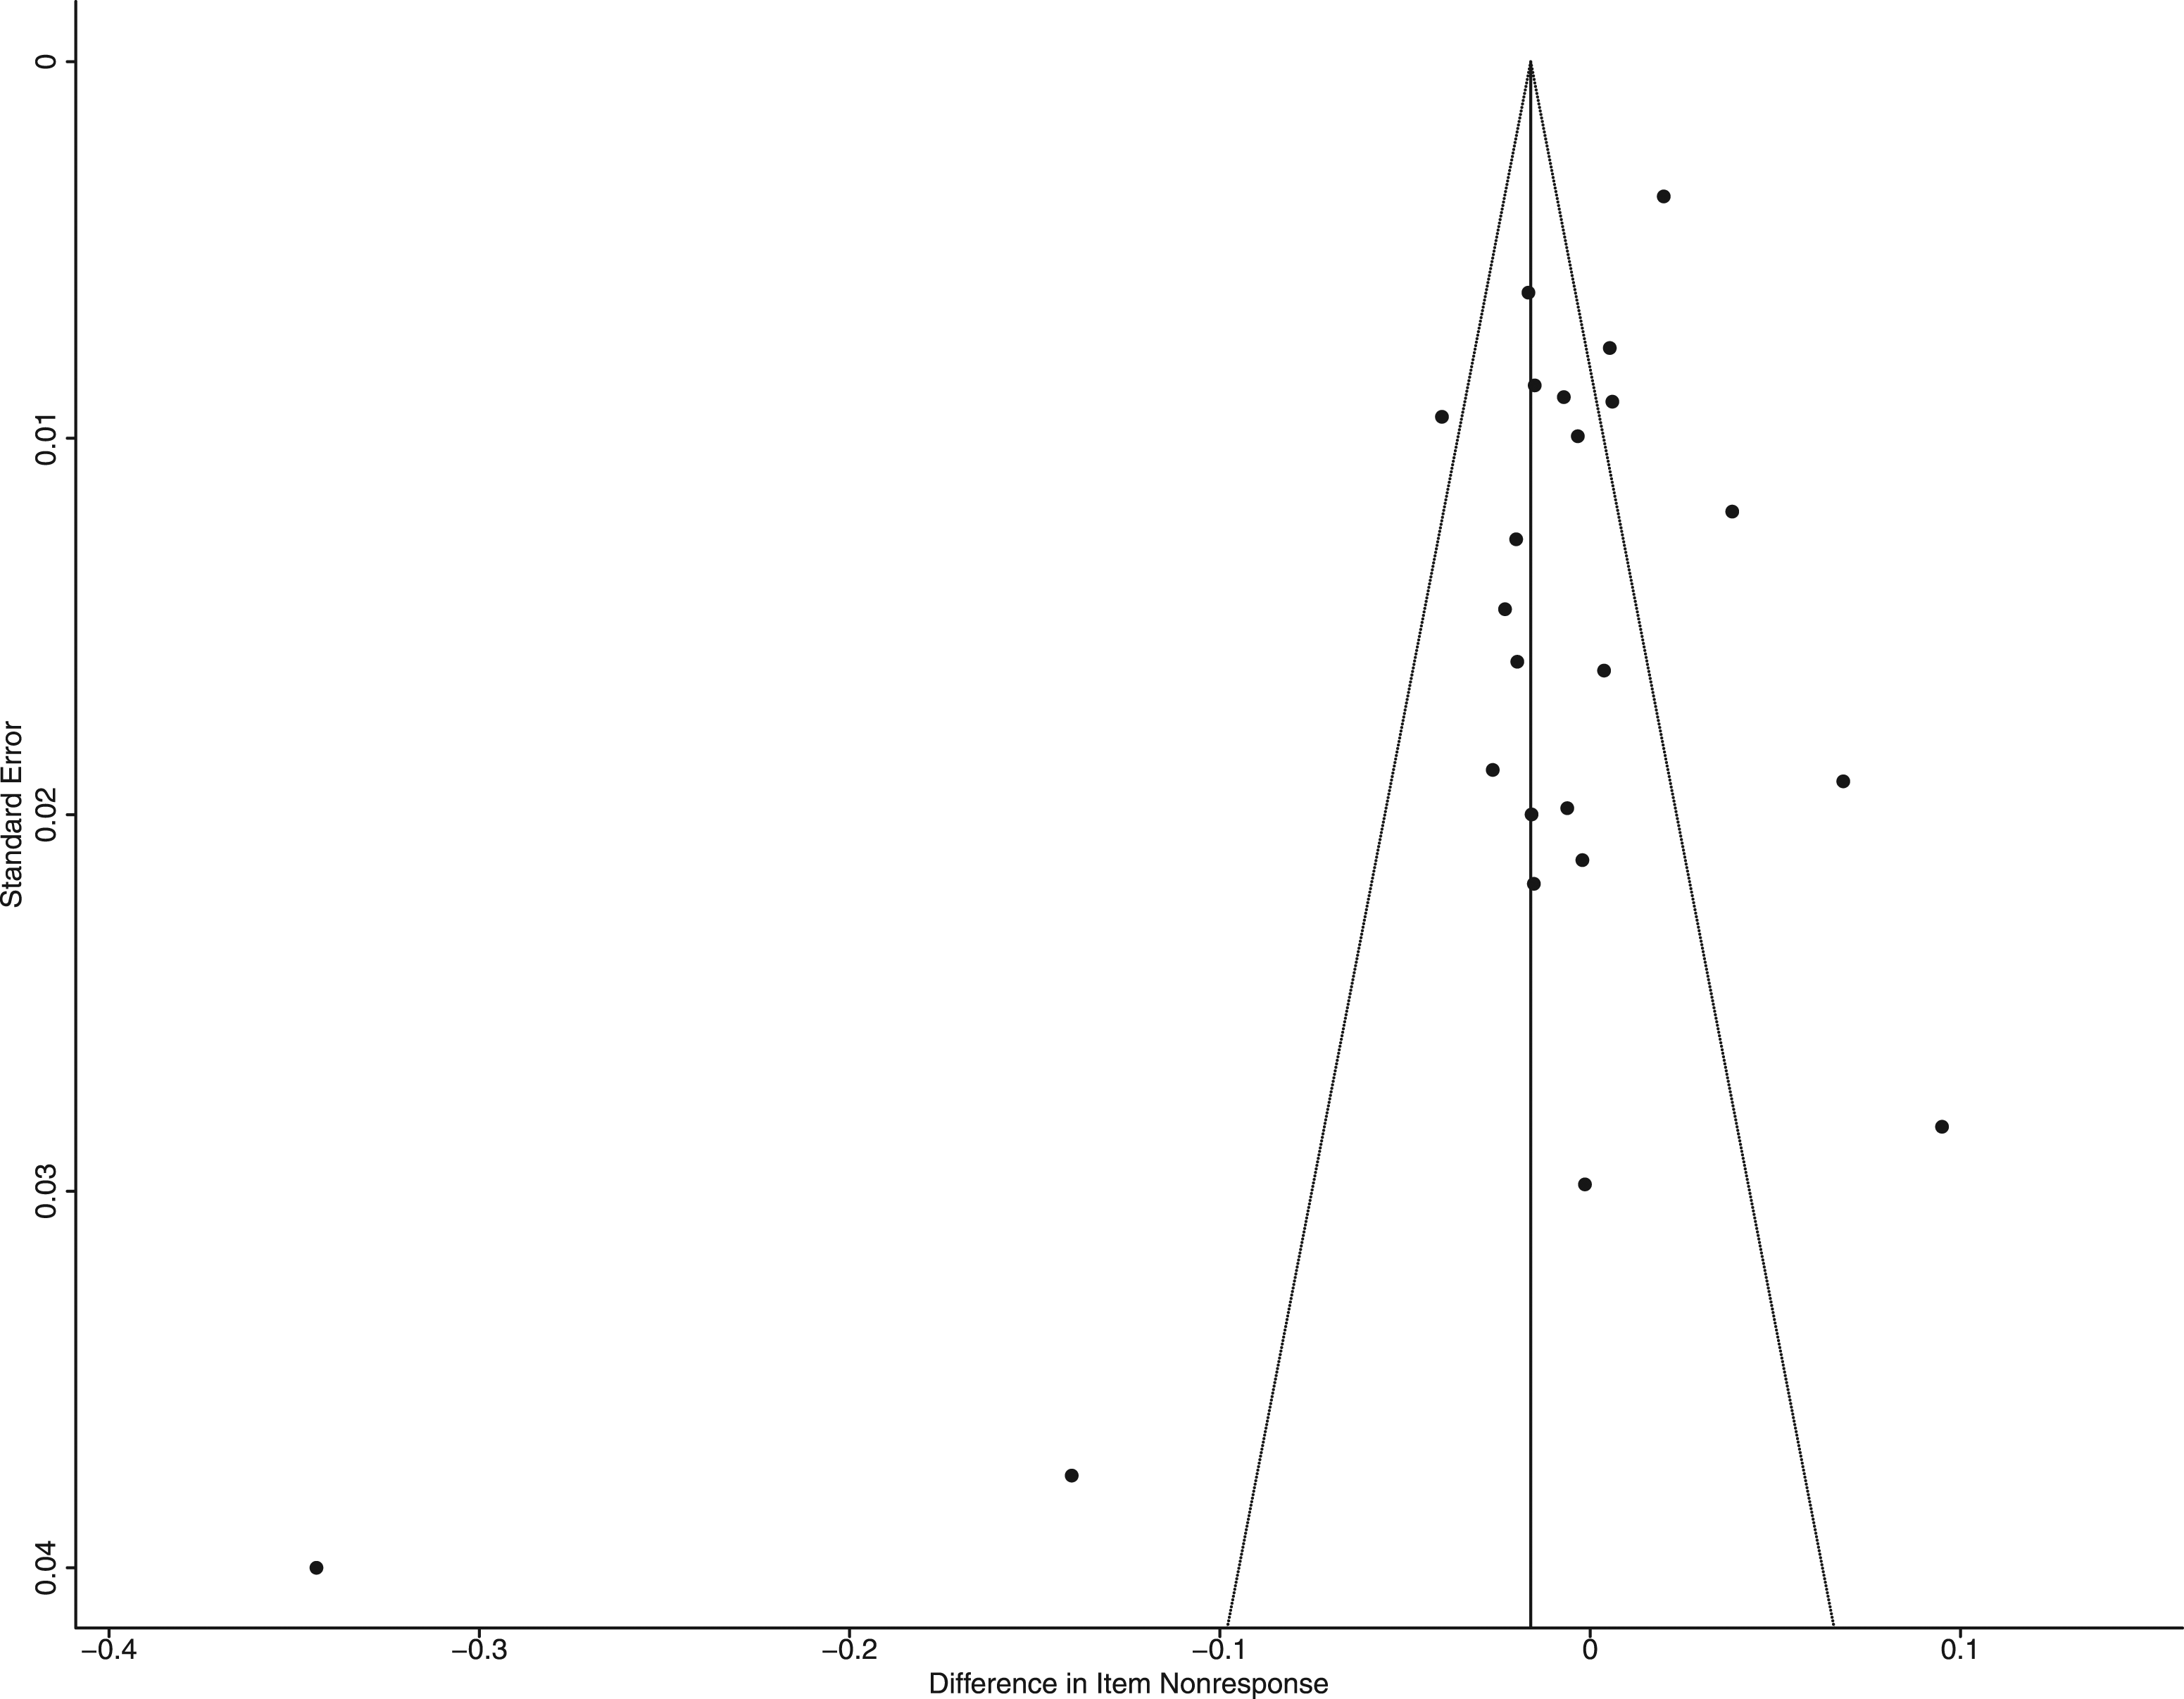
The literature cautions about the difficulty of interpreting funnel plots when a low number of studies are available for a meta-analysis (Anzures–Cabrera & Higgins, 2010; Sterne et al., 2008). As visual inspection of the funnel plot is subjective, it should be always combined with a formal statistical test (Egger et al., 1997). Accordingly, the regression test for funnel plot asymmetry was performed; it showed a statistically significant result (p = .005), suggesting that the association between the effect sizes and the standard errors is greater than can be expected to occur by chance. Thus, the visual inspection of the plot and the regression test suggested the presence of publication bias. This was to be expected due to the low number of experimental studies available for the meta-analysis, and the substantial heterogeneity that was detected.
Moderator Analysis
Summary of Statistically Significant Moderators Influencing the Difference in the Item Nonresponse Rate in Web versus Other Survey Modes.
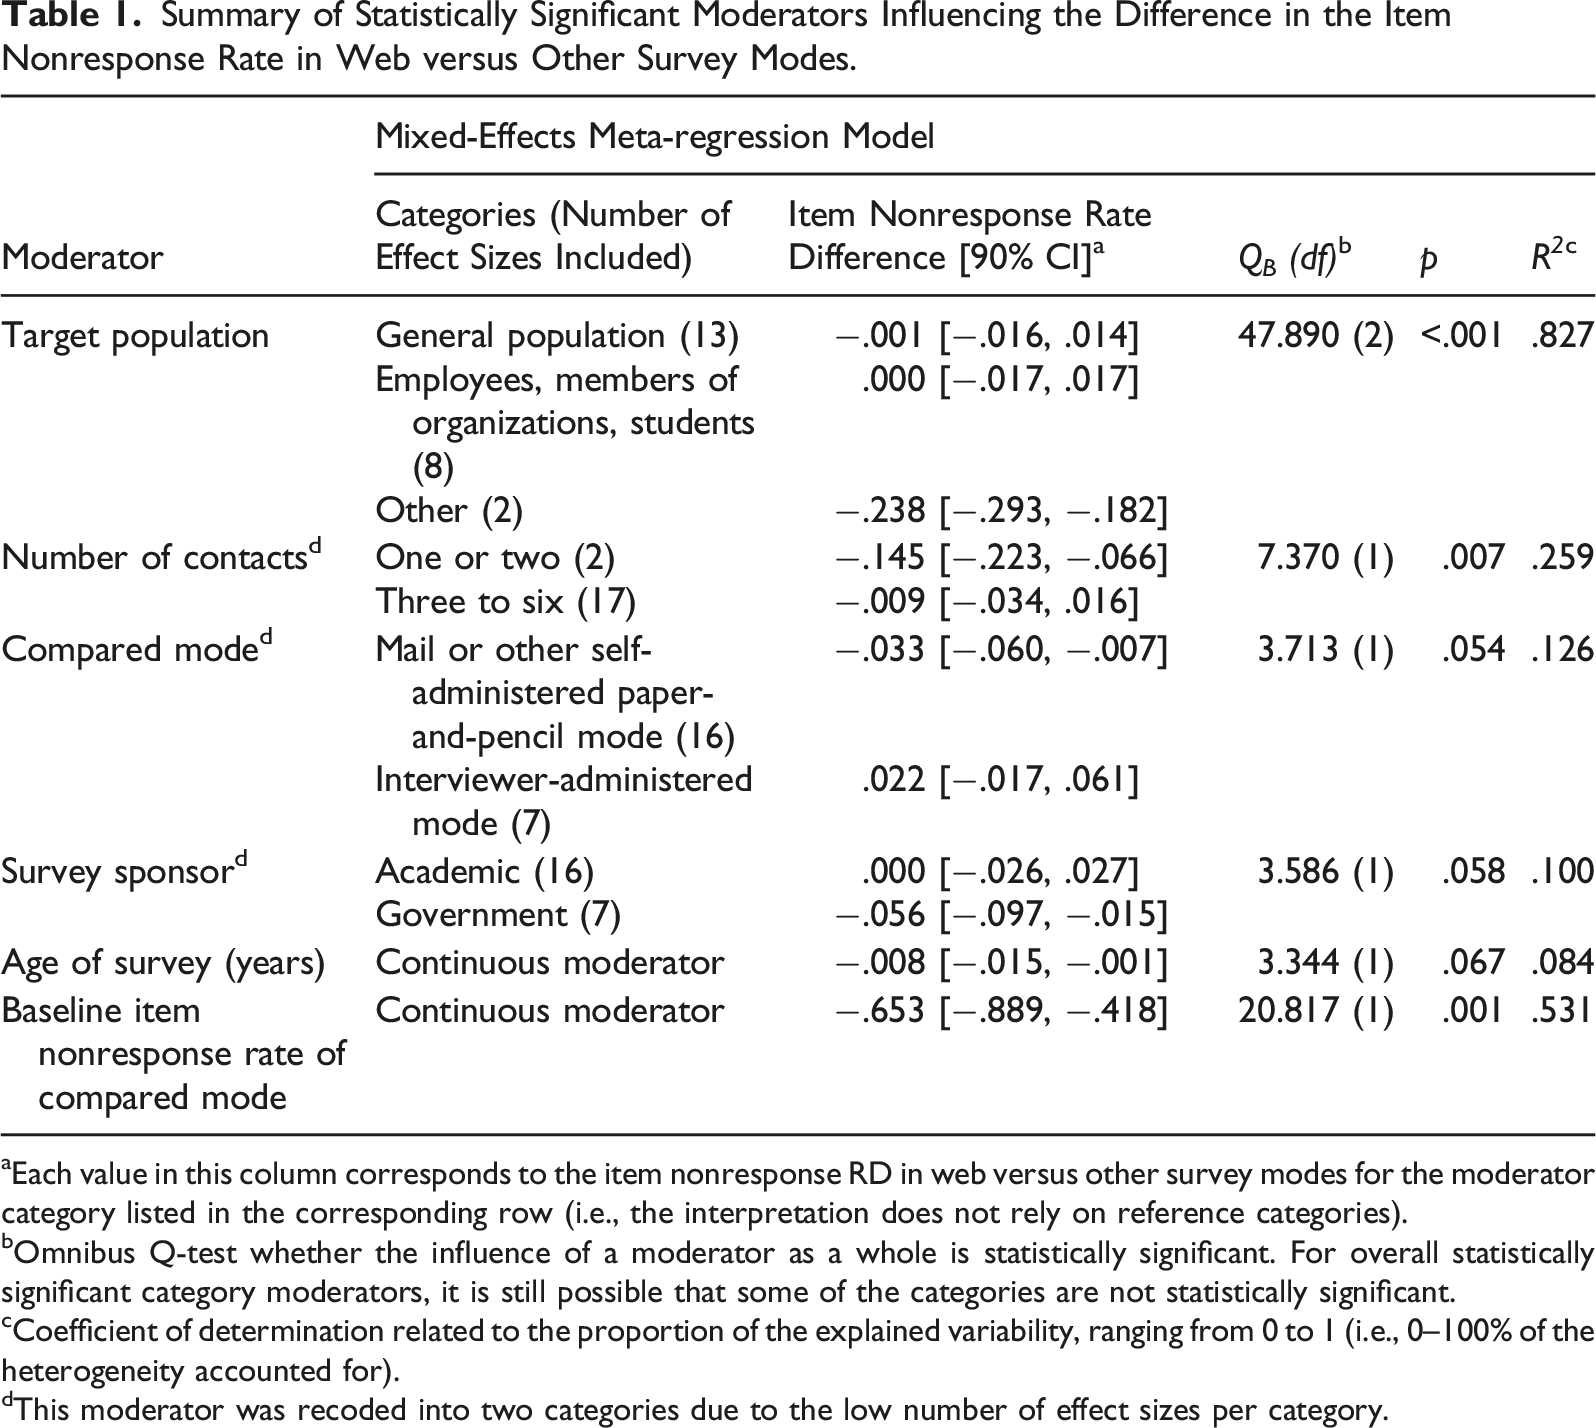
aEach value in this column corresponds to the item nonresponse RD in web versus other survey modes for the moderator category listed in the corresponding row (i.e., the interpretation does not rely on reference categories).
bOmnibus Q-test whether the influence of a moderator as a whole is statistically significant. For overall statistically significant category moderators, it is still possible that some of the categories are not statistically significant.
cCoefficient of determination related to the proportion of the explained variability, ranging from 0 to 1 (i.e., 0–100% of the heterogeneity accounted for).
dThis moderator was recoded into two categories due to the low number of effect sizes per category.
Summary of Statistically Nonsignificant Moderators Influencing the Difference in the Item Nonresponse Rate in Web versus Other Survey Modes.
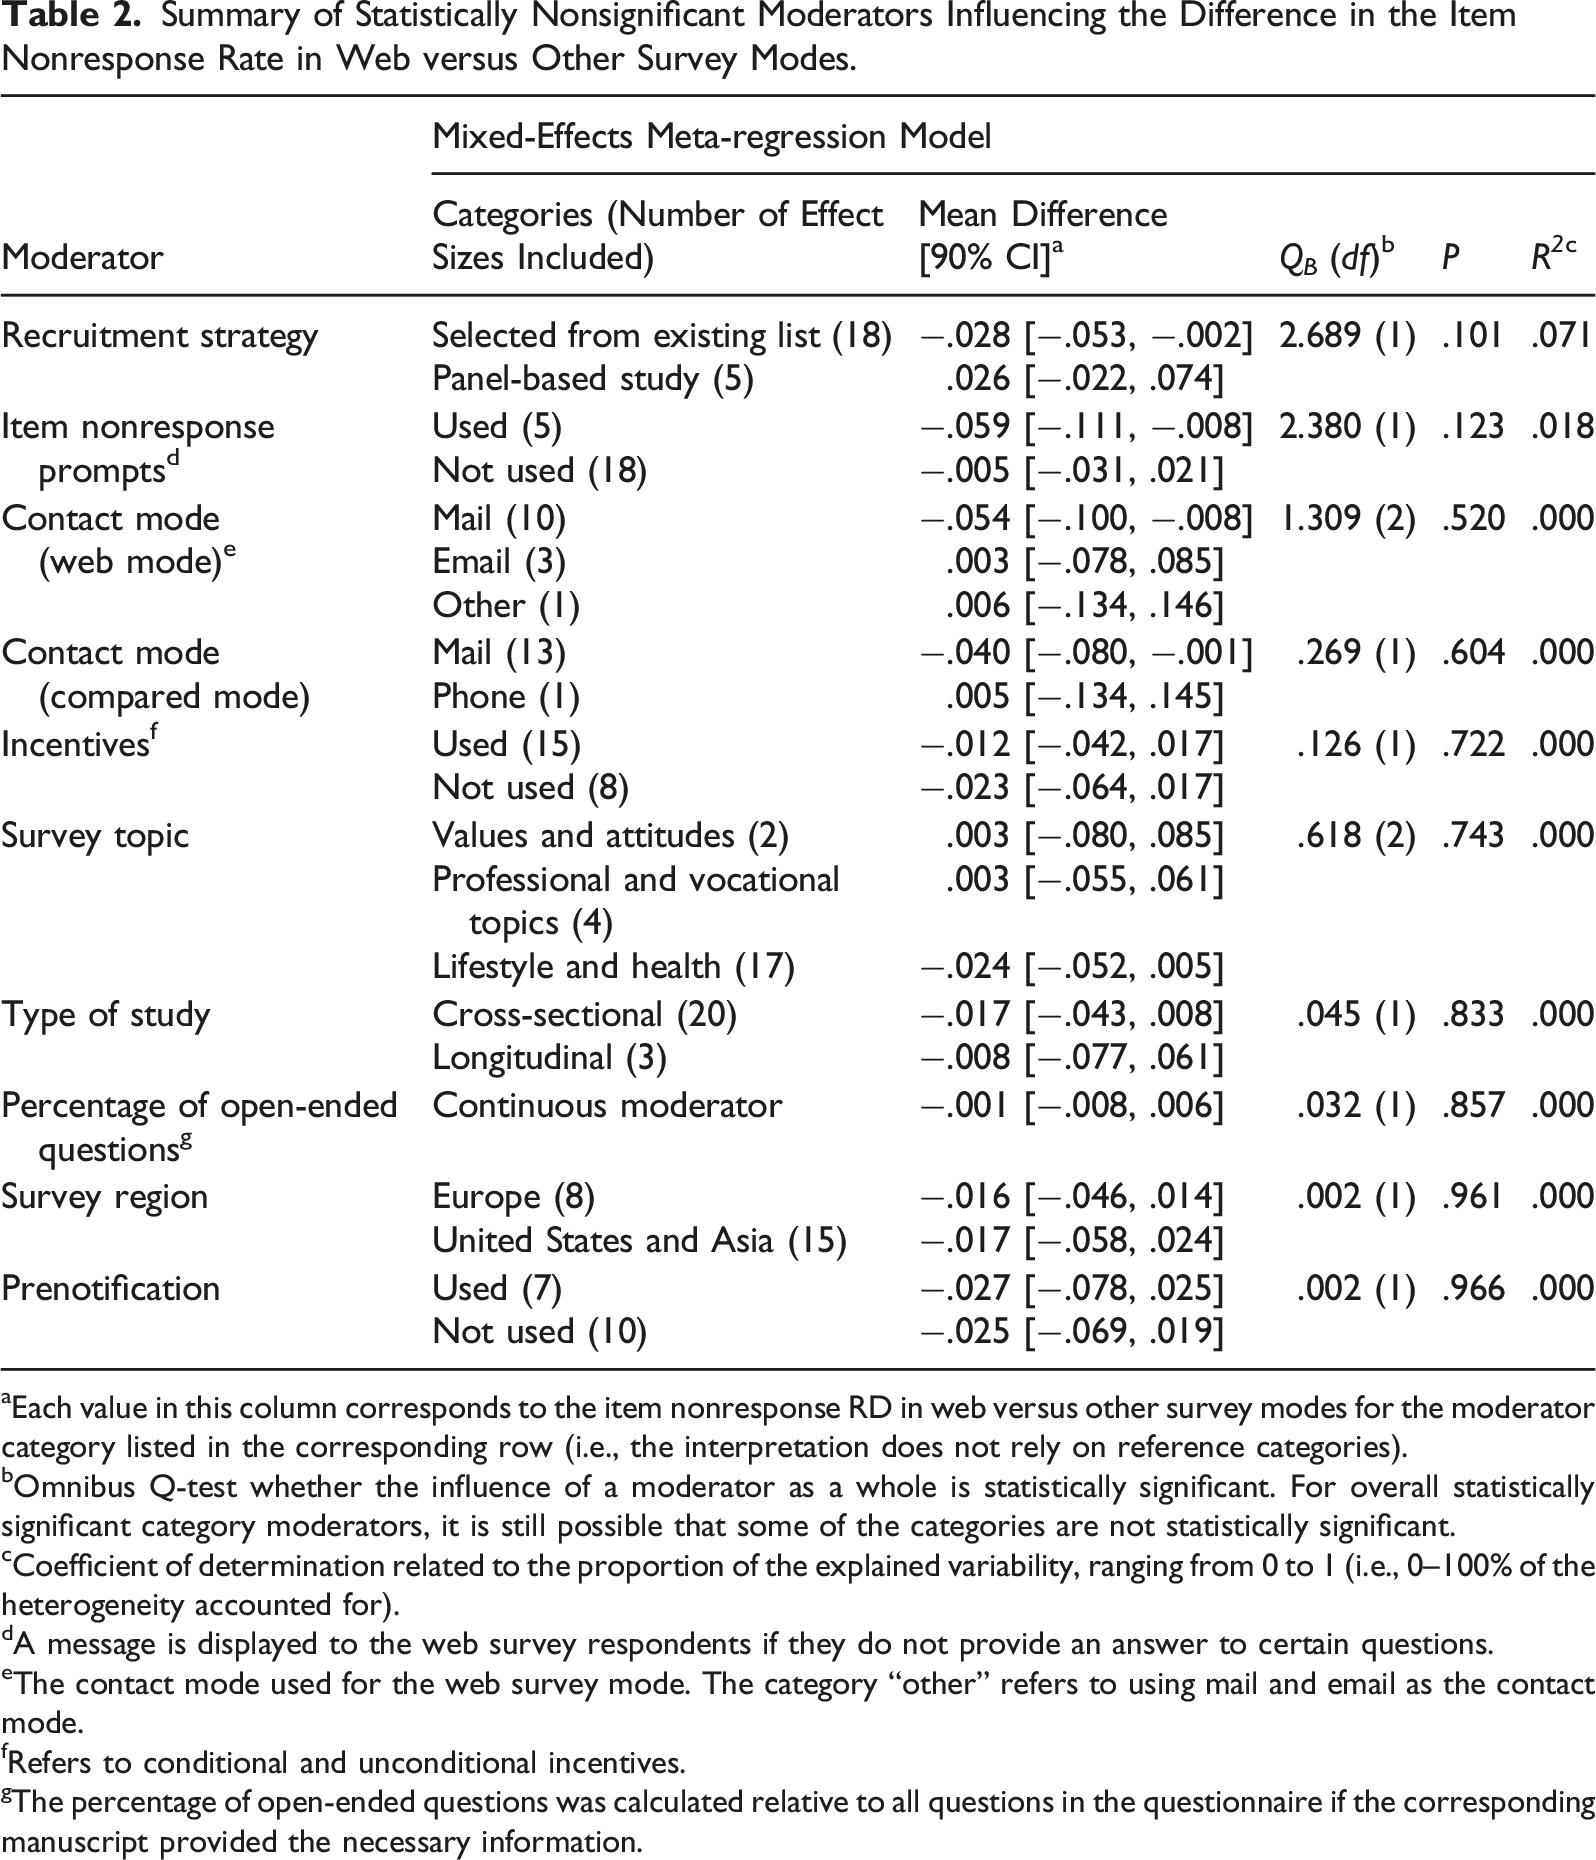
aEach value in this column corresponds to the item nonresponse RD in web versus other survey modes for the moderator category listed in the corresponding row (i.e., the interpretation does not rely on reference categories).
bOmnibus Q-test whether the influence of a moderator as a whole is statistically significant. For overall statistically significant category moderators, it is still possible that some of the categories are not statistically significant.
cCoefficient of determination related to the proportion of the explained variability, ranging from 0 to 1 (i.e., 0–100% of the heterogeneity accounted for).
dA message is displayed to the web survey respondents if they do not provide an answer to certain questions.
eThe contact mode used for the web survey mode. The category “other” refers to using mail and email as the contact mode.
fRefers to conditional and unconditional incentives.
gThe percentage of open-ended questions was calculated relative to all questions in the questionnaire if the corresponding manuscript provided the necessary information.
Two examples of how to interpret Tables 1 and 2 are provided below. For both examples, please recall that when the item nonresponse RD has a negative value, the item nonresponse rate is smaller in the web survey mode (i.e., to the advantage of the web survey mode) and vice versa. In the first example, the item nonresponse RD in the first category of the “compared mode” moderator was −0.033 (Table 1). This means that there was a difference of 3.3 percentage points in the item nonresponse rate to the advantage of the web mode compared to mail and other self-administered paper-and-pencil modes. In the second example, the item nonresponse RD in the “baseline item nonresponse rate of compared mode” continuous moderator was −0.653 (Table 1). This means that the item nonresponse RD decreased by 0.65 percentage points (to the advantage of the web mode) when the baseline item nonresponse rate of the compared mode increased by one percentage point.
For two of the moderators related to survey characteristics (i.e., type of compared mode and target population), a statistically significant effect was expected when discussing RQ.2 above. The type of compared mode moderator (p = .054) suggested that comparing web surveys to mail and other self-administered paper modes resulted in a difference in the item nonresponse rate of 3.3 percentage points to the advantage of the web survey mode. When web surveys were compared to the interviewer-administered mode, the difference in the item nonresponse rate was 2.2 percentage points, but to the advantage of the interviewer-administered mode. These findings generally match the conclusions of the literature review presented in the section that includes the meta-analysis research questions which proposed that web surveys have a higher item nonresponse rate compared to that of face-to-face and telephone surveys.
The target population moderator (p < .001) showed no difference in item nonresponse rate in web versus other survey modes for samples of the general population, employees or members of organizations, and students. A difference of almost 23.8 percentage points (to the advantage of the web survey mode) was suggested for “other” types of samples, which, in this analysis, consisted of one effect size for older adults (with the survey topic of economic decision making) and one effect size for patients (with the survey topic covering healthcare plus several other topics). Perhaps patients and older adults perceive the level of privacy as higher in web questionnaires compared to interviewer-administered modes, when it comes to questions about health and similar sensitive topics.
Another four moderators related to survey characteristics (i.e., number of contacts, survey sponsor, survey age, and baseline level of item nonresponse) were statistically significant. This was contrary to the expectations of RQ.2, as it was presumed that contacting (i.e., number of contacts) and survey sponsorship as survey design characteristics affect the response process before the questionnaire is started (i.e., unit nonresponse rate) rather than while the questionnaire is being completed. As for the survey age, it was expected that the difference in the item nonresponse rate was stable during the survey implementation period, as a similar trend was previously discovered for the difference in unit nonresponse rates over 10 years (see Daikeler et al., 2020; Lozar Manfreda et al., 2008).
Specifically, the number of contacts moderator (p = .007) suggested that increasing the number of contacts from “one or two” to “three to six” diminishes the advantage of the web survey mode in terms of the item nonresponse rate, by 13.6 percentage points. The high number of repeated requests in web surveys may present the risk that the message is perceived as unsolicited, and thus, may lower respondent engagement, resulting in a higher item nonresponse rate (Cho & Larose, 1999).
The survey sponsor moderator (p = .058) indicated that there were no statistically significant differences in item nonresponse rates between web and other survey modes in academic-sponsored surveys. For government-sponsored surveys, the difference was 5.6 percentage points to the advantage of the web survey mode. With the proliferation of e-government, a possible reason for the advantage of the web survey mode in government-sponsored surveys could be that respondents are increasingly accustomed to web communication with government services.
The fifth statistically significant moderator was survey age (p = .084), which suggested that older studies reported a larger advantage of the web survey mode in terms of the item nonresponse rate. Namely, increasing the survey age by 1 year increased the item nonresponse rate by .8 of a percentage point to the advantage of the web survey. The diminishing advantage of web surveys over time could be explained by the predominant role played by the web mode coupled with the over-surveying 4 phenomenon in the general survey-taking climate. Another possibility is that the general trend of declining survey response rates over the past decades (ESOMAR, 2020) might be related to item nonresponse in surveys over time and might occur even more in the web mode due to over-surveying.
The sixth statistically significant moderator controlled for the baseline level of item nonresponse in the compared survey mode. The results indicated that this moderator suggested a “ceiling effect” (i.e., the higher the item nonresponse baseline, the smaller the difference). Specifically, a 1 percentage point increase in the baseline item nonresponse rate of the compared mode, on average, resulted in .65 of a percentage point decrease in the difference in the item nonresponse rate to the advantage of the web mode.
Additionally, the statistically significant moderators should be interpreted with caution. Due to the few effect sizes in different subcategories, the moderator analyses above were conducted one at a time (i.e., not controlled for each other). When the six moderators above were simultaneously included together in a model (p < .001, R 2 = .817), the only statistically significant categories were the target population of “other” (p < .01) and the number of contacts (p < .1; see Table S4 in the Online Supplement). However, despite the low number of manuscripts available for the meta-analysis, the implications of these moderators are important for survey practice.
The remaining 10 moderators were not statistically significant (Table 2), but several are of interest due to their relevance for survey practice. Contrary to the expectations discussed in the research questions, three moderators—the survey topic, the use of prompts in the web survey mode, and the percentage of open-ended questions—had no statistically significant effect on the difference in the item nonresponse rate in web versus other survey modes. In the context of prompts, perhaps their use could have resulted in increased breakoffs (e.g., Albaum et al., 2011) instead of affecting item nonresponse. A possible reason for the lack of impact of survey topic and open-ended questions on item nonresponse could be that web panel studies further compensate for a lack of interviewer probing. However, the list-based versus panel recruitment strategy moderator was not statistically significant (p = .101), even though it was the only one close to the .10 threshold. The meta-analyses on the effect of mode on unit nonresponse (i.e., Daikeler et al., 2020; Lozar Manfreda et al., 2008) found that the sample recruitment strategy was a statistically significant moderator. However, this did not appear to be the case in the present meta-analysis. Furthermore, it is perhaps not surprising that incentives were not a statistically significant moderator in the present meta-analysis, as they have been shown to affect unit nonresponse (Groves et al., 2009), but have an unclear effect on item nonresponse (Shaw et al., 2001; Yu et al., 2017).
Conclusion
For certain surveys, item nonresponse can represent a fundamental data quality issue (Groves et al., 2009). Similarly to unit nonresponse, the key issue for item nonresponse is the risk of nonresponse bias, which leads to incorrect survey estimates (Bethlehem & Biffignandi, 2012). The main implication of this paper is that the threat that item nonresponse represents for survey data quality is no greater in web surveys than in other survey modes. More precisely, the summary effect size of the meta-analysis suggested that the item nonresponse rate is lower in web surveys by 1.6 percentage points, but it is not statistically significant, and cannot be generalized beyond the sample of 13 manuscripts. Thus, overall, there seems to be no difference in the item nonresponse rate when web surveys are compared to other survey modes.
This paper complements previous meta-analyses that investigated differences in unit nonresponse between web and other survey modes (i.e., Daikeler et al., 2020; Lozar Manfreda et al., 2008). Further, it fills a research gap in survey methodology that was identified by a systematic review of meta-analyses in this field (Čehovin et al., 2018). While this paper found no overall difference in item nonresponse rate between web and other survey modes, two previous meta-analyses found that unit nonresponse in web surveys is 11–12 percentage points higher (on average) compared to other survey modes (Daikeler et al., 2020; Lozar Manfreda et al., 2008). Overall, while web surveys are (on average) associated with higher unit nonresponse rates, item nonresponse rates in web surveys are similar compared to other modes.
A high degree of heterogeneity (I 2 = 97.3%) was found, which, with the moderator analysis, suggests that although there is, overall, no difference in the item nonresponse rate in web versus other survey modes, there is an advantage of web surveys over other modes in terms of item nonresponse in six situations. The first situation is when the web survey is compared to a self-administered paper mode, instead of an interviewer-administered mode. The second situation is when the target population consists of patients or older adults instead of consisting of the general population, employees or members of organizations, and students. The third situation is when fewer contact attempts are used in the survey’s contacting process. The fourth situation is when the survey is sponsored by a government organization, instead of an academic institution. The fifth situation is when the age of the survey study increases. No other moderators had a statistically significant effect on the difference in the item nonresponse rate in web versus other survey modes. The sixth situation relates to a “ceiling effect,” where the higher baseline item nonresponse rate of the compared mode results in a smaller difference in the item nonresponse rate to the advantage of the web mode.
Among the limitations of the present meta-analysis was the low number of available manuscripts (i.e., 13). A systematic review of meta-analyses in survey methodology (Čehovin et al., 2018) revealed that although meta-analyses of topics for which more experimental research is available may identify a larger number of eligible manuscripts (e.g., 75 for unit nonresponse in web vs. other survey modes in Daikeler et al., 2020), meta-analyses in other areas may identify a similarly low number of eligible manuscripts (e.g., 14 for breakoffs in mobile web surveys in Mavletova & Couper, 2015). Although the low number of manuscripts presents a limitation in relation to the precision of the estimates, the findings of a meta-analysis based on a low number of studies are still more informative compared to the findings of individual experimental studies.
In the present meta-analysis, the summary effect of the meta-analysis of −.016 was not statistically significant, and had a wide 95% confidence interval of [−.044, .012], which can be attributed to the low number of available manuscripts. In addition, this also means that there is low power of detecting effects when subgroups are analyzed in the moderator analysis. For example, certain categories of the moderator variables contained as few as two effect sizes, resulting in wider confidence intervals. Thus, it is possible that a more precise estimate of the summary effect could be computed, and that additional moderators could reach statistical significance if additional eligible experimental studies existed in the scientific literature.
The presence of publication bias that could have influenced the results of the meta-analysis presents another limitation of this paper. The indication of publication bias could have occurred due to the selective publication of studies, as studies reporting statistically significant and large effect sizes are more likely to be published (Borenstein et al., 2010; Cumming, 2013). Another possible explanation was the low number of manuscripts available for inclusion in the meta-analysis. Funnel plots used to detect publication bias are difficult to interpret with a low number of studies. The corresponding linear regression test of funnel plot asymmetry also depends on a reasonable number of studies with a reasonable amount of dispersion (Anzures–Cabrera & Higgins, 2010; Sterne et al., 2008).
Future experimental research investigating item nonresponse in web versus other survey modes would provide more manuscripts for inclusion in the meta-analysis. This would enable researchers to compute the summary effect size with greater precision, and potentially, investigate additional moderator variables. Furthermore, future studies should address relevant moderators of item nonresponse for which there were only a few observations available in this study (e.g., use of item nonresponse prompts) or which could not be coded due to lack of information in the eligible manuscripts (e.g., the use of grid questions). Additionally, as the main concern of nonresponse is that it may lead to biased estimates, future research could investigate the strength of the relation between item nonresponse rates and nonresponse bias in relation to different survey modes.
Supplemental Material
sj-csv-1-ssc-10.1177_08944393211056229 – Supplemental Material for Item Nonresponse in Web Versus Other Survey Modes: A Systematic Review and Meta-Analysis
Supplemental Material, sj-csv-1-ssc-10.1177_08944393211056229 for Item Nonresponse in Web Versus Other Survey Modes: A Systematic Review and Meta-Analysis by Gregor Čehovin, Michael Bosnjak and Katja Lozar Manfreda in Social Science Computer Review
Supplemental Material
sj-pdf-2-ssc-10.1177_08944393211056229 – Supplemental Material for Item Nonresponse in Web Versus Other Survey Modes: A Systematic Review and Meta-Analysis
Supplemental Material, sj-pdf-2-ssc-10.1177_08944393211056229 for Item Nonresponse in Web Versus Other Survey Modes: A Systematic Review and Meta-Analysis by Gregor Čehovin, Michael Bosnjak and Katja Lozar Manfreda in Social Science Computer Review
Supplemental Material
sj-r-3-ssc-10.1177_08944393211056229 – Supplemental Material for Item Nonresponse in Web Versus Other Survey Modes: A Systematic Review and Meta-Analysis
Supplemental Material, sj-r-3-ssc-10.1177_08944393211056229 for Item Nonresponse in Web Versus Other Survey Modes: A Systematic Review and Meta-Analysis by Gregor Čehovin, Michael Bosnjak and Katja Lozar Manfreda in Social Science Computer Review
Footnotes
Data Availability
The data are available in the Online Supplement.
Declaration of Conflicting Interests
The author(s) declared no potential conflicts of interest with respect to the research, authorship, and/or publication of this article.
Funding
The author(s) received no financial support for the research, authorship, and/or publication of this article: This paper was supported by the co-financing of scientific and research cooperation between the Republic of Slovenia and the Federal Republic of Germany in 2018–2019 by the German Academic Exchange Service (DAAD, ID 57402391) and the Slovenian Research Agency (ARRS, ID BI-DE/18-19-009) with the project title Evidence-Based Survey Methodology: Contemporary Topics. The paper was also supported by the following Slovenian Research Agency (ARRS) programs and projects: Internet Research (P5-0399), Integration of Mobile Devices into Survey Research in Social Sciences (J5-8233), Using paradata to evaluate response quality in surveys (J5-9334), Digital transformation of quantitative data collection in social science research (NI-0004), and Gregor Čehovin’s Young Researcher fellowship, financed by the national budget through a contract between the Slovenian Research Agency and the Faculty of Social Sciences, University of Ljubljana.
Software Information
The analyses were performed using R Project for Statistical Computing (R Core Team, 2018) version 3.5.1, with the RStudio development environment (RStudio Team, 2016) and metafor package (Viechtbauer, 2010) version 2.0-0. The code used to produce the results from the data is available in the Online Supplement.
Supplemental Material
Supplemental material for this article is available online.
Notes
Author Biographies
References
Supplementary Material
Please find the following supplemental material available below.
For Open Access articles published under a Creative Commons License, all supplemental material carries the same license as the article it is associated with.
For non-Open Access articles published, all supplemental material carries a non-exclusive license, and permission requests for re-use of supplemental material or any part of supplemental material shall be sent directly to the copyright owner as specified in the copyright notice associated with the article.