
Abstract
In higher education institutions, web surveys are frequently used for educational, research, and administrative purposes. One of the consequences of this is increasing oversurveying of higher education students, leading to low response rates. This naturally has important implications for the validity of web survey results. Consequently, we set up a methodological experiment at Tilburg University, the Netherlands, whereby the total student population was invited to participate in a web survey in order to investigate which features of contact design can positively influence web survey participation. We particularly focus on subject line content, the communication of deadlines and their timing, as well as the delays between contact moments. The results reveal that students were more likely to respond to a web survey invitation when the subject line is written in the national language in multilingual contexts. Furthermore, although the findings did not indicate an advantage of using a deadline, they also suggested that if a deadline is to be used, a longer deadline might be more beneficial.
Keywords
Today, web surveys are an essential part of daily academic, administrative, and educational practice in most higher education institutions across the Global North. Students, administrators, teachers, and researchers increasingly use such surveys for a variety of purposes, ranging from short quizzes within courses to online thesis research for bachelor and master theses, course evaluations, and scientific (survey) research. This is a logical development, as web surveys offer a cheap and fast way of collecting data (Toepoel, 2017; Van Mol, 2017), and individuals - in developed societies at large - have increasing access to a variety of tools to organize such surveys (e.g., Google Forms, LimeSurvey, Presenterswall, Qualtrics, SurveyGizmo, SurveyMonkey and ThesisTools, just to name a few). In addition, higher education students are a relatively easy group to survey online, as coverage and sampling are generally not a real issue (Crawford et al., 2001; Van Mol, 2017). As such, they are often a popular group of respondents for scientific research, both among scientists and students. Nevertheless, the increased accessibility, low cost, and popularity of web surveys also come at a price, namely oversurveying (Sauermann & Roach, 2013). A study of Van Mol (2017), for example, indicated that students at the University of Antwerp (Belgium) received on average a survey invitation once every 1.5 days in 2014. Higher education institutions are not the only institutions that regularly ask students to complete questionnaires, they also regularly receive invitations for—for example—customer satisfaction surveys, marketing research, social media questionnaires, and so on. Consequently, a decline in response rates is observed in society at large (Keusch, 2015; Manzo & Burke, 2012; Sauermann & Roach, 2013) as well as among higher education populations (Porter et al., 2004; Thielsch et al., 2018). This decline in response rates of web surveys among students in higher education has been linked to “survey fatigue,” whereby students are reluctant to participate in web surveys because of the numerous invitations they receive for such surveys, and presents a real concern.
Survey fatigue is a significant problem for scientific research and data collections to evaluate administrative and educational processes such as teaching evaluations (Thielsch et al., 2018). Obviously, low response rates lead to lower sample sizes and statistical power, and those who answer are likely to differ from those who do not answer (Manzo & Burke, 2012; Van Mol, 2017). Such nonresponse bias (Crawford et al., 2001; Manzo & Burke, 2012) is considered one of the most threatening factors for the validity of web survey results (Bosnjak et al., 2005; Manzo & Burke, 2012; Sauermann & Roach, 2013). As a result, there is a real need among higher education practitioners and researchers to better understand web survey response behavior in general, as well as specifically among higher education populations, in order to develop strategies and techniques that can help to improve response rates and thus reduce nonresponse bias. Keusch (2015) distinguished between three categories of factors that influence participation in surveys, namely (1) societal-level factors, (2) characteristics of the sample person, and (3) attributes of the survey design. In this article, we particularly focus on this last category, presenting empirical evidence from an experiment conducted among all students at Tilburg University, the Netherlands, in 2019. This higher education institution, furthermore, is characterized by the presence of a large number of international students (17.87% of the total student population in 2019 were international students who study a full degree), which presents particular challenges in terms of web survey design. As more systematic research is needed on web surveys to identify the factors that influence participation (Keusch, 2015), we specifically focus on contact design in this article—which remains an exception rather than the norm in the field (Van Mol, 2017). This approach allows to make four main contributions to the academic literature. First, we investigate how the content of the subject line influences web survey participation, an area that is in need of greater empirical investigation (Sappleton & Lourenço, 2016). We thereby pay particular attention to whether mentioning the organizer of the survey in the subject line makes a difference and differences when using single or bilingual invitations (in this case, Dutch and English), given the significant proportion of international students at Tilburg University. This is a particular important issue for survey researchers and practitioners who target heterogeneous populations in terms of language use, which might be the case at many non-Anglo-saxon higher education institutions. Second, only a handful of studies exist on the influence of deadlines on web survey response. In this article, we investigate whether including a deadline in the invitation email makes a difference. Furthermore, we also experimentally test different timings of deadlines—that is, are respondents more likely to respond when deadlines are closer or further away in time? Third, although the literature is conclusive about the fact that reminders can significantly increase web survey participation, less is known about the ideal delay between reminders (Blumenberg et al., 2019). Therefore, in our experimental design, we systematically differed the delays between the invitation and different reminders. Finally, the explicit focus on a population of higher education students is particularly relevant for staff and scholars at higher education institutions, as this is one of the groups that are often oversurveyed (Adams & Umbach, 2012; Van Mol, 2017).
Previous Research and Hypotheses
Subject Line Content
The experimental approach of our article regarding subject line content is based on persuasion models. These models postulate that individuals process information through peripheral or central processes (Kaptein et al., 2015). Following these models, we can expect that individuals screen messages (in our case, the email subject line) quick and superficially—using peripheral/heuristic processes—when the content lacks personal relevance to them (Taylor et al., 2020). However, when the message is personally relevant, individuals process the message more thoughtful and thoroughly (using central/systematic processes; Taylor et al., 2020). As such, we can expect that the content of subject lines matters when inviting respondents. This is particularly important today as the numbers of emails individuals receive on a daily basis might lead to a growing sense of overload, which can lead to the ignorance of certain incoming messages (Sappleton & Lourenço, 2016). After all, email management requires a myriad of tasks: once a message arrives in a users’ inbox, the users must attempt to evaluate the content and urgency of the message based on visible cues such as sender name and subject line, must decide whether and when to read, reply and/or file the email, or indeed, do nothing at all. (Sappleton & Lourenço, 2016, p. 613)
Unfortunately, however, few studies investigated the effect of subject lines on survey participation (Brenner et al., 2020; Manzo & Burke, 2012; Sappleton & Lourenço, 2016), and many of the existing studies are already more than a decade old, and may not readily apply to the current situation. After all, with the emergence of Web 2.0 between 2000 and 2010, the Internet became much more important in students’ lives. Increased accessibility to Internet at home and on mobile devices also went together with an increased popularity in web surveys, leading to increased survey fatigue and increased feelings of email overload (Szóstek, 2011). For example, a much-cited study of Porter and Whitcomb (2005) with students at the beginning of the 2000s indicated that a blank subject line can significantly increase response rates. However, more recent research is contradicting this finding, indicating it can even lead to active refusal to participate in a survey (Brenner et al., 2020; Sappleton & Lourenço, 2016)—as individuals do not want to open emails with blank subject lines. More recent research also suggests that naming the survey topic in the subject line does not seem to have an effect (Keusch, 2013), but a subject line that includes the name of the sponsor can increase participation as respondents might have feelings of affinity with the sponsor or it can exhibit authority (Boulianne et al., 2010; Brenner et al., 2020; Guéguen et al., 2010; Kaplowitz et al., 2012; Keusch, 2015; Petrovčič et al., 2016)—in our case, the university. As such, we expect that indicating the university that organizes the survey (Tilburg University in this case) in the subject line can increase the validity of the email and thus web survey participation (Hypothesis 1). Furthermore, at many universities, there is a mixed student population, meaning that there are both national and international students. In such context, it can also be expected that the language of the subject line also matters—an issue about which we did not encounter any previous research. Logically, we can expect that when the subject line is written in Dutch, international students might not open the email, and conversely, if the subject line is only available in English, Dutch students might not open the message. As such, we expect that subject lines that provide information about the survey both in Dutch and English will lead to a higher likelihood of participation (Hypothesis 2).
Deadlines
To our surprise, there are only a handful of empirical studies available that focus on the influence of including deadlines in the survey invitations on web survey response, and they provide conflicting evidence. A study of Porter and Whitcomb (2003) indicated that providing a deadline limits the time frame for participation and, together with a scarcity message, indicating how valuable respondents’ answers are, this can lead to higher response rates. In contrast, a study of Göritz and Stieger (2009) indicated that response rates do not significantly differ when a deadline is set or not. We extent this body of literature by investigating (1) whether including a deadline makes a difference; and (2) whether different time frames, that is, different deadlines for different subsamples, influence web survey participation. Given the lack of previous experimental insights into this issue, and following Göritz and Stieger (2009), it is difficult to predict whether including a deadline will make a difference on web survey participation. On the one hand, participants might consider a deadline as a cue for the importance of a study. On the other hand, setting a deadline can limit the freedom of participants on when to participate, leading to an adverse reaction. As such, our analysis is exploratory, and we do not formulate any hypothesis a priori. With regard to the time frames, we expect that the longer individuals have to complete a questionnaire, the higher the likelihood of participating (Hypothesis 3), as respondents might schedule completion of the survey at an appropriate time for them and might feel less pressured. However, we also expect that when the time frame is set too broad, respondents might forget about the survey—or postpone participation—leading to lower participation (Hypothesis 4). In this article, we systematically varied time frames, which allows to investigate which time frames are useful for increasing student web survey participation.
Delay Between Invitation and Reminders
In the web survey literature, it is well established that the number of reminders can significantly enhance participation (see e.g., Deutskens et al., 2004; Göritz, 2014; Keusch, 2012; Manzo & Burke, 2012; Sauermann & Roach, 2013; Trouteaud, 2004; Van Mol, 2017), as reminders might signal legitimacy, trustworthiness, and importance as well as researchers’ persistence (Sauermann & Roach, 2013). Furthermore, more contact attempts may result in a higher likelihood of “catching the respondent in the right moment” (Sauermann & Roach, 2013). Reminders, however, cannot be send infinitely as sending too many reminders might annoy the respondents (Deutskens et al., 2004) and heighten survey fatigue among students for future surveys, which should be avoided (Van Mol, 2017). Generally, three reminders are often recommended (Sánchez-Fernández et al., 2012; Sauermann & Roach, 2013).
In this article, we aim to further understand the role of reminders in the web survey response process by focusing on the delay between the invitation and subsequent reminders, which is not yet fully understood (Manzo & Burke, 2012). Today, to our knowledge, only four studies addressed this aspect of the web survey process. Relying on a Dutch consumer sample, Deutskens et al. (2004) did not detect any differences between a delay of 1 week and 2 weeks. The study of Sauermann and Roach (2013), on their turn, did not find any significant differences in response rates when varying the delay between invitations between 7 and 21 days. Finally, the study of Blumenberg et al. (2019) indicated that a delay of 15 days versus a delay of 30 days yielded better response rates. They recommended to investigate shorter time spans as well. In our article, we do so as we randomly assigned participants to reminders that are delayed between 2 and 14 days. We do so as the fast pace whereby individuals interact with mobile devices nowadays might require to follow-up invitations much more quickly (Dillman et al., 2014). Furthermore, the specificity of a higher education student population should be taken into account. Crawford et al. (2001) indicated 2 decades ago that response rates among student samples are much higher among the groups that receive reminders after 2 days instead of 5 days. In line with this study, we expect that quicker reminders are more likely to lead to higher survey participation (Hypothesis 5). In addition, we explored whether it would make sense to vary the delays between different reminders: Some students who received a reminder after 2 days, for example, would receive a second reminder after 2–7, 10, or 14 days. As we are not aware of any literature exploring this, we also do not formulate a hypothesis in this regard.
Method
This experiment was conducted in the framework of a large online student survey administered to the full population of students at Tilburg University, the Netherlands, between May and July 2019. The survey was designed in the program Qualtrics, concerned the internationalization of higher education, and was available in Dutch and English. We envisaged a maximum of four contacts for each student: an invitation and three reminders. In order to examine the effect of different features of the contact attempts, we randomly assigned the total student population to different experimental conditions that differed significantly with regard to the content of the subject line, inclusion of a deadline, and the timing of deadlines and reminders.
The total sample of students was split into 128 experimental groups. Students were randomly assigned to the groups, which were based on combinations of (a) eight different delays between the invitation and first reminder, (b) eight different delays between the first and second reminder (the same delay was also applied between the second and the third reminder and between the third reminder and the deadline for completion), and (c) communication or not of the deadline by which the survey had to be completed. This 8 × 8 × 2 design is shown in Figure 1.
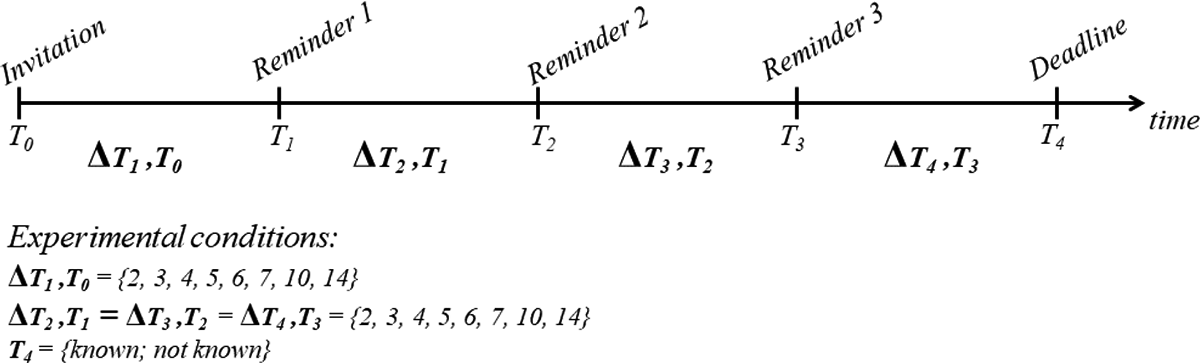
Visual representation of experiments on contact delays and communication of deadline.
Two groups had to be dropped because by mistake they were assigned to the same students; four other groups had to be dropped because of technical problems with the automatization of the web survey invitation process (the first reminder was sent before the invitation; and the second and third reminder were never sent). In total, 14,493 students nested in 122 groups remain in the analyses reported in this article (see Table 1).
Allocation of the 14,493 Students Into 122 Experimental Groups.
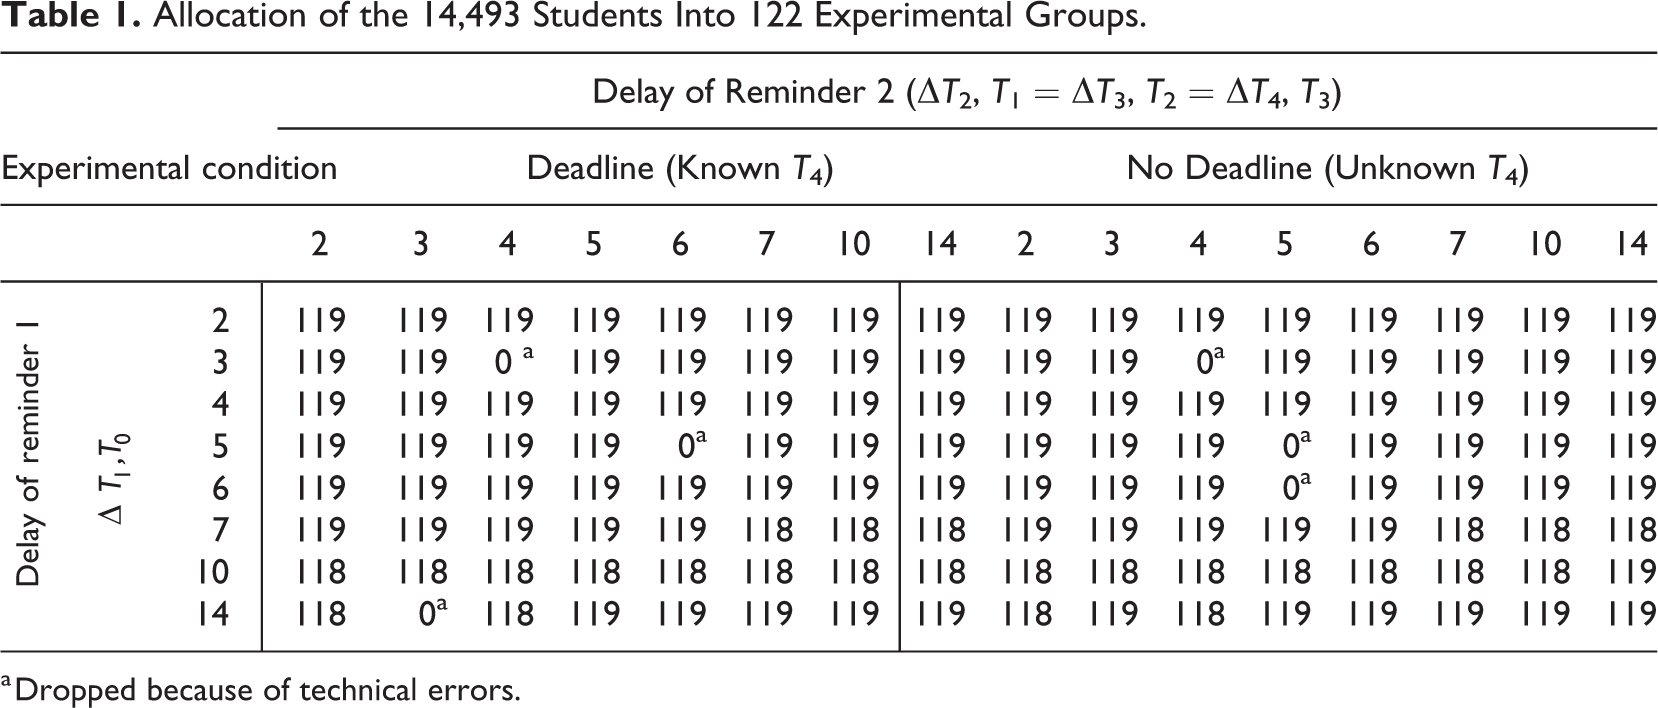
a Dropped because of technical errors.
Finally, there were four different wordings of the email subject of the invitation, namely internationalization of higher education, only in Dutch; internationalization of higher education, in Dutch and English; internationalization at Tilburg University, only in Dutch; and internationalization at Tilburg University, in Dutch and English.
Sixty four of the 128 groups were randomly assigned to one of these conditions; the remaining 64 groups were all assigned to Condition 1—which is the standard way of inviting students to web surveys at Tilburg University—which acts as a control group. Furthermore, Dutch was included in all four subject lines as the majority population was Dutch, and we did not want to lose too many respondents for the larger research project because of the experiment.
Additionally, the day of the week and hour (12 a.m., 6 a.m., 12 p.m., or 6 p.m.) at sending the survey invitation and subsequent reminders were randomized in order to minimize possible bias related to timing, about which conflicting evidence exists (e.g., Faught et al., 2004; Göritz, 2014; Keusch, 2015; Sauermann & Roach, 2013).
Variables
The main dependent variable is survey participation, which is derived by flagging those respondents who accessed the survey and consented to the privacy statement. Survey participants did not necessarily complete the survey, although the large majority of these students (1,243 of 1,249 or 99.5%) at least started it by answering the first question. Depending on the analysis, the variable is at a level of the individual (whether the respondent has participated in the survey), at the level of the contact attempt (whether the specific survey invitation or reminder resulted in a successful contact), or at the level of the experimental group (as the percentage of students who participated in the survey out of the total number of students in that group). The day at participation in the survey, counting as 0 the day in which the first invitation was sent, is used for additional analyses.
The experimental characteristics are described by several variables such as the subject line for which both the language (Dutch only or Dutch and English) and the content (internationalization of higher education or internationalization at Tilburg University) are varied. The content of the message varied with, or without, the communication of the deadline. The days until the deadline, or deadline latency, vary between 8 and 56 and depend on the experimental condition (see Figure 1). 1 The days passed between each contact attempt, or delays, vary between 2 and 14; only in the contact by respondent data set, used for the discrete-time hazard models, the delay ranges from 0 (for the invitation) to 14 days.
Additionally, the weekday (Monday to Sunday) and the hour (12 a.m., 6 a.m., 12 p.m., or 6 p.m.) at the sending of the invitation (or of the contact attempt) are used as control variables in some of the analyses. The descriptive statistics are presented in Table 2.
Descriptive Statistics.
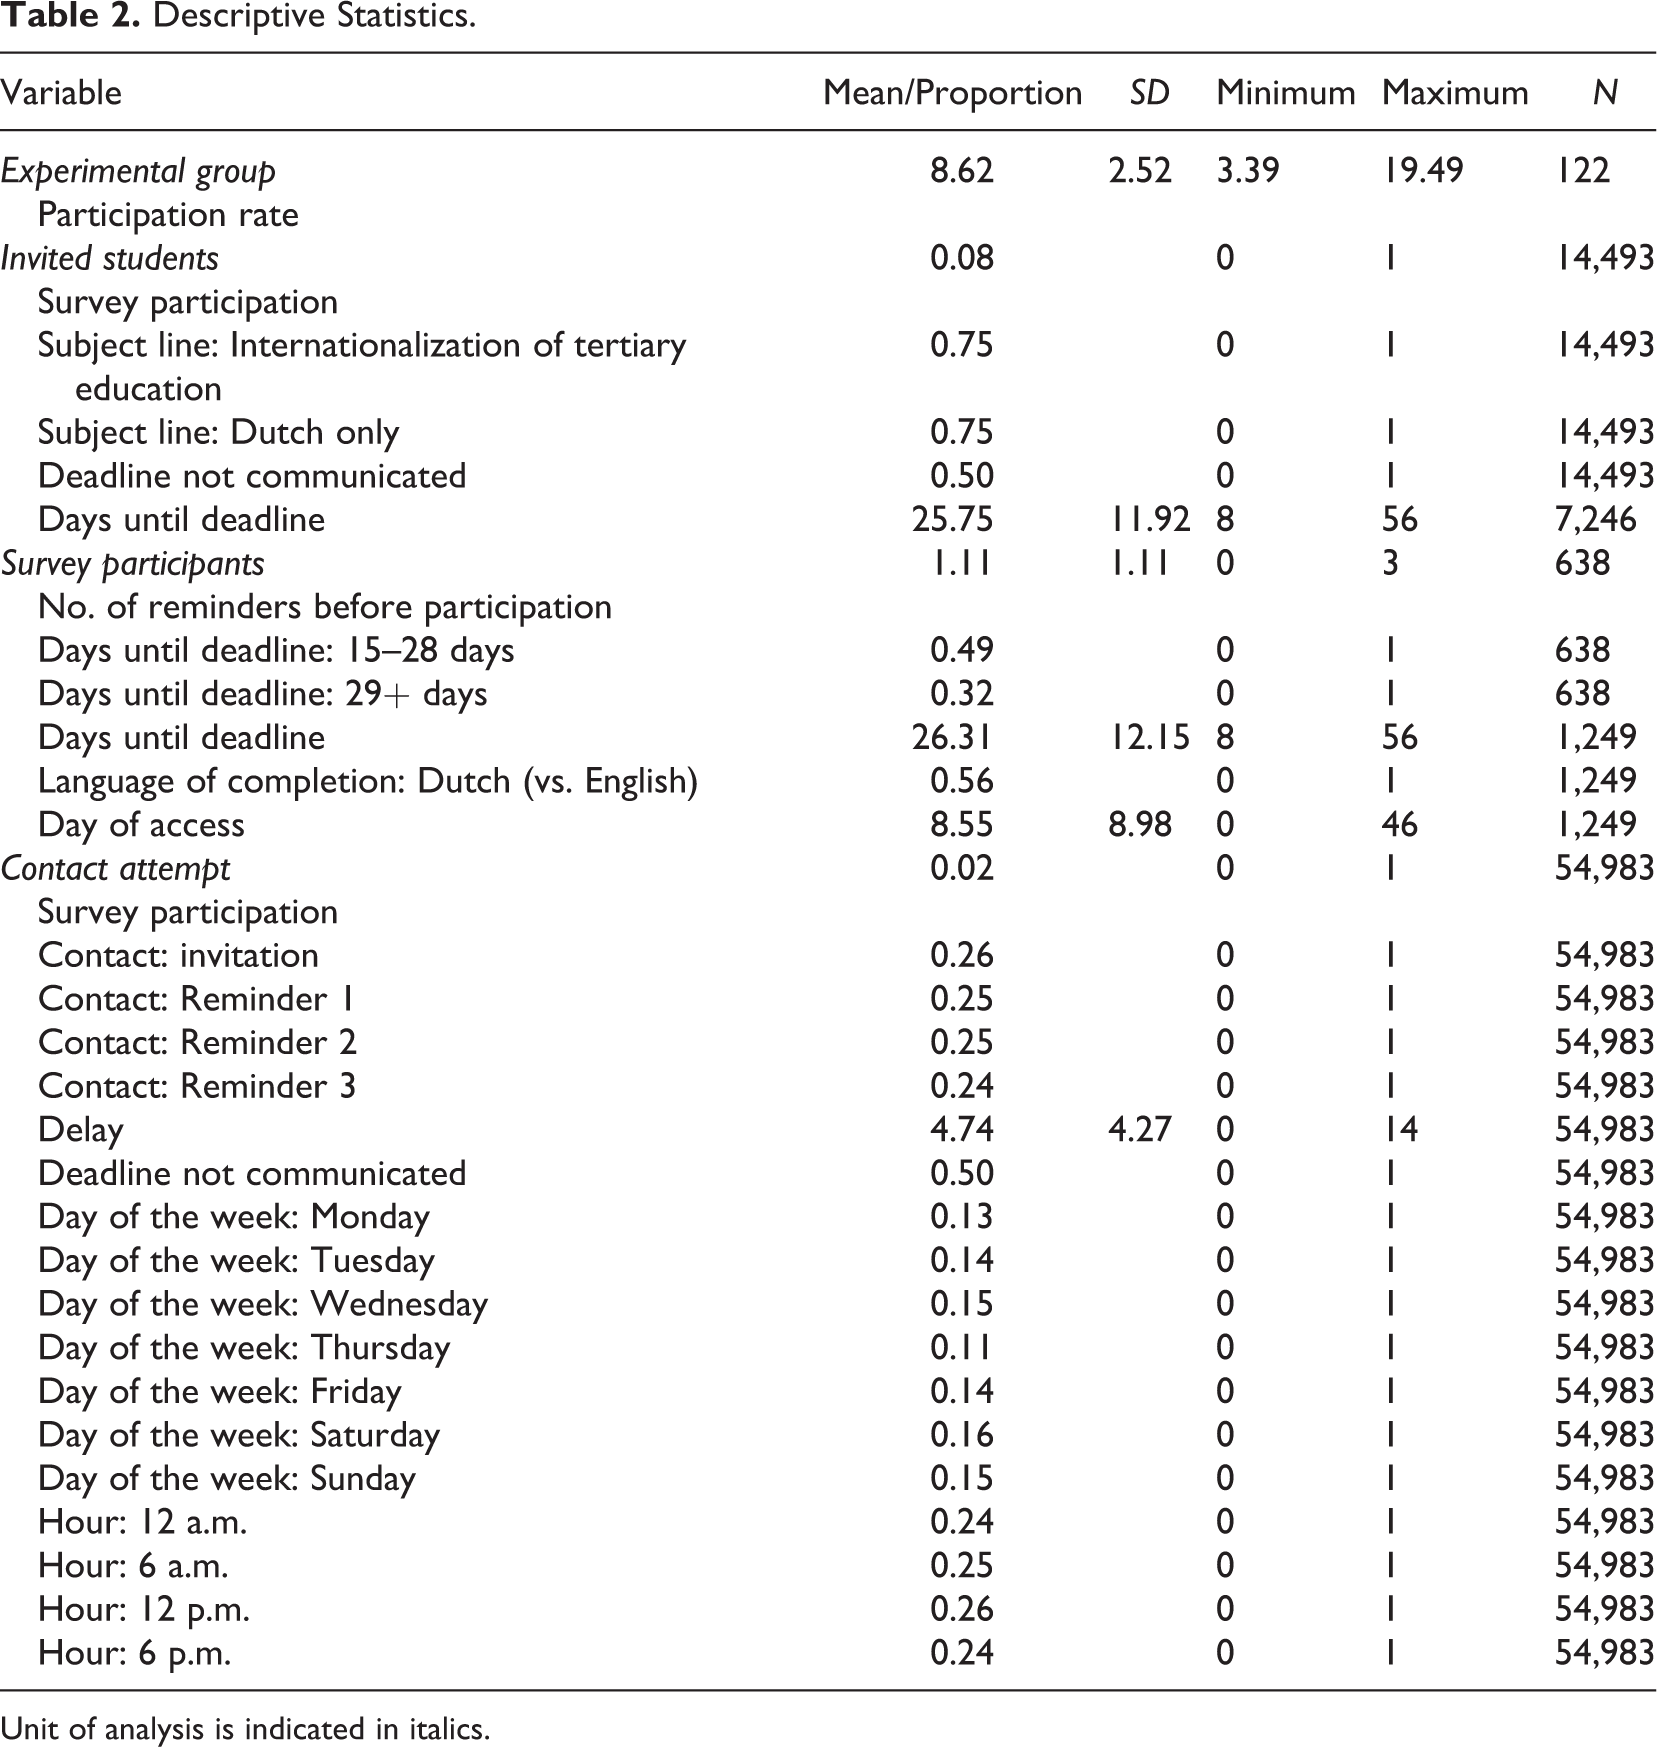
Unit of analysis is indicated in italics.
Analytic Strategy
Several analytical techniques are used depending on the hypothesis under investigation. The impact of the subject line is studied by means of χ2 tests, where a significant χ2 test indicates a significant difference across the groups under comparison. The effect of the timing of the deadline on the participation rate, and on the timing of participation, is investigated by means of logistic and linear regression models. Finally, the impact of the delays between reminders on the participation rate is investigated with a discrete-time hazard models: A logistic regression model is fitted using a data set recording the contact attempts for each respondent (which means up to four observations for each respondent). Cases are censored on the right, as not all of them transition to survey participation. Due to the limited number of time points (four), no particular time hazard function is devised. Data preparation and analyses have been performed on R (R Core Team, 2013), and the list of packages used is included below.
Results
Descriptive Statistics
Of the 14,493 students contacted, 1,249 accessed the survey (8.6%). Two of five students who accessed the survey chose to do so in English (43.8%), whereas the remaining students completed the survey in Dutch.
However, there is moderate variation in web survey participation across the experimental groups: Figure 2 displays the percentage of respondents who accessed the survey in each experimental group. As can be observed, the participation rate varies between 3.4% and 19.5% with an average of 8.6% (and a standard deviation of 2.52).
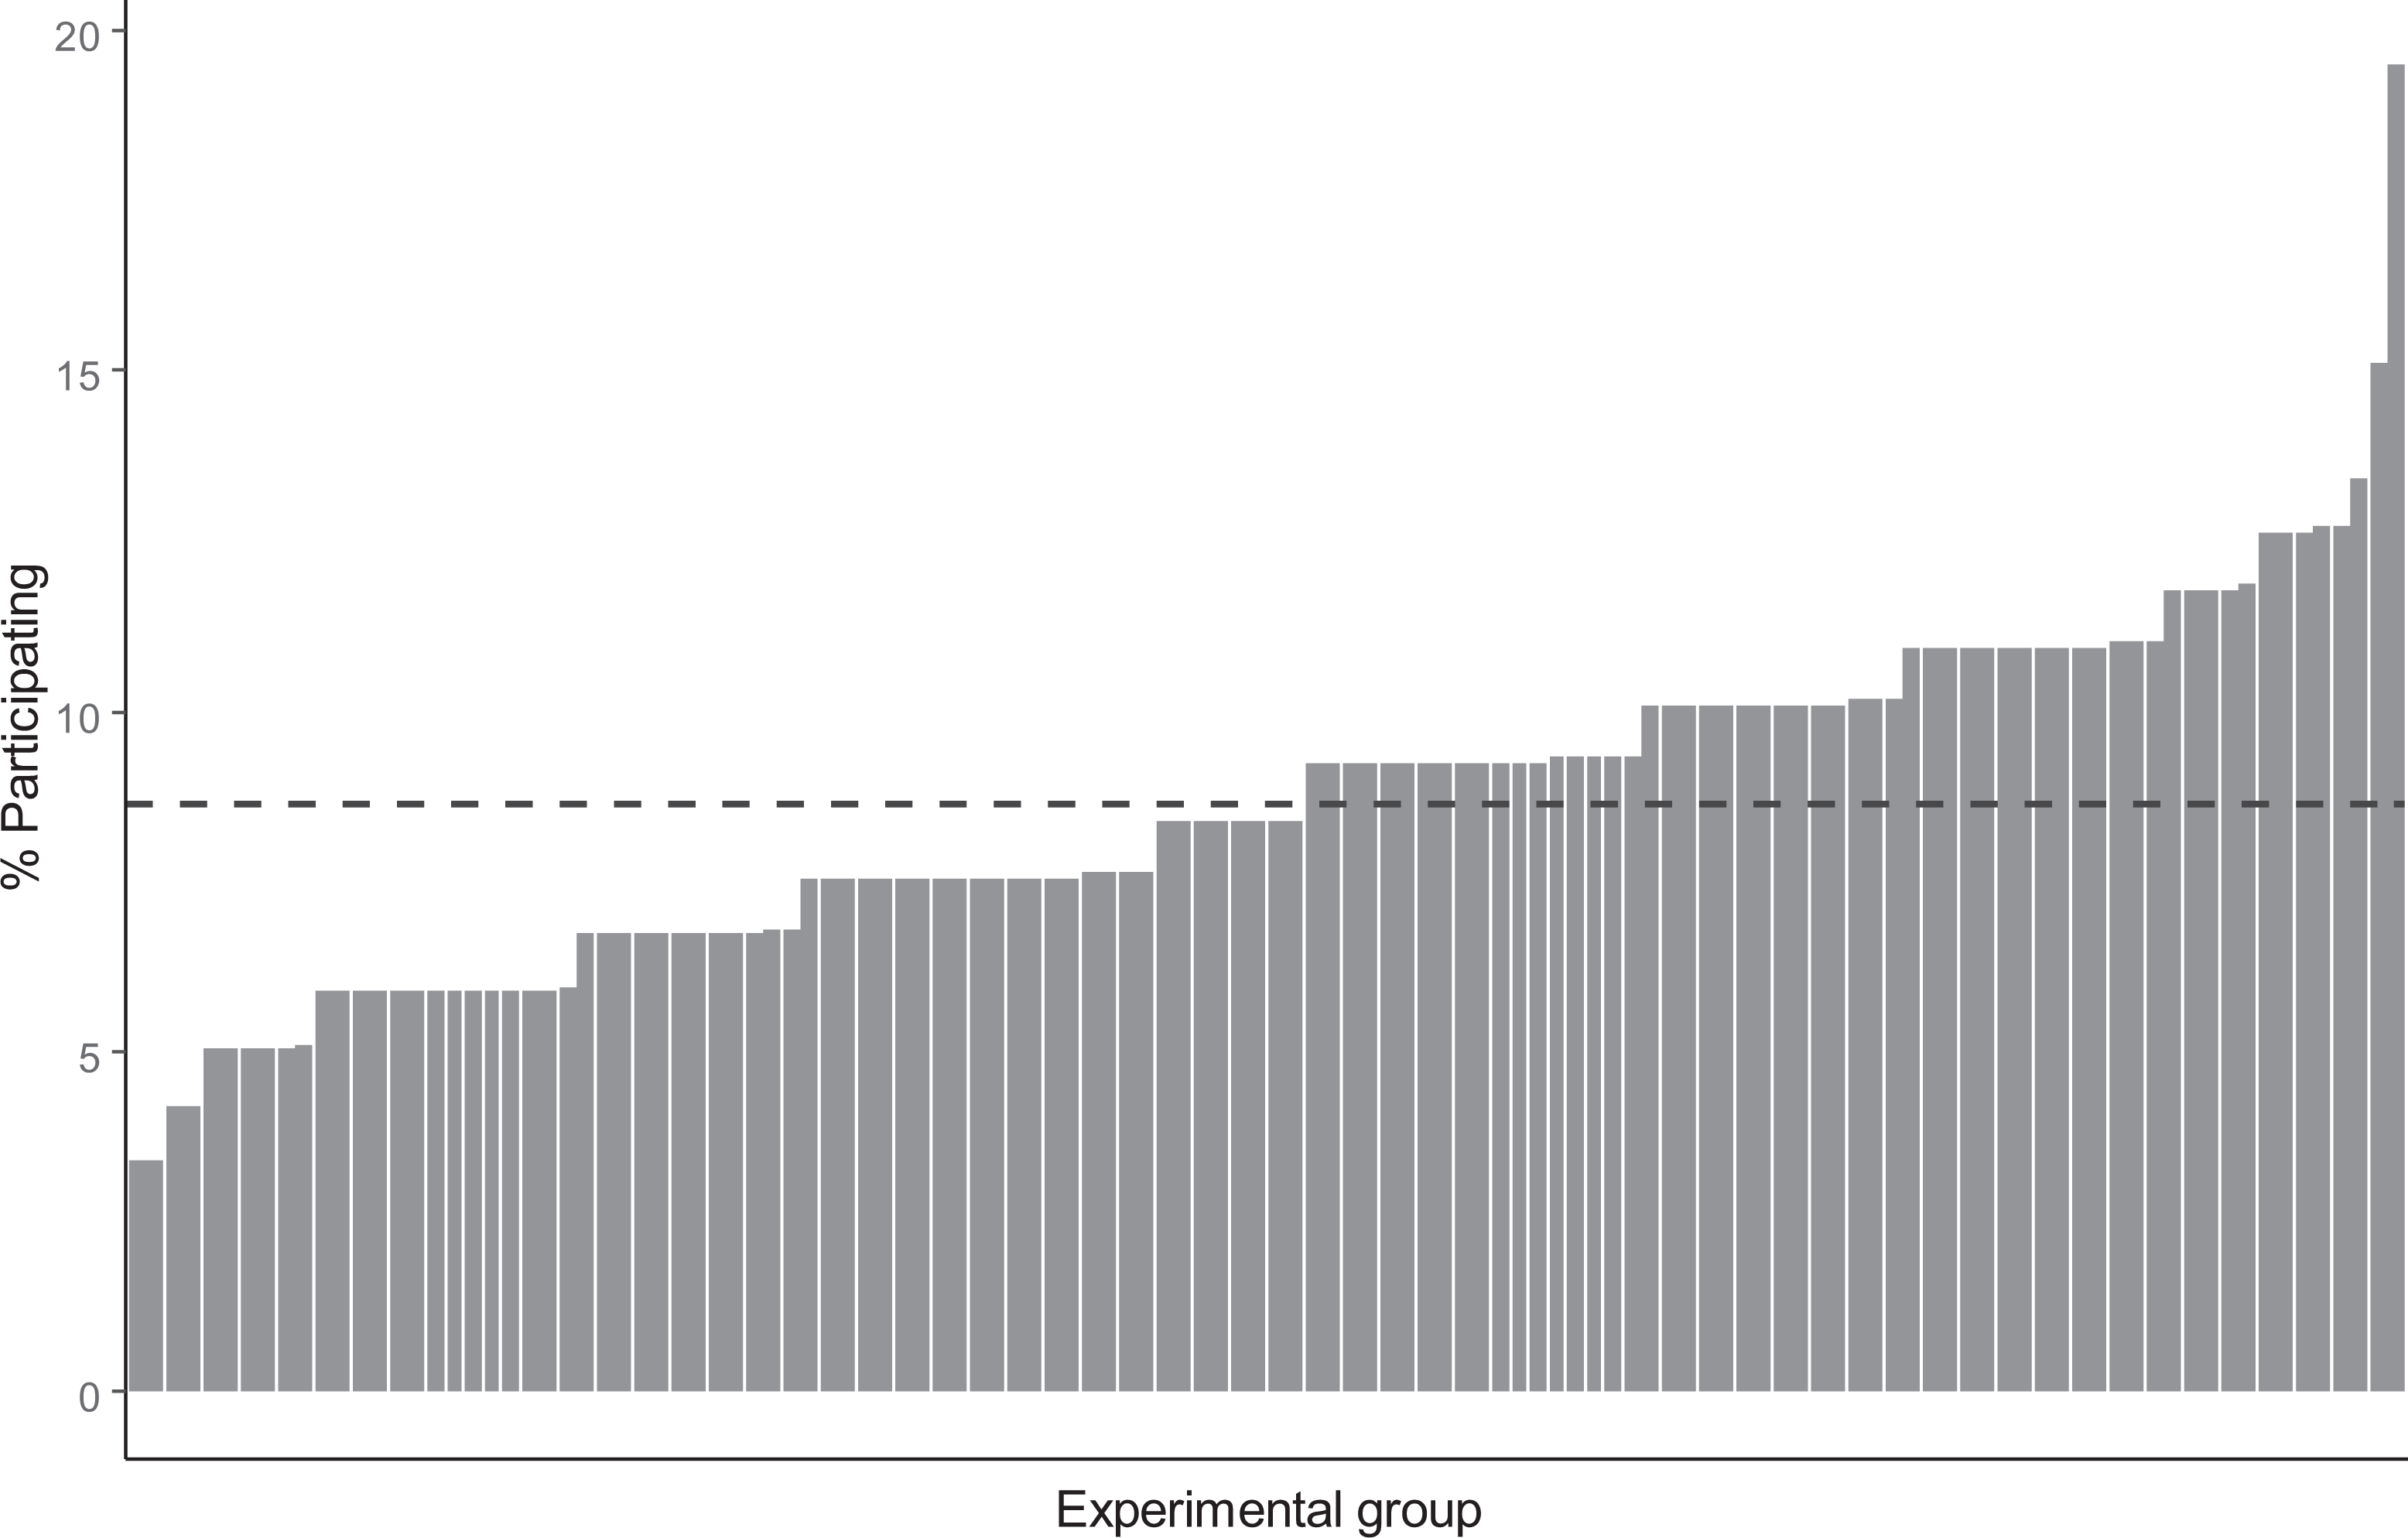
Participation rate by experimental group (N = 14,493 students, nested in 122 groups). Note. The dashed line indicates the average participation rate. Source: Internationalisation at Tilburg University project, own calculations.
Each respondent was contacted up to four times (one invitation, plus three reminders). As displayed in Figure 3A, many students accessed the survey within 2 days from the invitation. In general, of those who participated in the survey, one student out of two did so within 6 days from the invitation; the latest access is observed 46 days after the invitation. Each reminder contributed to the participation rate (see Figure 3B): Among the 14,493 students contacted, 501 students (3.5%) accessed the survey after the first invitation, 310 (2.1%) after the first reminder, 222 (1.5%) after the second reminder, and 216 (1.5%) after the third reminder.
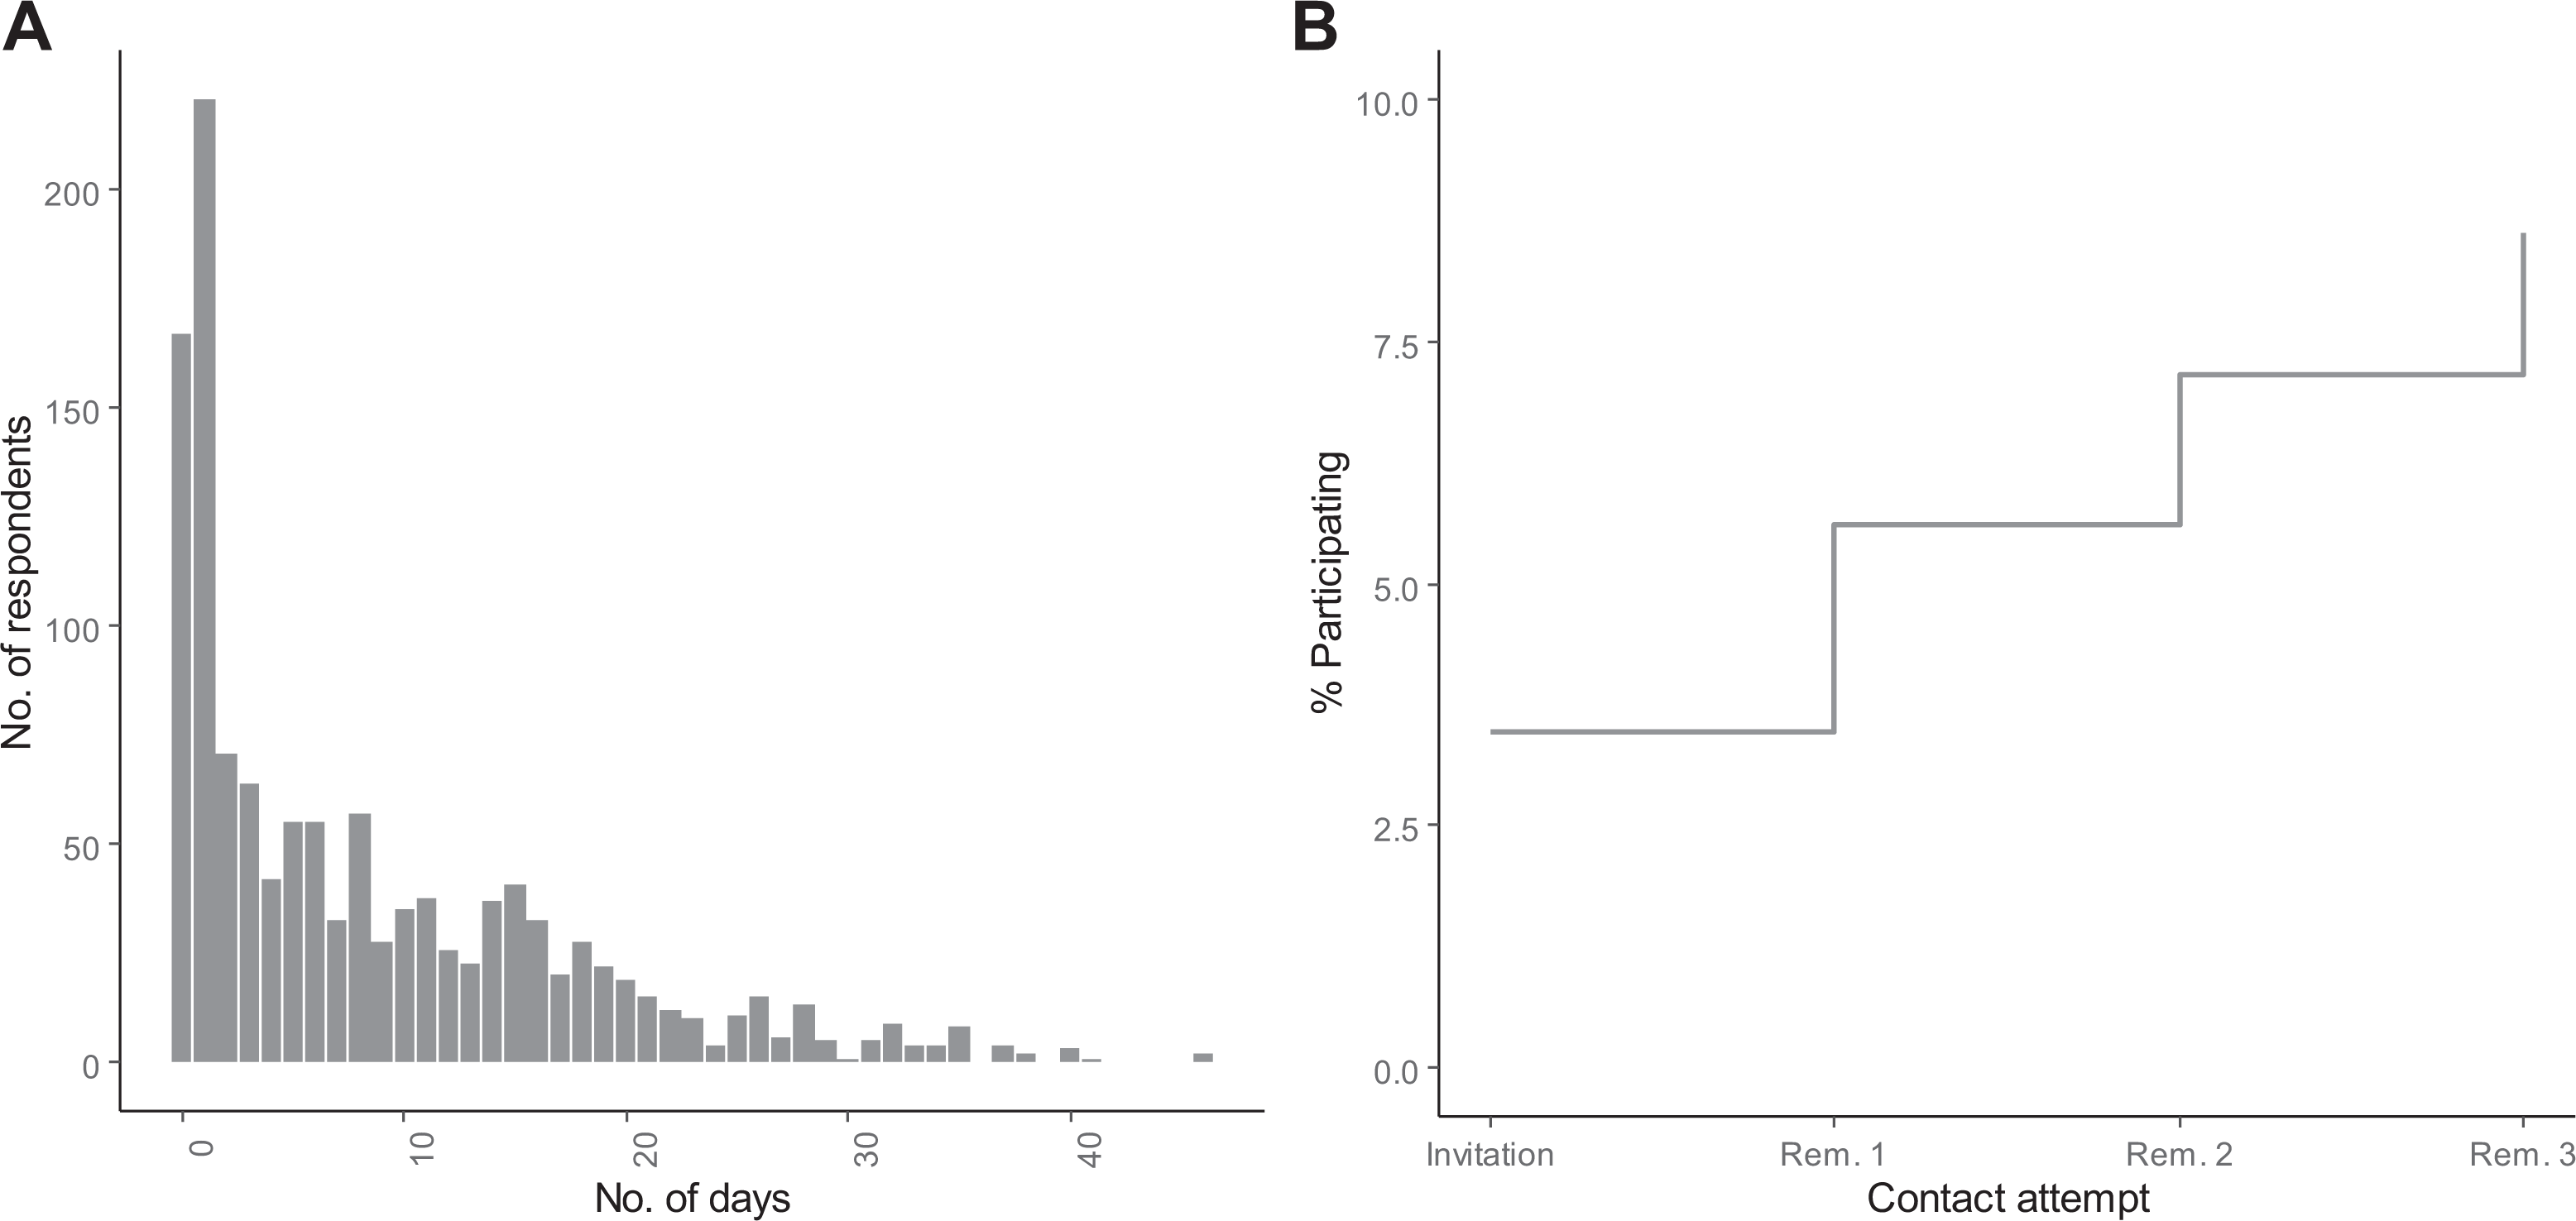
(A) Distribution of delay between the first invitation and access to the survey. (B) Access rate by contact attempt (N = 14,493 students). Note. Day 0 represents the day of the invitation. Source: Internationalisation at Tilburg University project, own calculations.
Figure 4 represents the progress of the fieldwork day by day. Due to the experimental conditions, the dispatch of the survey invitation was scattered between Monday, May 13 and Sunday, May 19. A steep increase is noticed in the initial days, followed by a progressive flattening of the participation curve. Additional descriptive trends are reported in Appendix Figure A1.
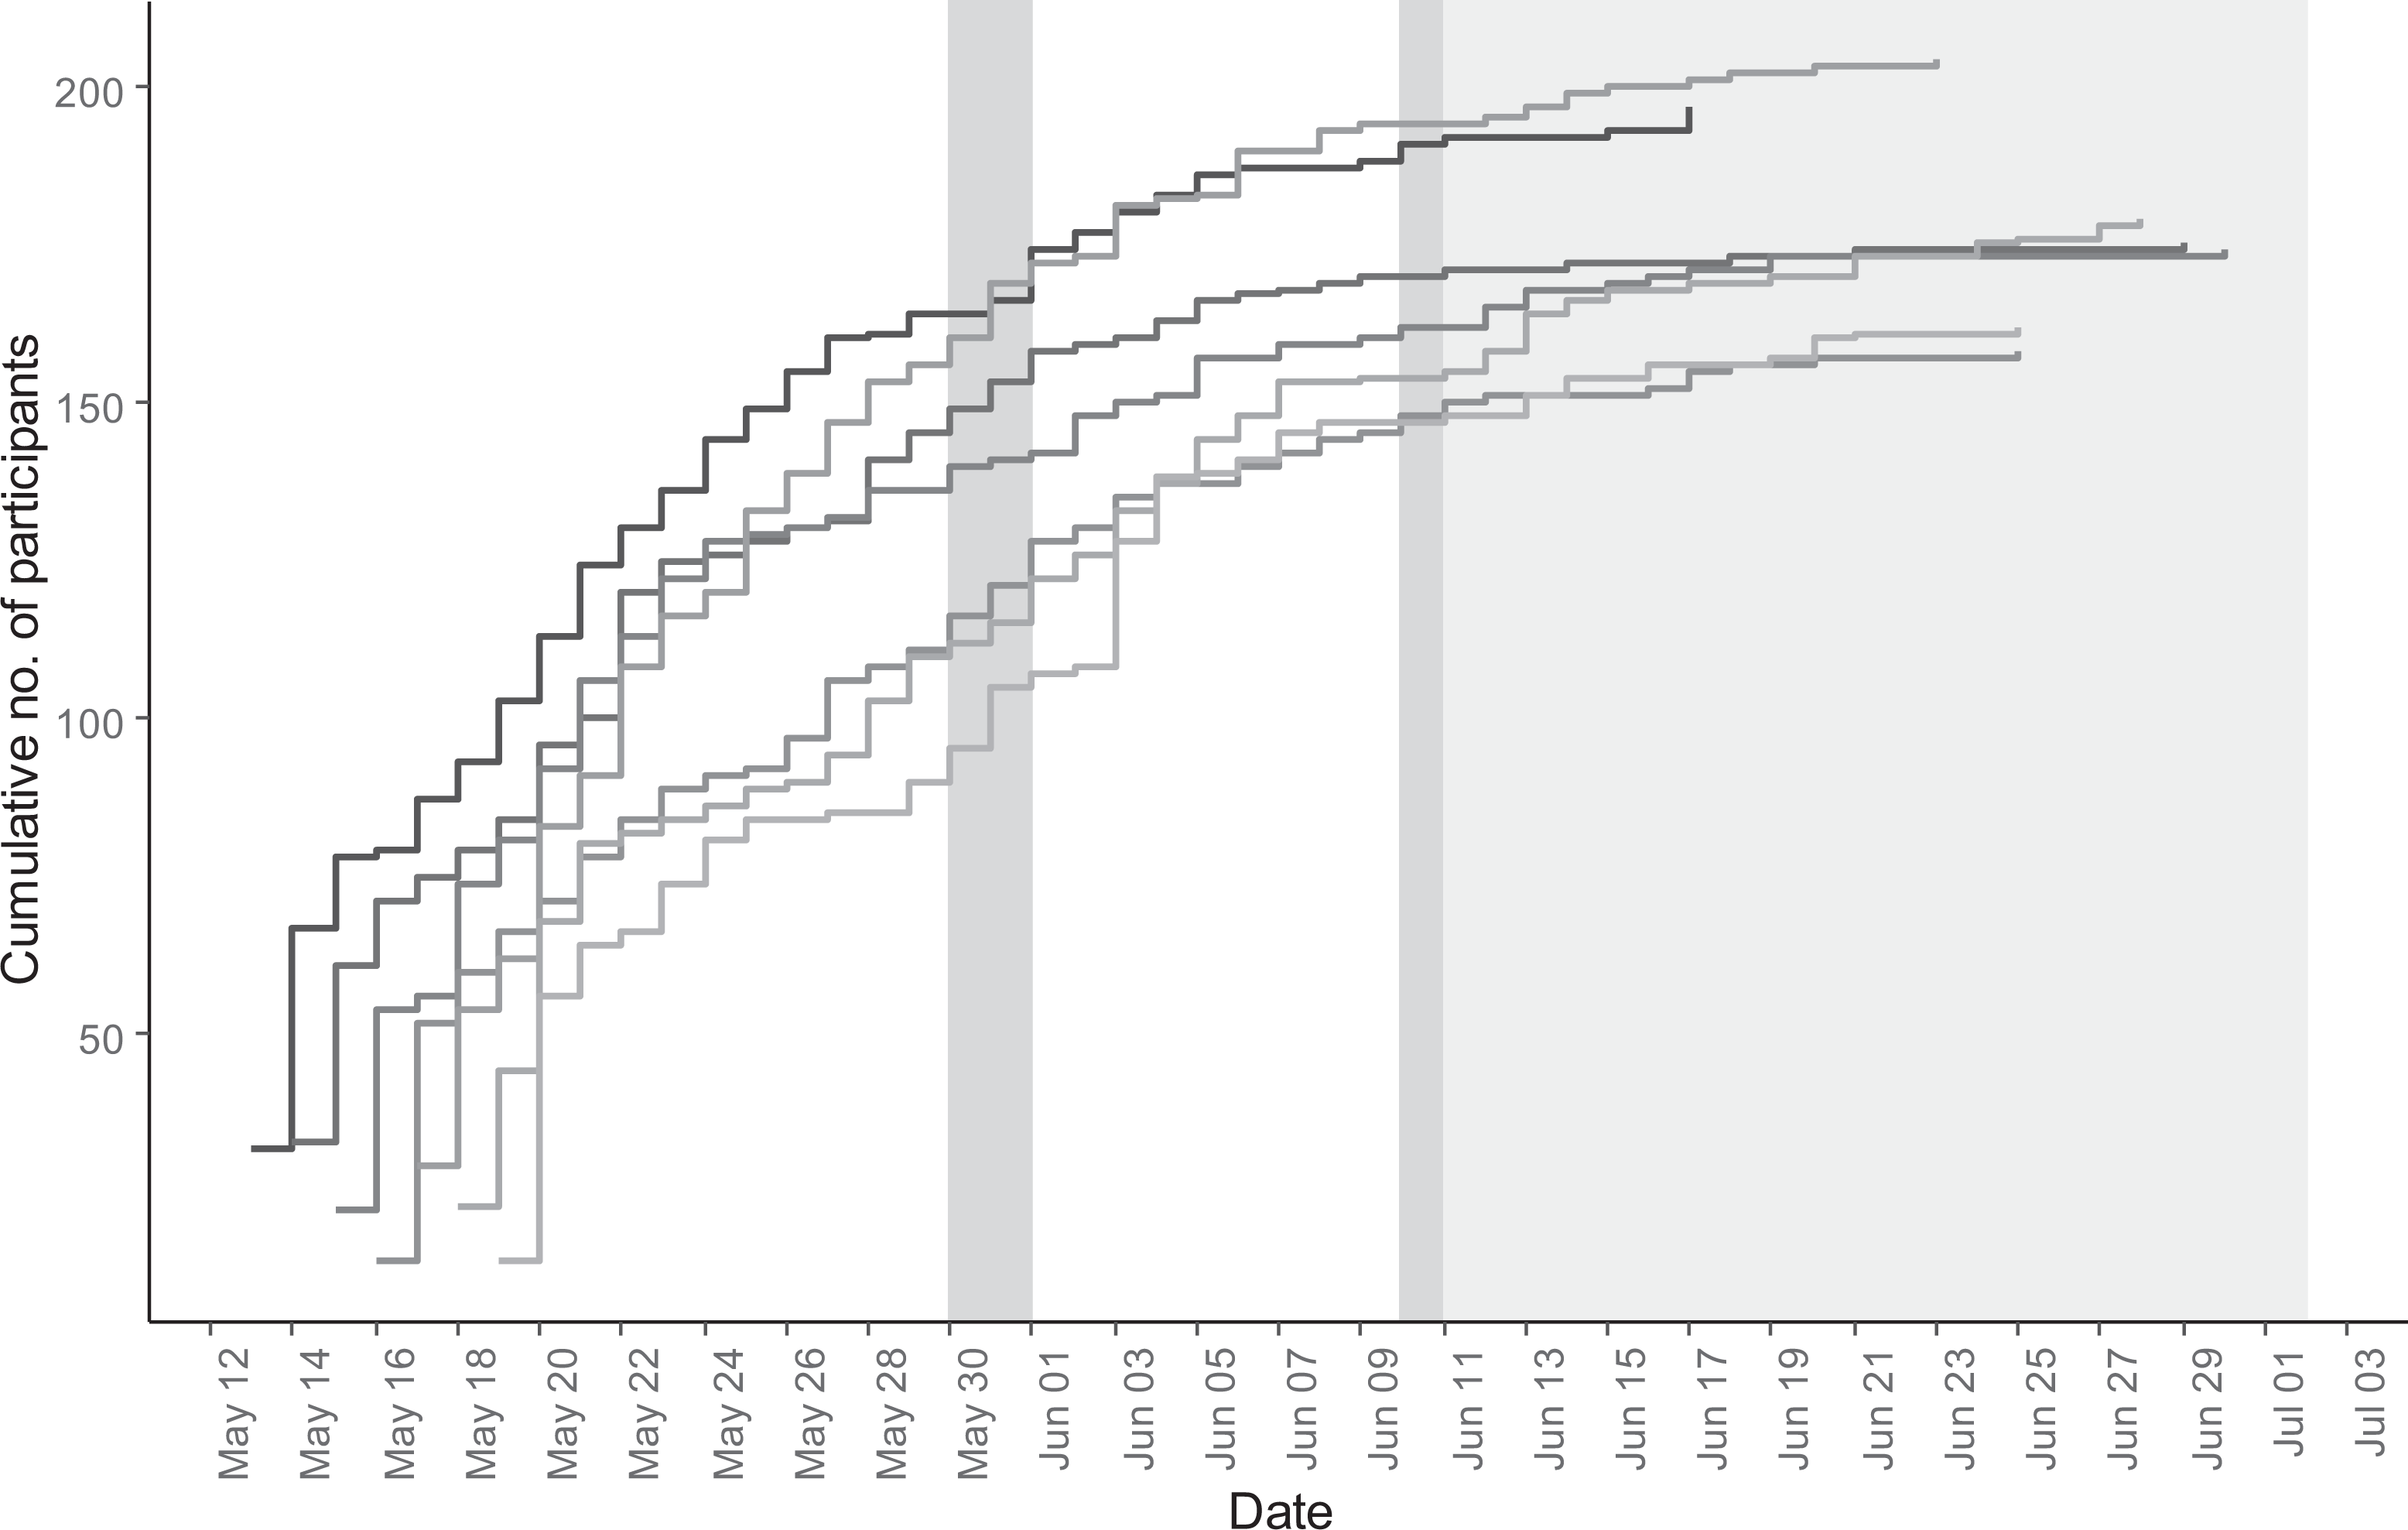
Cumulative number of participants by day; lines are scattered according to the day of the first invitation. Note. Shaded areas indicate days in which Tilburg university was closed (May 30–31, June 10) and the examination period (from June 11 onward; N = 14,493 students, nested in 122 groups). Source: Internationalisation at Tilburg University project, own calculations.
Subject Line
A χ2 test of independence was performed to test whether the characteristics of the subject line had an impact on the likelihood of the respondent to participate in the survey (see Table 3).
Distribution of Contact Outcome by Characteristics of the Subject Line and Content of the Invitation.
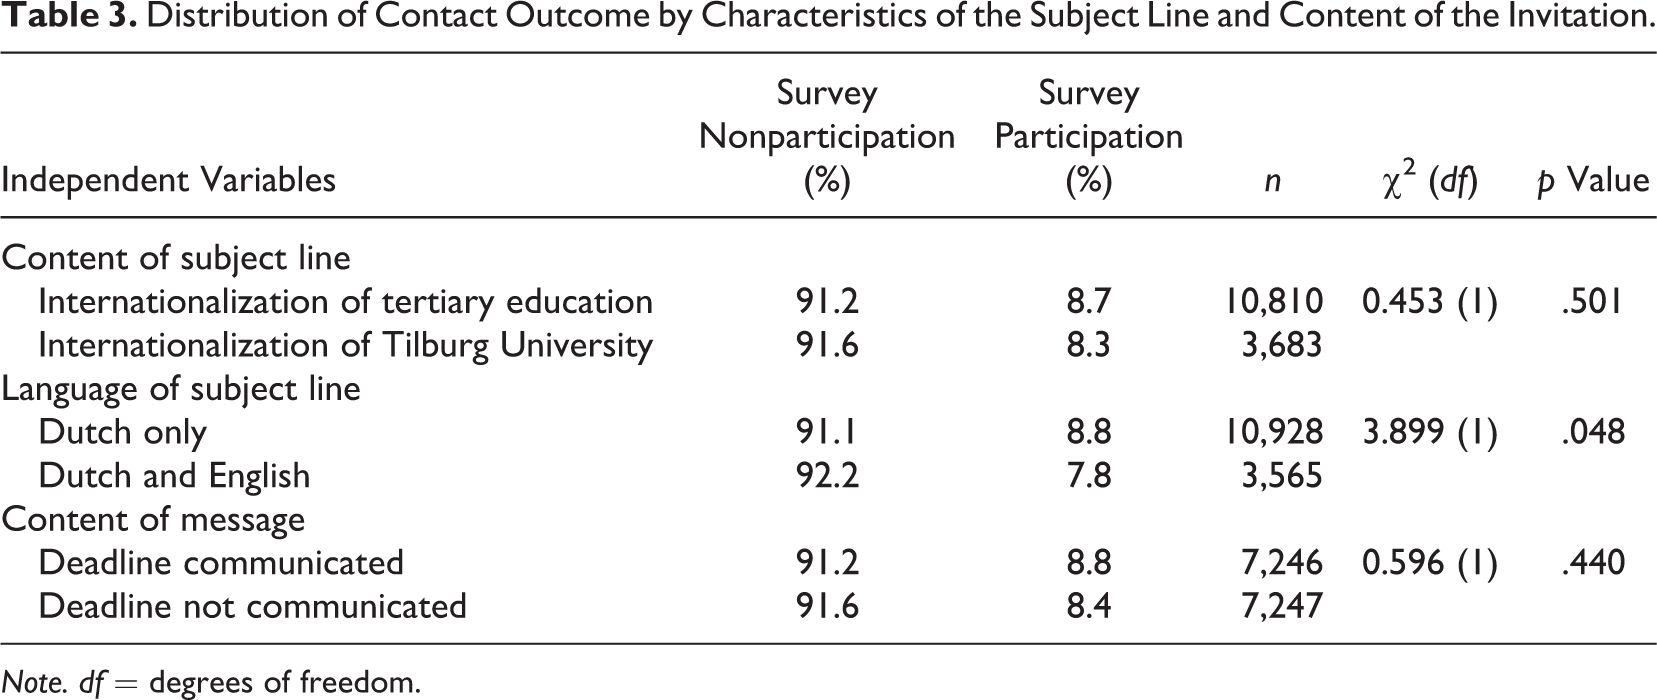
Note. df = degrees of freedom.
Considering the subject line content, our results indicate that the likelihood of participating in the survey did not significantly differ (χ2 = .453, p > .05) when the institution sponsoring the survey was mentioned or not. As such, Hypothesis 1, which expected mentioning the name of the institution in the subject line would increase web survey participation, is rejected.
Considering the language of the subject line, the Dutch-only version yielded significantly higher participation rates compared to the double-language version (χ2 = 3.899, p < .05). This result is rejecting Hypothesis 2, which stated that the double language (Dutch and English) would increase web survey participation. Additionally, Figure 5 shows that the double-language subject line did not attract more English survey completion, thus, arguably, failing to make the survey more appealing for International students, compared to the Dutch-only subject line.
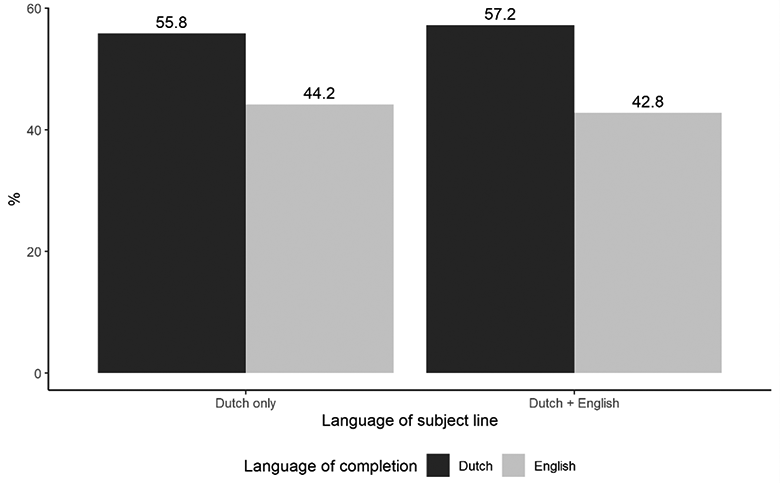
Language of completion in percentage of students by the language of the invitation header.
Furthermore, the results of a logistic regression of survey participation on the characteristics of the subject line, reported in Table 4, suggest that the subject line in two languages mentioning the general subject of the survey performed significantly worse than the other versions in terms of participation rate (b = .22, p < .05).
Logistic Regression Models of Access to the Survey by Subject Line.
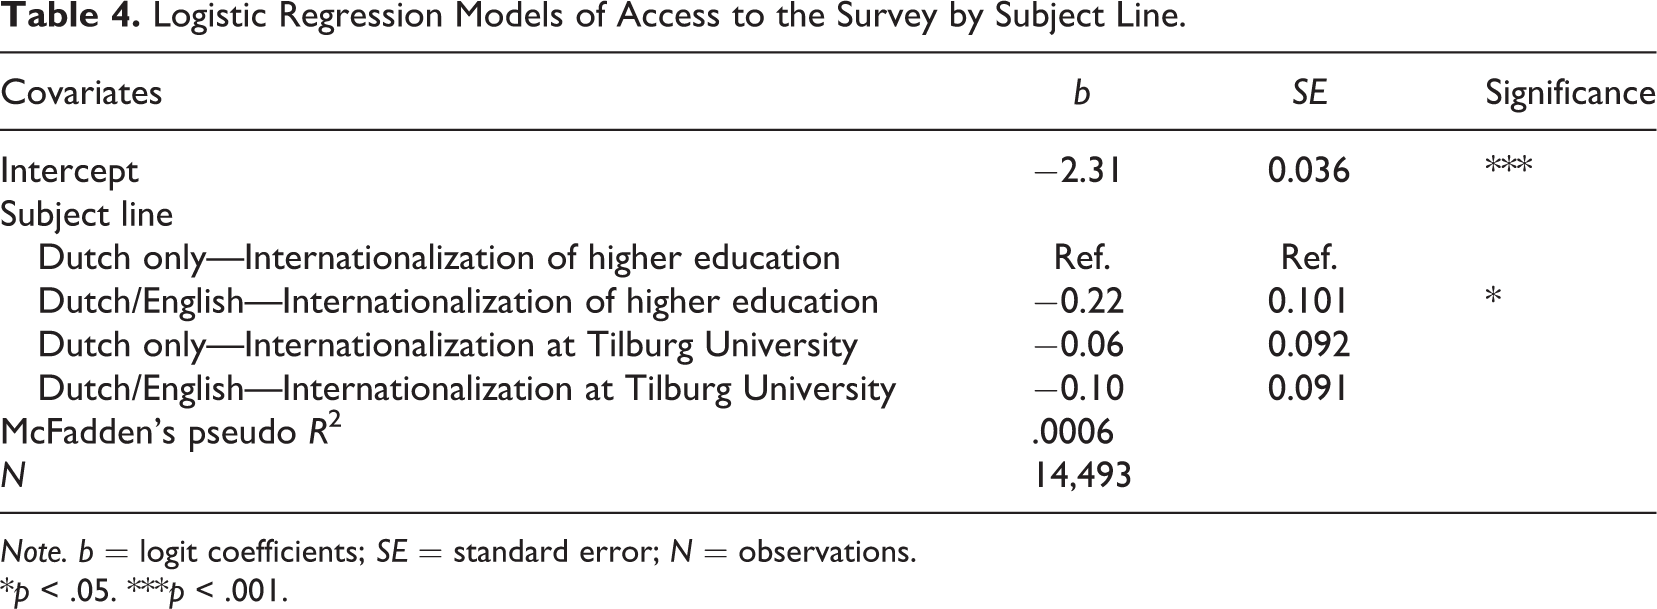
Note. b = logit coefficients; SE = standard error; N = observations.
*p < .05. ***p < .001.
Deadline
Similar to the content of the subject line, which was not significantly correlated with the likelihood of accessing the survey, the percentage of students participating in the survey when the deadline is communicated, or not, does not significantly differ (χ2 = .596, p > .05; see Table 3).
As concerns the time frame until the deadline for completing the survey, however, Hypotheses 3 and 4 lead to expect a curvilinear effect, as a longer time frame was deemed to be beneficial but only up to a certain point. This trend should be only observed for the respondents who received communication concerning the deadline, as for the others, the time frame was not known. Based on the experimental design represented in Figure 1, we computed the number of days until the deadline, ranging between 8 and 56 days. First, we looked at the impact of the days until the deadline on the likelihood to participate in the survey, for those who knew about the deadline (n = 7,246). The result of a logistic regression analysis, controlling also for the day of the week and hour at which the invitation was sent and the subject line, showed a very small yet positive and significant effect (logit = .008, SE = .003, p < .05), meaning that a longer time frame was slightly beneficial for participation (see Figure 6A). When adding a quadratic term to investigate the curvilinear relationship, however, neither coefficients resulted significant (see Figure 6B).
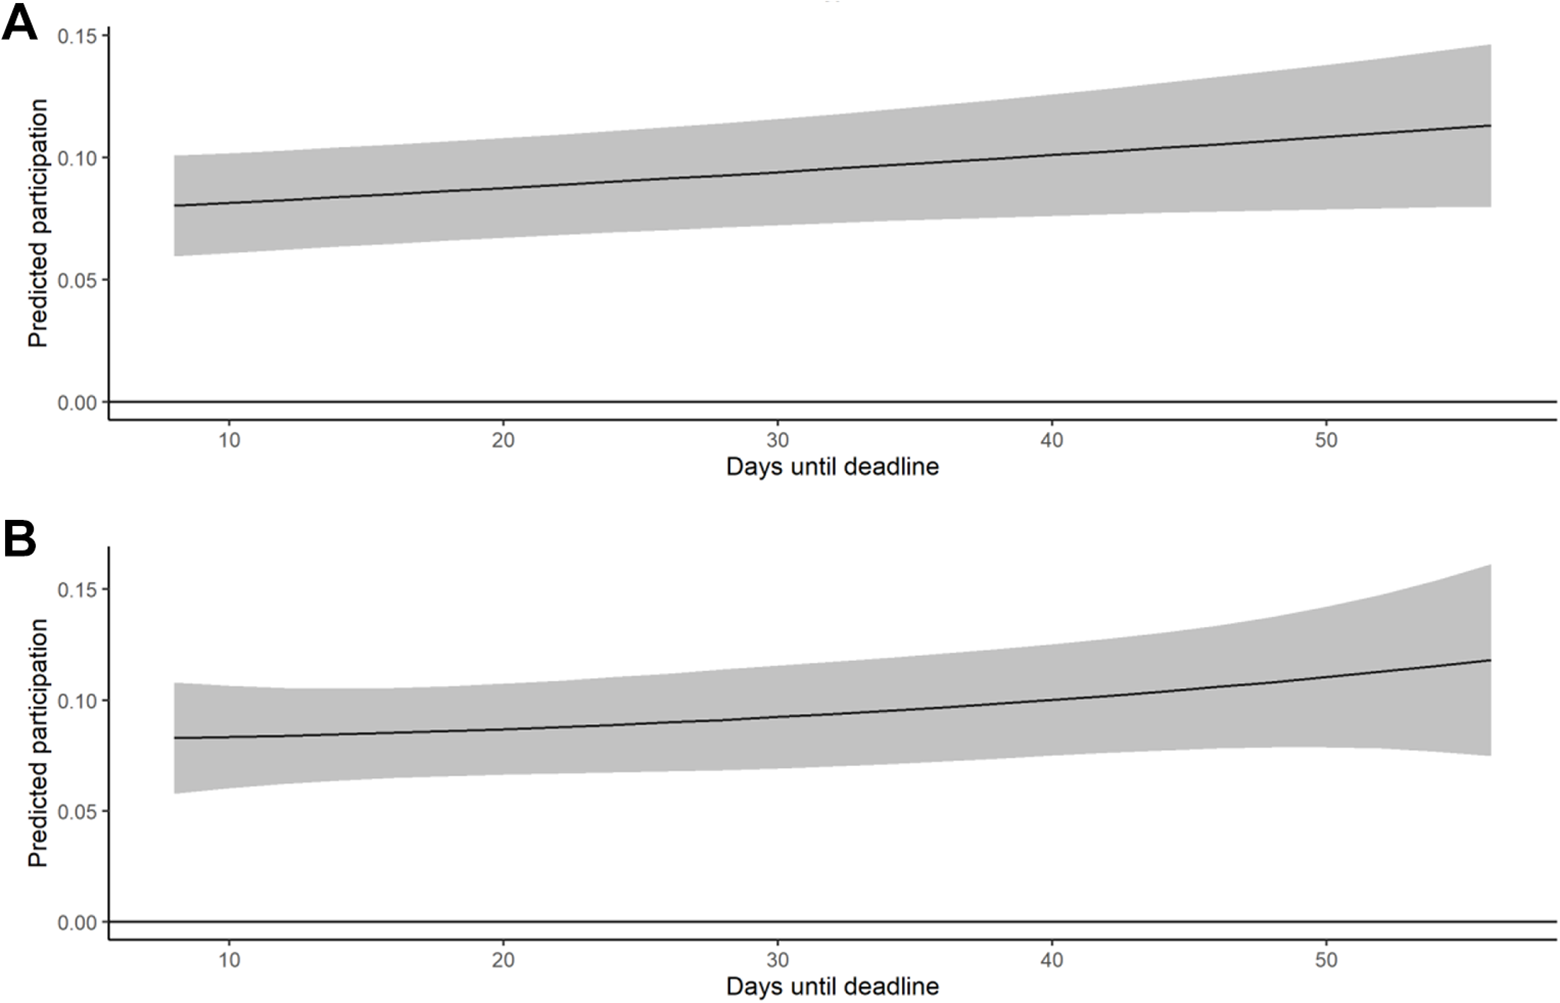
Average marginal effects of the latency of the deadline on participation with 95% confidence intervals. (A) Plot shows the effect of the variable. (B) Plot contains also a quadratic term. Note. Estimates are computed with logistic regression models (n = 7,246).
We additionally estimated whether the length of the time frame until the deadline had an impact on the number of reminders before participation for those who participated and were aware of the deadline (n = 638; and controlling for day of the week and hour at the first invitation and subject line). If a close deadline creates a sense of urgency, we should find that a shorter deadline is associated with participation after the invitation or first reminder; on the contrary, a longer deadline latency should be associated with a higher likelihood of receiving two or three reminders before participating. This appeared not to be the case, since the results, reported in Figure 7, showed that there is no significant impact of the deadline latency (here categorized in order to explore potential curvilinear effects) on the number of reminders received before participation.
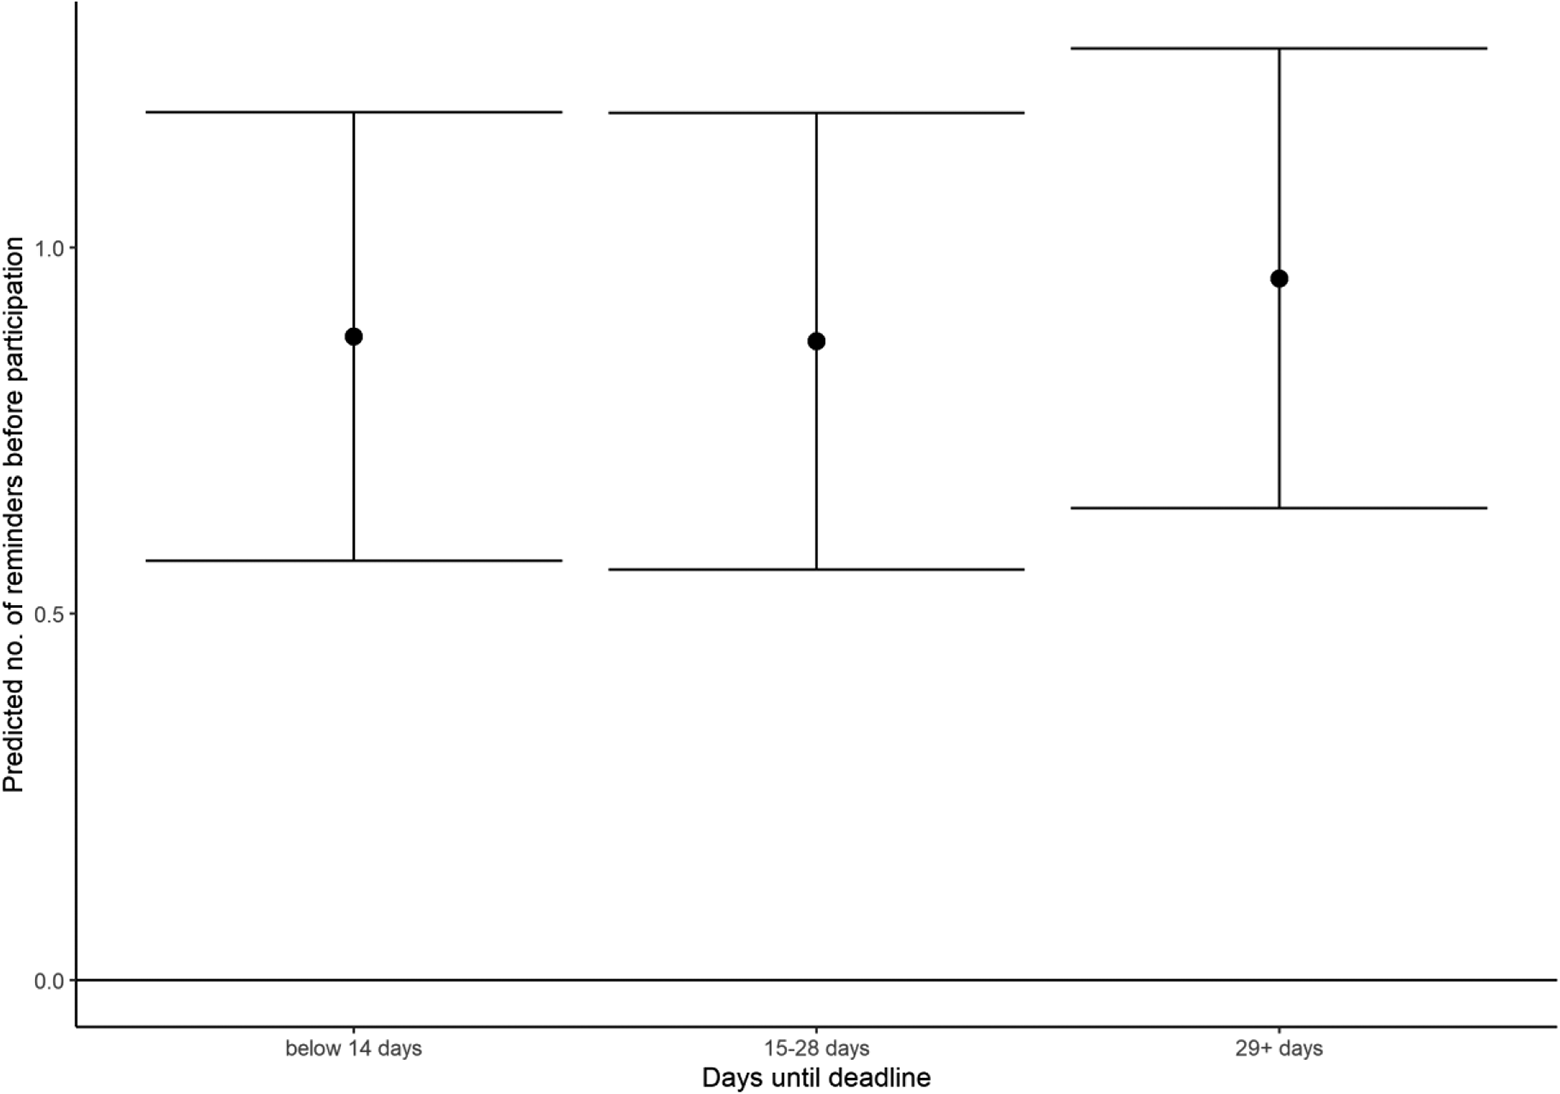
Predicted number of reminders received before participating in the survey by latency of the deadline on participation with 95% confidence intervals. Note. Estimates are computed with a linear regression models (n = 638).
Delay Between Invitation and Reminders
Turning to the impact of the delay between contact attempts on access rates, the descriptive trends represented in Figure 8 suggest different patterns according to the content of the invitation (namely communication of the deadline or not). In particular, longer delays seem to be slightly beneficial for participation, yet only when the deadline is known. When the deadline is not communicated, the trend is not linear, and it appears to be influenced by an outlier (group ND-10-3-3) with a high participation rate (∼19%), relatively to the other groups.
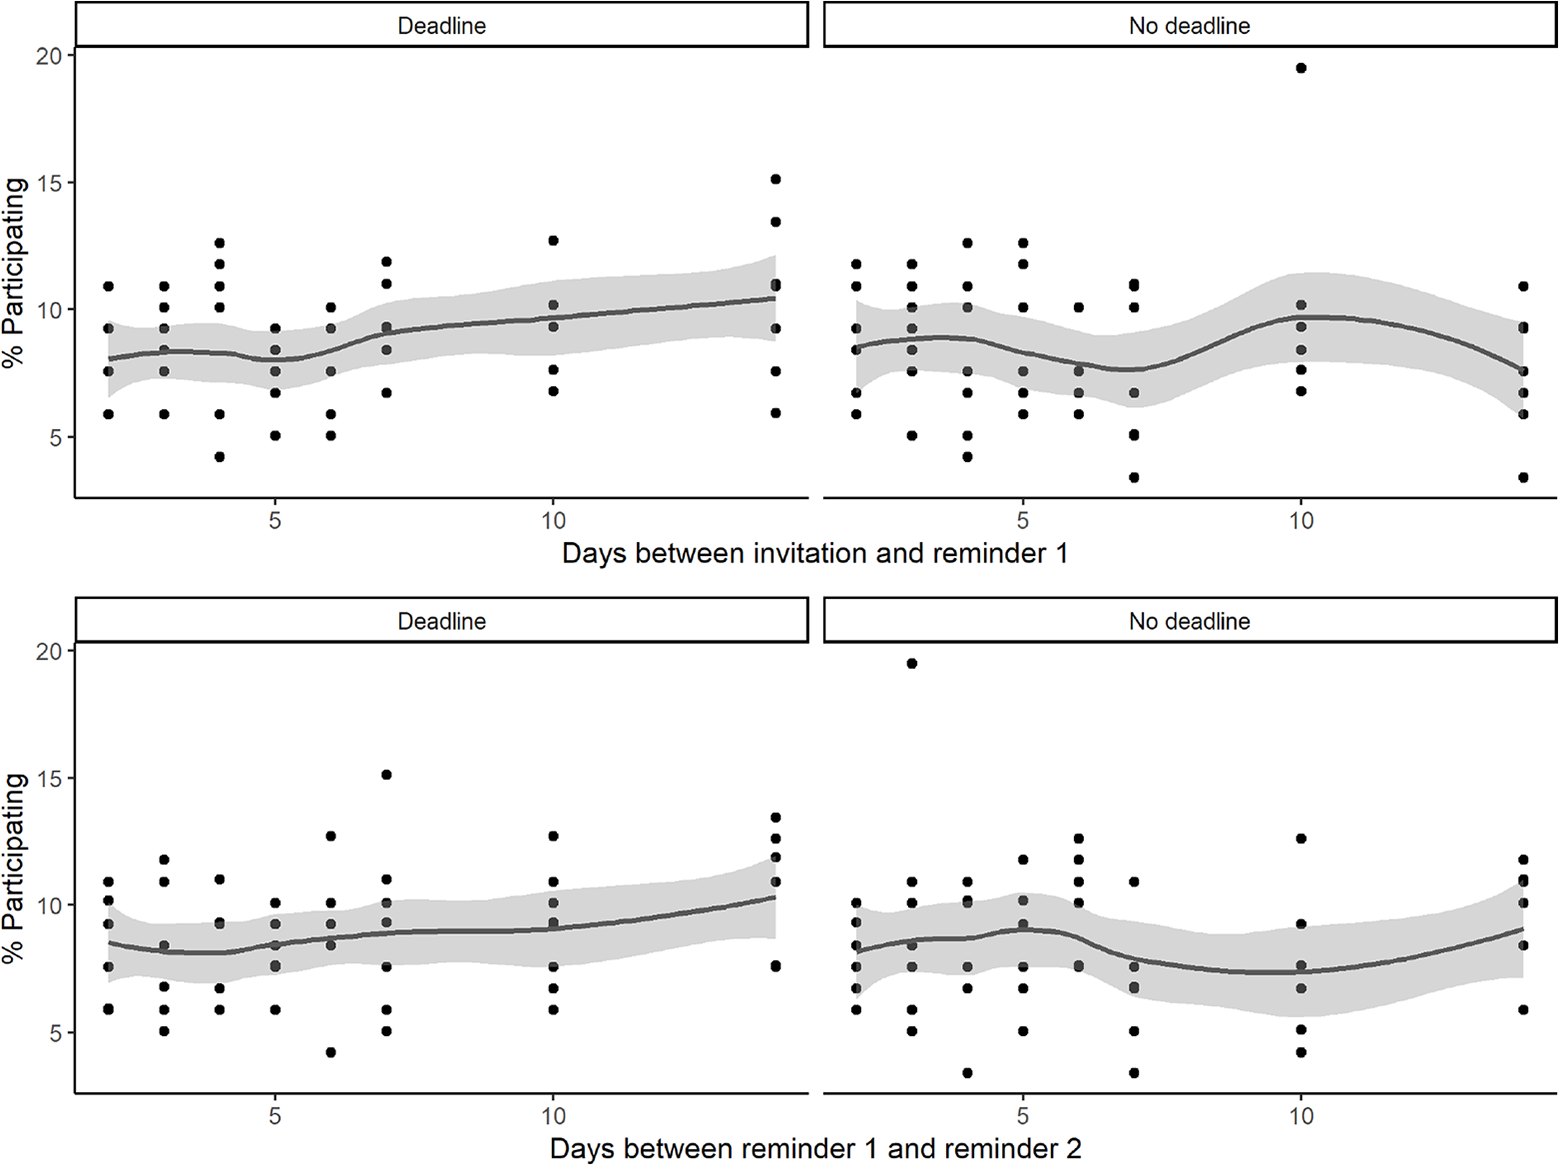
Participation rate by delays between contact attempt and communication of the deadline. Note. Each dot represents an experimental group (N = 122). The lines represent a polynomial smoother providing the best fitting line to describe the trend.
Table 5 presents the results of a discrete-time hazard model investigating the impact of the characteristics of the contact attempts on survey participation. The delay between the contact attempts does not seem to impact participation significantly not even conditionally on the communication of the deadline. The models also showed that the delay between the contact reminders, the communication of the deadline, and the timing (day and hour) of the contact attempt hardly explain survey participation (McFadden’s pseudo R2 = .013).
Discrete-Time Logistic Models of Survey Participation by Characteristics of the Contact Attempt.
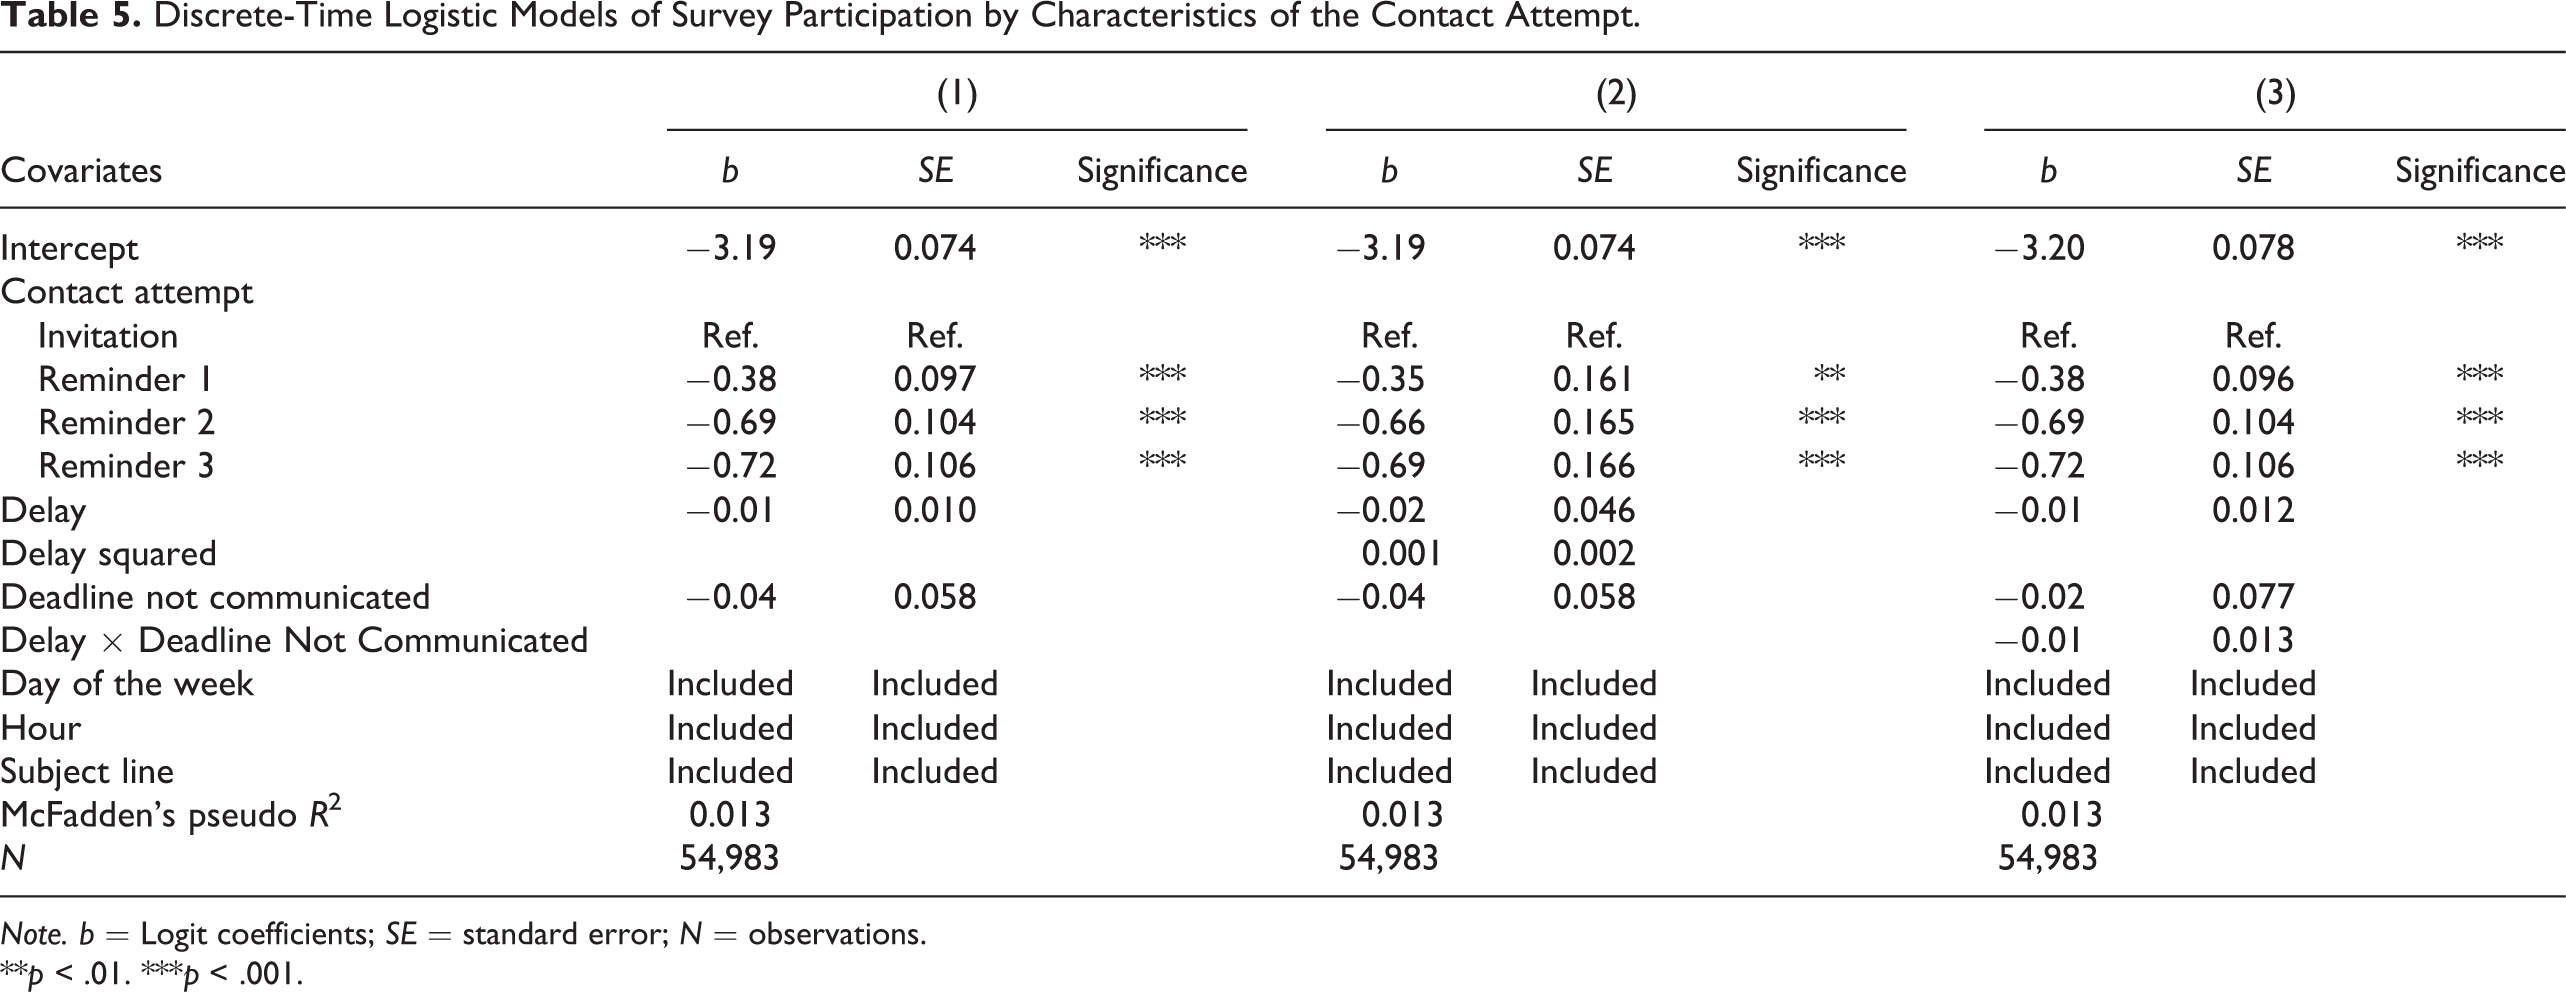
Note. b = Logit coefficients; SE = standard error; N = observations.
**p < .01. ***p < .001.
Timing of Participation
Finally, we estimated whether the length of the time frame until the deadline, which is also dependent on the delay between contact attempts (see Figure 1), had an impact on the timing of participation for those who participated in the survey (and controlling for day of the week and hour at the first invitation and subject line; N = 1,249). We additionally interacted the deadline latency with the experimental condition regarding the communication of the deadline in order to better distinguish the effect of the deadline latency from the effects of the delay between reminders.
Results of a linear regression model (Adjusted R2 = 8.7%) showed a curvilinear effect, suggesting that a longer time frame led students to postpone participation, but only up to a certain point as the curve stabilizes when the deadline is more than a month away, especially for those who knew about the deadline (see Figure 9). The effect is quite sizable, as the predicted the day of access when the deadline is 10 days away is about 4 days, it increases to 8 days when the deadline is 20 days away and to about 10 days when the deadline is 30 days away.
The fact that the trend is similar when comparing those who knew about the deadline and those who did not suggested that this effect is not due to the sense of urgency created by a close deadline but rather to the longer delays between contact reminders that have kept the survey available for a longer period.
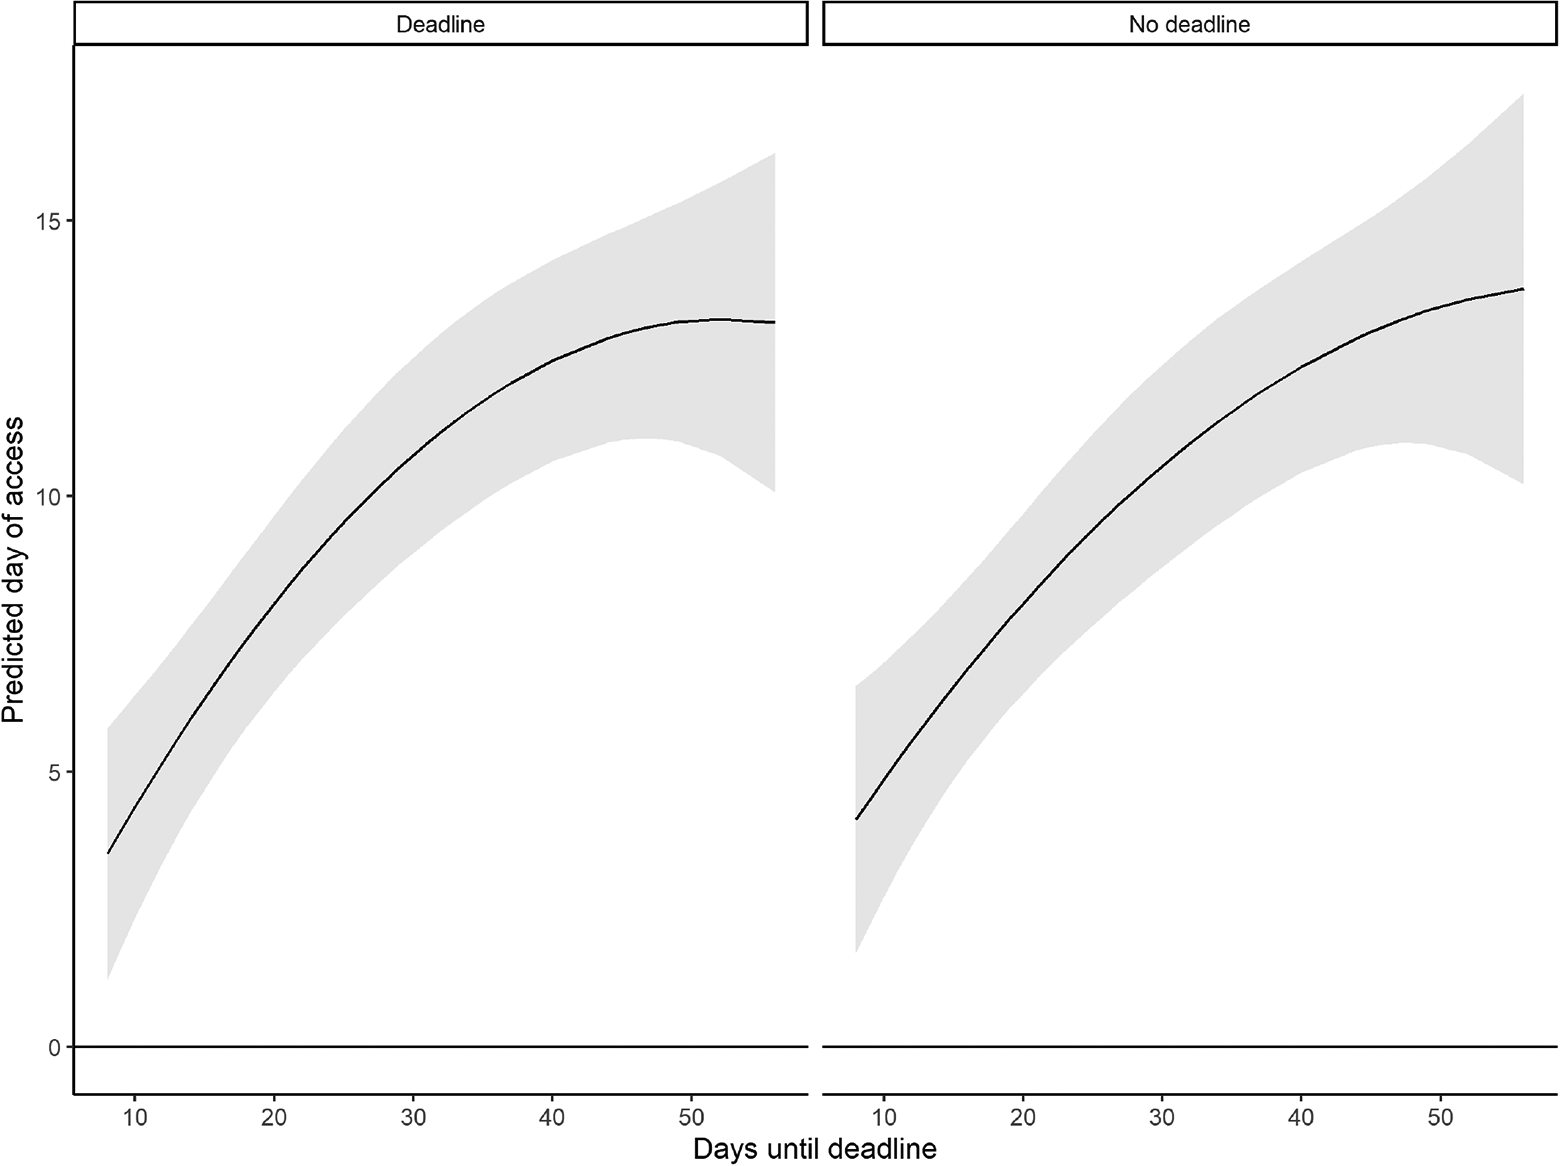
Predicted day of access by latency of the deadline on participation with 95% confidence intervals. Note. Estimates are computed with a linear regression models (N = 1,249).
Conclusion and discussion
As web surveys are a cheap, easy, and fast way of collecting data today, they are used frequently in most higher education institutions across the Global North for a myriad of purposes, including teaching and course evaluations, and research projects from academic and administrative staff as well as students. This development, however, also has some negative implications, one of them being oversurveying of higher education students. As a result, response rates in online student surveys have been declining steadily over the past 2 decades, a trend that has been connected to “survey fatigue” among higher education students. In this article, we therefore aimed to improve our understanding on how contact design can influence participation in web surveys among higher education students. Using an 8 × 8 × 2 experimental design whereby the full population of students at Tilburg University were randomly assigned to different experimental conditions, we particularly focused on the role of subject lines, deadlines, and delays between reminders. The findings are summarized in Table 6.
Summary of Results.
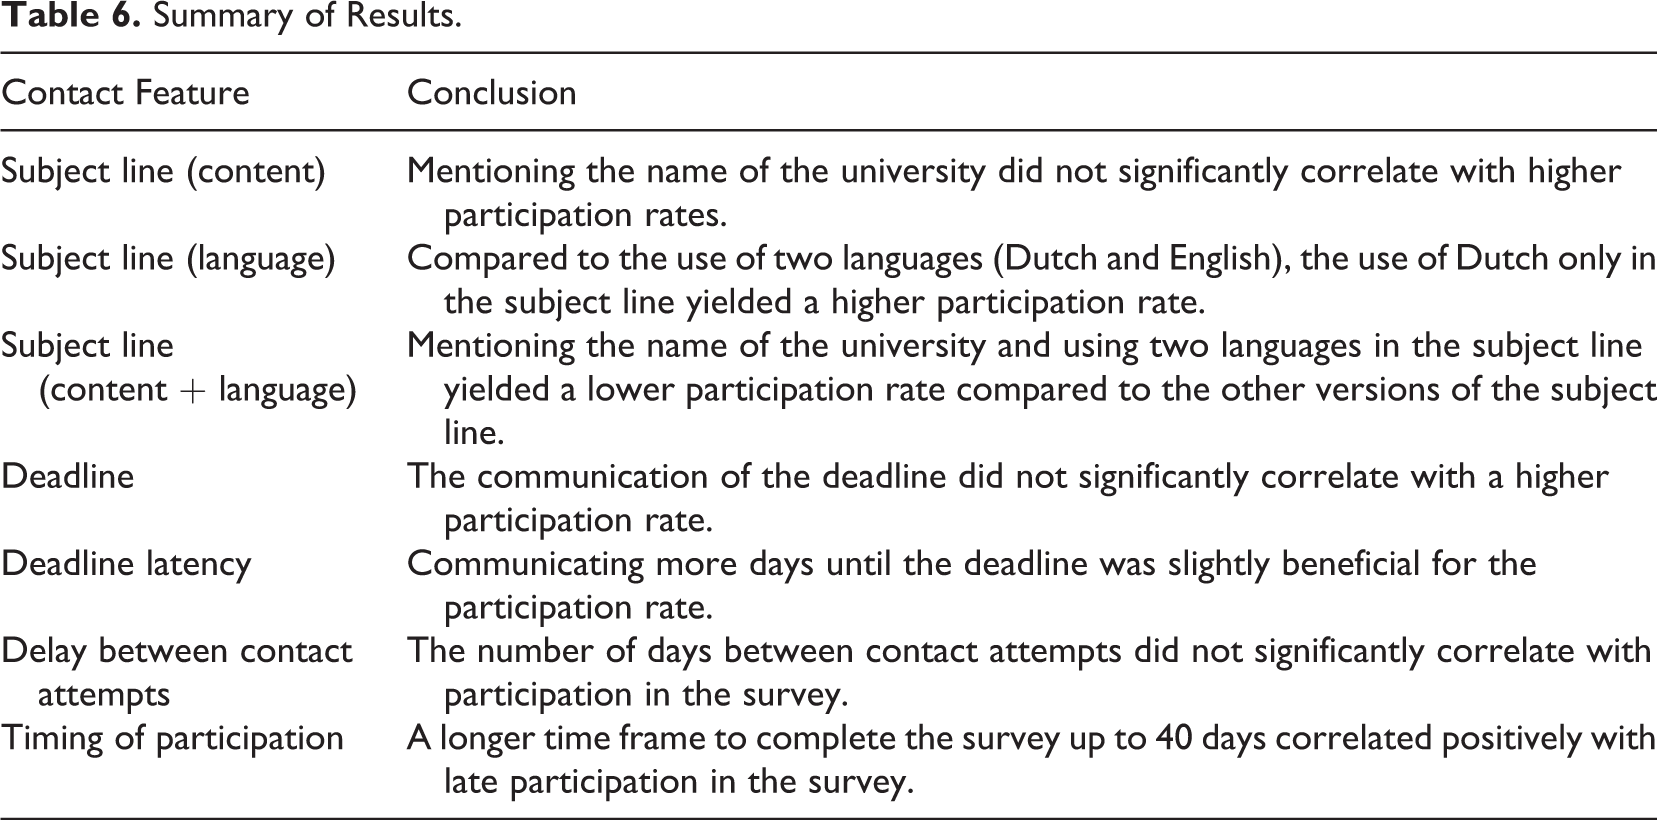
First, our results show that—contrary to our expectations—mentioning the name of the higher education institution that organizes the survey did not significantly increase participation in the web survey. It is possible this finding is due to the organizational setting, whereby students already receive quite a number of web survey invitations from their own institution during the academic year; therefore, they might more quickly dismiss the invitation email. Future research could adopt a comparative approach, investigating in collaborative projects, for example, whether response rates are different when the name of the student’s own higher education is used or the name of another organization/higher education institution. Regarding the language of the subject line, we expected that in multilingual contexts, whereby higher education institutions also host a (large) number of international students, when writing the subject line in two languages (the national language and English as lingua franca), participation rates might also be higher. However, our results showed that writing the invitation only in the national language yielded significantly higher participation rates. These findings suggest that it is of primary importance to use the national language for the subject line of the invitation email.
Second, the findings reported in this article also indicated that including a deadline does not make a difference. However, we also investigated whether the delay of the deadline matters when survey designers decide to use a deadline in their invitation—which can be the case if there is only limited time available for data collection and analysis, for example. The results indicated that a longer time frame for the deadline was slightly beneficial for participation, which suggests that having contact attempts not too close to each other might be beneficial. These findings have important implications for studies relying on web surveys, which only dispose a limited time frame available for the data collection, as it suggests the timing of the survey is essential when there is a deadline to be included.
Third, we investigated whether different delays between invitation and reminders make a difference in web survey participation rates. We expected shorter delays to lead to higher survey participation. The results, however, did not confirm this hypothesis. As such, the findings indicate that it is rather the number of reminders that leads to higher participation rates than the delay between them.
Finally, some limitations of our study should be acknowledged. First, the experiment was conducted among students of one higher education institution in the Netherlands, which might limit the generalizability of the results. Second, the study was based on only one student survey. Nevertheless, as topic salience also has been shown to influence web survey response rates, we recommend future research to adopt similar experimental designs with the similar student populations at the same institutions but across different web surveys.
In conclusion, in this article, we investigated whether various strategies regarding subject line content, communication of deadlines, and the timing of delays between contact moments can improve web survey response rates among samples of higher education students. Our findings indicated that the use of the national language in the invitation subject line can be beneficial, whereas the other strategies did not lead to significant higher or lower response rates. As such, more studies are certainly needed on contact design in order to develop tangible strategies that can help to combat low response rates due to survey fatigue. After all, contact design focuses on the first moments of contact between the researcher/administrator and students and is as such crucial in the survey response process.
Footnotes
Appendix
Authors’ Note
Author names are given in alphabetical order. Both authors contributed equally to this article. The authors are grateful to Francesca Zanasi for her helpful support in defining the analytical strategy.
Declaration of Conflicting Interests
The authors declared no potential conflicts of interest with respect to the research, authorship, and/or publication of this article.
Funding
The authors received no financial support for the research, authorship, and/or publication of this article.
Data Statement
A datapackage with the datasets and syntaxes is stored at Surfdrive. Both authors as well as the head of the department of Sociology, Tilburg University, have access to this package. The data are available upon reasonable request.
Software Information
The analyses have been conducted on R (R Core Team, 2013) using the following packages:
ggeffects: Lüdecke, D. (2018). ggeffects: Tidy data frames of marginal effects from regression models. Journal of Open Source Software, 3(26), 772. ![]() .
.
gridExtra: Baptiste A. (2017). gridExtra: Miscellaneous functions for “grid” graphics (R package Version 2.3). ![]()
Haven: Wickham, H., & Miller, E. (2020). Haven: Import and export “SPSS,” “Stata,” and “SAS” files (R package Version 2.3.1). ![]()
Hmisc: Harrell, F. E., Jr., With contributions from Dupont, C. and many others. (2020). Hmisc: Harrell miscellaneous (R package Version 4.4-1). ![]()
Lubridate: Grolemund, G., & Wickham, H. (2011). Dates and times made easy with lubridate. Journal of Statistical Software, 40(3), 1–25. ![]()
Margins: Leeper, T. J. (2018). Margins: Marginal effects for model objects (R package Version .3.23).
Rcompanion: Mangiafico, S. (2020). Rcompanion: Functions to support extension education program evaluation (R package Version 2.3.25). ![]()