
Abstract
This study utilizes acceleration data from smartphone sensors to predict motion conditions of smartphone respondents. Specifically, we predict whether respondents are moving or nonmoving on a survey page level to learn about distractions and the situational conditions under which respondents complete smartphone surveys. The predicted motion conditions allow us to (1) estimate the proportion of smartphone respondents who are moving during survey completion and (2) compare the response behavior of moving and nonmoving respondents. Our analytical strategy consists of two steps. First, we use data from a lab experiment that systematically varied motion conditions of smartphone respondents and train a prediction model that is able to accurately infer respondents’ motion conditions based on acceleration data. Second, we use the trained model to predict motion conditions of respondents in two cross-sectional surveys in order to compare response behavior of respondents with different motion conditions in a field setting. Our results indicate that active movement during survey completion is a relatively rare phenomenon, as only about 3%–4% of respondents were predicted as moving in both cross-sectional surveys. When comparing respondents based on their predicted motion conditions, we observe longer completion times of moving respondents. However, we observe little differences when comparing moving and nonmoving respondents with respect to indicators of superficial responding, indicating that moving during survey completion does not pose a severe threat to data quality.
Introduction and Background
The use of smartphones in web surveys has continuously increased during the last decade. Gummer et al. (2019), for example, show across 18 web surveys that were conducted in Germany that the proportion of smartphone respondents has successively increased from about 5% to 20% between 2012 and 2016. Revilla et al. (2016) observe a similar trend for Spain, Portugal, and several Latin American countries (see also Bosch et al., 2019b). The reasons for this development in web surveys seem to be twofold. On the one hand, the number of people who own a smartphone has increased. On the other hand, high-speed mobile Internet is more widely accessible. This applies to most countries around the globe, but especially to developing countries (Pew Research Center, 2018a, 2018b).
Smartphones offer many opportunities for innovative data collection that can be used for studying social science research questions as well as for methodological research. Examples include collecting expenditure data with receipt scanning apps (Jäckle et al., 2019), offering voice input options for answering open-ended questions (Revilla et al., 2020; Revilla & Couper, 2019), and asking respondents to take photographs for supplementing survey responses (Bosch et al., 2019a). Particularly, smartphone sensors, such as accelerometer, gyroscope, and GPS, allow the collection of detailed information that can be used to enrich and augment web survey data from smartphones. Data from built-in sensors allow, for instance, to unobtrusively record respondents’ location in time use surveys (Elevelt et al., 2019) and to measure objective physical activity for studying health (Weiss et al., 2018), happiness (Lathia et al., 2017), or (side-)effects of long-term unemployment (Kreuter et al., 2018).
At the same time, however, the increasing usage of smartphones as survey devices might also introduce challenges for survey data quality. In principle, smartphones enable respondents to participate in web surveys whenever and wherever they want with almost no locality, situation, or time restrictions (Mavletova, 2013). Consequently, smartphone respondents are frequently surrounded by third parties during survey participation (Toninelli & Revilla, 2016b), which might have a negative impact on response behavior because respondents can get distracted due to their environment. Lynn and Kaminska (2012) distinguish three types of distractions during survey participation: (1) distractions that demand aural attention, such as music playing in the background (see also Wenz, 2019), (2) distractions that demand visual attention, such as looking after children, and (3) multitasking, such as having a conversation. Indeed, Toninelli and Revilla (2016a) show that smartphone respondents report more distractions and/or multitasking behavior, such as watching TV and talking with other people, than PC respondents. However, one problem associated with these findings on distractions and multitasking is that they are based on self-reports, implying that respondents must admit that they might not pay constant attention. Thus, self-reports on distractions and multitasking are subject to social desirability bias and recall error, which might cause imprecise measures (Wenz, 2019).
This study aims to bridge the challenges and opportunities of smartphones as survey devices by utilizing passively collected acceleration data from smartphone sensors as an avenue for studying distractions and multitasking of smartphone respondents. More specifically, this study has two objectives: First, we demonstrate how acceleration data can be used to infer motion conditions of respondents (i.e., identifying moving vs. nonmoving respondents during survey completion). Second, we link the predicted motion conditions to response behavior and indicators of superficial responding. This twofold approach attempts to exemplify how methodological advances in data collection with smartphones and analysis of sensor data can be utilized in survey research to study motion conditions and response behavior. While we estimate the prevalence of different motion conditions and their effects on (superficial) responding in two concrete smartphone surveys, the proposed prediction approach allows future research to identify moving and nonmoving respondents and to analyze their response behavior in (future) smartphone surveys that collect acceleration data.
Previous studies on distractions and multitasking proposed to overcome the drawbacks of self-reports by passively collecting paradata 1 during web survey completion. For instance, Sendelbah et al. (2016) suggest to use so-called JavaScript “OnBlur” functions that measure the in-/activity of web survey pages—whether the browser tab or window that hosts the web survey is the active or processed one (see Callegaro, 2013; Couper & Peterson, 2017; Diedenhofen & Musch, 2017; Höhne et al., 2017, 2018; Höhne & Schlosser, 2018, 2019; Höhne, Schlosser, et al., 2020; Revilla & Couper, 2018a, 2018b; Sendelbah et al., 2016)—to infer on-device multitasking, such as switching browser tab or window to check incoming emails or social media notifications. Höhne, Schlosser, et al. (2020) show that on-device multitasking gathered by means of OnBlur functions occurs among 10% of all smartphone respondents in a web survey.
Beyond the use of paradata to detect multitasking, Höhne and Schlosser (2019) and Toepoel and Lugtig (2015) suggest to passively collect sensor data in smartphone surveys to draw conclusions about respondents’ completion conditions. Accelerometers measure the rate of change of velocity of an object over time, allowing researchers to unobtrusively record physiological states, such as movements (see Elhoushi et al., 2017; Harari et al., 2016; He et al., 2016; Höhne, Revilla, et al., 2020; Höhne & Schlosser, 2019; Toepoel & Lugtig, 2015). If a person moves or walks, they are creating acceleration (He et al., 2016), which is detected by the smartphone that is commonly worn on the body (e.g., in the pocket). This situation can be applied to respondents that have the smartphone in their hands and complete a web survey, referring to a “respondent-device” link (Höhne, Revilla, et al., 2020; Höhne & Schlosser, 2019). To put it differently, respondents’ motions are detectable by the acceleration sensor of smartphones, allowing researchers to classify smartphone respondents on the basis of their motion levels (i.e., acceleration).
In contrast to paradata, which can be used to study on-device multitasking, the usage of acceleration data provides an avenue to learn about the (situational) conditions in which respondents complete web surveys. For instance, Höhne, Revilla, et al. (2020) show that completing surveys outdoors, moving around during survey completion, and the presence of third parties during survey completion significantly increase the acceleration of smartphones. Thus, acceleration data may be used to study distractions that go beyond respondent-initiated multitasking activities, without relying on self-reports. More specifically, respondents who move around (e.g., outdoors or at home) are likely to encounter aural and/or visual distractions, which might divert their attention away from the web survey. In relation to this, Höhne and Schlosser (2019) report significantly longer completion times and stronger primacy effects for respondents who were experimentally assigned to a “moving” condition while completing a smartphone survey, compared to respondents who were assigned to a “nonmoving” condition. 2 While the detection of such completion conditions is limited when using self-reports or paradata in the form of OnBlur functions, acceleration data from smartphone sensors represent a new gateway for mobile web survey research to infer distractions and multitasking.
In what follows, we outline the conceptual twofold approach of this study for predicting motion conditions and studying their relationship with superficial responding and present the associated research questions. Then, we describe the data sources and study designs including the underlying samples, the survey questions used, and the analytical strategies. We then present the results of the study, and finally, we discuss practical implications associated with the feasibility of predicting motion conditions in smartphone surveys and address future research perspectives.
Conceptual Approach and Research Questions
Although smartphone sensors allow researchers to unobtrusively collect information about respondents’ physiological states, there is little research that utilizes acceleration data to study completion conditions in web surveys or classifies respondents based on predicted motion conditions. However, as previously outlined, preliminary evidence suggests that respondents with different motion conditions may differ in terms of response behavior. We expect that moving is associated with more (situational) distractions and multitasking than nonmoving and thus fosters superficial responding. More specifically, we assume that performing multiple tasks at the same time (e.g., answering survey questions and walking around) implies a relocation of cognitive resources (Zwarun & Hall, 2014), which may increase completion times because respondents must devote time for the additional task (e.g., environmental orientation) and must (partially) restart the cognitive response process when refocusing on the survey. The same mechanism may increase low (or high) intraindividual response variability (IRV) and primacy effects for moving respondents who are engaging in multiple tasks (e.g., safely reaching their destination and completing the survey). In line with this reasoning, we address the following research questions: (1) How accurately can we predict respondents’ motion conditions in smartphone surveys using acceleration data? (2) How common are different types of motion conditions in smartphone surveys? and (3) How do respondents with different predicted motion conditions differ with respect to response behavior?
To study motion conditions of smartphone respondents and their effects on response behavior by using acceleration data, we employ a two-step approach. In a first step, we train machine learning models using high-frequency acceleration data to learn the link between different motion conditions and acceleration profiles. The acceleration data were collected in a lab experiment that systematically varied the motion conditions (i.e., sitting, standing, walking, and stair climbing) of respondents while they completed a web survey on their smartphone. More specifically, we train and evaluate regularized regression and tree-based models using grouped cross-validation, reflecting the hierarchical structure of the acceleration data with survey pages nested in respondents. In building our prediction models, we focus on a binary outcome variable with the labels moving (i.e., walking and stair climbing) and nonmoving (i.e., sitting and standing). Note that the data from the lab experiment allow the prediction models to learn patterns from the acceleration data that distinguish moving from nonmoving respondents given the “ground truth” (i.e., the true outcome is observed). Without this knowledge, ad hoc decisions on, for instance, a fixed (and arbitrary) acceleration threshold that differentiates both conditions would need to be specified in order to infer motion conditions in new data sets. Furthermore, such an approach would most likely focus on average acceleration (over time) and would therefore not utilize the full level of granularity that acceleration data offer.
In a second step, the trained models are used to predict respondents’ motion conditions in two (new) self-administered smartphone surveys that also collected high-frequency acceleration data of respondents’ smartphones during web survey completion. This allows us to study the prevalence of different predicted motion conditions and the effects of motion conditions on response behavior in a field setting. In this context, we compare completion times, IRV, primacy effects, and compliance with an instructional manipulation check (IMC) between respondents with different predicted motion conditions.
Method
Data Sources and Study Designs
In this study, we use three different data sources: data from a lab experiment (Data Source 1) and data from two cross-sectional surveys (Data Sources 2 and 3). All data sets contain high-frequency acceleration data that were collected using the open-source JavaScript-based tool “SurveyMotion (SMotion)” developed by Höhne and Schlosser (2019). 3 SMotion collects the total acceleration (TA) of mobile devices, such as smartphones, on a survey page level. TA is defined as follows (see, for instance, He et al., 2016):
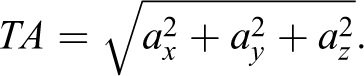
Equation 1: Calculating TA.
Note. Accelerations (a) along the x-, y-, and z-axis are defined as ax, ay, and az, respectively.
The sampling rate of the TA primarily depends on the device and/or on frequency restrictions set in the JavaScript code. In this study, the TA of smartphones was measured without any frequency restrictions set in the JavaScript code to register it as precisely as possible. On average, the TA was measured every 17.9 ms.
In addition, we collected several kinds of paradata, such as completion times and User-Agent-Strings, that were also collected on a survey page level. For this purpose, we used the open-source JavaScript-based tool “Embedded Client Side Paradata” developed by Schlosser and Höhne (2018). We obtained informed consent for the collection of acceleration data and paradata in the lab experiment and in the two cross-sectional surveys.
While the first data set (Data Source 1) serves for training the machine learning models, the last two data sets (Data Sources 2 and 3) serve for predicting respondents’ motion conditions in a field setting and to compare the response behavior of respondents with different predicted motion conditions.
Data Source 1: Lab Experiment
A total of N = 89 students from the University of Göttingen in Germany took part in the lab experiment in 2017. These participants were between 18 and 42 years with a mean age of 24.5 (SD = 4.4). Overall, 55% were female, and at least 85% had participated previously in a web survey. Furthermore, 99% used their smartphone and 96% used the Internet on a daily basis.
Participants were randomly assigned to one of four experimental groups. The first group (n = 22) was seated in front of a desk with the smartphone lying on the desk during survey completion (sitting condition). The second group (n = 22) stood at a fixed point with the smartphone in their hands during survey completion (standing condition). The third group (n = 23) walked along an aisle with the smartphone in their hands during survey completion (walking condition). The fourth group (n = 22) climbed stairs with the smartphone in their hands during survey completion (stair-climbing condition). The entire study was supervised by an experimenter to ensure proper compliance with the assigned motion conditions.
To evaluate the effectiveness of random assignment and the sample composition between the four experimental groups, we conducted χ2 tests. The results showed no statistically significant differences regarding age, gender, survey participation, smartphone usage, and Internet usage. 4
Data Source 2: Cross-Sectional Survey 1
The data were collected at the University of Göttingen in Germany in December 2017. Students were invited by email stating the topic of the study and including a link that directed them to the survey. A total of 1,711 students started the survey using a smartphone, 5 which took about 9 min. Among these, 466 were dropped because they only visited the title page (n = 48), broke off before being asked any study-related questions (n = 54), had no accurately measured acceleration data because of deactivated JavaScript (n = 8), or their smartphones were not equipped with accelerometers that allow for the measurement of pure TA without gravity (n = 356). This leaves us with 1,245 respondents available for statistical analyses.
These respondents were aged between 17 and 74 years, with a mean age of 23.3 (SD = 3.9), and 67% of them were female. All respondents had completed a college preparatory secondary school or university-level education. The distribution of sociodemographic characteristics is largely similar for the cases that were dropped from the analyses (see Online Appendix A in the Online Supplement of this article).
Data Source 3: Cross-Sectional Survey 2
The data were collected by the nonprobability access panel Respondi in Germany in July and August 2019. A total of 1,726 respondents started the smartphone survey, which took about 20 min. 6 Among these, 579 were dropped because they only visited the title page (n = 57), broke off before being asked any study-related questions (n = 24), had no accurately measured acceleration data because of deactivated JavaScript (n = 5), or their smartphones were not equipped with accelerometers that allow for the measurement of pure TA without gravity (n = 493). This leaves us with 1,147 respondents.
These respondents were aged between 18 and 70 years, with a mean age of 43.9 (SD = 14.8), and 63% of them were female. In terms of education, 10% had completed lower secondary school, 38% intermediate secondary school, and 52% college preparatory secondary school or university-level education. We again observe little differences between the sample with complete information and the dropped cases (see Online Appendix A in the Online Supplement of this article).
Survey Questions
Data Source 1: Lab experiment
The lab data are based on three single questions that were presented individually on the survey page and eight questions with an item-by-item approach that were presented together on one survey page (see Online Appendix B in the Online Supplement of this article). The three single questions and the eight item-by-item questions dealt with achievement and job motivation. These questions were adopted from the Cross Cultural Survey for Work and Gender Attitudes (Hanson Frieze, 2010) and the German General Social Survey (Terwey, 2000). The presentation order of the questions was randomized to limit order effects. The questions were in German, which was the mother tongue of 93% of the participants.
Data Sources 2 and 3: Cross-Sectional Surveys 1 and 2
The data are based on five single questions that were presented individually on the survey page and 16 questions with an item-by-item approach that were presented on two survey pages (see Online Appendix B in the Online Supplement of this article). The single and item-by-item questions dealt with achievement and job motivation and were also adopted from the Cross Cultural Survey for Work and Gender Attitudes (Hanson Frieze, 2010) and the German General Social Survey (Terwey, 2000). The response scales of these questions slightly differed between the two cross-sectional surveys (i.e., endpoint labeled and fully labeled). In addition, both surveys included an IMC that was adopted from Berinsky et al. (2014; see Online Appendix B in the Online Supplement of this article). All questions and the IMC were in German, which was the mother tongue of 93% and 96% of the participants, respectively.
Analytical Strategies
Step 1: Training prediction models based on acceleration data
To infer completion conditions of respondents in smartphone surveys, we use the acceleration data that were collected in the lab experiment (Data Source 1) to train and evaluate several prediction models. In this step, we extract features (i.e., predictor variables) from the acceleration data of the lab experiment by aggregating over the repeated acceleration measurements that were collected for each survey page. More specifically, we compute the following summary statistics for the TA values of each respondent and survey page (i.e., respondent-page): mean, median, variance, median absolute deviation, interquartile range, minimum, maximum, range, and percentiles (i.e., 5%, 10%, 25%, 75%, 90%, and 95%). This data preparation strategy allows us to sidestep the fact that the number of acceleration values per respondent and survey page depends on the sampling rate of respondents’ smartphone and the time to complete a given survey page (i.e., the number of observed acceleration values varies widely between respondent-pages). Tables 1 and 2 present descriptive statistics of the acceleration features (i.e., independent variables) for the lab experiment and both cross-sectional surveys.
Distribution of Acceleration Features: Lab Experiment.
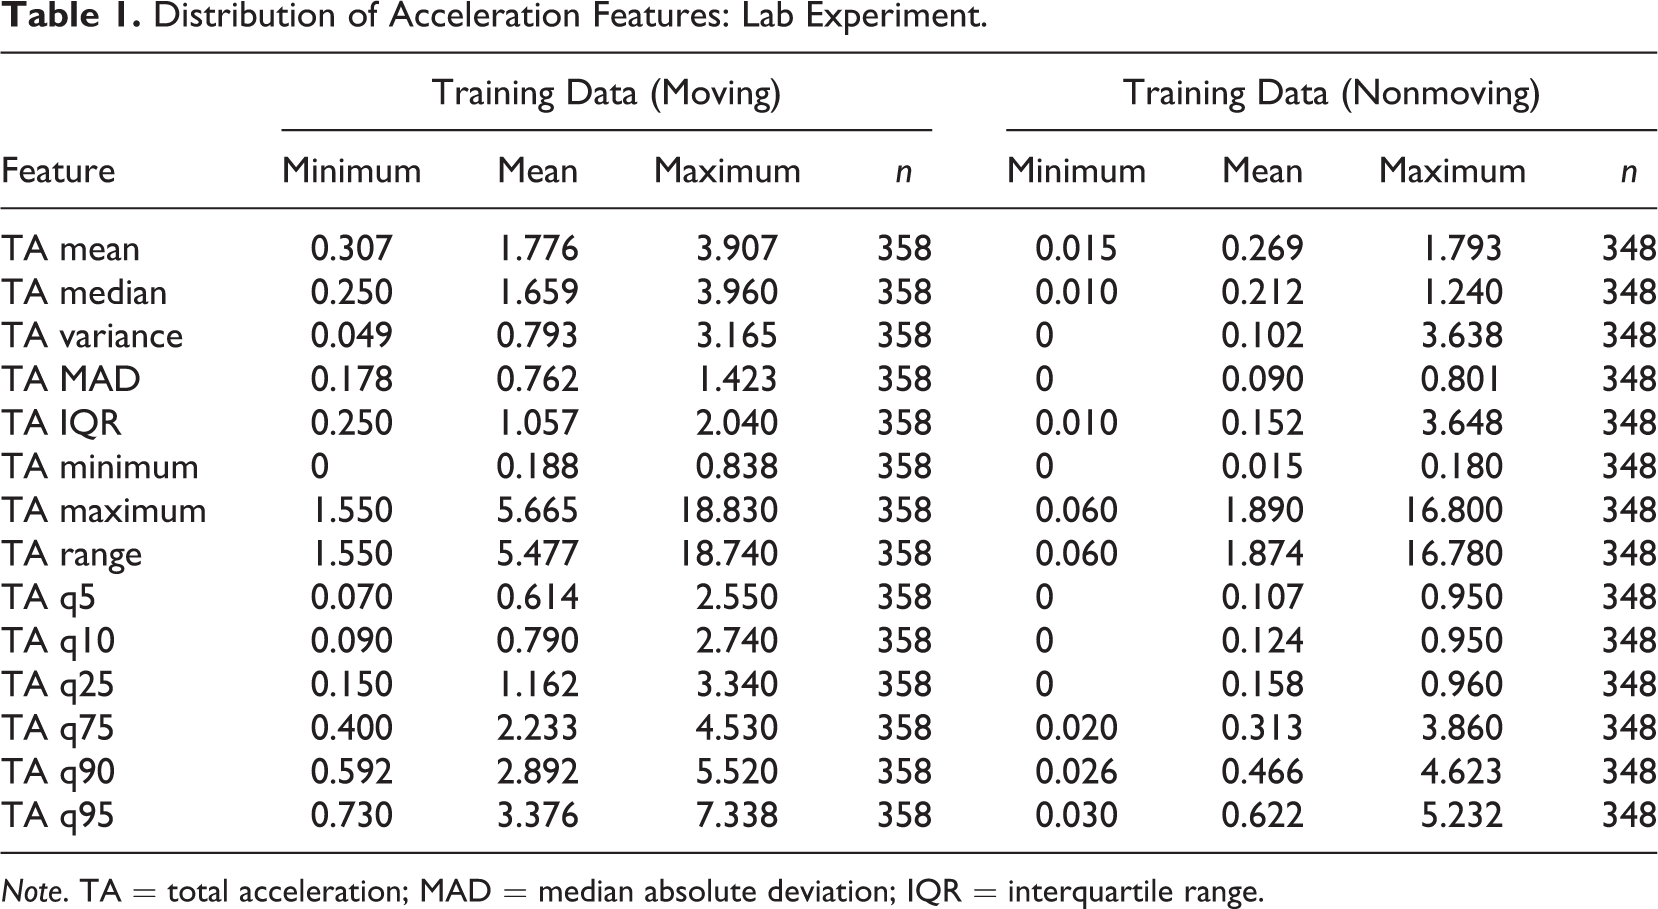
Note. TA = total acceleration; MAD = median absolute deviation; IQR = interquartile range.
Distribution of Acceleration Features: Cross-Sectional Surveys 1 and 2.
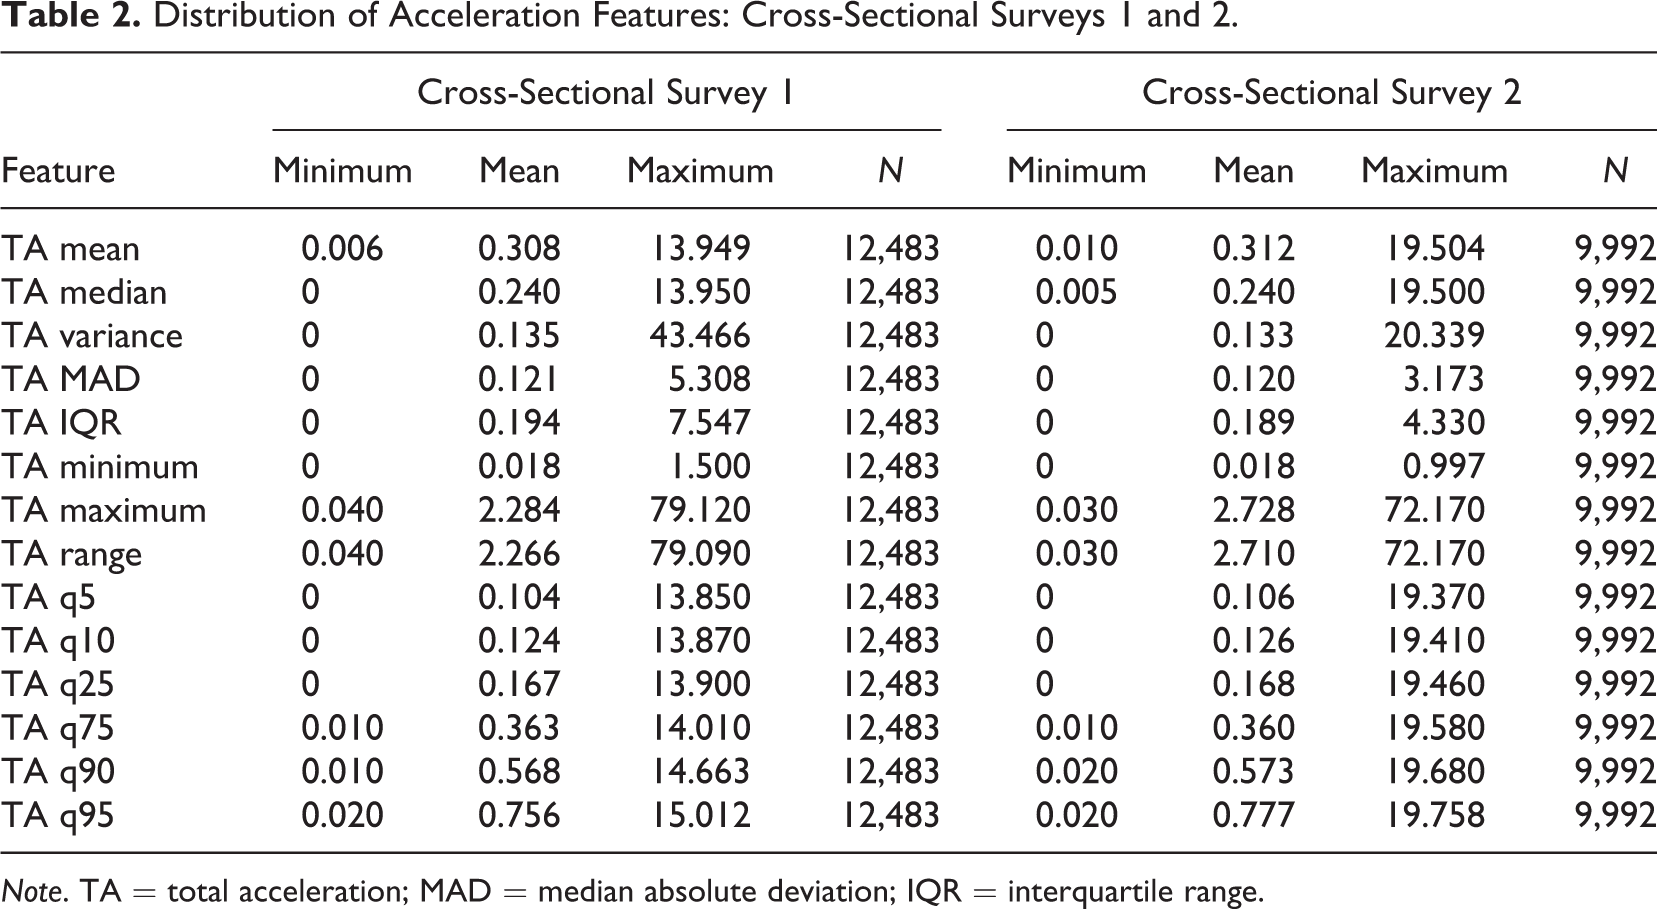
Note. TA = total acceleration; MAD = median absolute deviation; IQR = interquartile range.
In terms of the outcome variable, we focus on a binary variable that condenses the four conditions of the lab experiment into the categories moving (i.e., walking and stair climbing) and nonmoving (i.e., sitting and standing). In line with previous research, we expect that these physiological states are most informative when studying completion conditions in smartphone surveys (see Höhne, Revilla, et al., 2020; Höhne & Schlosser, 2019).
In building our prediction models, we consider regularized regression methods (including standard logistic regression as a special case), decision trees, and tree-based ensemble methods to include both parametric and nonparametric (i.e., more flexible) techniques in our set of models. A key feature of the tree-based methods is their ability to automatically adapt to complex functional forms of the relationship between the predictors and the outcome, which is particularly valuable when little theoretical guidelines for a priori model specification exist (Kern et al., 2019). Specifically, we train prediction models using the following methods and tuning grids 7 (see, for instance, Hastie et al., 2009; Kuhn & Johnson, 2013):
Elastic net (GLMnet; Friedman et al., 2010)
ˆ α = [0, 0.5, 1], λ = [0.1,…, 0]
Conditional Inference Trees (CTREE; Hothorn & Zeileis, 2015)
ˆ mincriterion = [.99, .95, .90, .85, .75]
Random forests (RF) and extremely randomized trees (Wright & Ziegler, 2017) 8
ˆ splitrule = [gini, extratrees], mtry = [3, 4], min.node.size = [15]
Extreme Gradient Boosting (XGBoost; Chen & Guestrin, 2016)
ˆ max_depth = [3, 5, 7, 9], nrounds = [500, 1,000, 1,500], η = [.01, .05].
The models are tuned and evaluated using nested cross-validation with 10 outer folds and 10 inner folds. In the inner cross-validation loop, the best tuning parameter setup for each method is selected based on cross-validated binomial log-loss. In the outer cross-validation loop, the respective best models are evaluated and compared based on cross-validated accuracy, log loss, and area under the receiver operating characteristic (ROC) curve (ROC–AUC). We employ grouped cross-validation in the outer cross-validation loop to account for the hierarchical structure of the training data by ensuring that all observations (survey pages) from a given respondent are either in the training set or in the holdout set. By (repeatedly) using different subsets of the data for model training and model evaluation, the cross-validation results allow us to learn about the out-of-sample performance of the prediction models (i.e., their ability to generalize to new data). Nesting two cross-validation loops cleanly separates model selection (tuning) and model assessment such that honest evaluation of the selected models with new (outer) test sets is possible (Hastie et al., 2009).
Step 2: Predicting motion conditions and analyzing response behavior
In the next step, the selected final model is employed to predict motion conditions in the two cross-sectional surveys (Data Sources 2 and 3). Again, aggregated acceleration variables are used as features. We compare the response behavior of moving and nonmoving respondents using (generalized) mixed-effects regression models (with survey pages nested in respondents; see Raudenbush & Bryk, 2002) and logistic regressions, with the predicted motion condition being the predictor of main interest. We further include age, gender, and mother tongue (German) for Data Sources 2 and 3 as control variables, assuming that particularly younger respondents might be more likely to complete surveys “on the go” and have been shown (along with male respondents and immigrants) to be more prone to superficial responding (Schonlau & Toepoel, 2015; van Vaerenbergh & Thomas, 2013). The outcome variables (i.e., response behavior indicators) of the (mixed-effects) regression models are defined as follows (see Online Appendix A in the Online Supplement of this article for descriptive statistics) 9 :
Completion time: Time in seconds that respondents needed to complete the web survey page (i.e., the time elapsing between question presentation on the screen and submitting the response by clicking next).
ˆ We applied a distribution-based outlier definition: We excluded all respondents with completion times below the 5% percentile or above the 95% percentile.
ˆ Calculated for survey pages with single and item-by-item questions.
Low (high) IRV: SD of responses on a survey page lower (higher) than the 20% (80%) percentile (see Dunn et al., 2018; Marjanovic et al., 2015).
ˆ Binary (low IRV): 1 = “IRV ≤ 20% percentile,” 0 = “IRV > 20% percentile.”
ˆ Binary (high IRV): 1 = “IRV ≥ 80% percentile,” 0 = “IRV < 80% percentile.”
ˆ Calculated for survey pages with item-by-item questions only.
Primacy effects: selecting the first category of a response scale (van Vaerenbergh & Thomas, 2013).
ˆ Binary: 1 = “first category,” 0 = “not first category.”
ˆ Calculated for survey pages with single and item-by-item questions.
Compliance with an IMC: correctly answering an IMC (Berinsky et al., 2014).
ˆ Binary: 1 = “compliance,” 0 = “noncompliance.”
The code and the final (trained) RF model that is used in this article are available at the following GitHub repository: https://github.com/chkern/survey-motion.
Results
The cross-validation results of the machine learning models predicting motion conditions with the training data (Data Source 1) are reported in Table 3. More precisely, we report summary statistics for the distribution of accuracy, ROC–AUC, and log loss over all outer holdout sets (i.e., samples were not used for model tuning) for the best model of each method. For both accuracy (i.e., the proportion of correct classifications, range in [0, 1]) and ROC–AUC (i.e., range in [0, 1] with 0.5 representing a noninformative model), higher values indicate better prediction performance. In contrast, for binomial log-loss (i.e., the distances between the predicted probabilities and the true classes, no upper bound with the log loss of a [useless] model which predicts 0.5 for all cases being ln (0.5) ≈ 0.693), lower values indicate better performance.
The results show a strong prediction performance for all four machine learning models, irrespective of the performance measure used. Thus, the derived acceleration features can be used to build prediction models that sharply discriminate between the two motion conditions (moving and nonmoving) with mean ROC–AUCs between 0.988 and 0.995. As even the (simpler) CTREE model achieves a mean ROC–AUC of 0.988, this result underlines the predictive power of the acceleration data for the prediction task at hand. In order to utilize the best possible model for predicting motion conditions in the two cross-sectional surveys (Data Sources 2 and 3), we selected the RF as the final prediction model, as it achieves the highest mean accuracy (0.980) and the highest mean ROC–AUC (0.995).
Prediction Performance.
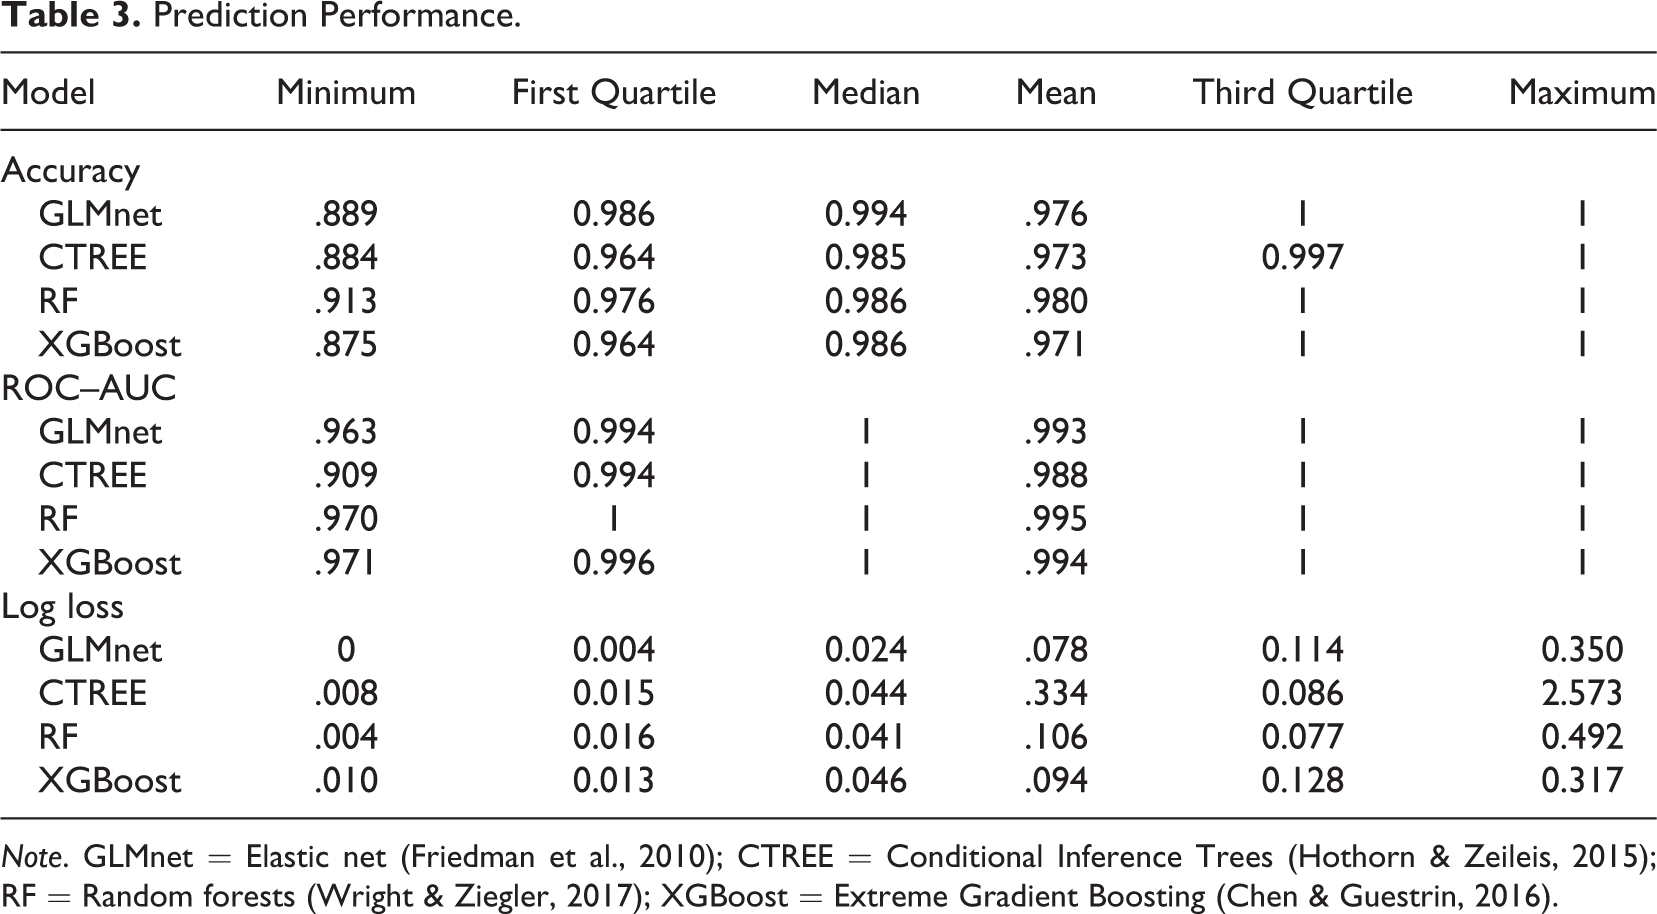
Note. GLMnet = Elastic net (Friedman et al., 2010); CTREE = Conditional Inference Trees (Hothorn & Zeileis, 2015); RF = Random forests (Wright & Ziegler, 2017); XGBoost = Extreme Gradient Boosting (Chen & Guestrin, 2016).
We calculated proportions of respondents that are predicted as moving and nonmoving in the two cross-sectional surveys (Data Sources 2 and 3) based on the RF model that was trained with data of the lab experiment as outlined above (Data Source 1). Overall, a small proportion of respondents is predicted as moving while answering the survey questions. This is the case for both cross-sectional surveys (Data Sources 2 and 3) and all web survey pages under investigation in this study. On average, we predict that 3.7% (Data Source 2) and 2.7% (Data Source 3) of the respondents were moving, indicating only minor differences between the two cross-sectional surveys. Our predictions indicate that active movement, such as walking around, is a relatively rare completion behavior in both studies at hand.
10
Proportions of respondents that are predicted as moving and nonmoving for each survey page of both cross-sectional surveys are presented in Online Appendix D in the Online Supplement of this article.
The predicted motion conditions allow us to further investigate whether and to what extent moving respondents differ from nonmoving respondents in terms of response behavior. In this context, we assume that moving, compared to nonmoving, is associated with more (situational) distractions and, thus, longer completion times and lower response quality.
Completion Time
As a first step, we compared completion times between respondents that were predicted as moving and respondents that were predicted as nonmoving by using mixed-effects regression models. The results are presented in Table 4. Note that all regressions represent pooled models that are based on data from Cross-Sectional Surveys 1 and 2. Model 1 reveals that completion times are higher for moving respondents than for nonmoving respondents. Specifically, we observe 0.772 s longer completion times for predicted moving respondents on average. Model 2 shows that these relationships are amplified when including demographic controls (i.e., age, gender, and mother tongue). In contrast, we observe shorter completion times in Cross-Sectional Survey 2 compared to Cross-Sectional Survey 1 (Model 2). With little surprise, we observe that completion times are higher for web survey pages with an item-by-item approach (Model 3). Model 4 indicates that longer completion times of moving respondents can specifically be observed on survey pages with item-by-item questions, as shown by the positive interaction effect of Moving × Item-by-item. By contrast, there is little variation in the positive effect of moving between the two cross-sectional surveys (Model 5).
Mixed-Effects Regression Parameters (Estimated Coefficients and SE) on the Dependent Variable Completion Time (in Seconds).
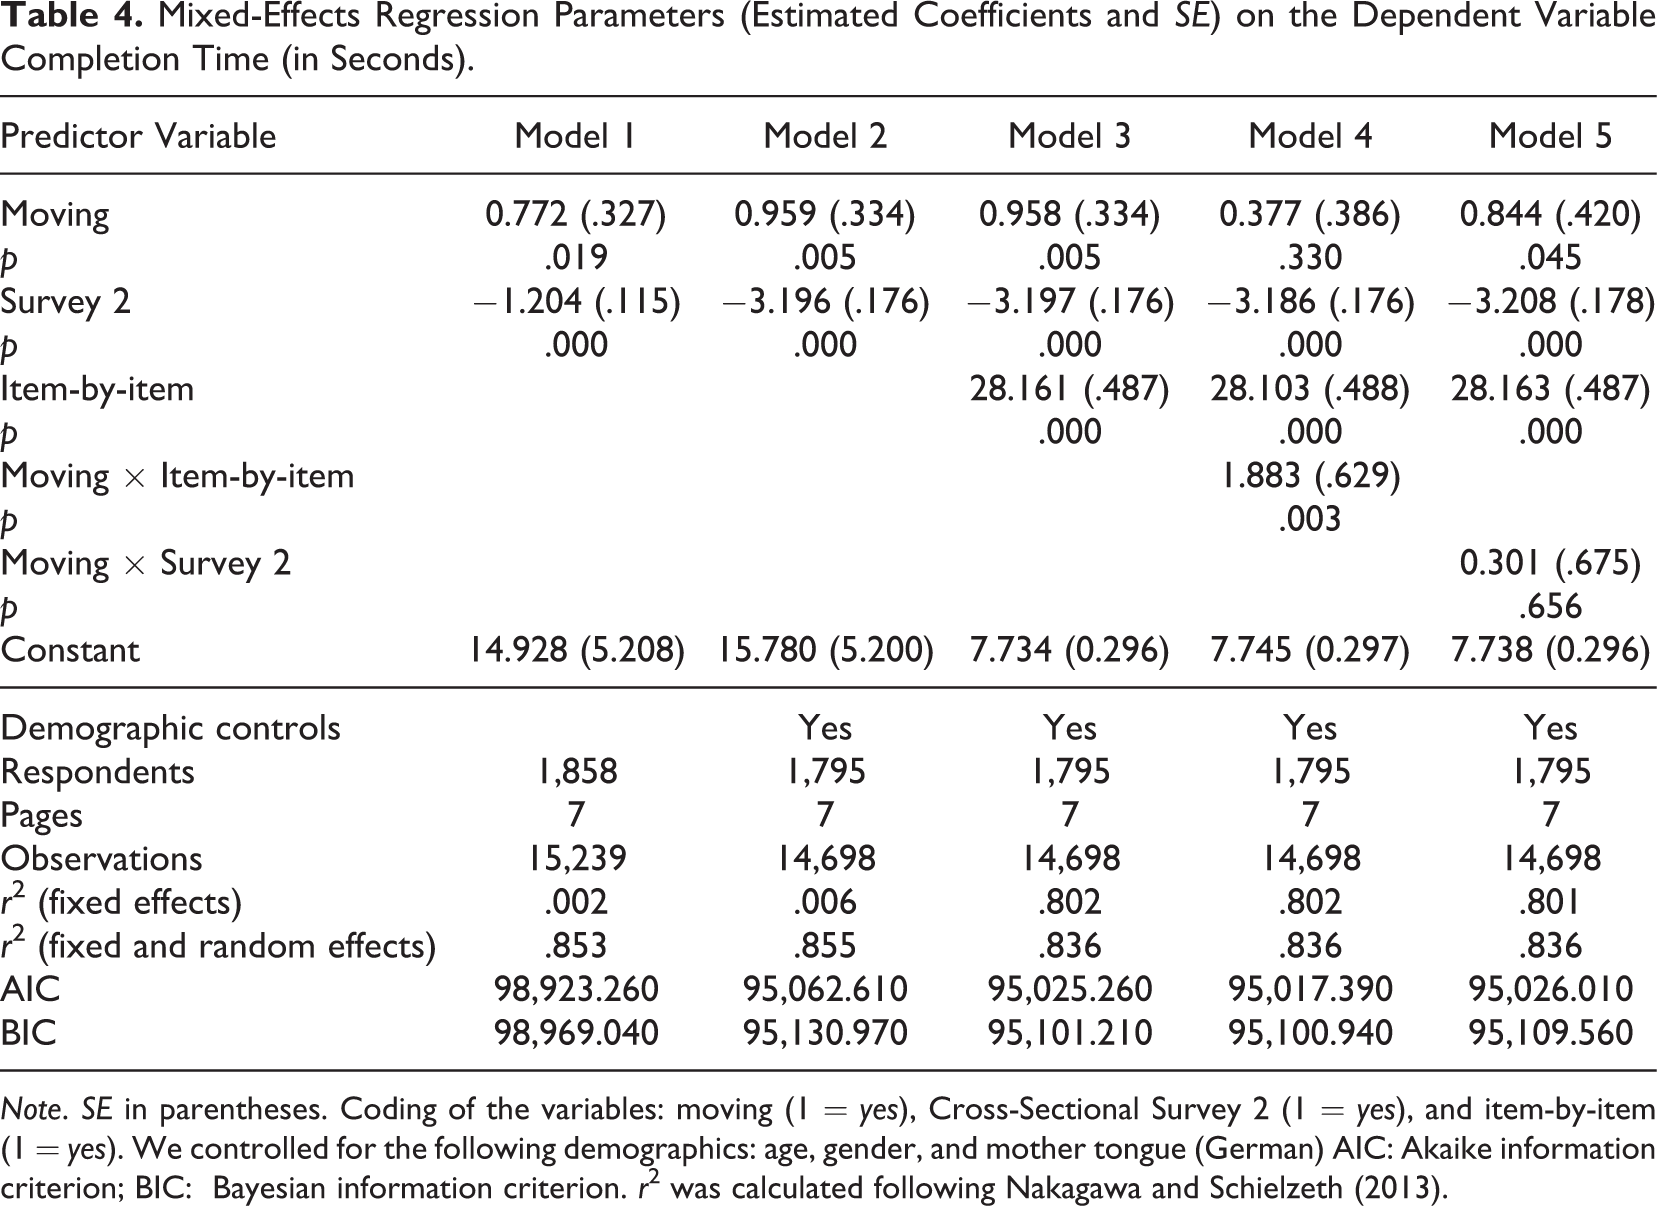
Note. SE in parentheses. Coding of the variables: moving (1 = yes), Cross-Sectional Survey 2 (1 = yes), and item-by-item (1 = yes). We controlled for the following demographics: age, gender, and mother tongue (German) AIC: Akaike information criterion; BIC: Bayesian information criterion. r2 was calculated following Nakagawa and Schielzeth (2013).
Low and High IRV
We now focus on web survey pages with item-by-item questions only and investigate low (e.g., nondifferentiation) and high (e.g., random responses) IRV, as indicators of superficial responding. Table 5 reports the results. While Models 1–3 focus on low IRV, Models 4– 6 use high IRV as the dependent variable.
Low IRV does not seem to be affected by the predicted motion condition (Model 1). This similarly applies when controlling for demographic characteristics (Model 2). The interaction Moving × Cross-Sectional Survey 2 in Model 3, however, indicates a stronger (positive) effect of moving on low IRV in Cross-Sectional Survey 2.
Interestingly, for high IRV, we find a negative effect of moving that increases from Model 4 to Model 5. This indicates that moving respondents are less likely to exhibit highly variable response patterns on web survey pages with item-by-item questions. The conditional main effect of moving (while including the interaction term Moving × Cross-Sectional Survey 2) shows that this is specifically the case for Cross-Sectional Survey 1 (Model 6).
Generalized Mixed-Effects Regression Parameters (Estimated Coefficients and SE) on the Dependent Variables Low IRV (1 = Yes) and High IRV (1 = Yes).
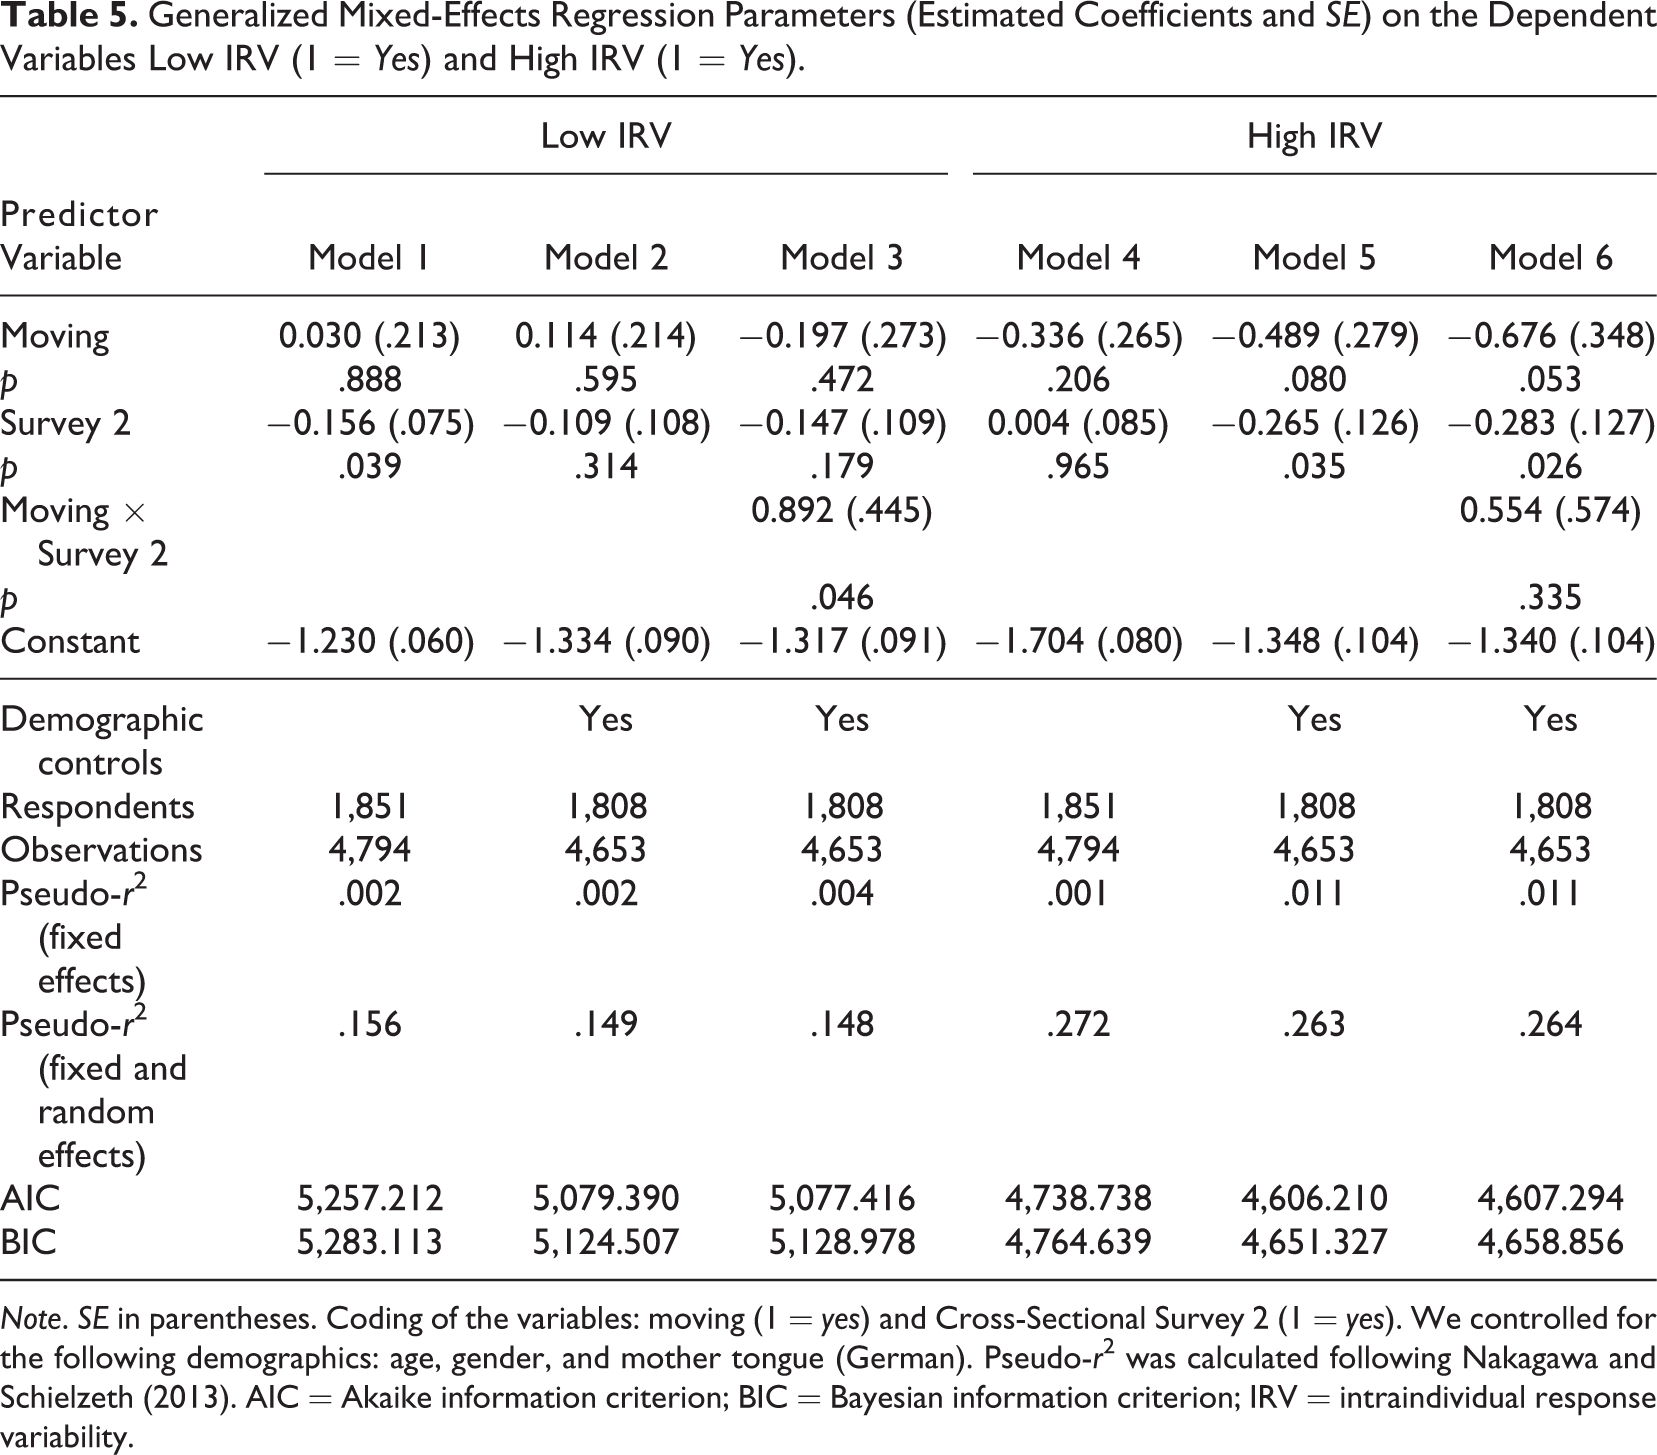
Note. SE in parentheses. Coding of the variables: moving (1 = yes) and Cross-Sectional Survey 2 (1 = yes). We controlled for the following demographics: age, gender, and mother tongue (German). Pseudo-r2 was calculated following Nakagawa and Schielzeth (2013). AIC = Akaike information criterion; BIC = Bayesian information criterion; IRV = intraindividual response variability.
Primacy Effects
In the generalized mixed-effects regressions on primacy effects, we again consider web survey pages with single and item-by-item questions. The results are presented in Table 6. Overall, Models 1 and 2 show only little differences between moving and nonmoving respondents with respect to their tendency to select the first category of a response scale. Primacy effects are more common on survey pages with item-by-item questions (Model 3). In addition, Model 4 indicates a stronger (negative) effect of moving on primacy effects for web survey pages with item-by-item questions (interaction of Moving × Item-by-item), compared to the weak (positive) effect of moving for web survey pages with single questions (conditional main effect of moving). Furthermore, the conditional main effect of moving (while including the interaction term Moving × Cross-Sectional Survey 2) in Model 5 indicates that moving respondents in Cross-Sectional Survey 1 are less likely to exhibit primacy effects, compared to nonmoving respondents.
Generalized Mixed-Effects Regression Parameters (Estimated Coefficients and SE) on the Dependent Variable Primacy (1 = Yes).
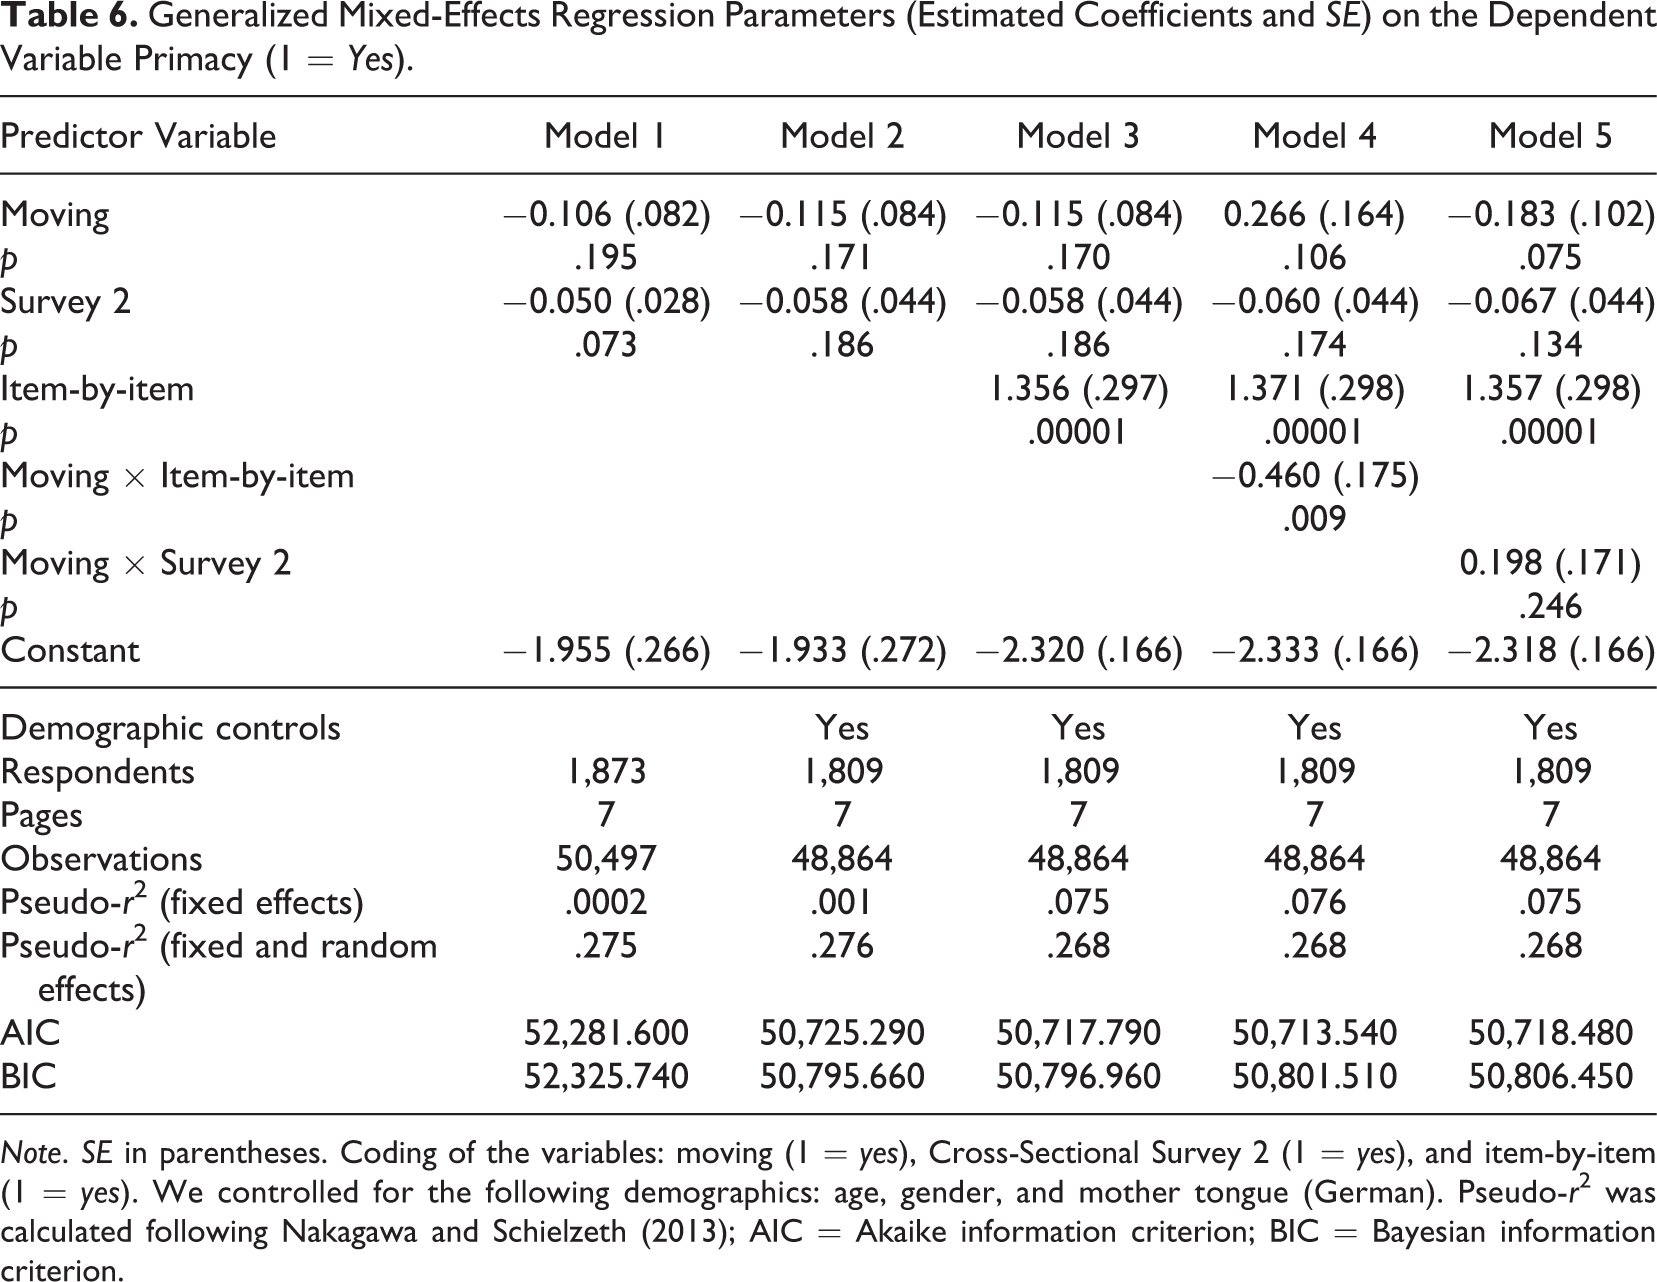
Note. SE in parentheses. Coding of the variables: moving (1 = yes), Cross-Sectional Survey 2 (1 = yes), and item-by-item (1 = yes). We controlled for the following demographics: age, gender, and mother tongue (German). Pseudo-r2 was calculated following Nakagawa and Schielzeth (2013); AIC = Akaike information criterion; BIC = Bayesian information criterion.
IMC
Finally, we conducted a logistic regression investigating the compliance with an IMC of moving and nonmoving respondents. We now focus on one single web survey page. Table 7 reports the results. Models 1 and 2 show that both moving and nonmoving respondents are equally likely to comply with the IMC. However, respondents in Cross-Sectional Survey 2 generally have a lower probability of complying with the IMC. Finally, Model 3 shows no substantial interaction between the predicted motion condition and the data source (Moving × Cross-Sectional Survey 2).
Logistic Regression Parameters (Estimated Coefficients and SE) on the Dependent Variable Compliance With IMC (1 = Yes).
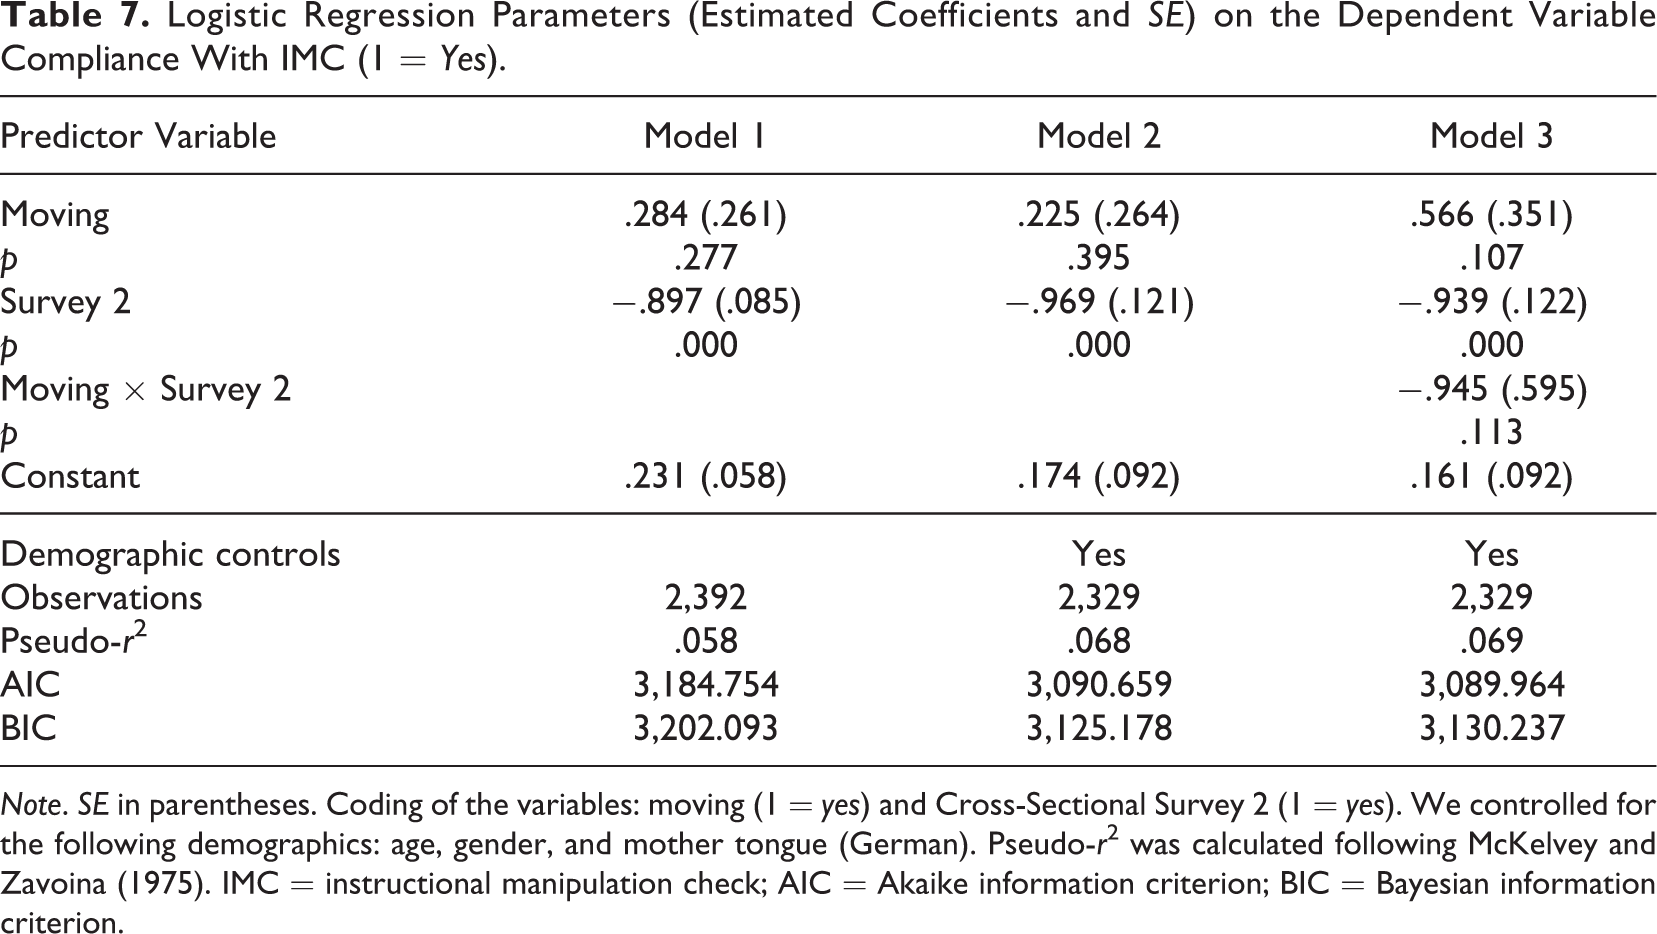
Note. SE in parentheses. Coding of the variables: moving (1 = yes) and Cross-Sectional Survey 2 (1 = yes). We controlled for the following demographics: age, gender, and mother tongue (German). Pseudo-r2 was calculated following McKelvey and Zavoina (1975). IMC = instructional manipulation check; AIC = Akaike information criterion; BIC = Bayesian information criterion.
Discussion and Conclusion
This study aimed at utilizing acceleration data from smartphone sensors to predict motion conditions of smartphone respondents and to study the effects of different motion conditions on superficial responding. Specifically, we built prediction models to classify respondents into two motion conditions (moving and nonmoving) on the survey page level using data from a lab experiment. On this basis, we predicted the motion conditions of respondents in two “real-world” cross-sectional surveys and compared moving and nonmoving respondents with respect to their response behavior.
Regarding our first research question (i.e., how accurately can we predict respondents’ motion conditions in smartphone surveys?), the cross-validation results showed that acceleration data from smartphone sensors can indeed be used to precisely predict motion conditions. We observed strong prediction performance for all methods that were considered (GLMnet, CTREE, RF, and XGBoost), with RF showing the best results over several metrics (accuracy, log loss, and ROC–AUC). The trained RF model is released along with this article and can be used by researchers at their own discretion to predict motion conditions in (new) smartphone surveys.
In order to answer our second research question (i.e., how common are different types of motion conditions in smartphone surveys?), we utilized the RF model to predict motion conditions in two cross-sectional surveys. The results indicated that active movement, such as walking around, during survey completion is a relatively rare phenomenon. On average, we predicted about 4% (Cross-Sectional Survey 1) and about 3% (Cross-Sectional Survey 2) of the respondents were moving while answering the survey questions under investigation, with little variation across survey pages. An important point to note in this context is that the acceleration data from smartphones’ accelerometer are not affected by (steady) movement of a car or train. That is, respondents who are sitting still in a cab or train are likely classified as nonmoving, while entering and exiting a vehicle induces acceleration that would classify respondents as moving. One could argue that this definition of moving is in line with our theoretical arguments since particularly active movement (as opposed to sitting in a train) requires additional cognitive resources and coordinating multiple tasks. Nevertheless, we acknowledge that also passive movement (e.g., riding in a train) can cause distractions that may divert the attention of respondents away from the survey task. Thus, future research could aim at differentiating between these different types of movement, potentially by combining acceleration and GPS data.
To answer our third research question (i.e., how do respondents with different predicted motion conditions differ with respect to response behavior?), we compared respondents with respect to a variety of aspects. First, we observed that completion times are higher for moving respondents than for nonmoving respondents. This was particularly the case for survey pages with item-by-item questions, mirroring the findings of Höhne and Schlosser (2019). This result provides supporting evidence that our lab-trained prediction model indeed identified respondents with different completion conditions in two smartphone surveys that were conducted in a field setting.
Second, in contrast to our expectation, we found only little differences when comparing predicted moving and nonmoving respondents with respect to indicators of superficial responding (i.e., low IRV, high IRV, primacy effects, and compliance with an IMC). Exceptions include a negative effect of moving on high IRV and somewhat weaker primacy effects for moving respondents in Cross-Sectional Survey 1. In combination with the low proportion of predicted movers, our findings indicate that the portability of smartphones does not necessarily seduce respondents to carelessly complete surveys on the move. However, considering the overall low proportion of predicted moving respondents, these findings should be interpreted with caution. Also, we advocate for future research on the relationship between motion conditions and response behavior in smartphone surveys employing further indicators of superficial responding, such as break-offs and item nonresponse (the occurrence of these response behaviors was negligible in both cross-sectional surveys of this study). Ideally, this research would study motion conditions over many web survey pages and with samples that observe a sufficient number of examples for such outcomes.
This study can be extended with respect to the following limitations. First, it is important to note that our prediction models were trained with data from a lab experiment (i.e., motion conditions were varied in a controlled setting) with a rather small sample of university students and by using a between-subject design. This poses the question of generalizability, that is, whether the lab-trained (and cross-validated) RF generalizes to data that is collected in the field. However, while the summary statistics of our acceleration features do show a higher maximum acceleration in the two cross-sectional surveys, we do not observe severe shifts in the distributions of our features between the different data sources (see the descriptive statistics in Tables 1 and 2). Nonetheless, it would be worthwhile to collect further training data using a more heterogeneous sample and a less artificial setting. Second, we only considered a binary outcome as the prediction objective, whereas studying multiple levels of movements (e.g., nonmoving, moving slow, moving fast) might be instructive when comparing response behaviors between motion groups. Note, however, that in our case, refined motion conditions would have resulted in subgroups with even smaller numbers of respondents. Third, predicted motion conditions could be studied from a longitudinal perspective (e.g., by exploring sequences and/or changes of motion conditions during survey completion on the respondent level over time). Relatedly, time dependencies between web survey pages could be considered by, for instance, adding lagged variables that include information about the predicted motion conditions of previous survey pages. Fourth, the cross-sectional surveys in this study measured only a limited number of sociodemographic background variables that could be included when modeling superficial responding. Detailed background information, ideally combined with larger sample sizes, might not only be valuable for extending the set of control variables but also for studying the prevalence of different motion conditions in different sociodemographic subgroups.
This study contributes to web survey research by proposing a prediction approach that enables to study respondents’ motion conditions in smartphone surveys. In addition, it provided insights on the prevalence of different motion conditions in two smartphone surveys and on the effects of motion conditions on response behavior. Our prediction model for identifying moving and nonmoving respondents—in combination with the SMotion tool (Höhne & Schlosser, 2019) for collecting acceleration data—allows future research to analyze respondents’ completion conditions and to extend this study in various ways. This includes, for instance, studying the effects of (various forms and patterns of) active movement on break-offs and superficial responding in larger smartphone surveys. In addition, major health-related surveys, such as the Health and Retirement Study and the Survey of Health, Ageing, and Retirement in Europe, conduct fitness tests, such as balance and walk tests. These tests are overseen by interviewers that monitor respondents’ compliance and performance. The use of smartphone surveys, coupled with the collection of acceleration data and our prediction approach, may allow validating compliance in a self-administered survey setting instead. Documentation and code examples on how the prediction approach and the trained model from this study may be used by future research are provided in the GitHub repository that accompanies this article (https://github.com/chkern/survey-motion). So far, the usage of sensor data, in general, and acceleration data, in particular, in smartphone surveys to explore respondent behavior is still in its infancy. Thus, various research directions exist that could be addressed in the future to shed light on the importance and implications of different completion conditions in smartphone surveys.
Supplemental Material
Supplemental Material, Online_supp - Completion Conditions and Response Behavior in Smartphone Surveys: A Prediction Approach Using Acceleration Data
Supplemental Material, Online_supp for Completion Conditions and Response Behavior in Smartphone Surveys: A Prediction Approach Using Acceleration Data by Christoph Kern, Jan Karem Höhne, Stephan Schlosser and Melanie Revilla in Social Science Computer Review
Footnotes
Data Availability
Data may be accessed on-site at the University of Mannheim by contacting the first author of this article (
Declaration of Conflicting Interests
The authors declared no potential conflicts of interest with respect to the research, authorship, and/or publication of this article.
Funding
The authors disclosed receipt of the following financial support for the research, authorship, and/or publication of this article: We acknowledge financial support by the German Science Foundation through the Collaborative Research Center 884 “Political Economy of Reforms” at the University of Mannheim in Germany for conducting Cross-Sectional Survey 2 (Data Source 3).
Software Information
All data preparations and modeling steps were conducted using R (Version 3.5.1; R Core Team, 2018). The training, tuning, and evaluation infrastructure for building the prediction models was provided by the caret package (Version 6.0-81; Kuhn, 2018), using the glmnet (Version 4.0-2), partykit (Version 1.2-9), ranger (Version 0.12.1) and xgboost (Version 1.2.0.1) packages. The mixed-effects models were fitted with the lme4 package (Version 1.1-19; Bates et al., 2015).
Supplemental Material
The supplemental material is available in the online version of the article.
Notes
References
Supplementary Material
Please find the following supplemental material available below.
For Open Access articles published under a Creative Commons License, all supplemental material carries the same license as the article it is associated with.
For non-Open Access articles published, all supplemental material carries a non-exclusive license, and permission requests for re-use of supplemental material or any part of supplemental material shall be sent directly to the copyright owner as specified in the copyright notice associated with the article.